Embed Size (px)
Citation preview

A GTAP Analysis of the Proposed BRICS Free Trade Agreement
Working Draft
Dr. Sachin Kumar Sharma Dr. Murali Kallummal
Submitted to
15th Annual Conference on Global Economic Analysis “New Challenges for Global Trade and Sustainable
Development”, Geneva, Switzerland
June 27 – 29, 2012
2
Table of Contents
SECTION 1: INTRODUCTION ............................................................................................................... 3 SECTION2: ECONOMIC PROFILE OF BRICS MEMBERS ............................................................. 5 SECTION 3: METHODOLOGY .............................................................................................................. 8
3.1 Aggregation Strategy .......................................................................................................................... 8 3.2 Experiment Design ............................................................................................................................ 10
SECTION 4: SIMULATION RESULTS ................................................................................................ 11 4.1 WELFARE EFFECTS: ..................................................................................................................... 12 4.2 MACROECONOMIC EFFECTS: .................................................................................................... 12 4.3 OUTPUT EFFECT: .......................................................................................................................... 13 4.4 Employment Effect: .......................................................................................................................... 13 4.5 IMPACT ON TRADE ...................................................................................................................... 14
SECTION 5: CONCLUSION .................................................................................................................. 16 REFERENCE ............................................................................................................................................ 18
List of Tables Table 1: Region aggregation in the GTAP Model ........................................................................................ 8 Table 2: Commodity Aggregation in the GTAP model ................................................................................ 9 Table 3: Tariff profile of different regions across different sectors ............................................................ 10 Table 4: Decomposition of Welfare Effect ................................................................................................. 12 Table 5: Change in Macroeconomic indicators .......................................................................................... 13 Table 6: Change in Industrial Output .......................................................................................................... 13 Table 7: Change in Demand for Labor ....................................................................................................... 14
List of Figures
Figure 1: Intra-BRICS Trade (by destination) .............................................................................................. 6 Figure 2: Impact on Trade balance After Simulation ................................................................................. 15 Figure 3: Impact on Trade balance After Simulation (Aggregate Sectors) ................................................. 16
List of Appendix Table
Appendix Table 1: India’s base Protection levels in GTAP database ......................................................... 19 Appendix Table 2: Level of Protection Faced by India in other Regions in GTAP database .................... 20 Appendix Table 3: Sector-wise Changes in Industrial Output ................................................................... 21 Appendix Table 4: Demand for Unskilled Labour .................................................................................... 22 Appendix Table 5: Demand for Skilled Labour ......................................................................................... 23 Appendix Table 6: Sector-wise Changes in Exports .................................................................................. 24 Appendix Table 7: Sector-wise Changes in Imports .................................................................................. 25 Appendix Table 8: Trade balance in Million US $ .................................................................................... 26

3
A GTAP Analysis of the Proposed BRICS Free Trade Agreement:1
Dr. Sachin Kumar Sharma Dr. Murali Kallummal
ABSTRACT
The negotiations for the BRICS FTA have made a significant progress with the four summit level meeting among proposed BRICS FTA. This study used the GTAP model on 57 tradable commodities and nine regions of the world to understand the likely impact of possible BRICS FTA. . In this study, 113 regions given in GTAP data base is mapped to nine regions namely Brazil, Russia, India, China, South Africa, ASEAN, USA, EU and Rest of the World by using GTAP database. This study updates the tariff protection for the nine regions and analyses the possible impacts on various indicators. A scenario of a full FTA between BRICS members is simulated using the GTAP model. Under this scenario, import protection within the BRICS member were removed but maintained between the NonBRICS countries. Overall, the impact of proposed BRICS FTA would be positive for India as macroeconomics indicators (except trade balance) show positive change. However, at the disaggregate level, result vary across 57 sectors.
SECTION 1: INTRODUCTION The world trading system witnessed a drastic change due to proliferation of RTA. Provision for
Regional Trade Agreement (RTA) was built as exception to one of the basic principles of the
WTO i.e. Most Favoured Nation Rule. The structure of RTAs varies widely, but all have one
thing in common-the objective of reducing barriers to trade between member countries. The
proliferation in RTAs around the globe reflects commercial, socio-economic and political
interests. RTAs can be a cornerstone of larger economic and political efforts to increase regional
cooperation beyond the multilateral agenda. They can also stimulate inward foreign direct
investment (Kimura and Ando, 2005) and growth through technological transfers. Their
proliferation can also be motivated by a growing sense that regional agreements elsewhere put
the excluded countries at a disadvantage (Baldwin, 1993). Also the prevailing deadlock in the
Doha round negotiations of the WTO resulted in the proliferation of RTAs (Tumbarello, 2007).
1 We are grateful to Prof Abhijit Das and Sajal Mathur of the Centre for WTO Studies and Devender Pratap, Associate Fellow, National Council of Applied Economic Research (NCEAR) for their valuable comments and suggestions.
4
India has been a staunch supporter of multilateral trading system and always stood for open,
equitable, predictable, non-discriminatory and rule-based trading system. India never used
Regional Trade Agreements like FTAs or PTAs as a trade policy instrument for its economic
engagement till 2000. India started pursuing engagement through RTAs in 2003. It was perhaps
felt that if it did not do so, it will be locked-out of the markets of its important trading partners.
India’s increased engagement in RTAs, be they bilateral, regional or extra-regional in nature, is a break
from the past when she undertook trade liberalisation mostly at the MFN level. India is seen to be seeking
deeper forms of economic integration via comprehensive RTAs as a development strategy to exploit the
potential of “efficiency-seeking” industrial restructuring and strengthen overall competitiveness. India
began negotiating agreements with a view to moving, in some cases, towards Comprehensive
Economic Cooperation Agreements (CECAs) covering FTA in Goods Services, Investment and
other identified areas of economic cooperation. In addition, India also began actively engaging
with regional bock like EU, ASEAN, South Africa Customs Union (SACU) and MERCOSUR.
Thus, India’s RTAs increasingly include deeper and wider commitments in non-goods areas,
which go beyond India’s commitments under the WTO. While the widely acknowledged move
towards regionalism driven by the “Look East” policy announced by the Indian government in
1992 played an important role in leading to the new RTA initiatives in East Asia, the dynamics
of multilateral trade negotiations at the WTO and the proliferation of RTAs initiated by the
ASEAN became important catalysts that accelerated India’s trade policy shift involving RTAs
with other regions. As more and more countries become members of multiple RTAs, the desire
of the Indian government to avoid the perceived negative effects of discrimination and
marginalisation (the domino effect suggested by Baldwin in 1993) has played an important role,
as the country does not want to be excluded from a share in the benefits of belonging to the
RTAs.
In this context, India has a dialogue with Brazil, Russia, China and South Africa for deeper
economic cooperation. With Russia joining the WTO in 2011, all BRICS member countries are
also the member of WTO. Growing engagement between these countries and their combined
strength in global decision making process provides a favourable environment for a possible
FTA. Already, four summit level meetings have been held during 2009-12. The Fourth BRICS
Summit was hosted in New Delhi on 29 March 2012 under the overarching theme of “BRICS
Partnership for Global Stability, Security and Prosperity.” The Summit has imparted further
5
momentum to the BRICS process. The proposed FTA led liberalisation of trade between BRICS
members will have implications in terms of overall welfare, macroeconomic and trade indicators.
These implications can be further traced across sectors by using GTAP model. With this
background, the objective of this study is to examine the effect of possible BRICS FTA on
various sectors as well as on macro-economic and trade indicators by using GTAP model and
database.
SECTION2: ECONOMIC PROFILE OF BRICS MEMBERS This section gives an overview of economic and trade profiles of the BRICS members. To
understand and analyse BRICS as a group, it is necessary to get a sense of how these five
emerging giants spread across four continents are situated in the global context. The BRICS
together account for 26 % of the world’s GDP (PPP) in 2011 and over 40% of the global
population. In terms of land mass, Russia is by far the largest in the grouping (it is also the
largest country in the world). In terms of demographics, China closely followed by India, are the
two most populous nations in the world. Together these two countries account for over one third
of the world’s population.
Over the past two decades, the rate of growth of per capita GDP in the BRICS has outpaced the
global trend line. The investment and savings numbers are impressive. Across the BRICS
members the gross saving and investment rates as a percentage of GDP averaged around 28.8
percentages. In terms of FDI flows, the BRICS as a group accounted for over US $ 300 billion
of FDI or over 20% of global FDI flows. China is a single biggest recipient of FDI followed by
Brazil, Russia and India in that order. Total foreign exchange reserves of all the BRICS together
amounts to US $ 4,025.0 billion or about 37% of global foreign exchange reserves in 2010.
China alone accounts for nearly 75 percentages with close to $ 3 trillion of reserves. All the
BRICS economies run a surplus on the capital account except India which had a small deficit in
2010. The situation in the current account is mixed with only China and Russia running a
surplus. This is also reflected in the balance of trade numbers.
The BRICS as a grouping account for over 40% of the world’s labour force. According to UN
projections, by 2020, the working age population is expected to rise by 240 million in India and
by 20 million in Brazil. China’s demographic projections suggest that the labour force will peak
by 2015 and decline thereafter. A growing population will only yield a demographic dividend if
there is a matching increase in the available jobs. Improvements in total factor productivity are
also critical for growth prospects. On the other hand the unemployment rate is over 20% in

6
South Africa, over 8% in Brazil and Russia and just under 4.5% in India and China. With a large
informal sector and a significant proportion of the work force still underemployed there is an
ever growing need for skill and human resource development. More and better jobs require
investment in education, health, and the soft skills to train the work force for jobs in the 21st
century. The literacy rate in Brazil, China, Russia, and South Africa is 90% or above. In India,
however, the literacy rate is just over 60%.
In 1990, the BRICS as a group accounted for only 3% of global trade. This share had doubled
by the turn of the century. In 2010, the BRICS as a group accounted for 15% of global exports
and 14% of global imports of goods and services. The share of the BRICS in global trade has
increased significantly over the last two decades. The double digit growth in merchandise trade
has catapulted China to the top ranking in exports and it is the second largest importer of
merchandise goods in 2010. Russia and India have also broken into the top 20 list of world
merchandise exporters and importers. Brazil is in the top 20 from the merchandise export side.
The merchandise trade balance is in surplus for China, Russia, and Brazil. India and South
Africa have a merchandise trade deficit.
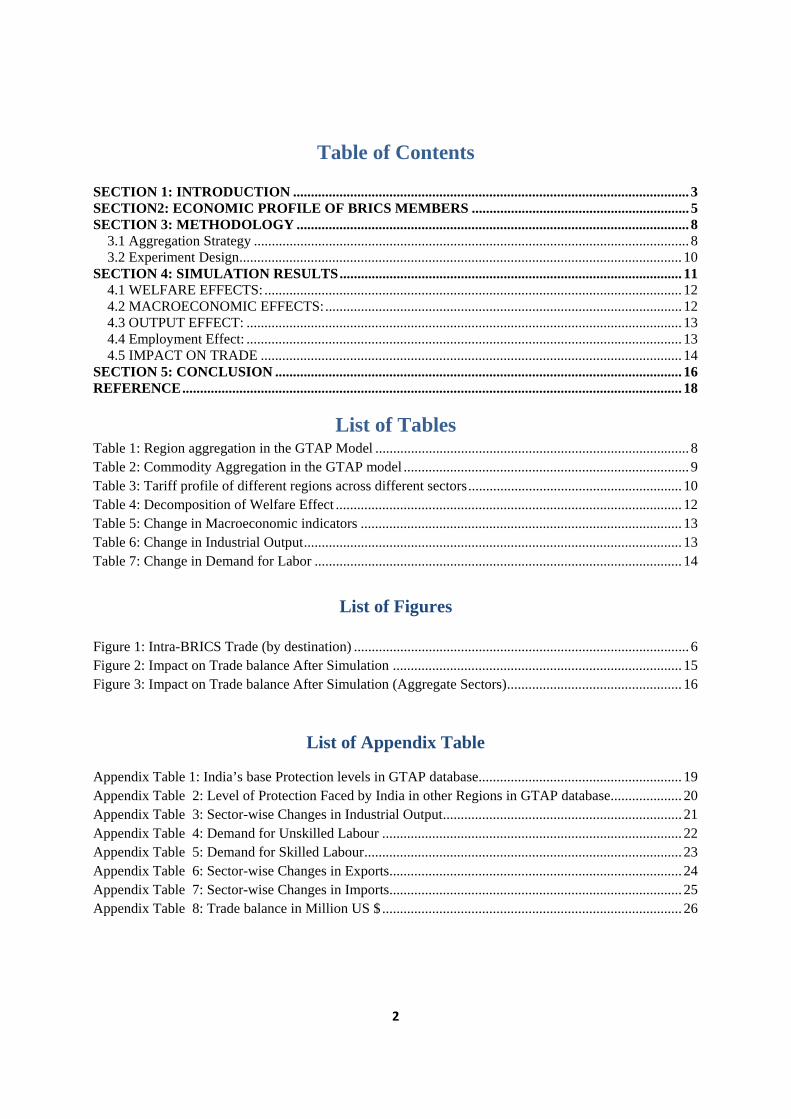
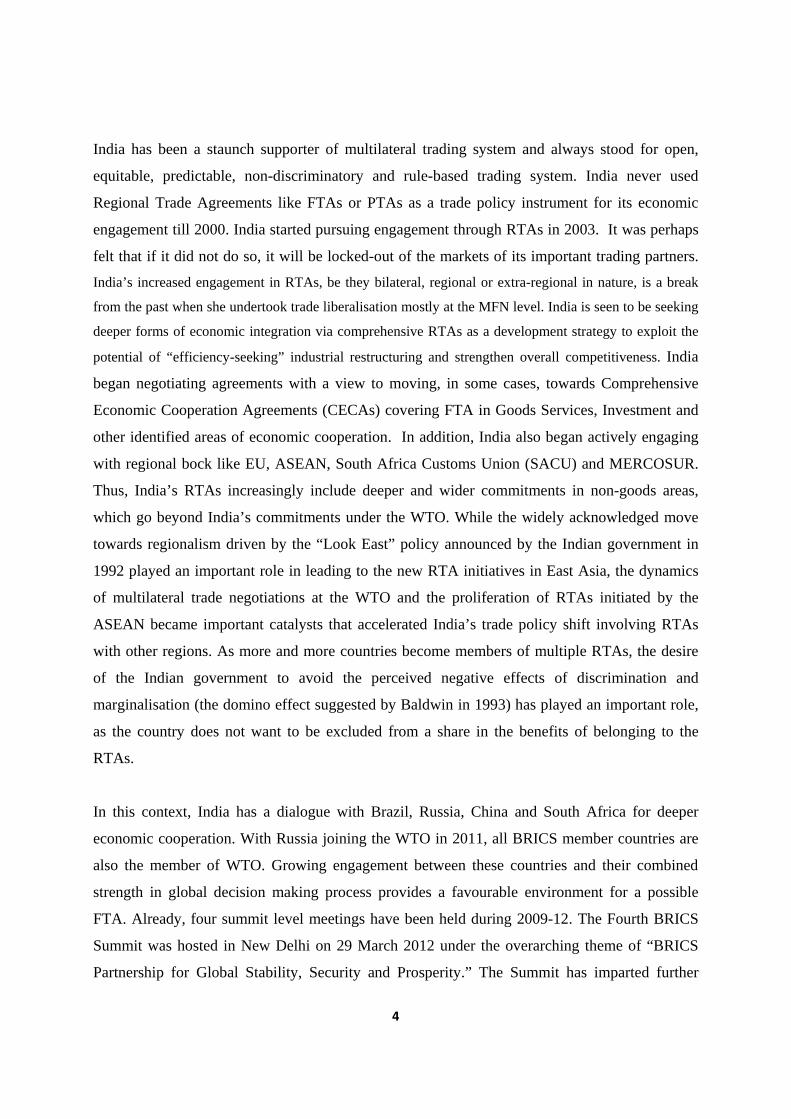
Figure 1: Intra-BRICS Trade (by destination)
(a) Trade between Brazil and rest of the BRICS
(b) Trade between Russia and rest of the BRICS
7
(c) Trade between India and rest of the BRICS
(d) Trade between China and rest of the BRICS
(e) Trade between South Africa and rest of the BRICS
Source: Based on UN Comtrade data
Without exception, China is the largest trade partner for each of the other BRICS with a trade
share ranging between 70 to 80% in intra-BRICS trade. India has a share ranging between 10 to
30% in intra-BRICS trade. Brazil’s trade share is in single digits except with China where its
share is 30%. Russia too has a small slice of the intra-BRICS trade pie in all markets barring
China where its share is 27%. South Africa’s share is the smallest in each of the other BRICS
markets.
8
SECTION 3: METHODOLOGY The impact of possible BRICS FTA on different regions is estimated by using GTAP static
model. This study is conducted with a multi country, general equilibrium closure. The model
assumes perfect competition, constant return to scale and profit and utility maximising behaviour
of firms and household respectively. Hertel (1997) provides detail information about the
structure and overview of GTAP model. The data used in this study is the version 7 of the GTAP
database. The reference year for this database is 2004.
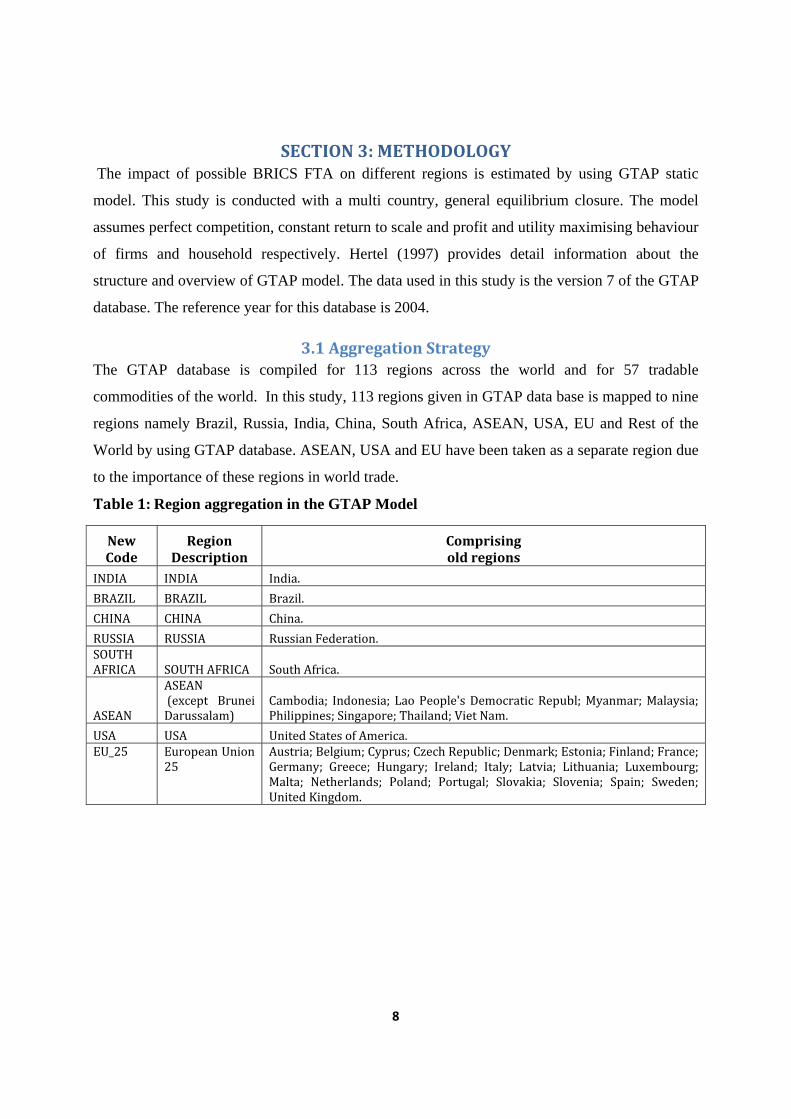
3.1 Aggregation Strategy The GTAP database is compiled for 113 regions across the world and for 57 tradable
commodities of the world. In this study, 113 regions given in GTAP data base is mapped to nine
regions namely Brazil, Russia, India, China, South Africa, ASEAN, USA, EU and Rest of the
World by using GTAP database. ASEAN, USA and EU have been taken as a separate region due
to the importance of these regions in world trade.
Table 1: Region aggregation in the GTAP Model
New Code
Region Description
Comprising old regions
INDIA INDIA India.
BRAZIL BRAZIL Brazil.
CHINA CHINA China.
RUSSIA RUSSIA Russian Federation. SOUTH AFRICA SOUTH AFRICA South Africa.
ASEAN
ASEAN (except Brunei Darussalam)
Cambodia; Indonesia; Lao People's Democratic Republ; Myanmar; Malaysia; Philippines; Singapore; Thailand; Viet Nam.
USA USA United States of America. EU_25 European Union
25 Austria; Belgium; Cyprus; Czech Republic; Denmark; Estonia; Finland; France; Germany; Greece; Hungary; Ireland; Italy; Latvia; Lithuania; Luxembourg; Malta; Netherlands; Poland; Portugal; Slovakia; Slovenia; Spain; Sweden; United Kingdom.
9
Rest of World
Rest of World Australia; New Zealand; Rest of Oceania; Hong Kong; Japan; Korea; Taiwan; Rest of East Asia; Rest of Southeast Asia; Bangladesh; Pakistan; Sri Lanka; Rest of South Asia; Canada; Mexico; Rest of North America; Argentina; Bolivia; Chile; Colombia; Ecuador; Paraguay; Peru; Uruguay; Venezuela; Rest of South America; Costa Rica; Guatemala; Nicaragua; Panama; Rest of Central America; Caribbean; Switzerland; Norway; Rest of EFTA; Albania; Bulgaria; Belarus; Croatia; Romania; Ukraine; Rest of Eastern Europe; Rest of Europe; Kazakhstan; Kyrgyztan; Rest of Former Soviet Union; Armenia; Azerbaijan; Georgia; Iran Islamic Republic of; Turkey; Rest of Western Asia; Egypt; Morocco; Tunisia; Rest of North Africa; Nigeria; Senegal; Rest of Western Africa; Central Africa; South Central Africa; Ethiopia; Madagascar; Malawi; Mauritius; Mozambique; Tanzania; Uganda; Zambia; Zimbabwe; Rest of Eastern Africa; Botswana; Rest of South African Customs .
Source: GTAP 7 database
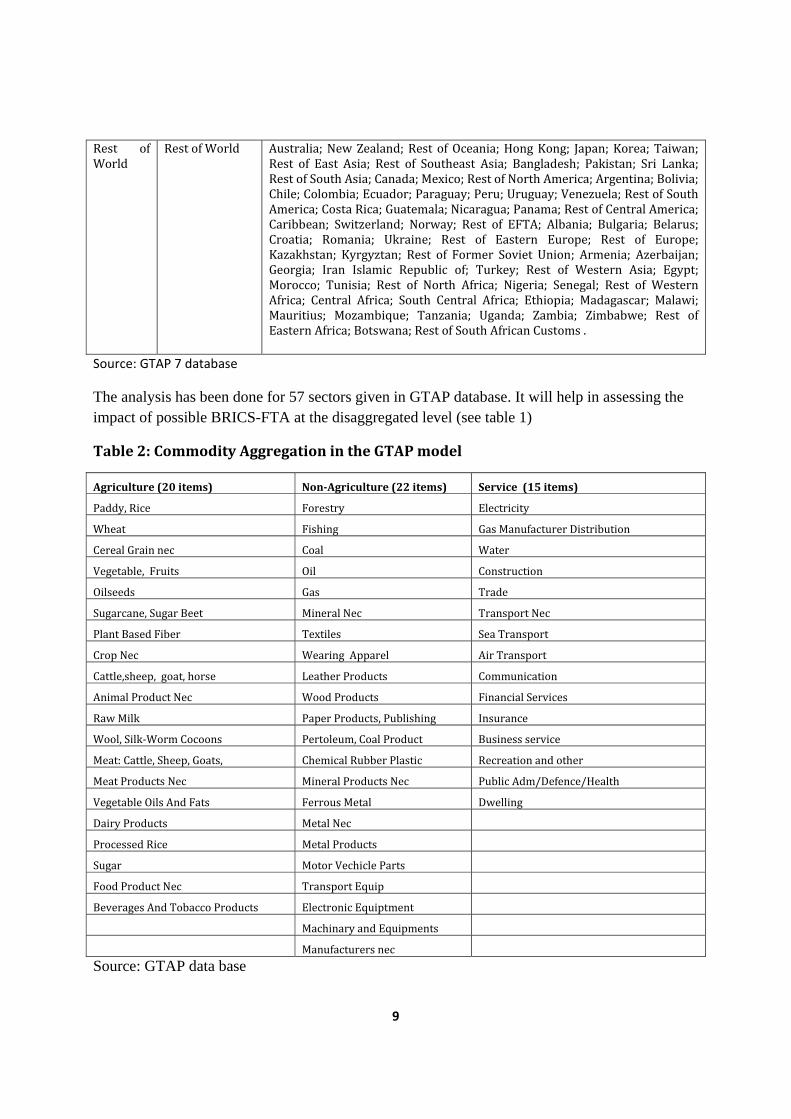
The analysis has been done for 57 sectors given in GTAP database. It will help in assessing the impact of possible BRICS-FTA at the disaggregated level (see table 1)
Table 2: Commodity Aggregation in the GTAP model
Agriculture (20 items) NonAgriculture (22 items) Service (15 items)
Paddy, Rice Forestry Electricity
Wheat Fishing Gas Manufacturer Distribution
Cereal Grain nec Coal Water
Vegetable, Fruits Oil Construction
Oilseeds Gas Trade
Sugarcane, Sugar Beet Mineral Nec Transport Nec
Plant Based Fiber Textiles Sea Transport
Crop Nec Wearing Apparel Air Transport
Cattle,sheep, goat, horse Leather Products Communication
Animal Product Nec Wood Products Financial Services
Raw Milk Paper Products, Publishing Insurance
Wool, Silk‐Worm Cocoons Pertoleum, Coal Product Business service
Meat: Cattle, Sheep, Goats, Chemical Rubber Plastic Recreation and other
Meat Products Nec Mineral Products Nec Public Adm/Defence/Health
Vegetable Oils And Fats Ferrous Metal Dwelling
Dairy Products Metal Nec
Processed Rice Metal Products
Sugar Motor Vechicle Parts
Food Product Nec Transport Equip
Beverages And Tobacco Products Electronic Equiptment
Machinary and Equipments
Manufacturers nec
Source: GTAP data base

10
3.2 Experiment Design Given the unstable economic environment, unemployment is a general phenomenon around the
world. Therefore, to make this study more realistic, standard closure is altered by changing the
assumption of full employment for skilled and unskilled labour. It is to be noted that the
protection data supplied in GTAP is intended to represent a starting point for analysis. Data on
protection is needed to adjust to make analysis more realistic and meaningful for the simulation.
Protection data in GTAP is available for the reference year 2004. In GTAP database the
protection level (See Appendix Tables 1 &2 for India’s protection levels) is different from Table
3 given below. Therefore, the protection information in GTAP database for the BRICS member
is altered to better reflect the reality. The tariff data is extracted from WITS. The possible FTA
among BRICS countries will require substantial reduction in tariff rate for the intra-BRICS trade
and thereby will provide vast market for the member countries. For the year 2009, the tariff
profile of member countries for the goods sector is given in table 1.
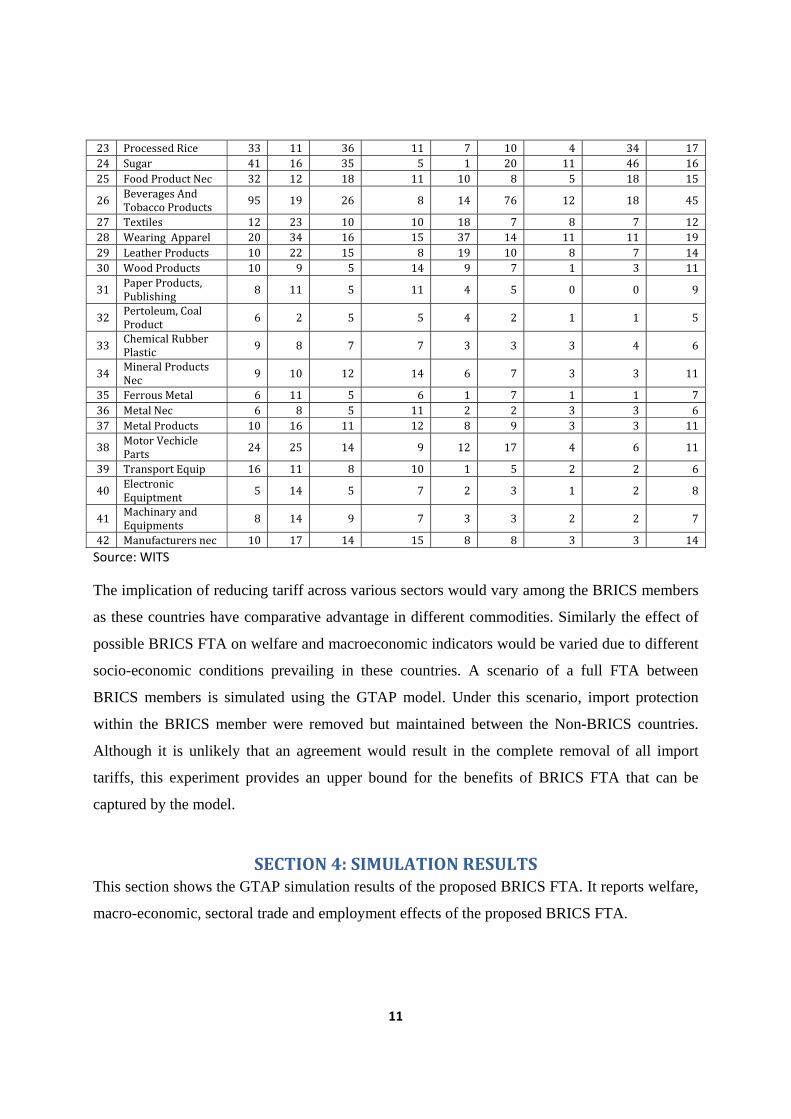
Table 3: Tariff profile of different regions across different sectors
Sectors India
Brazil
China Russian
Federation
South Africa
ASEAN
United States
European Union
ROW GTAP
1 Paddy, Rice 30 8 23 9 6 9 4 22 14 2 Wheat 26 5 11 6 5 8 4 10 11 3 Cereal Grain nec 26 5 11 6 5 8 4 10 11 4 Vegetable, Fruits 31 9 13 9 6 10 4 9 14 5 Oilseeds 26 5 11 6 5 8 4 10 11
6 Sugarcane, Sugar Beet 26 5 11 6 5 8 4 10 11
7 Plant Based Fiber 26 5 11 6 5 8 4 10 11 8 Crop Nec 31 8 13 8 5 9 3 8 13
9 Cattle,sheep, goat, horse 27 2 9 4 0 3 1 15 10
10 Animal Product Nec
24 7 12 6 5 6 1 10 14
11 Raw Milk 32 18 12 13 15 7 19 62 23 12 Wool, Silk‐Worm 24 6 11 6 3 5 1 10 13 13 Forestry 20 5 8 11 4 4 1 2 7 14 Fishing 29 9 11 10 2 5 0 8 11 15 Coal 6 0 1 5 0 2 0 0 4 16 Oil 5 0 2 5 0 2 0 0 5 17 Gas 4 0 2 5 0 2 0 0 5 18 Mineral Nec 5 4 2 5 1 2 0 0 5
19 Meat: Cattle, Sheep, Goats, Horse
31 10 17 5 16 12 3 28 23
20 Meat Products Nec 29 10 16 5 15 11 3 26 21
21 Vegetable Oils And Fats
17 9 11 7 8 4 3 12 11
22 Dairy Products 16 9 11 7 8 4 3 10 11
11
23 Processed Rice 33 11 36 11 7 10 4 34 17 24 Sugar 41 16 35 5 1 20 11 46 16 25 Food Product Nec 32 12 18 11 10 8 5 18 15
26 Beverages And Tobacco Products
95 19 26 8 14 76 12 18 45
27 Textiles 12 23 10 10 18 7 8 7 12 28 Wearing Apparel 20 34 16 15 37 14 11 11 19 29 Leather Products 10 22 15 8 19 10 8 7 14 30 Wood Products 10 9 5 14 9 7 1 3 11
31 Paper Products, Publishing 8 11 5 11 4 5 0 0 9
32 Pertoleum, Coal Product 6 2 5 5 4 2 1 1 5
33 Chemical Rubber Plastic 9 8 7 7 3 3 3 4 6
34 Mineral Products Nec 9 10 12 14 6 7 3 3 11
35 Ferrous Metal 6 11 5 6 1 7 1 1 7 36 Metal Nec 6 8 5 11 2 2 3 3 6 37 Metal Products 10 16 11 12 8 9 3 3 11
38 Motor Vechicle Parts 24 25 14 9 12 17 4 6 11
39 Transport Equip 16 11 8 10 1 5 2 2 6
40 Electronic Equiptment
5 14 5 7 2 3 1 2 8
41 Machinary and Equipments
8 14 9 7 3 3 2 2 7
42 Manufacturers nec 10 17 14 15 8 8 3 3 14
Source: WITS
The implication of reducing tariff across various sectors would vary among the BRICS members
as these countries have comparative advantage in different commodities. Similarly the effect of
possible BRICS FTA on welfare and macroeconomic indicators would be varied due to different
socio-economic conditions prevailing in these countries. A scenario of a full FTA between
BRICS members is simulated using the GTAP model. Under this scenario, import protection
within the BRICS member were removed but maintained between the Non-BRICS countries.
Although it is unlikely that an agreement would result in the complete removal of all import
tariffs, this experiment provides an upper bound for the benefits of BRICS FTA that can be
captured by the model.
SECTION 4: SIMULATION RESULTS This section shows the GTAP simulation results of the proposed BRICS FTA. It reports welfare,
macro-economic, sectoral trade and employment effects of the proposed BRICS FTA.

12
4.1 WELFARE EFFECTS: The net welfare gains from the proposed BRICS FTA are measured by equivalent variation (EV)
in income. The EV measures the amount of income that would have to be given or taken away
from an economy before trade liberalisation so as to leave the economy as well off as it would be
after the policy has been changed. The welfare effects of the simulation for the concerned
regions are given in table 3. In terms of absolute value, highest welfare gain is attained by China,
Brazil, India and Russia whereas South Africa gained least in terms of welfare effect. It is
revealed that Non-BRICS member experienced net welfare loss due to BRICS FTA. The
decomposition of the welfare effects suggest that India’s gain from the proposed FTA is
primarily driven by endowment and allocation effects. BRICS members would experience gain
in allocative efficiency as resources will divert from inefficient sectors to the more efficient
sectors.
Table 4: Decomposition of Welfare Effect
(Million US $)
Region Allocation Endowment Terms of Trade Investment and Saving
Welfare
INDIA 300 1332 ‐6 ‐24 1603
BRAZIL 409 703 770 ‐144 1739
CHINA 473 2617 1293 ‐79 4304
RUSSIA 119 869 593 ‐44 1537
SOUTH AFRICA 335 469 101 3 908
ASEAN ‐64 ‐200 ‐209 49 ‐424
USA ‐1172 ‐1934 ‐641 ‐174 ‐3920
EU_25 ‐3348 ‐2156 ‐1201 100 ‐6604
RoW ‐1625 ‐2328 ‐704 313 ‐4346
Total ‐4572 ‐627 ‐3 1 ‐5203Source: Simulation Result
4.2 MACROECONOMIC EFFECTS: Table 4 presents the impact on some macro-economic variables for the countries under the
consideration. All the members of possible BRICS FTA would experience an increase in GDP
and all the components of GDP from the base run. China and Brazil would be major
beneficiaries in terms of GDP gain whereas South Africa and India would be least beneficiaries.
Non-BRICS regions would experience fall in GDP as well as other component of GDP.
13
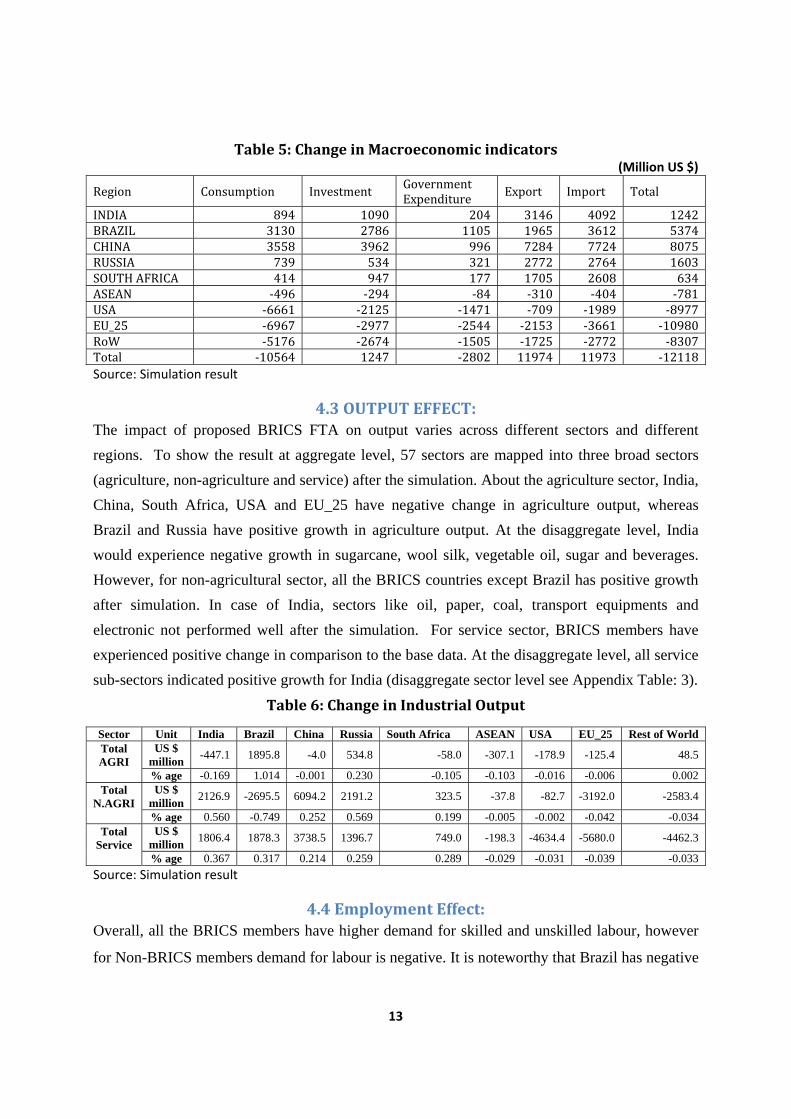
Table 5: Change in Macroeconomic indicators (Million US $)
Region Consumption Investment Government Expenditure Export Import Total
INDIA 894 1090 204 3146 4092 1242BRAZIL 3130 2786 1105 1965 3612 5374CHINA 3558 3962 996 7284 7724 8075RUSSIA 739 534 321 2772 2764 1603SOUTH AFRICA 414 947 177 1705 2608 634ASEAN ‐496 ‐294 ‐84 ‐310 ‐404 ‐781USA ‐6661 ‐2125 ‐1471 ‐709 ‐1989 ‐8977EU_25 ‐6967 ‐2977 ‐2544 ‐2153 ‐3661 ‐10980RoW ‐5176 ‐2674 ‐1505 ‐1725 ‐2772 ‐8307Total ‐10564 1247 ‐2802 11974 11973 ‐12118Source: Simulation result
4.3 OUTPUT EFFECT: The impact of proposed BRICS FTA on output varies across different sectors and different
regions. To show the result at aggregate level, 57 sectors are mapped into three broad sectors
(agriculture, non-agriculture and service) after the simulation. About the agriculture sector, India,
China, South Africa, USA and EU_25 have negative change in agriculture output, whereas
Brazil and Russia have positive growth in agriculture output. At the disaggregate level, India
would experience negative growth in sugarcane, wool silk, vegetable oil, sugar and beverages.
However, for non-agricultural sector, all the BRICS countries except Brazil has positive growth
after simulation. In case of India, sectors like oil, paper, coal, transport equipments and
electronic not performed well after the simulation. For service sector, BRICS members have
experienced positive change in comparison to the base data. At the disaggregate level, all service
sub-sectors indicated positive growth for India (disaggregate sector level see Appendix Table: 3).
Table 6: Change in Industrial Output
Sector Unit India Brazil China Russia South Africa ASEAN USA EU_25 Rest of World Total AGRI
US $ million
-447.1 1895.8 -4.0 534.8 -58.0 -307.1 -178.9 -125.4 48.5
% age -0.169 1.014 -0.001 0.230 -0.105 -0.103 -0.016 -0.006 0.002 Total
N.AGRI
US $ million
2126.9 -2695.5 6094.2 2191.2 323.5 -37.8 -82.7 -3192.0 -2583.4
% age 0.560 -0.749 0.252 0.569 0.199 -0.005 -0.002 -0.042 -0.034 Total
Service
US $ million
1806.4 1878.3 3738.5 1396.7 749.0 -198.3 -4634.4 -5680.0 -4462.3
% age 0.367 0.317 0.214 0.259 0.289 -0.029 -0.031 -0.039 -0.033
Source: Simulation result
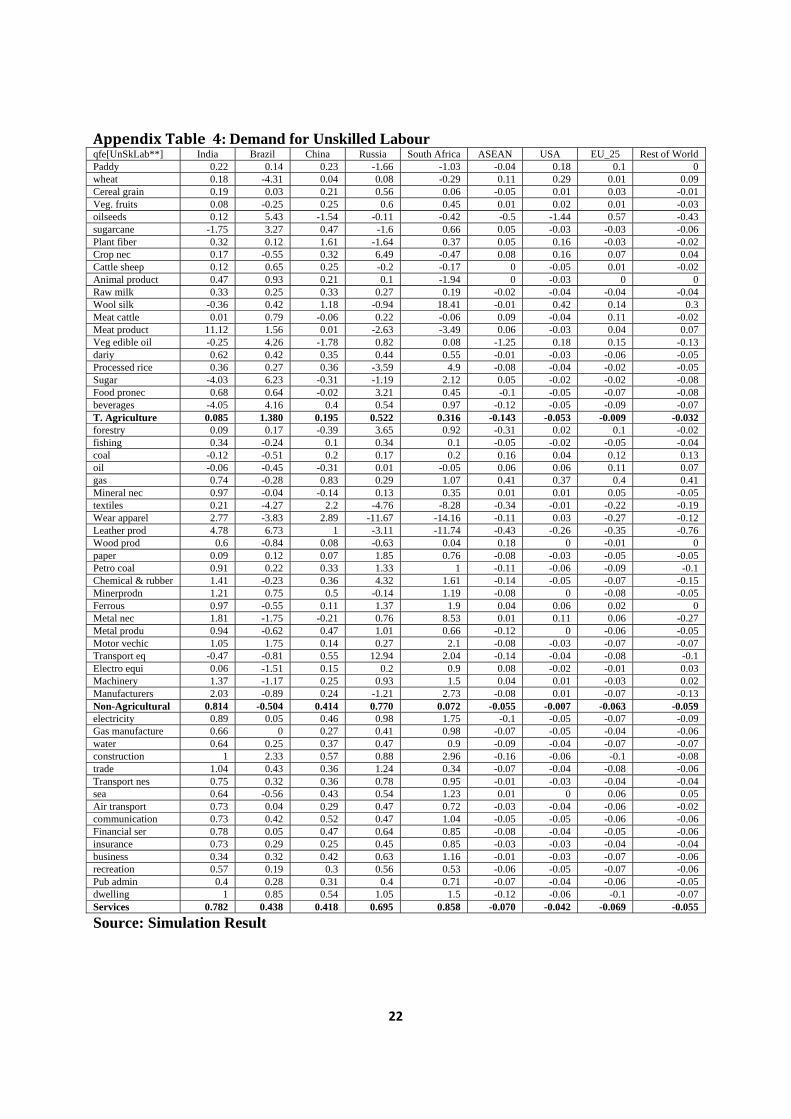
4.4 Employment Effect: Overall, all the BRICS members have higher demand for skilled and unskilled labour, however
for Non-BRICS members demand for labour is negative. It is noteworthy that Brazil has negative

14
demand for labour in non-agriculture sector. For India, demand for labour across all the broad
sectors is positive. At disaggregate level, impact of proposed BRICS FTA is mixed across 57
sectors (disaggregate sector level see Appendix Tables: 4 & 5).
Table 7: Change in Demand for Labor
(Percentage) India Brazil China Russia South Africa ASEAN USA EU_25 Rest of World Un-skilled Total Agri. 0.085 1.380 0.195 0.522 0.316 -0.143 -0.053 -0.009 -0.032 Total N.Agri. 0.814 -0.504 0.414 0.770 0.072 -0.055 -0.007 -0.063 -0.059 T. Services 0.782 0.438 0.418 0.695 0.858 -0.070 -0.042 -0.069 -0.055 All Sectors 0.572 0.317 0.373 0.691 0.633 -0.077 -0.036 -0.064 -0.054 Skilled Total Agri. 0.229 1.706 0.094 1.113 0.443 -0.341 -0.047 -0.035 -0.058 Total N.Agri. 0.870 -0.508 0.456 0.911 0.430 -0.041 -0.009 -0.055 -0.050 T. Services 0.573 0.307 0.364 0.507 0.794 -0.064 -0.039 -0.067 -0.053 All Sectors 0.573 0.307 0.364 0.507 0.794 -0.064 -0.039 -0.067 -0.053
Source: Simulation result
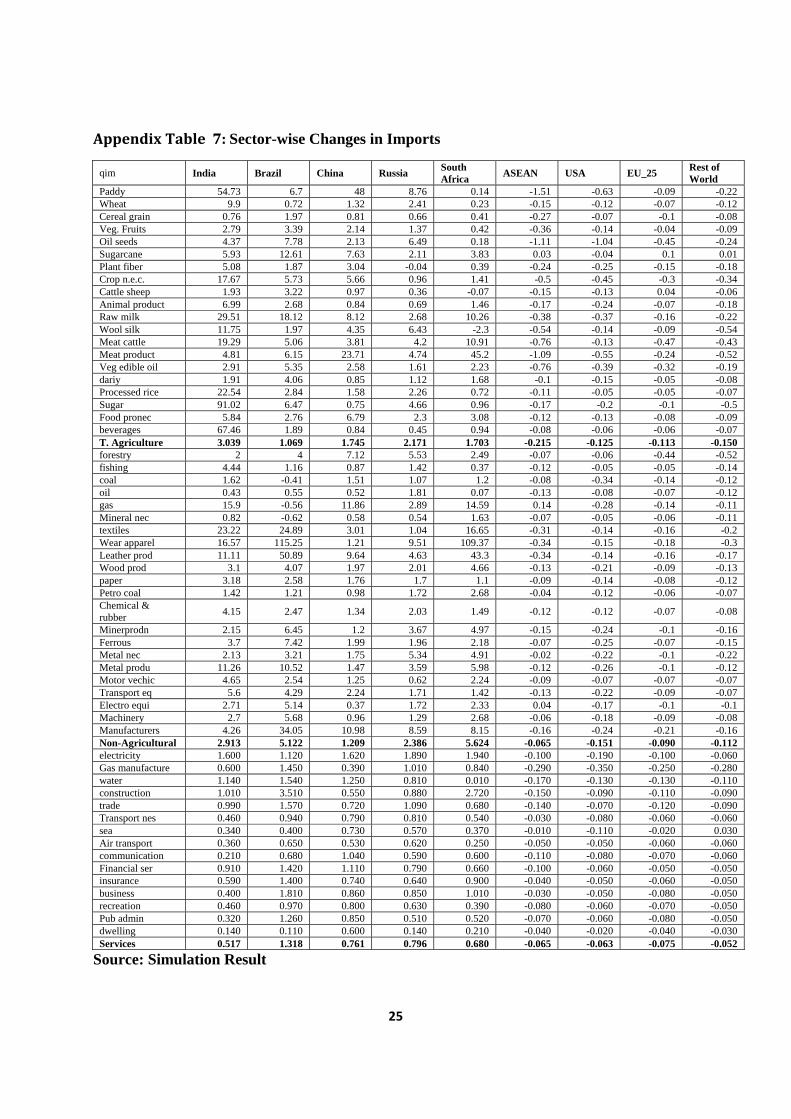
4.5 IMPACT ON TRADE At the aggregate level, all the BRICS members have shown positive sign for exports, whereas
non-BRICS members have negative growth. At broad sub-sector level, India has positive growth
for agriculture and non-agriculture sector; however, it is negative for service sector. In case of
import, all the BRICS members have experienced positive growth across all the broad sub-
sectors, whereas Non-BRICS regions have negative change after the simulation. At the
disaggregate impact of proposed FTA on Export and Import is given in the Appendix Tables 6
and 7.
Table 5: Change in Exports Sector Unit India Brazil China Russia South Africa ASEAN USA EU_25 Rest of World
Total AGRI
US $ million
226.6 1225.8 109.2 -346.4 76.4 -210.1 -125.4 152.8 318.2
% age 1.642 3.049 0.334 -0.356 0.533 -0.268 -0.151 0.046 0.044
Total N.AGRI
US $ million
3016.5 284.2 6434.1 1910.2 1570.8 -15.0 -316.8 -1824.3 -1822.8
% age 21.865 0.707 19.656 1.964 10.963 -0.019 -0.381 -0.545 -0.252
Total Service
US $ million
-75.2 -300.4 -562.1 -206.0 -54.0 131.1 173.3 832.3 617.5
% age -3.375 -7.337 -6.290 -1.292 -0.586 1.438 1.104 1.348 0.523
Source: Simulation Result
15
Table 6: Change in Imports Sector Unit India Brazil China Russia South Africa ASEAN USA EU_25 Rest of World
Total Agri
US $ million
1369.0 129.0 1390.9 471.8 182.7 -153.5 -288.3 -658.4 1369.0
% age 3.039 1.069 1.745 2.171 1.703 -0.215 -0.125 -0.113 3.039
Total N.Agri
US $ million
3113.6 3388.4 6561.9 2081.2 2695.1 -286.5 -2060.6 -2751.5 3113.6
% age 2.913 5.122 1.209 2.386 5.624 -0.065 -0.151 -0.090 2.913
Total Ser.
US $ million
90.9 224.3 453.7 235.8 44.4 -50.4 -143.8 -635.8 90.9
% age 0.517 1.318 0.761 0.796 0.680 -0.065 -0.063 -0.075 0.517
Source: Simulation Result
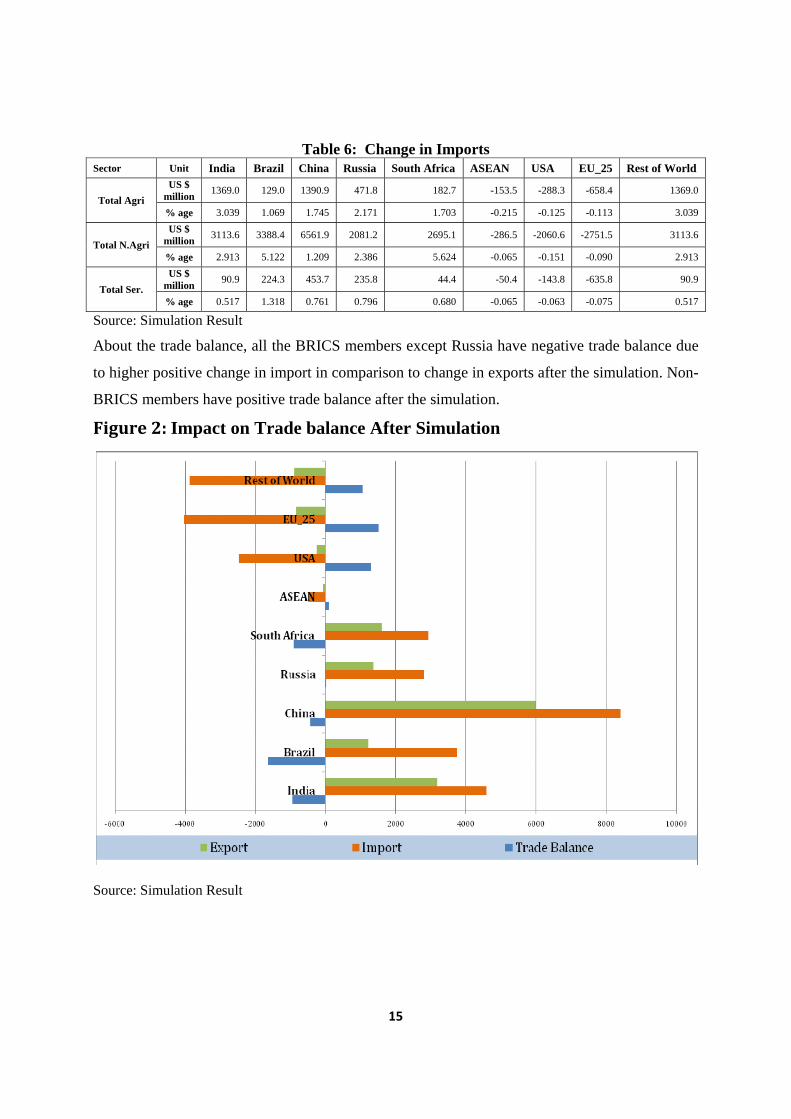
About the trade balance, all the BRICS members except Russia have negative trade balance due
to higher positive change in import in comparison to change in exports after the simulation. Non-
BRICS members have positive trade balance after the simulation.
Figure 2: Impact on Trade balance After Simulation
Source: Simulation Result

16
Figure 3: Impact on Trade balance After Simulation (Aggregate Sectors)
Source: Simulation Result
About broad sector-wise trade balance, India, China and South Africa have negative trade
balance in agriculture sector. Brazil gained maximum in agriculture sector but experienced huge
negative trade balance in non-agriculture sector. Trade balance across three broad sectors for
India and South Africa is negative. At the disaggregate impact of proposed FTA on trade balance
is given in the Appendix Table 8.
SECTION 5: CONCLUSION
This study used the GTAP model on 57 tradable commodities and nine regions of the world to
understand the likely impact of possible BRICS FTA. The data in the GTAP model is available
for 2004. This study updates the tariff protection for the nine regions and analyses the possible
impacts on welfare, macro-economic variables, output, employment and trade indicators. In
terms of absolute value, highest welfare gain is attained by China, Brazil, India and Russia
whereas South Africa gained least in terms of welfare effect. It is revealed that Non-BRICS

17
member experienced net welfare loss due to BRICS FTA. All the members of possible BRICS
FTA would experience an increase in GDP and all the components of GDP from the base run.
China and Brazil would be major beneficiaries in terms of GDP gain whereas South Africa and
India would be least beneficiaries. Non-BRICS regions would experience fall in GDP as well as
other component of GDP. The impact on output varies across different sectors and different
regions, for example, India, China, South Africa, USA and EU_25 has negative change in
agriculture output, whereas Brazil and Russia has positive growth in agriculture output. At the
disaggregate level, India would experience negative growth in sugarcane, wool silk, vegetable
oil, sugar and beverages. All the BRICS members have higher demand for skilled and unskilled
labour, however for Non-BRICS members demand for labour is negative. About the trade
balance, all the BRICS members except Russia have negative trade balance. Non-BRICS
members have positive trade balance after the simulation. Overall, the impact of proposed
BRICS FTA would be positive for India as macroeconomics indicators (except trade balance)
show positive change. However, at the disaggregate level, result vary across 57 sectors.
18
REFERENCE
Ando M., and Kimura F., 2005, “The formation of international production and distribution networks in East Asia”, In Rose A. (eds), International Trade (NBER-East Asia Seminar on Economics, Volume 14). Chicago, IL: University of Chicago Press, 177–213.
Asher, Mukul G and Rahul Sen 2005, “India-East Asia Integration: A win-win for Asia”, Economic & Political Weekly, September.
Baldwin Richard, 1993, “A Domino Theory of Regionalism”, NBER Working Paper No. 4465, Issued in September.
Francis S. and Murali Kallummal, 2011, “Preferential Trading Agreements and Emerging Conflicts between Trade and Industrial Policies: An analysis of India’s recent experience”, Prepared for the UNESCAP ARTNeT Symposium’ Towards a Return of Industrial Policy?, 25-26 July 2011, Bangkok, Thailand
Hertel Thomas W, 1997, Global Trade Analysis: Modelling and Applications, (eds) Cambridge University Press, USA.
Katti Vijaya, Sunitha Raju and Rajan Sudesh Ratna, 2010, “India’s Regional Trade Agreements: Impact on Indian Economy, Indian Institute of Foreign Trade, New Delhi.
Kimura Fukunari, 2006, “International Production and Distribution Networks in East Asia: Eighteen Facts, Mechanics, and Policy Implications”, Asian Economic Policy Review, vol. 1, Issue 2, pp 326–344, December
Pomfreta, R., and Sourdin Patricia, 2009, “Have Asian trade agreements reduced trade costs?”,Journal of Asian Economics, vol 20, Issue 3, May, pp 255-268.
Tumbarello P., 2007, “Are Regional Trade Agreements in Asia Stumbling or Building Blocks? Some Implications for the Mekong-3 Countries”, IMF Working Paper, March.
19
Appendix Tables
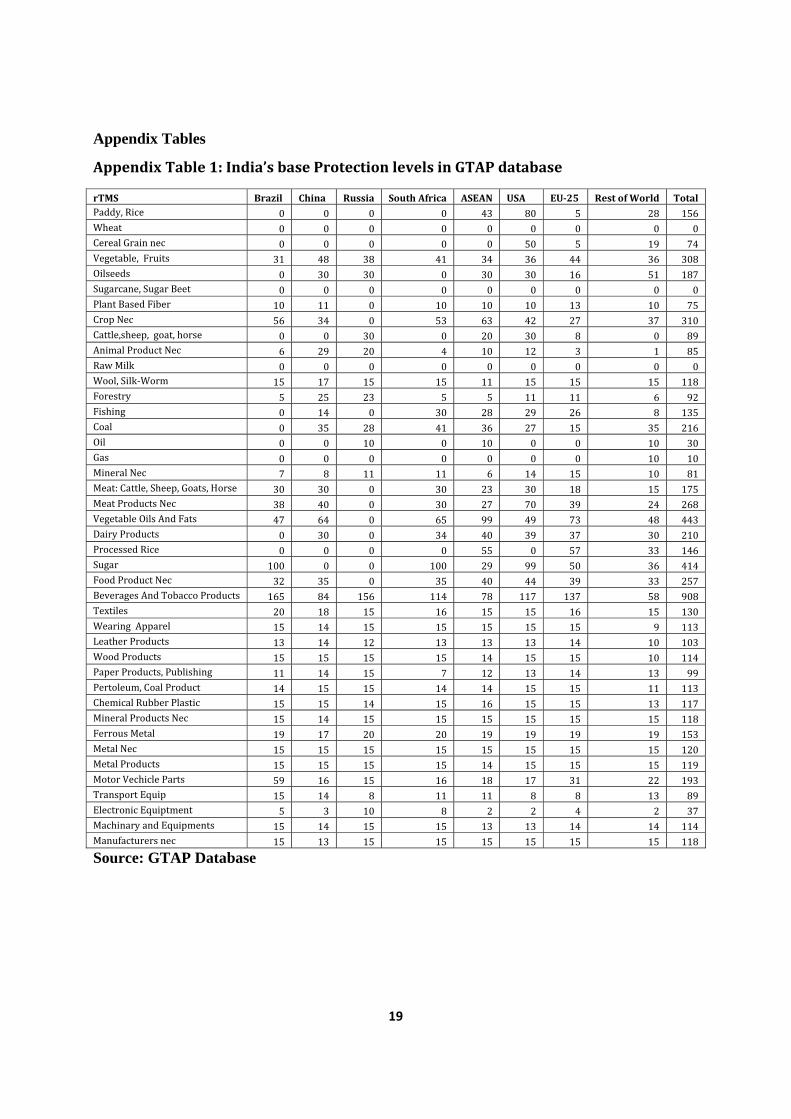
Appendix Table 1: India’s base Protection levels in GTAP database
rTMS Brazil China Russia South Africa ASEAN USA EU25 Rest of World Total Paddy, Rice 0 0 0 0 43 80 5 28 156 Wheat 0 0 0 0 0 0 0 0 0 Cereal Grain nec 0 0 0 0 0 50 5 19 74 Vegetable, Fruits 31 48 38 41 34 36 44 36 308 Oilseeds 0 30 30 0 30 30 16 51 187 Sugarcane, Sugar Beet 0 0 0 0 0 0 0 0 0 Plant Based Fiber 10 11 0 10 10 10 13 10 75 Crop Nec 56 34 0 53 63 42 27 37 310 Cattle,sheep, goat, horse 0 0 30 0 20 30 8 0 89 Animal Product Nec 6 29 20 4 10 12 3 1 85 Raw Milk 0 0 0 0 0 0 0 0 0 Wool, Silk‐Worm 15 17 15 15 11 15 15 15 118 Forestry 5 25 23 5 5 11 11 6 92 Fishing 0 14 0 30 28 29 26 8 135 Coal 0 35 28 41 36 27 15 35 216 Oil 0 0 10 0 10 0 0 10 30 Gas 0 0 0 0 0 0 0 10 10 Mineral Nec 7 8 11 11 6 14 15 10 81 Meat: Cattle, Sheep, Goats, Horse 30 30 0 30 23 30 18 15 175 Meat Products Nec 38 40 0 30 27 70 39 24 268 Vegetable Oils And Fats 47 64 0 65 99 49 73 48 443 Dairy Products 0 30 0 34 40 39 37 30 210 Processed Rice 0 0 0 0 55 0 57 33 146 Sugar 100 0 0 100 29 99 50 36 414 Food Product Nec 32 35 0 35 40 44 39 33 257 Beverages And Tobacco Products 165 84 156 114 78 117 137 58 908 Textiles 20 18 15 16 15 15 16 15 130 Wearing Apparel 15 14 15 15 15 15 15 9 113 Leather Products 13 14 12 13 13 13 14 10 103 Wood Products 15 15 15 15 14 15 15 10 114 Paper Products, Publishing 11 14 15 7 12 13 14 13 99 Pertoleum, Coal Product 14 15 15 14 14 15 15 11 113 Chemical Rubber Plastic 15 15 14 15 16 15 15 13 117 Mineral Products Nec 15 14 15 15 15 15 15 15 118 Ferrous Metal 19 17 20 20 19 19 19 19 153 Metal Nec 15 15 15 15 15 15 15 15 120 Metal Products 15 15 15 15 14 15 15 15 119 Motor Vechicle Parts 59 16 15 16 18 17 31 22 193 Transport Equip 15 14 8 11 11 8 8 13 89 Electronic Equiptment 5 3 10 8 2 2 4 2 37 Machinary and Equipments 15 14 15 15 13 13 14 14 114 Manufacturers nec 15 13 15 15 15 15 15 15 118
Source: GTAP Database

20
Appendix Table 2: Level of Protection Faced by India in other Regions in GTAP database
rTMS Brazil China Russia South Africa ASEAN USA EU-25 Rest of World Total
Paddy, Rice 0 0 0 0 5 5 59 53 122
Wheat 0 0 0 0 2 3 7 5 16
Cereal Grain nec 0 0 0 3 0 1 20 13 38
Vegetable, Fruits 11 5 6 4 1 0 1 11 40
Oilseeds 5 5 5 9 4 24 0 55 107
Sugarcane, Sugar Beet 0 0 0 0 0 0 0 0 0
Plant Based Fiber 0 0 5 4 2 1 0 3 15
Crop Nec 13 8 5 8 12 2 2 12 62
Cattle,sheep, goat, horse 0 0 0 0 0 0 10 9 19
Animal Product Nec 2 9 6 1 3 1 5 3 30
Raw Milk 0 0 0 0 0 0 0 0 0
Wool, Silk-Worm 0 0 0 0 0 2 0 9 12
Forestry 8 12 8 1 4 0 1 14 47
Fishing 8 9 7 0 13 0 3 7 48
Coal 0 0 0 0 1 0 0 11 12
Oil 0 0 0 0 0 0 0 0 1
Gas 0 0 0 0 2 0 0 14 16
Mineral Nec 6 0 5 0 2 0 0 1 14
Meat: Cattle, Sheep, Goats, Horse 0 18 14 20 4 5 254 11 326
Meat Products Nec 17 0 0 0 11 2 18 11 59
Vegetable Oils And Fats 11 7 5 9 3 3 2 4 44
Dairy Products 0 9 8 9 2 7 20 18 74
Processed Rice 16 0 10 0 1 2 109 19 157
Sugar 0 0 0 12 13 6 34 28 93
Food Product Nec 11 12 13 4 15 2 7 8 71
Beverages And Tobacco Products 22 41 49 29 92 11 20 69 331
Textiles 16 7 15 21 10 7 7 10 94
Wearing Apparel 20 19 20 39 10 11 9 12 139
Leather Products 12 9 11 12 4 6 3 7 65
Wood Products 14 6 17 17 6 0 0 8 68
Paper Products, Publishing 13 7 11 5 5 0 0 11 51
Pertoleum, Coal Product 0 5 5 3 3 1 0 8 25
Chemical Rubber Plastic 8 9 10 3 3 2 1 7 43
Mineral Products Nec 12 11 15 5 8 1 1 11 64
Ferrous Metal 12 5 6 4 4 0 0 10 41
Metal Nec 10 8 5 2 3 0 2 4 33
Metal Products 18 10 11 10 7 0 0 12 68
Motor Vechicle Parts 17 15 7 19 23 0 4 15 100
Transport Equip 16 11 9 0 2 0 1 14 53
Electronic Equiptment 14 2 8 6 2 0 1 8 41
Machinary and Equipments 13 7 7 3 3 0 0 7 42
Manufacturers nec 16 11 16 4 1 0 0 2 49
Source: GTAP Database
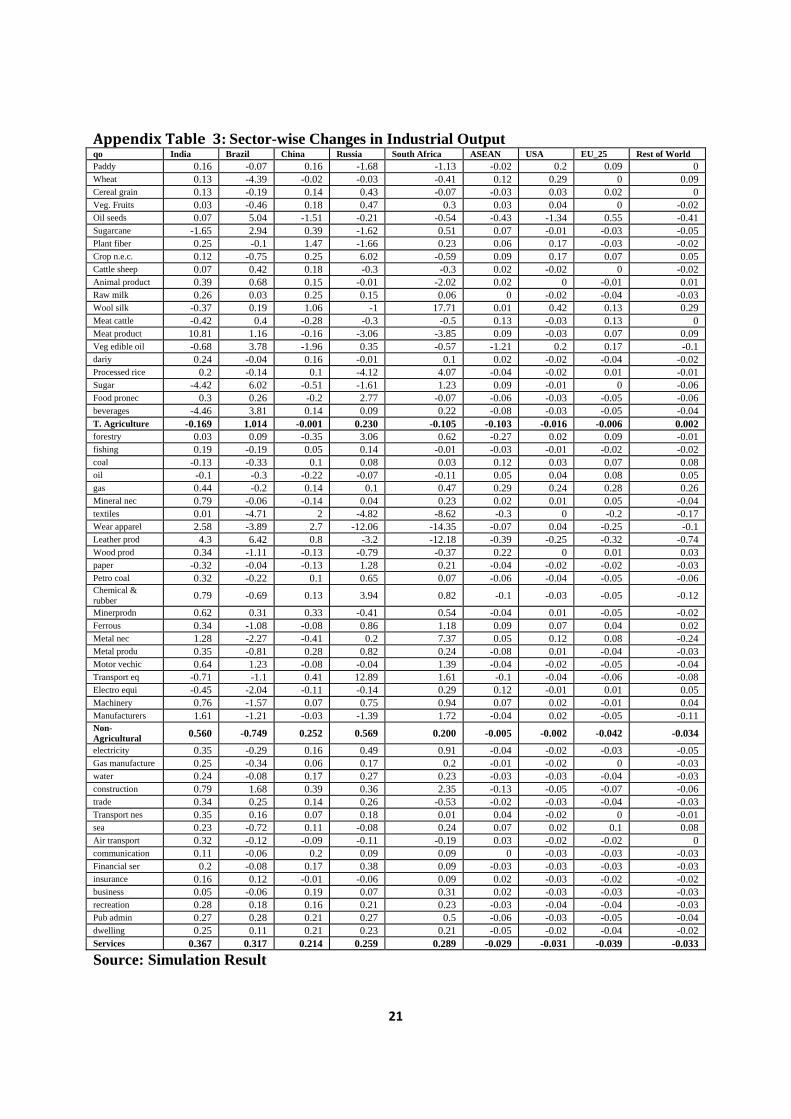
21
Appendix Table 3: Sector-wise Changes in Industrial Output qo India Brazil China Russia South Africa ASEAN USA EU_25 Rest of World Paddy 0.16 -0.07 0.16 -1.68 -1.13 -0.02 0.2 0.09 0 Wheat 0.13 -4.39 -0.02 -0.03 -0.41 0.12 0.29 0 0.09 Cereal grain 0.13 -0.19 0.14 0.43 -0.07 -0.03 0.03 0.02 0 Veg. Fruits 0.03 -0.46 0.18 0.47 0.3 0.03 0.04 0 -0.02 Oil seeds 0.07 5.04 -1.51 -0.21 -0.54 -0.43 -1.34 0.55 -0.41 Sugarcane -1.65 2.94 0.39 -1.62 0.51 0.07 -0.01 -0.03 -0.05 Plant fiber 0.25 -0.1 1.47 -1.66 0.23 0.06 0.17 -0.03 -0.02 Crop n.e.c. 0.12 -0.75 0.25 6.02 -0.59 0.09 0.17 0.07 0.05 Cattle sheep 0.07 0.42 0.18 -0.3 -0.3 0.02 -0.02 0 -0.02 Animal product 0.39 0.68 0.15 -0.01 -2.02 0.02 0 -0.01 0.01 Raw milk 0.26 0.03 0.25 0.15 0.06 0 -0.02 -0.04 -0.03 Wool silk -0.37 0.19 1.06 -1 17.71 0.01 0.42 0.13 0.29 Meat cattle -0.42 0.4 -0.28 -0.3 -0.5 0.13 -0.03 0.13 0 Meat product 10.81 1.16 -0.16 -3.06 -3.85 0.09 -0.03 0.07 0.09 Veg edible oil -0.68 3.78 -1.96 0.35 -0.57 -1.21 0.2 0.17 -0.1 dariy 0.24 -0.04 0.16 -0.01 0.1 0.02 -0.02 -0.04 -0.02 Processed rice 0.2 -0.14 0.1 -4.12 4.07 -0.04 -0.02 0.01 -0.01 Sugar -4.42 6.02 -0.51 -1.61 1.23 0.09 -0.01 0 -0.06 Food pronec 0.3 0.26 -0.2 2.77 -0.07 -0.06 -0.03 -0.05 -0.06 beverages -4.46 3.81 0.14 0.09 0.22 -0.08 -0.03 -0.05 -0.04 T. Agriculture -0.169 1.014 -0.001 0.230 -0.105 -0.103 -0.016 -0.006 0.002 forestry 0.03 0.09 -0.35 3.06 0.62 -0.27 0.02 0.09 -0.01 fishing 0.19 -0.19 0.05 0.14 -0.01 -0.03 -0.01 -0.02 -0.02 coal -0.13 -0.33 0.1 0.08 0.03 0.12 0.03 0.07 0.08 oil -0.1 -0.3 -0.22 -0.07 -0.11 0.05 0.04 0.08 0.05 gas 0.44 -0.2 0.14 0.1 0.47 0.29 0.24 0.28 0.26 Mineral nec 0.79 -0.06 -0.14 0.04 0.23 0.02 0.01 0.05 -0.04 textiles 0.01 -4.71 2 -4.82 -8.62 -0.3 0 -0.2 -0.17 Wear apparel 2.58 -3.89 2.7 -12.06 -14.35 -0.07 0.04 -0.25 -0.1 Leather prod 4.3 6.42 0.8 -3.2 -12.18 -0.39 -0.25 -0.32 -0.74 Wood prod 0.34 -1.11 -0.13 -0.79 -0.37 0.22 0 0.01 0.03 paper -0.32 -0.04 -0.13 1.28 0.21 -0.04 -0.02 -0.02 -0.03 Petro coal 0.32 -0.22 0.1 0.65 0.07 -0.06 -0.04 -0.05 -0.06 Chemical & rubber 0.79 -0.69 0.13 3.94 0.82 -0.1 -0.03 -0.05 -0.12
Minerprodn 0.62 0.31 0.33 -0.41 0.54 -0.04 0.01 -0.05 -0.02 Ferrous 0.34 -1.08 -0.08 0.86 1.18 0.09 0.07 0.04 0.02 Metal nec 1.28 -2.27 -0.41 0.2 7.37 0.05 0.12 0.08 -0.24 Metal produ 0.35 -0.81 0.28 0.82 0.24 -0.08 0.01 -0.04 -0.03 Motor vechic 0.64 1.23 -0.08 -0.04 1.39 -0.04 -0.02 -0.05 -0.04 Transport eq -0.71 -1.1 0.41 12.89 1.61 -0.1 -0.04 -0.06 -0.08 Electro equi -0.45 -2.04 -0.11 -0.14 0.29 0.12 -0.01 0.01 0.05 Machinery 0.76 -1.57 0.07 0.75 0.94 0.07 0.02 -0.01 0.04 Manufacturers 1.61 -1.21 -0.03 -1.39 1.72 -0.04 0.02 -0.05 -0.11 Non-Agricultural 0.560 -0.749 0.252 0.569 0.200 -0.005 -0.002 -0.042 -0.034
electricity 0.35 -0.29 0.16 0.49 0.91 -0.04 -0.02 -0.03 -0.05 Gas manufacture 0.25 -0.34 0.06 0.17 0.2 -0.01 -0.02 0 -0.03 water 0.24 -0.08 0.17 0.27 0.23 -0.03 -0.03 -0.04 -0.03 construction 0.79 1.68 0.39 0.36 2.35 -0.13 -0.05 -0.07 -0.06 trade 0.34 0.25 0.14 0.26 -0.53 -0.02 -0.03 -0.04 -0.03 Transport nes 0.35 0.16 0.07 0.18 0.01 0.04 -0.02 0 -0.01 sea 0.23 -0.72 0.11 -0.08 0.24 0.07 0.02 0.1 0.08 Air transport 0.32 -0.12 -0.09 -0.11 -0.19 0.03 -0.02 -0.02 0 communication 0.11 -0.06 0.2 0.09 0.09 0 -0.03 -0.03 -0.03 Financial ser 0.2 -0.08 0.17 0.38 0.09 -0.03 -0.03 -0.03 -0.03 insurance 0.16 0.12 -0.01 -0.06 0.09 0.02 -0.03 -0.02 -0.02 business 0.05 -0.06 0.19 0.07 0.31 0.02 -0.03 -0.03 -0.03 recreation 0.28 0.18 0.16 0.21 0.23 -0.03 -0.04 -0.04 -0.03 Pub admin 0.27 0.28 0.21 0.27 0.5 -0.06 -0.03 -0.05 -0.04 dwelling 0.25 0.11 0.21 0.23 0.21 -0.05 -0.02 -0.04 -0.02 Services 0.367 0.317 0.214 0.259 0.289 -0.029 -0.031 -0.039 -0.033
Source: Simulation Result
22
Appendix Table 4: Demand for Unskilled Labour qfe[UnSkLab**] India Brazil China Russia South Africa ASEAN USA EU_25 Rest of World Paddy 0.22 0.14 0.23 -1.66 -1.03 -0.04 0.18 0.1 0 wheat 0.18 -4.31 0.04 0.08 -0.29 0.11 0.29 0.01 0.09 Cereal grain 0.19 0.03 0.21 0.56 0.06 -0.05 0.01 0.03 -0.01 Veg. fruits 0.08 -0.25 0.25 0.6 0.45 0.01 0.02 0.01 -0.03 oilseeds 0.12 5.43 -1.54 -0.11 -0.42 -0.5 -1.44 0.57 -0.43 sugarcane -1.75 3.27 0.47 -1.6 0.66 0.05 -0.03 -0.03 -0.06 Plant fiber 0.32 0.12 1.61 -1.64 0.37 0.05 0.16 -0.03 -0.02 Crop nec 0.17 -0.55 0.32 6.49 -0.47 0.08 0.16 0.07 0.04 Cattle sheep 0.12 0.65 0.25 -0.2 -0.17 0 -0.05 0.01 -0.02 Animal product 0.47 0.93 0.21 0.1 -1.94 0 -0.03 0 0 Raw milk 0.33 0.25 0.33 0.27 0.19 -0.02 -0.04 -0.04 -0.04 Wool silk -0.36 0.42 1.18 -0.94 18.41 -0.01 0.42 0.14 0.3 Meat cattle 0.01 0.79 -0.06 0.22 -0.06 0.09 -0.04 0.11 -0.02 Meat product 11.12 1.56 0.01 -2.63 -3.49 0.06 -0.03 0.04 0.07 Veg edible oil -0.25 4.26 -1.78 0.82 0.08 -1.25 0.18 0.15 -0.13 dariy 0.62 0.42 0.35 0.44 0.55 -0.01 -0.03 -0.06 -0.05 Processed rice 0.36 0.27 0.36 -3.59 4.9 -0.08 -0.04 -0.02 -0.05 Sugar -4.03 6.23 -0.31 -1.19 2.12 0.05 -0.02 -0.02 -0.08 Food pronec 0.68 0.64 -0.02 3.21 0.45 -0.1 -0.05 -0.07 -0.08 beverages -4.05 4.16 0.4 0.54 0.97 -0.12 -0.05 -0.09 -0.07 T. Agriculture 0.085 1.380 0.195 0.522 0.316 -0.143 -0.053 -0.009 -0.032 forestry 0.09 0.17 -0.39 3.65 0.92 -0.31 0.02 0.1 -0.02 fishing 0.34 -0.24 0.1 0.34 0.1 -0.05 -0.02 -0.05 -0.04 coal -0.12 -0.51 0.2 0.17 0.2 0.16 0.04 0.12 0.13 oil -0.06 -0.45 -0.31 0.01 -0.05 0.06 0.06 0.11 0.07 gas 0.74 -0.28 0.83 0.29 1.07 0.41 0.37 0.4 0.41 Mineral nec 0.97 -0.04 -0.14 0.13 0.35 0.01 0.01 0.05 -0.05 textiles 0.21 -4.27 2.2 -4.76 -8.28 -0.34 -0.01 -0.22 -0.19 Wear apparel 2.77 -3.83 2.89 -11.67 -14.16 -0.11 0.03 -0.27 -0.12 Leather prod 4.78 6.73 1 -3.11 -11.74 -0.43 -0.26 -0.35 -0.76 Wood prod 0.6 -0.84 0.08 -0.63 0.04 0.18 0 -0.01 0 paper 0.09 0.12 0.07 1.85 0.76 -0.08 -0.03 -0.05 -0.05 Petro coal 0.91 0.22 0.33 1.33 1 -0.11 -0.06 -0.09 -0.1 Chemical & rubber 1.41 -0.23 0.36 4.32 1.61 -0.14 -0.05 -0.07 -0.15 Minerprodn 1.21 0.75 0.5 -0.14 1.19 -0.08 0 -0.08 -0.05 Ferrous 0.97 -0.55 0.11 1.37 1.9 0.04 0.06 0.02 0 Metal nec 1.81 -1.75 -0.21 0.76 8.53 0.01 0.11 0.06 -0.27 Metal produ 0.94 -0.62 0.47 1.01 0.66 -0.12 0 -0.06 -0.05 Motor vechic 1.05 1.75 0.14 0.27 2.1 -0.08 -0.03 -0.07 -0.07 Transport eq -0.47 -0.81 0.55 12.94 2.04 -0.14 -0.04 -0.08 -0.1 Electro equi 0.06 -1.51 0.15 0.2 0.9 0.08 -0.02 -0.01 0.03 Machinery 1.37 -1.17 0.25 0.93 1.5 0.04 0.01 -0.03 0.02 Manufacturers 2.03 -0.89 0.24 -1.21 2.73 -0.08 0.01 -0.07 -0.13 Non-Agricultural 0.814 -0.504 0.414 0.770 0.072 -0.055 -0.007 -0.063 -0.059 electricity 0.89 0.05 0.46 0.98 1.75 -0.1 -0.05 -0.07 -0.09 Gas manufacture 0.66 0 0.27 0.41 0.98 -0.07 -0.05 -0.04 -0.06 water 0.64 0.25 0.37 0.47 0.9 -0.09 -0.04 -0.07 -0.07 construction 1 2.33 0.57 0.88 2.96 -0.16 -0.06 -0.1 -0.08 trade 1.04 0.43 0.36 1.24 0.34 -0.07 -0.04 -0.08 -0.06 Transport nes 0.75 0.32 0.36 0.78 0.95 -0.01 -0.03 -0.04 -0.04 sea 0.64 -0.56 0.43 0.54 1.23 0.01 0 0.06 0.05 Air transport 0.73 0.04 0.29 0.47 0.72 -0.03 -0.04 -0.06 -0.02 communication 0.73 0.42 0.52 0.47 1.04 -0.05 -0.05 -0.06 -0.06 Financial ser 0.78 0.05 0.47 0.64 0.85 -0.08 -0.04 -0.05 -0.06 insurance 0.73 0.29 0.25 0.45 0.85 -0.03 -0.03 -0.04 -0.04 business 0.34 0.32 0.42 0.63 1.16 -0.01 -0.03 -0.07 -0.06 recreation 0.57 0.19 0.3 0.56 0.53 -0.06 -0.05 -0.07 -0.06 Pub admin 0.4 0.28 0.31 0.4 0.71 -0.07 -0.04 -0.06 -0.05 dwelling 1 0.85 0.54 1.05 1.5 -0.12 -0.06 -0.1 -0.07 Services 0.782 0.438 0.418 0.695 0.858 -0.070 -0.042 -0.069 -0.055
Source: Simulation Result

23
Appendix Table 5: Demand for Skilled Labour
qfe[SkLab**] India Brazil China Russia South Africa ASEAN USA EU_25 Rest of World Paddy 0.22 0.14 0.23 ‐1.66 ‐1.03 ‐0.04 0.18 0.1 0 wheat 0.18 ‐4.31 0.04 0.08 ‐0.29 0.11 0.29 0.01 0.09 Cereal grain 0.19 0.03 0.21 0.56 0.06 ‐0.05 0.01 0.03 ‐0.01Veg. fruits 0.08 ‐0.25 0.25 0.6 0.45 0.01 0.02 0.01 ‐0.03 oilseeds 0.12 5.43 ‐1.54 ‐0.11 ‐0.42 ‐0.5 ‐1.44 0.57 ‐0.43sugarcane ‐1.75 3.27 0.47 ‐1.6 0.66 0.05 ‐0.03 ‐0.03 ‐0.06 Plant fiber 0.32 0.12 1.61 ‐1.64 0.37 0.05 0.16 ‐0.03 ‐0.02Crop nec 0.17 ‐0.55 0.32 6.49 ‐0.47 0.08 0.16 0.07 0.04 Cattle sheep 0.12 0.65 0.25 ‐0.2 ‐0.17 0 ‐0.05 0.01 ‐0.02Animal product 0.47 0.93 0.21 0.1 ‐1.94 0 ‐0.03 0 0 Raw milk 0.33 0.25 0.33 0.27 0.19 ‐0.02 ‐0.04 ‐0.04 ‐0.04Wool silk ‐0.36 0.42 1.18 ‐0.94 18.41 ‐0.01 0.42 0.14 0.3 Meat cattle 0.01 0.79 ‐0.06 0.22 ‐0.06 0.09 ‐0.04 0.11 ‐0.02Meat product 11.12 1.56 0.01 ‐2.63 ‐3.49 0.06 ‐0.03 0.04 0.07 Veg edible oil ‐0.25 4.26 ‐1.78 0.82 0.08 ‐1.25 0.18 0.15 ‐0.13dariy 0.62 0.42 0.35 0.44 0.55 ‐0.01 ‐0.03 ‐0.06 ‐0.05 Processed rice 0.36 0.27 0.36 ‐3.59 4.9 ‐0.08 ‐0.04 ‐0.02 ‐0.05Sugar ‐4.03 6.23 ‐0.31 ‐1.19 2.12 0.05 ‐0.02 ‐0.02 ‐0.08 Food pronec 0.68 0.64 ‐0.02 3.21 0.45 ‐0.1 ‐0.05 ‐0.07 ‐0.08beverages ‐4.05 4.16 0.4 0.54 0.97 ‐0.12 ‐0.05 ‐0.09 ‐0.07 T. Agriculture 0.229 1.706 0.094 1.113 0.443 0.341 0.047 0.035 0.058 forestry 0.09 0.17 ‐0.39 3.65 0.92 ‐0.31 0.02 0.1 ‐0.02fishing 0.34 ‐0.24 0.1 0.34 0.1 ‐0.05 ‐0.02 ‐0.05 ‐0.04 coal ‐0.12 ‐0.51 0.2 0.17 0.2 0.16 0.04 0.12 0.13oil ‐0.06 ‐0.45 ‐0.31 0.01 ‐0.05 0.06 0.06 0.11 0.07 gas 0.74 ‐0.28 0.83 0.29 1.07 0.41 0.37 0.4 0.41Mineral nec 0.97 ‐0.04 ‐0.14 0.13 0.35 0.01 0.01 0.05 ‐0.05 textiles 0.21 ‐4.27 2.2 ‐4.76 ‐8.28 ‐0.34 ‐0.01 ‐0.22 ‐0.19Wear apparel 2.77 ‐3.83 2.89 ‐11.67 ‐14.16 ‐0.11 0.03 ‐0.27 ‐0.12 Leather prod 4.78 6.73 1 ‐3.11 ‐11.74 ‐0.43 ‐0.26 ‐0.35 ‐0.76Wood prod 0.6 ‐0.84 0.08 ‐0.63 0.04 0.18 0 ‐0.01 0 paper 0.09 0.12 0.07 1.85 0.76 ‐0.08 ‐0.03 ‐0.05 ‐0.05Petro coal 0.91 0.22 0.33 1.33 1 ‐0.11 ‐0.06 ‐0.09 ‐0.1 Chemical & rubber 1.41 ‐0.23 0.36 4.32 1.61 ‐0.14 ‐0.05 ‐0.07 ‐0.15Minerprodn 1.21 0.75 0.5 ‐0.14 1.19 ‐0.08 0 ‐0.08 ‐0.05 Ferrous 0.97 ‐0.55 0.11 1.37 1.9 0.04 0.06 0.02 0Metal nec 1.81 ‐1.75 ‐0.21 0.76 8.53 0.01 0.11 0.06 ‐0.27 Metal produ 0.94 ‐0.62 0.47 1.01 0.66 ‐0.12 0 ‐0.06 ‐0.05 Motor vechic 1.05 1.75 0.14 0.27 2.1 ‐0.08 ‐0.03 ‐0.07 ‐0.07Transport eq ‐0.47 ‐0.81 0.55 12.94 2.04 ‐0.14 ‐0.04 ‐0.08 ‐0.1 Electro equi 0.06 ‐1.51 0.15 0.2 0.9 0.08 ‐0.02 ‐0.01 0.03Machinery 1.37 ‐1.17 0.25 0.93 1.5 0.04 0.01 ‐0.03 0.02 Manufacturers 2.03 ‐0.89 0.24 ‐1.21 2.73 ‐0.08 0.01 ‐0.07 ‐0.13NonAgricultural 0.870 0.508 0.456 0.911 0.430 0.041 0.009 0.055 0.050 electricity 0.89 0.05 0.46 0.98 1.75 ‐0.1 ‐0.05 ‐0.07 ‐0.09Gas manufacture 0.66 0 0.27 0.41 0.98 ‐0.07 ‐0.05 ‐0.04 ‐0.06 water 0.64 0.25 0.37 0.47 0.9 ‐0.09 ‐0.04 ‐0.07 ‐0.07construction 1.00 2.33 0.57 0.88 2.96 ‐0.16 ‐0.06 ‐0.1 ‐0.08 trade 1.04 0.43 0.36 1.24 0.34 ‐0.07 ‐0.04 ‐0.08 ‐0.06Transport nes 0.75 0.32 0.36 0.78 0.95 ‐0.01 ‐0.03 ‐0.04 ‐0.04 sea 0.64 ‐0.56 0.43 0.54 1.23 0.01 0 0.06 0.05Air transport 0.73 0.04 0.29 0.47 0.72 ‐0.03 ‐0.04 ‐0.06 ‐0.02 communication 0.73 0.42 0.52 0.47 1.04 ‐0.05 ‐0.05 ‐0.06 ‐0.06Financial ser 0.78 0.05 0.47 0.64 0.85 ‐0.08 ‐0.04 ‐0.05 ‐0.06 insurance 0.73 0.29 0.25 0.45 0.85 ‐0.03 ‐0.03 ‐0.04 ‐0.04business 0.34 0.32 0.42 0.63 1.16 ‐0.01 ‐0.03 ‐0.07 ‐0.06 recreation 0.57 0.19 0.3 0.56 0.53 ‐0.06 ‐0.05 ‐0.07 ‐0.06 Pub admin 0.4 0.28 0.31 0.4 0.71 ‐0.07 ‐0.04 ‐0.06 ‐0.05dwelling 1.00 0.85 0.54 1.05 1.50 ‐0.12 ‐0.06 ‐0.10 ‐0.07 Services 0.573 0.307 0.364 0.507 0.794 0.064 0.039 0.067 0.053
Source: Simulation Result

24
Appendix Table 6: Sector-wise Changes in Exports
qxw India Brazil China Russia South Africa
ASEAN USA EU_25 Rest of World
Paddy -0.81 -6.59 -3.99 -0.71 -1.43 0.94 0.48 0.21 1.66 Wheat -0.86 -6.02 -2.86 -3.1 -1.14 0.47 0.39 0.06 0.3 Cereal grain -0.43 -2.76 -0.95 -1.17 -0.48 0.18 0.13 0.1 0.12 Veg. Fruits 0.36 -2.76 1.28 13.74 0.66 0.12 0.16 0.01 -0.06 Oil seeds 2.65 7.22 0.47 2.37 -0.21 0.3 -3.22 1.16 -1.43 Sugarcane 5.13 -3.85 -0.54 2.65 2.77 -0.25 0.21 -0.2 -0.36 Plant fiber 10.58 3.9 2.61 0.08 1.09 0.4 0.53 0.05 0.11 Crop n.e.c. 4.38 -3.94 1.68 9.75 0.6 0.21 0.37 0.14 0.05 Cattle sheep -0.49 -4.96 -1.56 -0.83 -0.4 0.18 0.22 0 0.01 Animal product -0.26 -1.91 -0.26 1.62 0.68 0.13 0.22 0.03 0.09 Raw milk 9.71 1.86 6.14 7.49 11.11 0.12 -0.07 -0.34 -0.31 Wool silk 10.46 1.58 6.65 13.52 32.12 1.22 0.69 0.17 1.34 Meat cattle -1.41 0.18 4.66 7.6 1.72 0.28 -0.34 0.36 -0.12 Meat product 15.85 1.93 -0.11 0.43 1.48 0.74 -0.19 0.17 -0.29 Veg edible oil 2.96 8.27 1.74 -0.59 2.24 -1.8 0.78 0.38 -0.45 dariy -0.86 -5.54 -0.14 -1.33 -0.71 0.14 0.16 -0.01 0.08 Processed rice 0.72 -1.43 0.44 0.28 4.92 -0.12 -0.04 0 -0.09 Sugar 4.9 10.52 -0.76 1.93 5.89 0.3 0.42 0.13 -0.76 Food pronec 2.51 -0.33 0.37 14.75 0.65 -0.15 -0.23 -0.07 -0.25 beverages 2.14 35.55 0 -0.28 0.02 -0.42 -0.02 -0.07 -0.06 T. Agriculture 1.642 3.049 0.334 -0.356 0.533 -0.268 -0.151 0.046 0.044 forestry 0.9 -0.84 2.26 7.14 9.22 -2.2 0.26 0.38 -0.6 fishing -1.18 -0.95 -0.61 -1.27 0.09 0.1 0.04 0 0.04 coal 1.25 0.02 -0.36 -0.42 -0.58 0.19 0.7 0.3 0.1 oil -0.69 1.13 0.91 -0.7 -0.18 0.02 0.16 0.09 0.08 gas -22.01 2.27 0.38 -2.7 -22.03 0.55 1.32 0.41 0.56 Mineral nec 1.02 0.06 0.33 -0.02 0.19 0.05 0.02 0.14 0.02 textiles 4.7 4.6 3.35 4.63 9.85 -0.71 -0.21 -0.39 -0.4 Wear apparel 3.33 3.58 3.63 3.92 8.41 -0.13 0 -1.16 -0.39 Leather prod 8.5 14.17 2.03 11.44 11.12 -0.56 -1.51 -0.8 -2.03 Wood prod -0.03 -2.63 -0.3 -0.92 -0.42 0.27 0.08 0.05 0.1 paper 1.76 0.05 -0.26 5.06 2.4 -0.09 0.02 0.02 -0.07 Petro coal 0.66 -0.85 1.16 0.84 0.12 -0.15 -0.01 -0.07 -0.12 Chemical & rubber 6.53 -0.32 1.89 8.59 4.4 -0.17 -0.12 -0.05 -0.29 Minerprodn 0.9 -1.7 1.14 -0.64 -0.25 -0.01 0.1 -0.08 -0.01 Ferrous 2.56 -0.92 -0.18 0.95 1.57 0.05 0.15 0.08 -0.01 Metal nec 11.19 -2.02 0.98 0.64 7.6 0.03 0.13 0.11 -0.53 Metal produ 3.38 -1.67 0.89 9.99 0.95 -0.2 0.05 -0.1 -0.09 Motor vechic 2.82 2.62 -0.12 -0.29 3.68 -0.06 0.02 -0.05 -0.06 Transport eq 3.91 -2.55 1.99 22.17 2.29 -0.25 -0.13 -0.1 -0.16 Electro equi 5.16 1.64 0 5.75 -0.02 0.12 -0.19 0 0.07 Machinery 6.14 -1.42 0.57 6.23 1.16 0.08 0.07 0 0.07 Manufacturers 3.31 -2.19 0.58 0.89 15.62 -0.1 -0.22 -0.15 -0.45 Non-Agricultural 21.865 0.707 19.656 1.964 10.963 -0.019 -0.381 -0.545 -0.252 electricity 0.46 -3.35 -0.89 -1.92 -0.46 0.13 0.31 0.15 0.07 Gas manufacture -1.36 -3.82 -0.69 -0.84 -1.58 0.34 0.37 0.25 0.2 water -1.32 -3.56 -2.08 -1.04 -1.52 0.29 0.12 0.12 0.12 construction -0.35 -3.35 -0.86 -0.98 -0.51 0.1 0.14 0.05 0.12 trade -1.14 -2.64 -1.16 -1.65 -0.88 0.2 0.11 0.12 0.17 Transport nes -0.39 -1.54 -1.18 -0.57 -0.71 0.22 0.12 0.19 0.18 sea -0.07 -0.95 -0.26 -0.45 -0.28 0.13 0.16 0.12 0.13 Air transport -0.4 -1.43 -0.58 -0.67 -0.46 0.08 0.03 0 0.05 communication -1.43 -3.35 -1.64 -0.96 -0.99 0.15 0.07 0.04 0.03 Financial ser -1.56 -2.84 -1.81 -0.79 -1.53 0.13 0.04 0.03 0.04 insurance -1.42 -2.77 -1.4 -1.26 -1.51 0.14 0.08 0.06 0.05 business -0.22 -3.3 -1.3 -1.36 -1.34 0.1 0.03 0.07 0.02 recreation -0.22 -2.4 -1.13 -0.79 -0.31 0.08 0.02 0.04 0.02 Pub admin -0.31 -2.45 -1.2 -0.41 0.07 0.07 0.06 0.02 0.02 dwelling 0.14 0.11 0.6 0.14 0.21 -0.04 -0.02 -0.04 -0.03 Services -3.375 -7.337 -6.290 -1.292 -0.586 1.438 1.104 1.348 0.523
Source: Simulation Result
25
Appendix Table 7: Sector-wise Changes in Imports
qim India Brazil China Russia South Africa
ASEAN USA EU_25 Rest of World
Paddy 54.73 6.7 48 8.76 0.14 -1.51 -0.63 -0.09 -0.22 Wheat 9.9 0.72 1.32 2.41 0.23 -0.15 -0.12 -0.07 -0.12 Cereal grain 0.76 1.97 0.81 0.66 0.41 -0.27 -0.07 -0.1 -0.08 Veg. Fruits 2.79 3.39 2.14 1.37 0.42 -0.36 -0.14 -0.04 -0.09 Oil seeds 4.37 7.78 2.13 6.49 0.18 -1.11 -1.04 -0.45 -0.24 Sugarcane 5.93 12.61 7.63 2.11 3.83 0.03 -0.04 0.1 0.01 Plant fiber 5.08 1.87 3.04 -0.04 0.39 -0.24 -0.25 -0.15 -0.18 Crop n.e.c. 17.67 5.73 5.66 0.96 1.41 -0.5 -0.45 -0.3 -0.34 Cattle sheep 1.93 3.22 0.97 0.36 -0.07 -0.15 -0.13 0.04 -0.06 Animal product 6.99 2.68 0.84 0.69 1.46 -0.17 -0.24 -0.07 -0.18 Raw milk 29.51 18.12 8.12 2.68 10.26 -0.38 -0.37 -0.16 -0.22 Wool silk 11.75 1.97 4.35 6.43 -2.3 -0.54 -0.14 -0.09 -0.54 Meat cattle 19.29 5.06 3.81 4.2 10.91 -0.76 -0.13 -0.47 -0.43 Meat product 4.81 6.15 23.71 4.74 45.2 -1.09 -0.55 -0.24 -0.52 Veg edible oil 2.91 5.35 2.58 1.61 2.23 -0.76 -0.39 -0.32 -0.19 dariy 1.91 4.06 0.85 1.12 1.68 -0.1 -0.15 -0.05 -0.08 Processed rice 22.54 2.84 1.58 2.26 0.72 -0.11 -0.05 -0.05 -0.07 Sugar 91.02 6.47 0.75 4.66 0.96 -0.17 -0.2 -0.1 -0.5 Food pronec 5.84 2.76 6.79 2.3 3.08 -0.12 -0.13 -0.08 -0.09 beverages 67.46 1.89 0.84 0.45 0.94 -0.08 -0.06 -0.06 -0.07 T. Agriculture 3.039 1.069 1.745 2.171 1.703 -0.215 -0.125 -0.113 -0.150 forestry 2 4 7.12 5.53 2.49 -0.07 -0.06 -0.44 -0.52 fishing 4.44 1.16 0.87 1.42 0.37 -0.12 -0.05 -0.05 -0.14 coal 1.62 -0.41 1.51 1.07 1.2 -0.08 -0.34 -0.14 -0.12 oil 0.43 0.55 0.52 1.81 0.07 -0.13 -0.08 -0.07 -0.12 gas 15.9 -0.56 11.86 2.89 14.59 0.14 -0.28 -0.14 -0.11 Mineral nec 0.82 -0.62 0.58 0.54 1.63 -0.07 -0.05 -0.06 -0.11 textiles 23.22 24.89 3.01 1.04 16.65 -0.31 -0.14 -0.16 -0.2 Wear apparel 16.57 115.25 1.21 9.51 109.37 -0.34 -0.15 -0.18 -0.3 Leather prod 11.11 50.89 9.64 4.63 43.3 -0.34 -0.14 -0.16 -0.17 Wood prod 3.1 4.07 1.97 2.01 4.66 -0.13 -0.21 -0.09 -0.13 paper 3.18 2.58 1.76 1.7 1.1 -0.09 -0.14 -0.08 -0.12 Petro coal 1.42 1.21 0.98 1.72 2.68 -0.04 -0.12 -0.06 -0.07 Chemical & rubber
4.15 2.47 1.34 2.03 1.49 -0.12 -0.12 -0.07 -0.08
Minerprodn 2.15 6.45 1.2 3.67 4.97 -0.15 -0.24 -0.1 -0.16 Ferrous 3.7 7.42 1.99 1.96 2.18 -0.07 -0.25 -0.07 -0.15 Metal nec 2.13 3.21 1.75 5.34 4.91 -0.02 -0.22 -0.1 -0.22 Metal produ 11.26 10.52 1.47 3.59 5.98 -0.12 -0.26 -0.1 -0.12 Motor vechic 4.65 2.54 1.25 0.62 2.24 -0.09 -0.07 -0.07 -0.07 Transport eq 5.6 4.29 2.24 1.71 1.42 -0.13 -0.22 -0.09 -0.07 Electro equi 2.71 5.14 0.37 1.72 2.33 0.04 -0.17 -0.1 -0.1 Machinery 2.7 5.68 0.96 1.29 2.68 -0.06 -0.18 -0.09 -0.08 Manufacturers 4.26 34.05 10.98 8.59 8.15 -0.16 -0.24 -0.21 -0.16 Non-Agricultural 2.913 5.122 1.209 2.386 5.624 -0.065 -0.151 -0.090 -0.112 electricity 1.600 1.120 1.620 1.890 1.940 -0.100 -0.190 -0.100 -0.060 Gas manufacture 0.600 1.450 0.390 1.010 0.840 -0.290 -0.350 -0.250 -0.280 water 1.140 1.540 1.250 0.810 0.010 -0.170 -0.130 -0.130 -0.110 construction 1.010 3.510 0.550 0.880 2.720 -0.150 -0.090 -0.110 -0.090 trade 0.990 1.570 0.720 1.090 0.680 -0.140 -0.070 -0.120 -0.090 Transport nes 0.460 0.940 0.790 0.810 0.540 -0.030 -0.080 -0.060 -0.060 sea 0.340 0.400 0.730 0.570 0.370 -0.010 -0.110 -0.020 0.030 Air transport 0.360 0.650 0.530 0.620 0.250 -0.050 -0.050 -0.060 -0.060 communication 0.210 0.680 1.040 0.590 0.600 -0.110 -0.080 -0.070 -0.060 Financial ser 0.910 1.420 1.110 0.790 0.660 -0.100 -0.060 -0.050 -0.050 insurance 0.590 1.400 0.740 0.640 0.900 -0.040 -0.050 -0.060 -0.050 business 0.400 1.810 0.860 0.850 1.010 -0.030 -0.050 -0.080 -0.050 recreation 0.460 0.970 0.800 0.630 0.390 -0.080 -0.060 -0.070 -0.050 Pub admin 0.320 1.260 0.850 0.510 0.520 -0.070 -0.060 -0.080 -0.050 dwelling 0.140 0.110 0.600 0.140 0.210 -0.040 -0.020 -0.040 -0.030 Services 0.517 1.318 0.761 0.796 0.680 -0.065 -0.063 -0.075 -0.052
Source: Simulation Result

26
Appendix Table 8: Trade balance in Million US $ India Brazil China Russia South
Africa ASEAN USA EU_25 Rest of World
Paddy -1.2 -6.2 -7.7 -0.2 0.0 2.9 3.2 0.7 8.6 wheat -3.6 -23.8 -20.4 -22.0 -0.8 2.9 22.1 5.7 39.7 Cereal grain -0.6 -15.9 -4.3 -2.3 -0.9 1.2 4.6 4.9 14.5 Veg. fruits -31.3 -23.5 25.8 -22.1 15.7 5.9 18.9 11.0 -8.3 oilseeds 8.4 460.1 -191.2 -3.7 -0.1 17.5 -246.7 25.0 -84.4 sugarcane 0.4 0.0 -0.2 0.0 0.1 0.0 0.0 -0.1 -0.1 Plant fiber 13.0 17.5 -74.6 0.2 0.5 3.8 18.7 2.0 12.5 Crop nec -0.6 -114.7 4.8 -12.8 -3.7 10.9 29.6 56.4 31.9 Cattle sheep -0.1 -0.9 -1.6 -0.1 0.0 0.5 1.9 -1.1 1.4 Animal product -5.2 -4.4 -12.6 0.3 -0.3 1.7 5.5 4.4 10.8 Raw milk -0.1 -0.2 -0.7 1.4 -0.1 0.0 0.1 -0.2 -0.3 Wool silk -22.8 0.2 -38.3 0.3 31.3 0.1 0.2 0.7 25.9 Meat cattle -7.3 32.7 -26.1 -62.9 -11.1 3.8 0.9 59.2 13.6 Meat product 1.0 130.4 -71.9 -102.0 -84.2 12.2 -4.2 61.6 56.7 Veg edible oil -80.7 385.1 -114.1 -12.1 -9.8 -213.8 26.3 61.1 -36.1 dariy -1.7 -10.8 -4.1 -16.2 -2.5 3.7 5.7 8.0 18.3 Processed rice 8.6 -4.1 1.6 -3.9 -1.0 -8.0 -0.8 0.5 6.1 Sugar -299.8 346.4 -2.0 -64.1 15.5 4.6 2.1 8.5 -23.8 Food pronec 38.9 -9.2 -257.6 364.7 -13.7 -24.2 -12.9 -11.4 -84.2 beverages -283.8 292.6 -2.2 -7.2 -0.5 -6.8 7.0 -20.0 0.2 T. Agriculture -668.6 1451.2 -797.0 35.4 -65.8 -180.9 -117.8 276.9 3.0 forestry -10.7 -0.5 -194.7 203.3 7.5 -33.5 3.6 24.0 -10.8 fishing -1.3 -0.9 -5.1 -2.2 0.3 0.9 1.5 4.1 4.3 coal -29.0 3.2 -7.2 -12.2 -9.1 13.5 20.3 3.4 16.5 oil -119.7 -6.1 -177.6 -284.0 -7.3 27.2 31.3 -55.1 597.5 gas -0.5 0.7 0.5 -419.6 0.0 81.5 7.3 -91.6 425.5 Mineral nec 1.5 61.0 -114.3 2.0 3.0 0.9 -0.4 30.5 7.2 textiles -162.5 -332.4 1087.9 -24.4 -210.9 -70.2 17.7 -183.1 -230.8 Wear apparel 175.6 -323.2 1984.7 -506.4 -860.9 -19.1 76.6 -464.4 -157.8 Leather prod 162.8 318.9 298.7 -54.8 -237.6 -51.8 -9.4 -216.7 -256.9 Wood prod -10.0 -87.0 -96.3 -61.0 -32.0 34.5 96.7 87.6 89.3 paper -49.0 -1.7 -200.9 90.4 18.8 -2.4 29.9 74.8 25.4 Petro coal -10.2 -58.5 -42.1 171.7 -8.2 -16.6 13.3 -12.6 -47.6 Chemical & rubber
163.3 -422.4 -304.9 984.8 121.6 -58.0 -52.9 -37.4 -563.7
Minerprodn -4.8 -60.2 109.1 -86.4 -38.0 3.3 39.7 -7.6 42.3 Ferrous -36.0 -75.3 -395.1 144.8 87.7 4.9 54.8 126.1 66.7 Metal nec -67.7 -118.2 -232.0 58.8 668.8 1.1 63.1 117.6 -494.5 Metal produ -52.5 -135.0 159.0 10.2 -52.3 -3.3 73.1 -21.2 13.5 Motor vechic -14.1 191.1 -211.3 -57.1 -41.7 9.7 172.1 -11.8 -44.8 Transport eq -151.8 -247.4 86.7 428.7 -16.5 3.1 -27.7 -25.6 -53.2 Electro equi -148.2 -415.9 -140.4 -114.2 -96.9 127.6 73.0 277.4 430.0 Machinery -72.3 -766.7 -388.8 27.8 -164.2 72.1 405.9 313.2 532.4 Manufacturers 302.5 -180.4 -30.4 -153.5 114.3 -5.1 56.5 23.3 -137.0 Non-Agricultural
-134.5 -2656.9 1185.6 346.6 -753.9 120.2 1146.1 -45.0 253.6
electricity -1.18 -19.51 -4.74 -17.89 -9.88 0.18 5.79 35.75 11.46 Gas manufacture 0 -0.31 -0.95 -16.61 -0.01 2.04 2.05 6.48 7.32 water -0.15 -0.62 -2.09 -0.67 -0.59 0.32 0.58 1.91 1.31 construction -8.44 -1.77 -17.17 -38.6 -0.85 4.74 5.73 31.35 25.01 trade -11.45 -35.12 -315.42 -38.21 -15.03 30.66 27.91 173.03 183.55 Transport nes -9.48 -19.89 -124.74 -60.73 -13.29 34.19 59.27 263.43 195.39 sea -6.87 -19.17 -0.88 -11.13 -1.54 18.05 16.1 143.05 106.48 Air transport -2.05 -16.08 -30.11 -26.56 -6.18 9.87 18.87 34.93 51.12 communication -12.72 -8.7 -20.93 -9.23 -3.36 4.49 8.42 30.21 11.82 Financial ser -24.03 -19.4 -19.35 -12.42 -6.11 6.04 7.43 49.7 18.1 insurance -10.71 -16.76 -37.59 -8.82 -7.67 4.96 22.86 31.87 21.85 business -47.14 -231.11 -134.65 -101.24 -11.35 26.1 35.48 374.56 89.06 recreation -2.82 -12.42 -50.97 -15.29 -4.97 7.41 3.35 51.25 24.44 Pub admin -5 -39.01 -69.66 -16.07 -3.27 5.29 37.55 47.19 42.96 dwelling 0 0 0 0 0 0 0 0 0 Services -142.04 -439.87 -829.25 -373.47 -84.1 154.34 251.39 1274.71 789.87
Source: Simulation Result