Embed Size (px)
Citation preview
A Governance Study of Corporate Ownership in the Insurance Industry
ABSTRACT
This study focuses on family control and ownership patterns in the U.S. insurance industry. Conflicting theories argue that family firms perform worse due to nepotism and weak risk-bearing attributes (Agency theory) or that family firms perform better because the unity of ownership and control reduce agency expenses (Stewardship theory). Our findings support the Stewardship view of the firm. Our findings also demonstrate that CEO-Chairperson duality improves performance but that the combination of family and duality is sub-optimal. We further study implications of institutional investor and insider ownership, compensation structure, and leverage on performance.
I. INTRODUCTION AND HYPOTHESIS DEVELOPMENT
The focus of this governance study is on ownership patterns of the US insurance industry,
which is characterized by a high proportion of family controlled firms.1 Specifically, we examine
the implication of family and institutional ownership patterns on firm performance. Many firm
characteristics have been studied as part of the corporate governance structure but the resulting
large literature is often inconsistent regarding the implication of a particular characteristic for
firm performance. An important recent advancement in the governance literature starts with a
summary of the existing studies regarding governance and performance that laments the absence
of “a well-developed theory about the complex, multidimensional nature of corporate
governance or a conceptual basis for selecting the governance characteristics to include in an
empirical study” (Larcker et al., 2007). While they do not develop a theory to fill the identified
need, Larcker and his coauthors classify the set of 39 commonly considered corporate
governance characteristics to seven areas of focus.2 Each of the focus areas has a separate rich
literature with conflicting evidence of a performance impact. We consider the potential impact of
1 More than 37% of the firms in our sample are identified as family controlled and the average family ownership in those controlled firms is 40%. By comparison, Yeh et al. (2001) justified a study of Taiwanese ownership because it is, “a country where family control is prevalent… average control by the largest family is 26%”.2 The 39 variables considered by Larcker et al. (2007) fall into seven common categories of study in the corporate governance literature (parenthetical has the number of variables in a category): board characteristics (21), stock ownership (4), institutional investor variables (3), debt (2), compensation (2), activist variables (2), and anti-takeover (5). We consider the first five categories in this study.
1
five of these seven common corporate governance characteristics (board, stock ownership,
institutional ownership, compensation, and debt); the other two are not considered because
insurance regulatory rules limit their application (e.g., anti-takeover provisions) or because
information on the topic is not available for the firms studied (activist shareholders). Despite the
breadth of their governance study, the field evolves so rapidly that the Larcker study cannot be
considered exhaustive. We build on the Larcker study by focusing on corporate ownership
concentrations.
The ownership pattern of firms is important and current because the increasing
concentration of wealth in the U.S. is contributing to a reversal of a decades-long trend toward
corporate ownership dispersion; a study by Holderness et al. (1999) shows that publicly listed
firms are increasingly closely held and often family controlled, reversing a trend observed almost
a century ago by Berle and Means (1932).3
The family-performance literature often describes a family firm as relatively small, cost
inefficient, and low performing as a result of nepotism and weak risk-bearing attributes
(Habbershon and Williams 1999). “To the extent that top executives are selected and rewarded
on the basis of family ties rather than professional expertise or managerial proficiency
(Fukuyama 1995), that family members are compensated, monitored, and disciplined differently
than nonfamily members (Schulze et al. 2001), and that family firms are less likely to use stock
options to compensate top managers over concerns of diluting family control, then family firms
are less likely to attract top quality external managers than their counterparts in managerial and
alliance governed firms” (Carney 2005, p. 256). Other studies argue that the coincidence of
3 For a discussion of wealth concentration, see Saez, and Zucman (2015). “Our new wealth distribution series reveal {that} ... wealth inequality appears to have followed a U-shaped evolution since 1913, with a marked increase since the 1980s.” These observations are also consistent with international evidence from Canada, Germany, and Taiwan (La Porta et al. 1998; Klein et al. 2005; Lehmann and Weigand 2000; Yeh et al. 2001).
2
ownership and control reduces agency problems (Alchian and Demsetz, 1972; Klein et al.,
2005). Klein et al. argue that “the family-owned firm may be better viewed from the vantage
point of Stewardship theory, which sees the role of the board as providing service and advice
rather than monitoring and control.”
Stewardship theory posits that the utility of some managers is linked with the
organization; they are committed to its success even at personal sacrifice (Davis 2005). These
attitudes are observed in businesses controlled by individuals or combinations of family
members where manager-owner distinctions are blurred (Klein et al. 2005).4 Corbetta and
Salvato (2004) observe that the governance-performance relationship is an open question when
ownership is concentrated in the hands of families. Hypothesis 1 of this paper tests for this
coincidence of principal and agent interests in the case of a family controlled firm.
Hypothesis 1: Consistent with stewardship theory, family controlled firms experience improved firm performance.
In addition to firm-specific family ownership influences, we focus on two aspects of
institutional investor influences. In the agency theory context, external monitors counter
managerial incentives to expropriate firm value for personal gain. Institutional investors, large
shareholders of the firm, can become monitors of management with the goal of increasing firm
value and, implicitly, protecting minority shareholder rights (Pound 1991; Black 1992).
However, empirical support for the monitoring argument is not strong; investments by large
investors tend to be persistent over time providing support for management rather than posing a
threat in the face of poor performance, and corporate expenses, such as CEO compensation, tend
to be higher in the presence of blockholder involvement (Mehran 1995). Cornett et al. (2007),
finding a weak relationship between blockholder investment and firm performance, note that 4 Additional efficiency benefits may be possible because family firms tend toward a structure where relationships – the use of social capital – make it less acceptable for the family to divert company resources into firm value-destroying activities (Anderson and Reeb 2003).
3
blockholders improve performance only in cases where there is no prior business relationship
(“pressure-insensitive”). However, they note a trend in prior literature which associates positive
firm performance with the presence of large shareholders.
Hypothesis 2: Firm performance is positively associated with levels of institutional investor (blockholder) ownership.
The behavior of institutional investors gives rise to another ownership pattern that is only
recently being studied. Individuals who invest with mutual funds or institutional investors are
less interested in the performance of particular firms than in the aggregate performance of a
grouping of firms represented in the fund portfolio. The large concentration of wealth held in
these funds gives limited opportunities for the funds to concentrate on particular firms. Instead
they diversify their holdings and hope that the sectors will perform well. A question raised is
whether the fund managers do more than hope for sector performance. A hypothesized
noncompetitive market effect associated with ownership of corporate competitors by a
diversified institutional investor is found by Azur et al. (2015). They determine that airline ticket
prices on select routes were 10 percent higher due to common ownership by a specific
institutional investor. The authors argue that this diversified institutional owner of the majority of
the firms in an industry focuses on industry performance as opposed to firm specific
performance. However, due to the ability to devote resources toward research and expertise in
choosing investments, it is also possible that institutional investors may invest in firms expected
to outperform others in their industry. We construct Hypothesis 3 to consider the possibility of an
institutional investor-industry effect with a focus on the Azur-identified investor.
Hypothesis 3: Firm performance is positively associated with an ownership stake by large institutional investors.
A final ownership feature we consider is managerial ownership – typically measured by
the fraction of the firm's shares held by its directors and officers as a group. Larger managerial
4
ownership percentages align the interests of managers and outside shareholders. Because
managers have better information than other shareholders and because shareholders cannot
always establish whether the managers’ actions increase firm value, the optimal contract for
managers involves compensation that is sensitive to changes in firm value (Fahlenbrach and
Stulz 2009). A positive hypothesized relationship with firm performance is taken as evidence of
the alignment of manager and owner interests.
Hypothesis 4: Firm performance is positively associated with Director and Officer (D&O) ownership.
The discussion to this point centers on ownership issues. We turn now to the other
governance and control influences described by Larcker et al. (2007). Of the 39 factors tested by
the Larcker and other governance studies, 29 variables describe the board (e.g., board size,
number of board meetings, insider chairman, etc.). Later studies expand the board characteristic
descriptions – notable are gender and racial diversity, which were not part of the Larker study.
These characteristics lead to conflicting results and most are not found to have predictive impact
on performance.5
Duality is often considered a less effective managerial structure because it removes a
potential check on managerial excess (Cordeiro and Veliyath 2003; Nourayi and Mintz 2008). In
this view, the CEO-Chairperson duality is expected to have a negative effect on firm
performance; empirical results do not consistently support this hypothesis. Anderson and Reeb
(2003) provide empirical evidence consistent with a stewardship assumption – a positive
duality/performance relationship – but they do not distinguish between CEO-Chairpersons who
are and who are not also significant shareholders. Related to this joint role, Zahra (2005) notes
that owner-managers will act as stewards for their firms in order to preserve firm and personal
5 The overall R-square of the regressions in Larcker et al (2007) is 2 percent.
5
wealth, achieve long-term goals, and preserve the legacy of their own work.6
Empirical studies that seek to evaluate the relative performance of an agency versus
stewardship governance structure have mixed results. We suggest the result variation is
attributable to the construction of a stewardship proxy. Stewardship studies typically identify
steward firms as those with a coincidence of owner-manager incentives as demonstrated by a
coincidence of operational (Presidential) and policy (Board Chairmanship) authority and
discretion in one person (Donaldson and Davis, 1991). The studies typically ignore the
possibility that the CEO-Chairperson is also a controlling owner. In an agency firm, the “duality”
is considered bad governance because the Board is supposed to be an owner’s check on excesses
by management, including the CEO (Demb and Neubauer, 1992). The empirical evidence is
mixed. Some studies find duality associated with lower firm performance and describe the results
as Agency-consistent (Berg and Smith, 1978; Rechner and Dalton, 1991); others find that the
duality structure yields better corporate performance and describe the result as Stewardship-
consistent (Donaldson and Davis, 1991; Finkelstein and D'Aveni, 1994; Anderson and Reeb,
2003); and some find no relationship (Chaganti et al. 1985; Molz, 1988).
Regardless of the duality status of a firm, a shareholder with a controlling interest in a
firm is able to exert influence over both operational and policy decisions. We believe part of the
inconsistency in prior empirical results regarding duality and stewardship theory is attributed to
insufficient recognition of family-shareholder control relationships in the stewardship/duality
studies.7 Controlling for both family control and duality relationships, we better isolate the
duality effect. While a CEO with duality may act as a steward for some firms, we expect that
family firms do not experience further benefit with a duality governance structure. We therefore 6 While not a focus of this study, Zahra (2005) also suggests the managers of these firms may be willing to take on greater short-term risk through new innovations in order to achieve long-term performance goals.7 A duality governance structure is common to both family and non-family firms within our sample. Nearly 54% of insurers in our sample have a duality governance structure with little variation between family and non-family firms.
6
test two relationships in Hypothesis 5.
Hypothesis 5a: Firm performance is positively associated with duality.
Hypothesis 5b: Firm performance is negatively or not significantly associated with the coincidence of family control and duality.
A classic agency prescription is that CEO compensation should be used to align the
interests of the owners and of the CEO. If effective, higher compensation (an agency cost) will
be associated with higher firm performance. Governance critics observe that because the CEO
influences the selection of board members, in practice the board does not structure the CEO’s
compensation package to maximize value for outside shareholders. But evidence suggests that
boards of directors do a poor job of structuring compensation; “firms with weaker governance
structures have greater agency problems; that CEOs at firms with greater agency problems
extract greater compensation; and that firms with greater problems perform worse” (Core et al.
1999, p 373). Higher overall compensation may also create a disincentive for the manager to take
more risk and seek higher returns. Core et al. (1999) find a negative association between CEO
compensation and future firm performance. A more recent study agrees: “despite the increased
use of option-based compensation during the 1990s, concerns regarding its efficacy abound.”
(Gillan 2006).
Reporting changes in 2006 for the SEC Definitive (DEF) 14A allow a fuller assessment
of forward-looking incentive compensation.8 Such compensation should induce managers to
make decisions that positively influence future firm performance, and thus their own personal
wealth. This effect is enhanced by a tax system where current compensation is taxed more
heavily than the capital gains which may be associated with some forward looking compensation
such as restricted performance shares. We expect a negative relationship between performance
8 In particular, compensation reporting requirements since 2006 are consistent across firms and specifically report salary, bonus, stock, option, and other forms of compensation for firm executives.
7
and current CEO compensation and a positive relationship between performance and the portion
of compensation that is dependent on future firm performance.
Hypothesis 6: Firm performance is positively associated with Forward Compensation but negatively associated with total Current Compensation.
The final governance variable we consider is firm leverage. Jensen and Meckling (1976)
argue that debt constrains managerial expropriation by imposing fixed obligations on corporate
cash flow. Higher levels of debt are associated with external monitoring by outside stakeholders
which is considered a good governance mechanism (Larcker et al., 2007). However, the Larcker
study also observes that debt is negatively associated with future firm performance. Too much
debt may constrain future cash flows and net income. We include a leverage variable to account
for the impact of external stakeholder monitors on the firm, but given the nuances of the
insurance industry, we do not expect a significant relation between the extent of leverage and
Tobin’s q, the measure of firm performance employed in this study. Rather than obtaining debt
funding from, say, a bank where monitoring of the insurer is in the interest of the bank, insurers
obtain debt obligations by writing more insurance policies. Damordian (2009) observes “Banks,
insurance companies and other financial service firms pose special challenges for an analyst
attempting to value them, ... the nature of their businesses makes it difficult to define both debt
and reinvestment, making the estimation of cash flows much more difficult.” The debt of
insurers is largely recognized to be their expected losses payable. Expected losses increase as the
firm’s business (premiums written) increase. Hence, insurers increase leverage simply by writing
more business.
Hypothesis 7: Firm performance is not significantly associated with firm leverage.
II. DATA AND METHODOLOGY
Larcker et al. (2007) classify the large corporate governance literature into two
8
categories, those that consider Performance¿=f (Governance Factors¿) and the more common
Performance¿=f (Governance Factors¿ , Controls¿). They confirm that the unrestricted model
(with control variables) is appropriate and it is the model we use; more specifically, the first nine
variables described in the following general function fall into the governance category, the last
four are control variables.
Tobin’s q = f(Family, Duality, Family*Duality, Blockholder, Blackrock, D&O Pct, Current Compensation, Forward Compensation, Leverage, Liquidity, Risk, Size, Focus)
The study relies on a sample of 702 observations of 86 publicly traded insurance
corporations operating during the period from 2006 through 2014. The end point of the sample is
the most recently available year; the starting point of 2006 is selected because the SEC changed
their reporting requirements for compensation data effective that year. The potential sample size
of 774 observations is reduced to 702 for a variety of reasons. These include the consequence of
mergers, the fact that some firms started business after 2006, missing or incomplete SEC forms,
and in some cases because the US Treasury took a significant ownership share as a consequence
of the financial crisis, starting in 2008.
Corporate control is an issue that is at the center of the performance/governance debate.
Control of the firm carries with it the power to expropriate shareholder wealth. One purpose of
the Agency governance structure is to reduce this potential conflict. But empirically identifying
an ownership level that grants the owner control is difficult. Corporate ownership data collected
from firm annual reports and proxy statements demonstrates that the control by a small group of
individuals and families may be more common than previously thought (Holderness et al. 1999;
Klein et al. 2005).9
9 Klein et al., note that “although Canada may be thought of as being similar to the United States in terms of its national governance structures, ownership concentration in Canada tends to be higher since individuals, families or private holding companies effectively control many of the largest firms … In this regard, ownership in Canada more closely approximates ownership structures in most countries around the world.”
9
We restrict our study to the insurance industry because recent studies demonstrated a
high percentage of family ownership in the industry (Barrese et al. 2007; Huang et al. 2001) and
because, as a regulated industry, the lower volatility of performance enhances the credibility of
results that find a statistical difference between firm performance levels. This section describes
the sample, data assembly and variable construction, and discusses the models investigated.
Section III presents the empirical results and Section IV concludes.
The insurance sample is derived from all active and publicly traded insurance firms on
the Bureau van Dijk’s ISIS database as well as active insurers with publicly traded parents from
the NAIC’s statutory reports. We exclude firms for a variety of reasons that are standard in the
insurance literature: those that are primarily brokers, title or surety firms, health care providers
rather than insurers, and firms that are not primarily listed on a North American exchange in
USD (to avoid currency conversion issues). We also exclude firms that have low trading volume
(average daily volume below 10,000) and therefore suspicious price and market value
information.10 The remaining 86 firms account for 55.48 percent of gross premiums written by
US domiciled insurers in year 2014.11 An advantage of the study of insurance is the fact that the
sector firms are highly regulated; performance variations should not be as high as experienced in
non-regulated industries. Thus, any finding of a performance difference in our study strengthens
the ability to generalize from the results.
10 Easley et al. (1996) note that “on the New York Stock Exchange, it is common for individual stocks not to trade for days or even weeks at a time...” Seth (2015) provides an operational definition of low volume trading: “In general, any stock that trades at fewer than 10,000 shares a day is considered a low-volume stock.” [Seth, Shobhit (May 14, 2015) “The Risks of Trading Low-Volume Stocks” Investopedia; viewed March 10, 2016 ... www.investopedia.com/articles/active-traading/051414/risks-trading-lowvolume-stocks.asp.11 A significant percent of insurance industry premiums is obtained by mutual corporations, which are not in the sample because they are not publicly traded.
10
II.1 PERFORMANCE
Three traditional dimensions of corporate performance are considered in the academic
literature: corporate profitability, productivity, and market valuation (Firer and Williams 2003).
Among the measures of profitability and market valuation are Tobin’s q, the return on equity
(ROE), and the return on assets (ROA).
The computation of a firm’s ROA and ROE is straightforward but the measure validity is
complicated when the sample covers multiple time periods or industries. The value of a low
ROA or ROE in a time period when economic conditions are generally good may be considered
a high value in a period of recession. Information from Compustat for all US corporations in the
2006-2014 period of our sample shows that a 6 percent ROE in 2008 would be high but the same
value in other years would be low.12 In addition, the ratios ignore the firm’s capital structure
(debt vs. equity) so a bias is created when a sample of firms contains a mix of industries with
different debt structures.
While we perform robustness checks using ROA and ROE, we focus on Tobin’s q as a
measure of performance. Theoretical Tobin’s q is the ratio of the market value of a firm to the
replacement cost of its assets (Brainard and Tobin, 1968). Tobin’s q is often interpreted as a
measure of managerial performance (Lang et al. 1989). The logic underlying the use of q is the
efficient market hypothesis. A consequence of the efficient financial markets hypothesis is that
the stock price (the numerator of Tobin’s q) will adjust to yield a competitive return; if the return
a firm can earn on retained earnings is higher than the return generally available in the
market, firm value is enhanced and Tobin’s q increases (Brainard and Tobin, 1968).
The computation of a theoretically correct q is difficult because the measure requires
obtaining the replacement value of assets, as well as the market value of a firm’s common and
12 Average ROE in 2008 was -0.01%, it was 14.87 in 2007.
11
preferred stock, and its debt. Calculating q for our sample is further complicated due to the often
high value of assets and liabilities for financial services firms. Insurance firms hold very large
asset portfolios but very little debt (because future reported and estimated claims must be
counted as a liability). We therefore use an intuitive measure of q – the market value of a firm
divided by its shareholders’ equity.
The q ratio values are less sensitive to the variety of time periods or industries than ROA
or ROE. A q value that is over 1 means that the market evaluates the use of assets by the firm at
a value higher than the intrinsic value of the assets, which is why some interpret q as an
evaluation of the growth potential of the firm. The median value of q in our sample is 1.04,
consistent with a slight expected growth potential for the industry.
II.2a GOVERNANCE (Stock Ownership – D&O and Family Control)
The stock variables considered by the Larker study include the firm percentage owned by
the affiliated management (Directors and Officers) but we extend the consideration to family
control relying on data from the SEC form DEF 14a. We compute D&O Pct as the sum of
ownership by the directors and officers excluding, if relevant, the family controlled ownership.
The literature is clear on the hypothesized D&O ownership effect – managers expect lower firm
performance and risk-taking with higher ownership.
Identifying family control is a subjective task.13 The literature reflects this uncertainty:
Yeh et al. (2001) find that families only need 15 percent ownership, on average, to control the
firm; Miller and Le Breton-Miller (2006) employ a 20 percent ownership rule; and Colli et al.
(2003) use the lowest ownership percentage, 5 percent, but require that the firm have a family
13 For example, it is well accepted that Hank Greenberg controlled AIG for many years but he owned only 3 percent of AIG stock (He also controlled a voting block through his position as head of the CV Starr Foundation).
12
member serve in firm management. We identify firms where controlling interest resides in an
individual or family (characterized in the paper as “family control”).
Whether one should differentiate between control by a family or by an individual is a
question that we do not address. Prior academic literature often requires the involvement of at
least two family members to qualify as a “family firm” and some studies impose additional
requirements. Examples of additional requirements include “a family member is chief executive,
there are at least two generations of family control, (and) a minimum of five percent of voting
stock is held by the family or trust interest associated with it”, “(an) expectation, or realization,
of family succession” (Colli et al. 2003, p. 30), “a family has enough ownership to determine the
composition of the board, where the CEO and at least one other executive is a family member,
and where the intent is to pass the firm on to the next generation” (Miller and Le Breton-Miller
2003, p. 127).
Yeh, et al. (2001) estimate that the level of ownership required to attain control is fifteen
percent in Taiwan; they find further that the required control level is inversely related to firm size
because ownership by other shareholders is generally more widely dispersed. Morck et al. (1988)
find that stock market valuations begin to fall when a controlling ownership level exceeds thirty
percent but later find that control can be achieved with much lower ownership percentages
through the use of differential voting classes of stock and other techniques (Morck and
Yeung 2003). The lack of voting by many shareholders, the use of proxy voting, and dual-
class shares often grant effective control with lower ownership percentages.14 Adopting a mix
of approaches, we identify as family firms those where a person or a set of related persons
controls at least 15 percent of the voting stock but, following Colli et al (2003), we relax the
14 Claessens et al. (2000) describe other methods of attaining strategic control with low-ownership, such as the establishment of “pyramids and cross-holdings, and covenants that allow the family to appoint the chief executive officer or board members, or even bypass the board for certain decisions.”
13
percentage rule if the Board or management includes a member of the founding family, even if
family ownership has fallen below 15 percent (e.g., the Markel Corp.).15 We identify Family as a
dummy variable equal to one for family-controlled firms using data acquired from the beneficial
ownership section of the SEC form DEF 14A. Our rule is closest to that of Anderson and Reeb
(2003) who report an average family ownership percentage of 17.8.
A feature of the insurance industry structure complicates the study. Insurance companies
in the U.S. are most typically organized as either stock or mutual organizations. Mutual
insurance firms are cooperative organizations, which are legally owned by their policyholders.
Some mutual insurers form insurer subsidiaries which may be organized as stock firms with
publicly traded equity shares. Five of the publicly traded firms in our sample are owned or
controlled by mutual insurance companies. Evidence on mutual insurer operations has shown
that mutual insurers, as opposed to mutual-owned stock insurers, tend to behave more
conservatively or take less risk than stock insurers (Lamm-Tennant and Starks, 1993; Lee,
Mayers and Smith, 1997). For robustness, in our regression analyses we treat mutual ownership
as a form of family control in Models 1 and 2 and exclude these firms from the sample in Models
3 and 4.
II.2b GOVERNANCE (Institutional Ownership)
We consider two institutional ownership characteristics: holdings by significant
blockholders and holdings of competing firms within an industry by a small group of investors.
Our measure for institutional ownership information, Blockholder, is obtained from the
15 Anderson and Reeb (2003), followed by others in the literature, define a firm as a family firm if the founder or descendants of the founder remain as one of the largest shareholders and sits on the board of directors, or hold top management positions.
14
“beneficially owned” section of the SEC’s DEF 14A and is equal to the sum of the listed
ownership by “significant” blockholders.16
A recent working paper describes a different blockholder-type ownership issue; the
possible anti-competitive implications of an observed increase in the ownership of natural
corporate competitors by a small set of large, diversified institutional investors (Azur et al,
2015). In an application described as a natural experiment they determined that airline ticket
prices on selected routes were 10% higher due to common ownership by Blackrock Capital.
Because of the findings in Azur, et al. (2015), we consider a dummy variable identifying the
presence of Blackrock ownership.17 We note that a recent Economist article suggests a similar
possibility under the coordinating influence of what they term the “big three” institutional
investors.18
II.2c GOVERNANCE (Board)
As discussed above, variables that describe the board make up most of the factors tested
by the Larcker and other governance studies. Our study follows a strain of the governance
literature that focuses on what Larcker et al (2007) describe as “Insider Chairman” but that has
more generally come to be described in the literature as “duality,” a measure which equals one if
the board chairperson and CEO are the same person and zero otherwise. Duality is often used to
identify firms deemed more likely to follow a stewardship rather than an agency governance
16 The Blockholder variable is subject to considerable measurement error. Firms are required to report on the DEF 14A the percentage owned by each investor only if the investor holds more than 5 percent of the firm’s stock. It is not uncommon to find a firm reporting, say, 5.1 percent ownership by Vanguard in 2007 and 2009 but nothing in 2008. It is likely that institutional ownership fluctuated by only a fraction of one percent but the reporting rule makes it appear as a swing of over 5 percent. Even this observation masks the degree of the issue. Using Cigna (CI) as an example, at year-end 2014 three Blockholders were reported as beneficially owning 5 or more percent of the firm (T. Rowe Price, 5.92%; Vanguard, 5.61%; and Dodge-Cox, 5.00%) yet Yahoo Finance reports that “Institutional Investors and Mutual Funds” own 89 percent of Cigna stock. They also report the number of institutions holding shares as 821 – information that is not available to us for the historical data. Thus, Blockholder may be more accurately described as ownership by “significant” blockholders.17 We also employ the Blackrock dummy variable because Blackrock has an ownership stake in a large portion of our sample. In 2014, Blackrock has a 5% or greater ownership stake in 65.5% of the firms in our sample.18 Stealth socialism, The Economist, 11/9/2016.
15
approach (Donaldson and Davis 1991). We therefore include a dummy variable equal to one if
the CEO is also the Chairperson and we also consider a family/duality interaction term. The
source of data for duality is the SEC’s DEF 14A. We expect a negative relationship between
duality and firm performance but a positive family-duality interaction effect.
II.2d GOVERNANCE (Compensation)
To address the compensation/agency incentive argument, following Larcker, et al.
(2007), we consider current compensation and forward compensation. Current compensation
includes salary, bonus and others that are not sensitive to future firm performance. Forward
compensation is defined as the percentage of restricted performance stock plus options in total
compensation, a measure that rewards the CEO when the longer-term performance of the firm
results in higher equity prices.19 These compensation data items are collected using a
combination of the Compustat Execucomp Annual Compensation file and hand-collection from
DEF 14A filings.
II.2e GOVERNANCE (Debt)
Because issuers of debt perform a monitoring function, debt is often characterized as a
measure of corporate governance (Larker et al. 2007). Holderness et al. (1999) include the ratio
of long-term debt to size (measured by total assets) as a measure of leverage.20 High debt-to-asset
values are associated with companies that may have difficulty generating sufficient cash while a
low ratio identifies companies that are not taking advantage of the possibilities for increased
profits. However, service companies, including insurance companies, do not have traditional
debt. Given the absence of reported 10-K level information on expected losses payable, we
19 Total current compensation is equal to total compensation minus restricted stock and option grants. We use this measure of compensation in order to reduce collinearity in the model between total compensation and forward compensation. The correlation between total compensation and the forward compensation percent is 42% while the correlation between current compensation and forward compensation percent is 2%.20 Companies with high debt/asset ratios are said to be highly leveraged; higher ratio values imply higher operational risk.
16
follow Altuntas et al. (forthcoming) by measuring leverage as one minus the ratio of shareholder
equity to total assets. The measure approximates the portion of assets not financed by equity –
typically debt.
II.3 CONTROLS (Liquidity, Risk, Size, and Diversification)
To better isolate the effect of a firm characteristic on firm performance and avoid
misspecification errors, researchers correct for differences caused by variation in a standard set
of issues known to influence performance variations; e.g., economies of scale. The set of such
factors considered in this study includes firm liquidity, risk, and size. Diversification (or focus), a
size related factor, is also considered.
Liquidity is the ability to change an asset to cash or a cash-equivalent. We expect
liquidity problems to be negatively related to firm performance and growth. Cash and cash-like
(marketable) securities comprise a firm’s liquid assets and increases in these values are
associated with financial distress (John 1993). Financial distress typically occurs when there is a
mismatch between the need for and availability of cash. It is reasonable to expect a U-shaped
performance and liquidity relationship because the cost of the mismatch is symmetrical. If the
firm has too little cash available, it must fund the shortfall through borrowing. This cost can be
high if the cash shortfall was not anticipated. On the other hand, the opportunity cost of having
too much cash on hand affects firm performance and the market’s evaluation of managerial
quality.
It is common to measure liquidity by the ratio of cash flow to the replacement cost of
capital. The replacement cost of capital is approximated by the market value of the firm. We
follow Cho (1998) and others by measuring liquidity as the ratio of operating cash flow to the
firm’s market value. To identify extreme effects of the hypothesized relationship, we create a
17
dummy variable set to one for low and high liquidity ratio values (less than 0% or greater than
55%).21 We expect a negative relationship between this dummy variable and firm performance.
When considering corporate performance, the risk-return tradeoff suggests that, on
average over time or on average across a cohort of firms, investors require and will earn higher
returns for firms that take on higher levels of operational risk. However, measuring operational
risk is a challenge. One of the more common operating risks for insurance companies is
contingent liquidity risk: the risk associated with finding additional funds to replace maturing
liabilities under potentially poor future market conditions. We thus adopt a measure of risk
which increases in value for firms with greater uncertainty surrounding the generation of cash –
specifically the coefficient of variation (CV) of quarterly operating cash flows. With no
significant difference in performance study results, we consider the coefficient of variation over
a one-year period. Because the mean value of the cash flows can be negative, we take the
absolute value of the ratio – a higher value implies higher risk than values closer to zero.22
Studies of firm performance almost always include a measure of size to account for
possible scale economies. In addition to the scale economy argument, ownership-performance
studies include a measure of size for a variety of reasons. Empirical results consistently
demonstrate a positive relationship between compensation levels and firm size, especially CEO
compensation (confirmed for insurers by Mayers and Smith, 1992). Thus, managers may attempt
to maximize firms’ size because larger firms provide higher levels of salary, power, and status
21 These values were selected by comparing the distribution of the liquidity variable to the distribution of a standard Normal plot. The liquidity variable diverged at these cutoff points indicating deviation in the variable’s distribution from an expected Normal distribution.22 Furthermore, the mean value of cash flows can be very close to zero – especially when offset by both positive and negative cash flows in a reporting year. A mean value very near zero inflates the coefficient of variation value leading to statistical problems. We therefore enact a simple modification to the variable and define the CV as (std. dev. of cash flow + 1) / (mean cash flows + 1).
18
(Marris, 1963; Belliveau et al. 1996; Mayers and Smith 1992); or managers, as potential CEOs,
maximize their human capital in hopes of winning the CEO tournament (Main et al. 1993).
Researchers have used a number of different measures of size; these include a variant of
assets (Cubbin and Leech, 1983; Agrawal and Mandelker, 1990), employment (Nickell et al.
1997), and the market value of the firm’s stock (Agrawal and Mandelker, 1990). Other variables
considered as measures of size by insurance researchers include the level of premiums, revenue,
and loss levels (Joskow 1973; Cummins and Weiss 1998). While the traditional view of
economies of scale relates average total cost to the quantity of output produced, it is difficult to
identify a unit of insurance activity that corresponds to a unit of physical output. Consequently,
typical size measures in the insurance literature include assets, revenues, or losses incurred.
Arguably the best proxy is losses under a theory that the product purchased with an insurance
contract is protection against financial loss (Doherty 1981). Information on losses incurred
during a year is a reporting requirement on insurance regulation forms, which limit reporting to
losses incurred in the United States. The information is not commonly reported on forms
required by the SEC, which report worldwide firm information. Because many larger insurance
holding companies operate outside the US, using statutory data from the NAIC reports is
inaccurate as a measure of size. We follow Cummins and Xie (2013) and measure size as the
natural logarithmic value of assets.
A size related issue recently considered in the insurance literature is corporate
diversification (or focus). Larger firms are more likely to be diversified than are smaller firms.
Evidence suggests that diversification may have more to do with enhancing managerial status
and compensation rather than firm performance (Denis et al. 1997). Consistent with Denis et al.,
the literature rarely reports that firm diversification offers a net benefit: “Tobin's q and firm
19
diversification are negatively related throughout the 1980s. This negative relation holds for
different diversification measures and when we control for other known determinants of q.
Further, diversified firms have lower q values than comparable portfolios of pure-play firms. …
We find no evidence supportive of the view that diversification provides firms with a valuable
intangible asset” (Lang and Sultz, 1993). In a study of property-casualty insurers, Liebenberg
and Sommer (2008) consider line-of-business diversification and find that more focused firms
have higher performance levels.
While diversification and firm performance are often negatively related in financial
studies, we believe the potential for a positive relationship exists. First, greater diversification of
business segments may indicate a larger, more complex firm. The more complex firm may also
be associated with higher levels of performance. On the other hand, the diversified firm may be
diversified because it cannot grow further in some of the market segments in which it operates.
This reduced growth potential may result in a lower value of Tobin’s q.
To measure focus, we use a dummy variable equal to one for focused firms (number of
segments equals one) and zero for diversified firms (number of segments greater than one). The
use of a dummy variable eases interpretation of the results and reduces the likelihood that our
variable is biased by subjective reporting rules.23
III EMPIRICAL RESULTS
Based on the results of Larker et al. (2007), we use the unrestricted form:
Performance¿=f (Gover nance Factors¿ ,Controls¿) in our study; more specifically, corporate
performance is considered a function of governance features, including ownership mix, CEO
23 Prior measures of diversification include the Herfindahl-Hirschman Index (HHI), number of business segments, and a dummy variable for diversified (or focused) firms. We collect segment revenue and asset data from firm 10-K filings. However, segment data in the 10-K is self-reported and non-standardized. In many cases, one firm will change its number of reported segments year-to-year with no substantial changes in operations. Due to these inconsistencies, we do not believe that the HHI or a segment count are appropriate measures of diversification or focus.
20
pay, organizational structure, and debt, and a set of control factors synthesized from the
empirical literature: liquidity, risk, size, and diversification.
The sample is drawn from 86 publicly traded insurance corporations operating during the
period from 2006 through 2014. The end point of the sample is the most recently available year;
the starting point of 2006 is the year the SEC changed compensation data reporting requirements.
The potential sample size of 774 observations is reduced to a final size of 702. Table 1 provides
summary statistics for all variables considered in the study as well as expected relationships
between the variables and Tobin’s q. The mean value of q is 1.159 and the median is 1.038
indicating a slightly higher market valuation than the book value of shareholders’ equity.
Because the variable is slightly right-skewed, we use the natural logarithm of Tobin’s q in our
regression analyses.
Table 1 Here
The summary statistics show that 37.6 percent of the 702 firm-years are family
controlled. A high percentage of the firm-years, 53.7 percent have a duality governance structure
(one person is both CEO and Board Chairperson). On average, large investors hold 22 percent of
the firm’s stock. One of these blockholders, Blackrock, owns a stake in 37.6% of our sample
(although this number is much greater later in the sample period). The average firm in our
sample is five percent owned by non-family directors and officers. The average (median) CEO’s
current compensation is $3.7 ($2.4) million with an average of 33.5 percent of total
compensation coming in the form of stock and options. The average leverage value in our sample
is 0.75 which indicates that average liabilities equal 75 percent of assets.
Table 2 provides the results of mean comparison t-tests on the variables in our sample
using family control as a grouping variable. These t-tests provide some preliminary evidence of
21
the relationships between variables in our study. While no performance variables exhibit a
statistically different mean value between ownership types, there is great variation in the
governance variables. Family controlled firms have a slightly higher ownership by non-family
directors and officers (5.9 versus 4.7 percent of outstanding stock). However, family firms
exhibit lower levels of blockholder ownership and are much less likely to be owned by
Blackrock (Blackrock owns a stake in 14.4 percent of family firms versus 51.6 percent of non-
family firms). Family firm CEO’s draw lower current compensation and a lower proportion of
forward compensation, although these CEO’s may be more likely to own a stake in the firm than
non-family CEO’s, which provides incentive to increase long-term firm value. Family firms also
have slightly lower leverage values, on average.
We also see some differences in our control variables. Family firms have less liquidity
than non-family firms but are more likely to be counted as “extreme” liquidity firms. Family
firms are also significantly smaller than non-family firms measured by total assets.
Table 2 Here
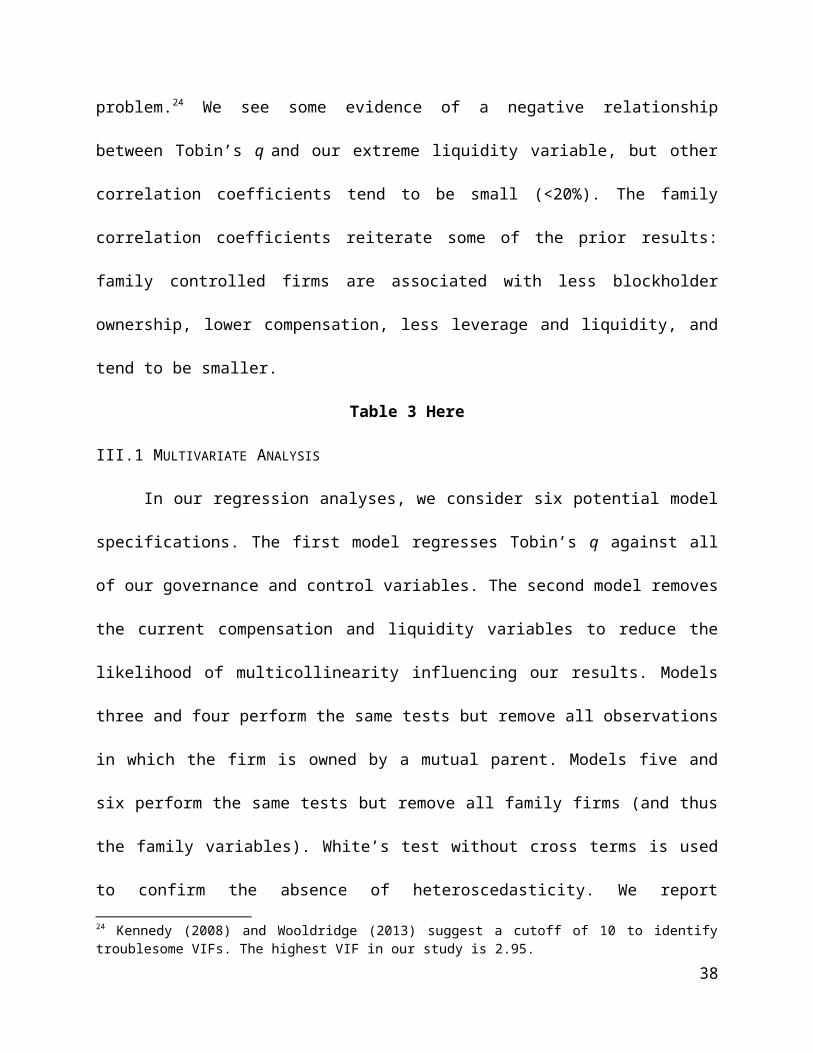
We include a correlation matrix of all regression variables in Table 3. Only one
correlation coefficient merits concern (current compensation and firm size at 63%); however
regression model diagnostics show no evidence of a multicollinearity problem.24 We see some
evidence of a negative relationship between Tobin’s q and our extreme liquidity variable, but
other correlation coefficients tend to be small (<20%). The family correlation coefficients
reiterate some of the prior results: family controlled firms are associated with less blockholder
ownership, lower compensation, less leverage and liquidity, and tend to be smaller.
Table 3 Here
24 Kennedy (2008) and Wooldridge (2013) suggest a cutoff of 10 to identify troublesome VIFs. The highest VIF in our study is 2.95.
22
III.1 MULTIVARIATE ANALYSIS
In our regression analyses, we consider six potential model specifications. The first
model regresses Tobin’s q against all of our governance and control variables. The second model
removes the current compensation and liquidity variables to reduce the likelihood of
multicollinearity influencing our results. Models three and four perform the same tests but
remove all observations in which the firm is owned by a mutual parent. Models five and six
perform the same tests but remove all family firms (and thus the family variables). White’s test
without cross terms is used to confirm the absence of heteroscedasticity. We report regression
results with heteroscedasticity-consistent (White’s) standard errors. We include year fixed effects
as an additional control (firm fixed effects are excluded because some governance variables are
mostly time-invariant).
Table 4 Here
Table 4 summarizes the regression results. Although Shleifer and Vishny (1997)
conclude that family firms have lower observed performance, consistent with Andres (2008) and
others, we find a positive and significant relationship between family control and firm
performance. These results provide support for our first hypothesis – the results suggest that
family firms behave in a manner consistent with Stewardship theory. The Duality variable is also
significantly positively related to q. We note that Duality is positive in the non-family results
(Models 5 and 6) indicating that stewardship in some form is valued by investors. However, the
interaction between Family and Duality is negative indicating some disutility from both family
ownership and CEO/Chairperson control.
Given the family-duality interaction, our model considers four potential control
structures: family-duality (FxD), family-nonduality (FxND), nonfamily-duality (NFxD), and
23
nonfamily-nonduality (NFxND). If we consider the NFxND structure as the “base” category,
Tobin’s q increases in each other control structure. Our estimates show that the highest
performance exists for FxND firms due to the negative interaction between family and duality.25
Thus, our results support Hypothesis 5a, that duality is positively related to performance, and
Hypothesis 5b, that the coincidence of family control and duality is associated with lower
performance.
Contrary to Hypothesis 2, we find that Tobin’s q is negatively related to blockholder
ownership. While blockholder ownership is supposedly associated with better governance
through monitoring, it is possible that this governance is not valued by investors. Additionally,
because the insurance industry is heavily monitored by regulators and rating agencies, added
monitoring by blockholders may be a trivial contribution. It is possible that large institutional
investors exert influence on firm managers to divert cash flows towards their own interests and
away from minority shareholders (Shleifer and Vishny, 1997; Andres, 2008). It is also possible
that the finding is a result of unavoidable measurement difficulty – i.e., some institutional
investors own controlling interests in our sample firms but at a level below five percent (and thus
not reported in company filings).
We find a positive association between q and an ownership stake by Blackrock, in
support of Hypothesis 3. The positive coefficient for Blackrock may indicate a collusion effect
which is discussed by Azur et al. It may also indicate a preference for Blackrock to select firms
with greater growth potential.
In the first four models, we do not observe a significant relationship between non-family
D&O ownership and q so therefore find no support for Hypothesis 4. However, in models five
25 According to our coefficient estimates, Family firms without Duality have a Tobin’s q 25% higher than the base model. Family firms with duality have a Tobin’s q 16.5% higher than the base model.
24
and six (which remove all family-firm observations) we see a positive association between non-
family D&O ownership and performance which lends more support to the Stewardship view of
the firm.
We observe a positive relation between performance and both our compensation-amount
variable (Current Compensation) and our forward-looking compensation variable. These findings
yield partial support for Hypothesis 6. The positive association with forward-looking
compensation is expected and indicates that firms with a higher value of forward-looking
performance employ managers who realize more pay from better future performance. We did not
expect a positive association between q and the amount of current compensation as this may
represent an increased agency cost to shareholders. Perhaps these better paid managers also make
better long-term decisions for the firm.
Finally, we find a generally negative relation between increased leverage (the ratio of
liabilities to total assets) and firm performance. Prior results are mixed regarding the use of
leverage. Our sample consists of only insurance firms whose liabilities mostly represent future
claims payments. The negative relation may represent increased uncertainty about future firm
solvency or profitability due to the pressure that greater liabilities place on future cash flows. We
therefore reject Hypothesis 7, which is presented in the null form.
The results are as generally expected for our non-governance control variables: liquidity,
risk, size, and diversification. Liquidity, measured as the firm’s operating cash flow to market
value, is negatively but not significantly related to firm performance. Because firms with low
leverage may incur financial constraints and because firms with very high levels of leverage may
be takeover targets, we identify these observations and consistently find a significant negative
effect. The coefficient of our risk variable is not significantly related to firm performance. The
25
coefficient for size, measured by the natural log of assets, is negatively related to firm
performance, consistent with Cummins and Xie (2013). We also include a control for firm focus
(equal to one for firms which operate in one business segment) and consistent with the literature
find a positive effect (Berger and Ofek, 1995; Liebenberg and Sommer, 2008).
III.2 ADDITIONAL TESTS
While not a primary concern of our study, we further test for the impact of governance on
performance by examining the relationship between our governance and control variables with
return. Specifically, we examine whether our independent variables in time period t have an
influence on return on equity and return on assets in time period t+1.26
Table 5 Here
Table 6 Here
26 We include both ROE and ROA. ROE is a performance metric relevant to a firm’s shareholders. ROA is commonly used to measure performance in the insurance industry for mutual and private-stock firms. Both measures are based on one-year income and therefore not as forward-looking as Tobin’s q.
26
The only governance variables which show strong relations with return are blockholder
ownership, compensation, and leverage. These results echo those of the Tobin’s q models:
blockholder ownership and leverage are negatively related to return. Compensation is positively
related with return. There is limited evidence that family control is negatively related to return
(Table 6). These findings provide additional information for hypotheses two, six, and seven, but
do not provide any additional evidence for the other hypotheses. We do not believe that the lack
of results in these models is a great concern. Stewardship theory predicts that family-controlled
firms will seek to maximize long-term performance rather than short-term returns. Further,
stronger governance features should be associated with the pursuit of sustained value for
shareholders rather than short-term returns. We believe the Tobin’s q results presented in Table 4
are more important and more accurate in communicating firm performance relative to corporate
governance than the ROE and ROA results in Tables 5 and 6.
For the control variables, liquidity is positively related to both return variables. As in the
Tobin’s q models, size is negatively related to return and focus is positively related to return.
IV. DISCUSSION OF FINDINGS AND CONCLUSION
This study provides an overview of governance issues in the US insurance industry with a
special focus on ownership and control. The paper provides an updated description of insurer
ownership patterns and observes that a high percentage of firms are family controlled and that
significant ownership by institutional investors, particularly investment funds, is common in
non-family firms.
Conflicting theories argue that the family firm is relatively small, cost inefficient, and
low performing due to nepotism and weak risk-bearing attributes (Habbershon and Williams
1999) or that family controlled firms have performance advantages because the unity of
27
ownership and control reduces agency costs (Alchian and Demsetz 1972). Empirical evidence is
also inconclusive; some conclude that family firms have lower observed performance (Shleifer
and Vishny 1997) but others find a positive and significant relationship between family control
and firm performance (Andres 2008).
While over half of the firms in our sample are marked by duality, an absence of top-level
operational and strategy diversification, such duality is often considered a less effective
managerial structure because it removes a potential check on managerial excess (Cordeiro and
Veliyath 2003; Nourayi and Mintz 2008). But empirical evidence often finds a positive
duality/performance relationship (Anderson and Reeb 2003). Duality is typically represented by
a dummy variable when the same person is responsible for operational leadership (CEO) and
strategic leadership (Board Chair). However, the literature does not distinguish between CEO-
Chairpersons who represent firms controlled by a single family, a gap addressed in this study.
The models tested consider four firm states with the base case being non-family and no
duality (NFxND; FxD; FxND; and NFxD). We find that family firms in the insurance industry
are not small, though non-family firms are larger, and these family firms are consistently higher
performers than non-family firms. However, a dual leadership structure in family firms reduces
the benefits of family control by an amount that almost eliminates the performance advantage of
the family firm over the non-family firm.27 In all cases, family and duality firms outperform the
base case. Our findings support the positive family performance hypotheses of Alchian and
Demsetz (1972) but the findings also explain how conflicting empirical evidence, such as that of
Shleifer and Vishny (1997) and Andres (2008), has evolved. The variation in the findings of
different samples may be attributable to the composition of family-duality combinations.
27 This finding is supported by the insignificant univariate performance difference between family and non-family firms in Table 2.
28
We further find evidence that ownership patterns of large shareholders influence firm
performance. An argument is often made that the benefit of investing through large fund
aggregators is that institutional investors, as large shareholders of a firm, can more effectively
monitor management and protecting minority shareholders from value expropriation by
managers (Pound 1991; Black 1992). The large growth in funds under management by such
firms suggests that many expect their returns from such fund managers to be no worse than is
generally available in the market. For this reason we consider the hypothesis that firm
performance is higher for firms with higher percentages of blockholder ownership despite
evidence that a relationship between blockholder holdings and firm performance is weak
(Cornett et al. 2007). Empirical support for the monitoring argument is also weak; investments
by large fund managers tend to be persistent over time providing support for firm management.
Rather than posing a threat in the face of poor performance, corporate expenses, such as CEO
compensation, tend to be higher in the presence of blockholder involvement (Mehran 1995).
Contrary to our expectations, our findings are consistent with the existing literature; as
ownership of a firm by large blockholders increases, performance falls. An important caution of
this result is necessary. Large blockholder data is subject to an unavoidable measurement
difficulty; some institutional investors own controlling interests in our sample firms but at a level
below five percent. Also, recent studies have posited that large investors are more interested in
industry performance rather than in the relative performance of a particular firm. Some empirical
evidence is presented using a particular firm, Blackrock, as a source of coordination between
firms (Azur 2015) but more popular speculations suggest that small groups of firms may
combine to attempt coordination (Economist 2016). For this reason we test for the influence of
Blackrock and find, consistent with Azur, higher performance of firms where Blackrock is a
29
significant owner. This result is also possible if Blackrock has more skill anticipating which
firms will outperform the market, something we hesitate to suggest, or if they are better monitors
than are other fund management firms, and that activity translates to performance gains.
Higher percentages of nonfamily director and managerial ownership are hypothesized to
align the interests of managers and non-insider shareholders (Fahlenbrach and Stulz 2009). We
do not find evidence in support of this hypothesis. The finding, perhaps, is influenced by the fact
that when family-directors and non-family directors are separated, the remaining D&O
percentages are very low; the percentage median is 2 percent for the sample.
Prior literature suggests that CEOs at firms with agency problems extract higher
compensations but that greater forward-looking compensation helps enhance performance (Core
et al. 1999). A more recent study, Gillan (2006), also finds a positive relation between
performance and forward compensation as well as current compensation. Our findings are
consistent with those of Gillan.
Debt, a common measure of the firm’s use of other people’s money, introduces another
governance monitoring influence. Debt imposes fixed obligations on corporate cash flow and
consequently is expected to restrict future firm performance relative to an otherwise similar firm
with a higher ratio of equity to debt (Jensen and Meckling 1976). We correct for variation in firm
performance associated with this governance characteristic and find a negative relationship in all
models involving our full sample. The last two columns in Table restrict the sample to non-
family firms; in one of these models the variable is positive, in the other it is not significant.
The credibility of our results is high given the nature of the industry we study. Insurance
industry regulations include those that affect operational risk taking, investment risk, and debt
issuance. The finding that, despite controls limiting the downside performance of firms in the
30
insurance industry, family-controlled firms outperform non-family firms, provides strong
evidence for the stewardship hypothesis. Managers and directors of these firms are more
motivated toward the success of the firm than are nonfamily firm managers and directors. If the
hypothesized negative effects of nepotism and an associated inefficiency are real, the higher
utility of family managers offsets the negative influences. An equally important contribution of
the paper is the evidence that understanding the complete ownership structure of firms is
important to understand the firm’s performance and perhaps that of the industry as well.
31
TABLE 1Variable Definitions and Descriptive Statistics (N = 702)
Variable Name Definition Expected Sign Mean Median Min Max S.D.
Performance Variables
Tobins q Market to book value of equity - 1.159 1.038 0.137 4.727 0.561
LN(Tobins q) Natural log of the market to book value of equity - 0.044 0.037 -1.985 1.553 0.461
ROA Net income divided by total assets - 0.023 0.020 -0.115 0.149 0.026
ROE Net income divided by book value of equity - 0.089 0.097 -1.884 0.780 0.130
Governance Variables
Family Dummy for firms with family control + 0.376 0 0 1 0.485
FamilyStrict Dummy for firms with family control (no mutual owned) + 0.321 0 0 1 0.467
Duality Dummy for same individual as CEO and Chairperson + 0.537 1 0 1 0.499
Blockholder Pct Fraction of institutional investor ownership of firm +/- 0.219 0.196 0.000 0.816 0.176
Blackrock 1 if Blackrock has at least a 5% share - 0.376 0 0 1 0.485
D&O Pct Fraction owned by directors and officers (non-family) - 0.052 0.024 0.000 1.000 0.077
Current Comp Non-stock and non-option CEO compensation ($1,000s) - 3,713 2,364 95 31,010 3,953
Log Current Comp Natural log of non-future CEO compensation - 7.745 7.757 4.554 10.342 1.001
Forward Comp Pct Option & stock as fraction of total CEO compensation + 0.335 0.345 0.000 0.985 0.243
Leverage One minus (Shareholders’ Equity/Total Assets) + 0.750 0.756 0.271 0.985 0.125
Control Variables
Liquidity Operating cash flow to end-of-year market value +/- 0.169 0.150 -0.752 1.247 0.210
Extreme Liquid 1 if Liquidity takes on extreme high or low values - 0.112 0 0 1 0.112
Risk Coefficient of variation of quarterly operating cash flows
- 1.312 0.582 0.074 28.394 3.056
Tot Assets Total assets ($1,000,000s) - 52,645 9,769 9 1,060,505 132,882
LN Tot Assets Natural log of total assets - 9.174 9.237 2.243 13.874 2.024
Focus 1 business segments = 1 + 0.198 0 0 1 0.399
32
TABLE 2Univariate Comparisons – Mean Variable Values by Family Control
Variable Family Non-Family Difference
Performance VariablesTobins q 1.198 1.136 0.061LN(Tobins q) 0.072 0.028 0.044ROA 0.021 0.024 -0.003ROE 0.088 0.090 -0.001
Governance VariablesDuality 0.542 0.534 0.007D&O Pct 0.059 0.047 0.012 **Blockholder Pct 0.193 0.235 -0.042 ***Blackrock 0.144 0.516 -0.372 ***Log Current Comp 7.391 7.959 -0.568 ***Forward Comp Pct 0.220 0.404 -0.184 ***Leverage 0.736 0.773 -0.037 ***
Control VariablesLiquidity 0.132 0.191 -0.058 ***Extreme Liquid 0.140 0.087 0.053 **Risk 1.495 1.202 0.292Size - LN Total Assets 8.235 9.739 -1.504 ***Focus 0.205 0.194 0.010N-obs 702 430 272
*, **, and *** indicate significance at the 10%, 5%, and 1% levels, respectively.
33
TABLE 3Correlation Matrix (N=702)
LN(Tq) 2 3 4 5 6 7 8 9 10 11 12 13Family (2) 0.046Duality (3) 0.101 0.007Blockholder Pct (4) -0.088 -0.116 -0.195Blackrock (5) -0.027 -0.372 -0.034 0.078D&O % (6) 0.014 0.077 -0.101 -0.025 -0.128Log Current Comp (7) 0.139 -0.275 0.196 -0.168 0.247 -0.249Fwd Comp Pct (8) 0.133 -0.367 0.042 0.060 0.191 -0.190 0.193Leverage (9) -0.107 -0.154 0.136 -0.205 0.016 -0.168 0.331 0.110Liquidity (10) -0.014 -0.135 0.083 -0.065 -0.011 -0.025 0.105 0.117 0.252Extreme Liquidity (11) -0.313 0.084 -0.030 -0.029 -0.126 0.116 -0.255 -0.139 0.042 -0.073Risk (12) -0.104 0.046 -0.048 -0.011 -0.041 0.023 -0.087 -0.032 0.027 -0.183 0.331Size (13) -0.042 -0.360 0.212 -0.203 0.213 -0.320 0.632 0.353 0.512 0.171 -0.190 -0.082Focus 0.163 0.013 0.089 -0.063 -0.054 0.127 -0.236 -0.043 -0.018 0.146 0.060 0.014 -0.262Bold implies statistical significance at the 10% level.
34
35
Table 4Empirical Results (Dependent Variable = Natural log of Tobin’s q)VARIABLES Model 1 Model 2 Model 3 Model 4 Model 5 Model 6 Governance Family 0.227*** 0.212*** 0.201*** 0.175***
(5.265) (4.843) (4.296) (3.640)Duality 0.122*** 0.135*** 0.118*** 0.130*** 0.164*** 0.179***
(3.506) (3.834) (3.391) (3.686) (4.853) (5.269)Family*Dual -0.196*** -0.189*** -0.202*** -0.186***
(-3.284) (-3.167) (-3.081) (-2.842)Blockholder Pct -0.312*** -0.352*** -0.449*** -0.518*** -0.530*** -0.736***
(-3.926) (-4.346) (-4.328) (-4.908) (-4.646) (-5.731)Blackrock 0.097*** 0.124*** 0.109*** 0.138*** 0.090* 0.143***
(2.588) (3.216) (2.725) (3.400) (1.827) (2.790)D&O Pct 0.204 0.146 0.259 0.219 0.510** 0.526**
(0.830) (0.687) (1.037) (1.003) (2.393) (2.179)Log Current Comp 0.098*** 0.096*** 0.187***
(4.497) (4.341) (6.796)Fwd Comp Pct 0.330*** 0.305*** 0.319*** 0.301*** 0.265*** 0.113
(4.882) (4.439) (4.551) (4.219) (3.308) (1.230)Leverage -0.417*** -0.384*** -0.444*** -0.411*** 0.433** -0.020
(-2.791) (-2.833) (-2.933) (-2.981) (2.107) (-0.106)
ControlsLiquidity -0.023 -0.006 -0.123
(-0.181) (-0.048) (-0.809)Extreme Liquid -0.348*** -0.390*** -0.342*** -0.383*** -0.299*** -0.364***
(-4.917) (-5.424) (-4.796) (-5.259) (-2.957) (-3.638)Risk 0.002 0.002 0.002 0.003 -0.004 -0.005
(0.322) (0.364) (0.433) (0.414) (-0.779) (-0.716)Size -0.038*** -0.015 -0.038*** -0.016 -0.154*** -0.085***
(-2.679) (-1.371) (-2.585) (-1.383) (-7.620) (-5.046)Focus 0.211*** 0.184*** 0.217*** 0.193*** 0.002 -0.077
(4.860) (4.415) (4.964) (4.570) (0.046) (-1.540)Constant 0.133 0.678*** 0.196 0.745*** -0.003 1.281***
(0.748) (4.856) (1.027) (4.865) (-0.013) (7.730)
Observations 702 702 663 663 438 438R-squared 0.392 0.368 0.393 0.370 0.509 0.450
Numbers in parentheses below coefficients are t-statistics. *, **, and *** indicate significance at the 10%, 5%, and 1% levels, respectively.Year fixed-effect dummy variables are included in the model but the results are not reported for brevity.Models 1 and 2 include all definition of family firms. Models 3 and 4 exclude firms which are owned by a mutual parent organization. Models 5 and 6 exclude all family-controlled firms.
36
Table 5Empirical Results (Dependent Variable = ROE)VARIABLES Model 1 Model 2 Model 3 Model 4 Model 5 Model 6 Governance
Family 0.010 -0.004 0.006 -0.013(0.818) (-0.267) (0.500) (-0.962)
Duality 0.014 0.018 0.014 0.018 0.024 0.026(0.898) (1.126) (0.895) (1.098) (1.303) (1.379)
Family*Dual 0.001 0.010 0.001 0.015(0.054) (0.570) (0.061) (0.766)
Blockholder Pct -0.083*** -0.096*** -0.096*** -0.121*** -0.074* -0.150***(-3.222) (-3.555) (-2.748) (-3.288) (-1.702) (-3.107)
Blackrock 0.009 0.018* 0.009 0.019* -0.008 0.010(0.866) (1.657) (0.812) (1.700) (-0.721) (0.858)
D&O Pct 0.100 0.077 0.098 0.082 0.054 0.106(1.602) (1.322) (1.595) (1.438) (0.648) (1.256)
Log Current Comp 0.039*** 0.039*** 0.063***(5.246) (5.129) (5.265)
Fwd Comp Pct 0.087*** 0.085*** 0.086*** 0.086*** 0.096** 0.058(3.146) (2.905) (3.010) (2.880) (2.149) (1.262)
Leverage -0.140*** -0.092** -0.150*** -0.103** 0.077 -0.068(-2.830) (-2.019) (-2.979) (-2.237) (0.761) (-0.722)
ControlsLiquidity 0.092** 0.097*** 0.095**
(2.521) (2.611) (2.080)Extreme Liquid -0.019 -0.035 -0.020 -0.035 -0.032 -0.029
(-0.894) (-1.460) (-0.948) (-1.436) (-1.063) (-0.915)Risk 0.000 -0.001 0.000 -0.001 -0.002 -0.004
(0.162) (-0.173) (0.179) (-0.190) (-0.647) (-1.224)Size -0.022*** -0.013** -0.023*** -0.014** -0.054*** -0.028*
(-3.417) (-2.081) (-3.335) (-2.098) (-3.186) (-1.848)Focus 0.024** 0.021* 0.024** 0.022* -0.022 -0.037
(2.035) (1.724) (1.970) (1.714) (-0.925) (-1.375)Constant 0.109* 0.308*** 0.128* 0.332*** 0.055 0.472***
(1.771) (5.770) (1.868) (5.541) (0.650) (5.249)
Observations 618 618 582 582 378 378R-squared 0.257 0.191 0.263 0.197 0.312 0.244Numbers in parentheses below coefficients are t-statistics. *, **, and *** indicate significance at the 10%, 5%, and 1% levels, respectively.All Independent Variables are lagged one year relative to the dependent variable.Year fixed-effect dummy variables are included in the model but the results are not reported for brevity.Models 1 and 2 include all definition of family firms. Models 3 and 4 exclude firms which are owned by a mutual parent organization. Models 5 and 6 exclude all family-controlled firms.
37
Table 6Empirical Results (Dependent Variable = ROA)VARIABLES Model 1 Model 2 Model 3 Model 4 Model 5 Model 6 Governance
Family -0.005* -0.007** -0.005* -0.008**(-1.763) (-2.316) (-1.699) (-2.388)
Duality -0.000 0.000 -0.000 0.000 0.001 0.002(-0.116) (0.207) (-0.098) (0.192) (0.645) (0.768)
Family*Dual 0.001 0.003 0.001 0.003(0.344) (0.689) (0.149) (0.647)
Blockholder Pct -0.015*** -0.017*** -0.016** -0.020*** -0.015* -0.025***(-2.776) (-3.072) (-2.309) (-2.753) (-1.835) (-2.752)
Blackrock -0.000 0.001 -0.000 0.001 -0.001 0.001(-0.017) (0.675) (-0.138) (0.653) (-0.456) (0.537)
D&O Pct 0.016 0.012 0.015 0.012 0.032** 0.037***(1.054) (0.797) (0.991) (0.805) (2.401) (2.801)
Log Current Comp 0.006*** 0.006*** 0.008***(6.055) (6.067) (4.742)
Fwd Comp Pct 0.014*** 0.013*** 0.013*** 0.013*** 0.014*** 0.009*(3.341) (3.103) (3.023) (2.918) (2.783) (1.772)
Leverage -0.102*** -0.095*** -0.104*** -0.097*** -0.086*** -0.105***(-9.681) (-9.354) (-9.704) (-9.476) (-5.190) (-7.078)
ControlsLiquidity 0.012** 0.013** 0.007*
(2.206) (2.354) (1.703)Extreme Liquid -0.005 -0.008** -0.005 -0.008** 0.000 -0.000
(-1.376) (-1.969) (-1.452) (-1.978) (0.022) (-0.070)Risk 0.000 0.000 0.000 0.000 -0.000 -0.001***
(1.002) (0.573) (1.012) (0.539) (-1.329) (-2.609)Size -0.003*** -0.001* -0.003*** -0.001* -0.006*** -0.003**
(-3.645) (-1.842) (-3.626) (-1.920) (-4.036) (-2.445)Focus 0.007*** 0.006*** 0.007*** 0.006*** -0.000 -0.002
(3.094) (2.759) (3.050) (2.755) (-0.059) (-0.841)Constant 0.085*** 0.119*** 0.087*** 0.122*** 0.092*** 0.146***
(8.260) (12.952) (8.042) (12.306) (5.816) (11.885)
Observations 618 618 582 582 378 378R-squared 0.429 0.384 0.433 0.386 0.545 0.512
Numbers in parentheses below coefficients are t-statistics. *, **, and *** indicate significance at the 10%, 5%, and 1% levels, respectively.All Independent Variables are lagged one year relative to the dependent variable.Year fixed-effect dummy variables are included in the model but the results are not reported for brevity.Models 1 and 2 include all definition of family firms. Models 3 and 4 exclude firms which are owned by a mutual parent organization. Models 5 and 6 exclude all family-controlled firms.
38
REFERENCES
Agrawal, A, and GN Mandelker (1990). Large Shareholders and the Monitoring of Managers: The Case of Antitakeover Charter Amendments. Journal of Financial and Quantitative Analysis 25: 143-161.
Alchian, A, and H Demsetz (1972). Production, information costs, and economic organization. American Economic Review 62(5): 777–795.
Anderson, R, and D Reeb (2003) “Founding-Family Ownership and Firm Performance: Evidence from the S&P 500” The Journal of Finance 58(3): 1301-28.
Andres, C (2008). Large Shareholders and Firm Performance – An Empirical Examination of Founding-Family Ownership. Journal of Corporate Finance 13: 431-445.
Azur, J, MC Schmalz, and I Tecu (2015) “Anti-Competitive Effects of Common Ownership University of Michigan, Ross School of Business Working paper No. 1235 (April)
Barrese, J, G Lai and N Scordis (2007). Ownership Concentration and Governance in the U.S. Insurance Industry. Journal of Insurance Issues 30(1): 175–190.
Belliveau, MA, CA O'Reilly and JB Wade (1996). Social Capital at the Top: Effects of Social Similarity and Status on CEO Compensation. Academy of Management Journal 39(6): 1568–1593.
Berg, SV, and SK Smith (1978). CEO and Board Chairman: A quantitative study of dual vs. unitary board leadership. Directors and Boards Free Press.
Berger, PG and E Ofek (1995). Diversification’s Effect on Firm Value. Journal of Financial Economics 37(1): 39-65.
Berle, AA, and GC Means (1932). The Modern Corporation and Private Property. New York: Macmillan.
Black, BS (1992). Institutional Investors and Corporate Governance: the Case for Institutional Voice. Journal of Applied Corporate Finance 5(3): 19-32.
Brainard, WC, and J Tobin (1968). Pitfalls in Financial Model Building. American Economic Review 58(2): 99–122.
Carney, M (2005). Corporate Governance and Competitive Advantage in Family-Controlled Firms. Entrepreneurship Theory and Practice 29(3): 249-265.
Chaganti, R, V Mahajan and S Sharma (1985). Corporate board size, composition and corporate failures in the retailing industry. Journal of Management Studies 22(4): 400-417.
Cho, M (1998). Ownership Structure, Investment, and the Corporate Value: An Empirical Analysis. Journal of Financial Economics 47: 103–121.
Claessens, S, S Djankov and L Lang (2000). The separation of ownership and control in East Asian Corporations. Journal of Financial Economics 58(1-2): 81–112.
Colli, A, P Fernández Pérez and MB Rose (2003). National determinants of Family Firm Development? Family Firms in Britain, Spain and Italy in the Nineteenth and Twentieth Centuries. Enterprise & Society 4(1): 28–64.
Corbetta, G and CA Salvato (2004). The Board of Directors in Family Firms: One Size Fits All? Family Business Review 17(2): 119-134.
Cordeiro, JJ, and R Veliyath (2003). Beyond pay for performance: A panel study of the determinants of CEO compensation. American Business Review 21(1): 56-66.
Core, JE, RW Holthausen and DF Larcker (1999) Corporate governance, chief executive officer compensation, and firm performance. Journal of Financial Economics 51: 371-406.
Cornett, MM, AJ Marcus, A Saunders, and H Tehranian (2007) The impact of institutional ownership on corporate operating performance Journal of Banking & Finance 31: 1771–1794
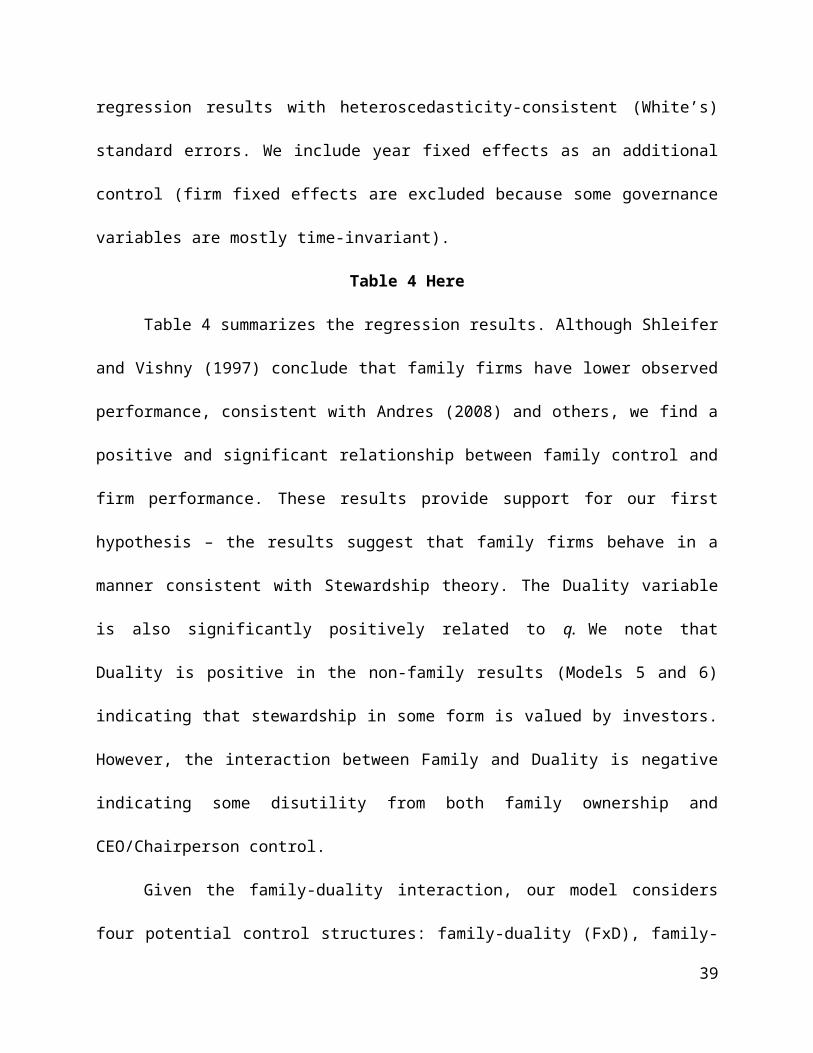
39
Cubbin, JS, and D Leech (1983). “The Effect of Shareholding Dispersion on the Degree of Control in British Companies: Theory and Measurement.” The Economic Journal 93: 351-369.
Cummins, JD, and MA Weiss. “Analyzing firm performance in the insurance industry using frontier efficiency methods.” Working paper. Wharton Financial Institutions Center, 1998.
Cummins, JD, X Xie (2013). “Efficiency, productivity, and scale economies in the U.S. property-liability insurance industry” Journal of Productivity Analysis 39(2): 141-164
Damordian, A. (2009) “Valuing Financial Services Firms” published April 2009; Viewed on January 11, 2016 people.stern.nyu.edu/adamodar/pdfiles/papers/finfirm09.pdf.
Davis, G (2005). New Directions in Corporate Governance. Annual Review of Sociology 31: 143-162.
Demb, A and FF Neubauer (1992). The corporate board: Confronting the paradoxes. Long Range Planning 25(3): 9-20.
Denis, DJ, DK Denis, and A Sarin (1997) “Agency Problems, Equity Ownership, and Corporate Diversification” The Journal of Finance 52(1): 135-160
Doherty, N (1981). “The measurement of output and economies of scale in property-liability insurance.” Journal of Risk and Insurance 48(3): 390-402.
Donaldson, L, and JH Davis (1991). Stewardship Theory or Agency Theory: CEO Governance and Shareholder Returns. Australian Journal of Management, 16(1): 49–64.
Easley, David, Nicholas M. Kiefer, Maureen O'Hara, and Joseph B. Paperman (1996) “Liquidity, Information, and Infrequently Traded Stocks” Journal of Finance (4).
Fahlenbrach, R, RM Stulz (2009). “Managerial ownership dynamics and firm value” Journal of Financial Economics 92(3): 342–361
Finkelstein, S, and RA D’Aveni (1994). CEO Duality as a Double-Edged Sword: How Boards of Directors Balance Entrenchment Avoidance and Unity of Command. Academy of Management Journal 37(5): 1079-1108.
Firer, S and SM Williams (2003) "Intellectual capital and traditional measures of corporate performance", Journal of Intellectual Capital 4(3): 348 - 360
Fukuyama, F (1995). Trust: The social virtues and the creation of prosperity. New York, NY: Free Press.
Gillan, Stuart L (2006) “Recent developments in corporate governance: an overview” Journal of Corporate Finance 12: 381-402.
Habbershon, TG, and ML Williams (1999). A resource based framework for assessing the strategic advantages of family firms. Family Business Review 12: 1-25.
Holderness, Clifford G.; Randall S. Kroszner; and Dennis P. Sheehan (1999). “Were the Good Old Days That Good? Changed in Managerial Stock Ownership Since the Great Depression.” Journal of Finance LIV(2): 435-469.
Huang, L, T Hsiao and GC Lai (2001). Does Corporate Governance and Ownership Structure Influence performance? Evidence from Taiwan Life Insurance Companies.” Journal of Insurance Issues 30(2): 123-151.
Jensen, MC and WH Meckling (1976). Theory of the firm: Managerial behavior, agency costs and ownership structure. Journal of Financial Economics 3: 305–360.
John, TA (1993) Accounting Measures of Corporate Liquidity, Leverage, and Costs of Financial Distress Financial Management 22(3): 91-100.
Joskow, PL (1973). Cartels, Competition and Regulation in the Property-Liability Insurance Industry. Bell Journal of Economics and Management Science 4(2): 375–427
Kennedy, P (2008). A Guide to Econometrics. Malden, MA: Blackwell Publishing.Klein, P, D Shapiro and J Young (2005). Corporate Governance, Family Ownership and Firm
Value: the Canadian evidence. Corporate Governance 13(6): 769-784.

40
Lamm-Tennant, J and L Starks (1993). Stock Versus Mutual Ownership Structures: The Risk Implications. Journal of Business 66: 29-46.
Lang, L. H., and Stulz, R. M. (1993). Tobin's q, corporate diversification and firm performance (No. w4376). National Bureau of Economic Research.
Lang, LHP, RM Stulz and RA Walking (1989). Managerial Performance, Tobin’s Q, and the gains from successful tender offers. Journal of Financial Economics 24: 137-154.
La Porta, R, F Lopez-de-Silanes, A Shleifer and R Vishny (1998). Law and Finance. Journal of Political Economy 106: 1113- 1155.
Larcker, DF, SA Richardson, and İ Tuna (2007) “Corporate Governance, Accounting Outcomes, and Organizational Performance” The Accounting Review 82(4): 963-1008.
Lee, SJ, D Mayers, and C Smith (1997). Guaranty Funds and Risk-Taking: Evidence from the Insurance Industry. Journal of Financial Economics 44: 3-24.
Lehmann, E, and J Weigand (2000). Does the Governed Corporation Perform Better? Governance Structures and Corporate Performance in Germany. European Finance Review 4(2): 157-195.
Liebenberg, AP, and DW Sommer, (2008), “Effects of Corporate Diversification: Evidence From the Property-Liability Insurance Industry,” Journal of Risk and Insurance, 75: 893–919.
Main, BGM, CA O’Reilly, and J Wade (1993). Top Executive Pay: Tournament or Teamwork? Journal of Labor Economics 11(4): 606–628.
Marris, R (1963). A Model of the ‘Managerial’ Enterprise. The Quarterly Journal of Economics 77(2): 185–209.
Mayers, D, and CW Smith, Jr. (1992). Executive Compensation in the Life Insurance Industry. Journal of Business 65(1): 51–74.
Mehran, Hamid (1995) “Executive compensation structure, ownership, and firm performance Journal of Financial Economics” 38(2): 163–184
Miller, D, and I Le Breton-Miller (2003). Challenge versus advantage in family business. Strategic Organization 1(1): 127–134.
Miller, D, and I Le Breton-Miller (2006). Family Governance and Firm Performance: Agency, Stewardship, and Capabilities. Family Business Review 19(1): 73-87.
Morck, R, A Shleifer and RW Vishny (1988). Management Ownership and Market Valuation: an Empirical Analysis, Journal of Financial Economics 20: 293-315.
Morck, R, and B Yeung (2003). Agency problems in large family business groups. Entrepreneurship Theory and Practice 27: 367–382.
Molz, R (1988). Managerial domination of boards of directors and financial performance. Journal of Business Research 16(3): 235–249.
Nickell, S, D Nicolitsas and N Dryden (1997). What Makes Firms Perform Well? European Economic Review 41: 783–796.
Nourayi, MM, and SM Mintz (2008). Tenure, firm's performance, and CEO's compensation. Managerial Finance 34(8): 524-536.
Pound, J (1991). Proxy voting and the SEC: Investor protection versus market efficiency. Journal of Financial Economics 29(2): 241-285.
Rechner, PL, and DR Dalton (1991). CEO duality and organizational performance: A longitudinal analysis. Strategic Management Journal 12(2): 155-160.
Saez, E, and G Zucman (2015). Wealth Inequality in the United States since 1913; Evidence from Capitalized Income Tax Data. Quarterly Journal of Ecnonomics 131(2): 519-578.
Scheifer, A, and RW Vishny (1997) ‘A survey of corporate governance’ The Journal of Finance 52(2): 737-783.
Schulze, WS, MH Lubatkin, RN Dino and AK Buchholtz (2001). Agency Relationships in Family
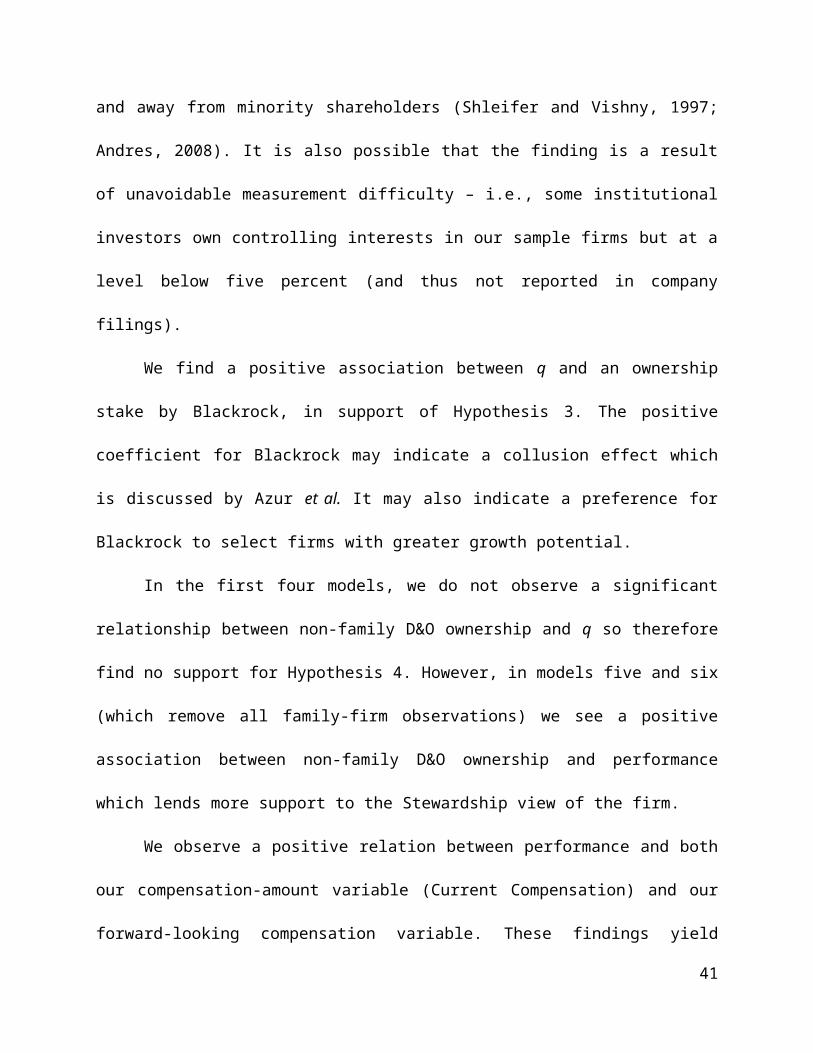
41
Firms: Theory and Evidence. Organization Science 12(2): 99-116.Wooldridge, JM (2013). Introductory Econometrics: A Modern Approach. Mason, OH: South-
Western Cengage Learning.Yeh, Y, T Lee and T Woidtke (2001). Family Control and Corporate Governance: Evidence from
Taiwan. International Review of Finance 2(1-2): 21-48.Zahra, SA (2005) Entrepreneurial Risk Taking in Family Firms. Family Business Review 18: 23-40