Embed Size (px)
Citation preview

This paper can be downloaded without charge at:
The Fondazione Eni Enrico Mattei Note di Lavoro Series Index: http://www.feem.it/Feem/Pub/Publications/WPapers/default.htm
Social Science Research Network Electronic Paper Collection:
http://ssrn.com/abstract=993688
The opinions expressed in this paper do not necessarily reflect the position of Fondazione Eni Enrico Mattei
Corso Magenta, 63, 20123 Milano (I), web site: www.feem.it, e-mail: [email protected]
A Global Land Use and Biomass Approach to Reduce Greenhouse
Gas Emissions, Fossil Fuel Use and to Preserve Biodiversity
Arthur Riedacker
NOTA DI LAVORO 61.2007
JUNE 2007 CCMP – Climate Change Modelling and Policy
Arthur Riedacker, INRA Unité Mona

A Global Land Use and Biomass Approach to Reduce Greenhouse Gas Emissions, Fossil Fuel Use and to Preserve Biodiversity Summary
As average growth consumptions per capita and world population will continue to grow, the promotion of sustainable developments during the next half a century implies to take into account environmental aspects, local potentialities and futures changes in population as well climatic, economic and social factors. At the global level, land and fossil fuel availability per capita, capacity of absorption of greenhouse gas emissions are considered the most important environmental factors. Whereas at local levels are to be considered preservation or improvement of soil fertility, of water regimes, of quality of air, soil and water. Biodiversity must be taken into account at both levels to cope also with climate change. But as underlined by IPCC lead authors, up to now there is no tool available to deal with these issues in a comprehensive and adequate manner. A new tool, presented here, the Integrated Environmental Assessment (IEA) has therefore been developed. It takes into account all actions, from the sun to final services, in three stages: solar energy bioconversion and phytomass production at I; conversion of phytomass and non renewable resources into final products and waste disposal at II ; arrangement of products to meet final needs, such as nutrition, housing mobility etc. at III. IEAs start at the global level with the “GIEA” , the results of which are then to be confronted with constraints at local levels from “LIEAs”. This new tool can be used to identify impacts of technological changes in land management and to compare alternative practices better than with LCAs. It was used to analyze environmental impacts of technological changes between 1950 and 2000 in France, in wheat production at stage I. It appeared that not only yields, but also the primary mitigation potential (PMP) per hectare have been multiplied by 4, whereas the net primary energy gain per ha has been multiplied by 3.2. Besides this, 14,5 Mha (the area of the French forest about a quarter of France) land use change could be avoided; in the case of deforestation this would have led to the emission of more than 4 billion tons of CO2. Lessons are drawn from the past and for the next fifty years: In developed and industrialized countries, alternative managements of land and increased use of non food phytomass can and should be envisaged. In Sub-Saharan Africa population is expected to double during the next 50 years and soil fertility is drastically decreasing; agricultural practices are no longer sustainable. If no changes appear in agriculture, forests and GHG emission from deforestation as well as biodiversity are threatened by further and inevitable land use change. Increasing yields per hectare should therefore become the priority; it would at the same time increase food security, improve mitigation and adaptation to climate change, help to combat deforestation and desertification, better preserve biodiversity, and ultimately also allow more bioenergy production: This would improve the food security and at the same time help to achieve the objectives of the three main UN environmental conventions and of the UN Millennium Goal. Keywords: Greenhouse Gas Emission, Fossil Fuel, Biodiversity
JEL Classification: Q23, Q27
This paper was presented at the Workshop on “Climate Mitigation Measures in the Agro-Forestry Sector and Biodiversity Futures”, Trieste, 16-17 October 2006 and jointly organised by The Ecological and Environmental Economics - EEE Programme, The Abdus Salam International Centre for Theoretical Physics - ICTP, UNESCO Man and the Biosphere Programme - MAB, and The International Institute for Applied Systems Analysis - IIASA.
Address for correspondence: Arthur Riedacker INRA Unité Mona 63 Bd de Brandebourg 94205 Ivry Cedex France E-mail: [email protected]

2
A global land use and biomass approach to reduce greenhouse gas emissions and fossil fuel use, and to preserve biodiversity
Arthur Riedacker INRA Unité Mona
63 Bd de Brandebourg 94205 Ivry Cedex France [email protected]
Abstract
As average growth consumptions per capita and world population will continue to grow, the total world consumption will continue to increase. The promotion of sustainable developments during the next half a century implies therefore to take into account environmental aspects, local potentialities and futures changes in consumption, climatic, economic and social conditions. At the global level the three most important environmental factors to be considered, per capita, are (1) land availability, (2) fossil fuel availability and the (3) capacity of absorption of greenhouse gas emissions. Whereas at local levels are to be considered preservation or improvement of soil fertility, of water regimes, of quality of air, soil and water. Biodiversity must be taken into account at both levels to cope also with climate change. But as underlined by IPCC lead authors, up to now there is no tool available to deal with these issues in a comprehensive and adequate manner. A new tool, presented here, the Integrated Environmental Assessment (IEA) has therefore been developed: It takes into account all actions, from the sun to final services, in three stages: solar energy bioconversion and phytomass production at I; conversion of phytomass and non renewable resources into final products and waste disposal at II ; arrangement of products to meet final needs, such as nutrition, housing mobility etc. at III. IEAs start a the global level with the “GIEA” , the results of which are then to be confronted with constraints at local levels from “LIEAs”. This new tool can be used to identify impacts of technological changes in land management and to compare alternative practices better than with Life Cycle Analysis (LCAs). It was used to analyze environmental impacts of technological changes in wheat production, at stage I, between 1950 and 2000 in France. It appeared that not only yields, but also the primary mitigation potential (PMP/ha ) per hectare have been multiplied by 4, whereas the net primary energy gain per ha has been multiplied by 3.2. Moreover, 14,5 Mha (the area of the French forest about a quarter of France) land use change could be avoided; in the case of deforestation this would have led to the emission of more than 4 billion tons of CO2. Lessons are drawn from the past and for the next fifty years: In developed and industrialized countries, alternative managements of land and increased use of non food phytomass can and should be envisaged. In Sub-Saharan Africa population is expected to double during the next 50 years and soil fertility is drastically decreasing; agricultural practices are no longer sustainable. If no changes appear in agriculture, forests and GHG emission from deforestation as well as biodiversity are threatened by further and inevitable land use change. Increasing yields per hectare should therefore become the priority; it would at the same time increase food security, improve mitigation and adaptation to climate change, help to combat deforestation and desertification, better preserve biodiversity, and ultimately also allow more bioenergy production: This would improve the food security and at the same time help to achieve the objectives of the three main UN environmental conventions and of the UN Millennium Goal.
Résumé La croissance de la consommation par habitant et de la population mondiale se poursuivant, la consommation totale continuera à augmenter. La promotion du développement durable au cours du prochain demi siècle implique donc de prendre en compte les impacts environnementaux, les augmentations de consommation, les changements climatiques et l’évolution des facteurs socio-économiques. Au niveau planétaire (1) la disponibilité en terres, (2) en énergies fossiles et la (3) capacité d’absorption des émissions de gaz à effet de serre, par habitant, ont été considérés comme étant les trois facteurs environnementaux les plus important. Tandis qu’au niveau local c’est la préservation ou l’amélioration de la fertilité des sols, des régimes hydrique, de la qualité de l’air, des sols et des eaux qui doivent être pris en compte. La biodiversité doit être prise en compte aux deux niveaux pour aussi faire face aux changements climatiques. Mais comme le soulignèrent les auteurs du GIEC, jusqu’ici il n’y a pas d’outils permettant de traiter de manière globale et adéquate de ces questions. C’est pourquoi une nouvelle méthode présentée ici, l’Evaluation Environnementale Intégrée (EEI), a été développée: Elle comprend, en allant du soleil aux services finaux, trois étapes distinctes: I, la bioconversion de l’énergie solaire et la production de phytomasses ; II, les conversions des phytomasses et des ressource non renouvelables en produits finaux ainsi que l’élimination des déchets; III, les arrangements dans l’utilisations des produits pour satisfaire les besoins finaux, la nutrition, le logement, la mobilité, la santé etc. Les EEI pour le développement durable commencent par le niveau planétaire, les EEPI, et les résultats de ces dernières sont confrontés ensuite avec les contraintes locales résultant des évaluations locales des EELI. Ce nouvel outil permet, bien mieux que les Analyses de Cycles de Vie, d’identifier les

3
impacts environnementaux des changements technologiques dans la gestion de l’espace rural et de comparer des pratiques ou des évolutions alternatives. Il est utilisé ici au niveau I, pour analyser les impacts des changements, entre 1950 et 2000, dans la production du blé en France. Durant cette période non seulement les rendements, mais aussi le potentiel primaire de réduction des émissions de GES par hectare (PPRE/ha ) ont été multipliés par quatre, et les gains net d’énergie primaire par hectare par 3,2. Par ailleurs ces progrès ont permis d’éviter des changements d’utilisation des terres sur 14,5 millions d’hectares (l’équivalent de la superficie de la forêt française, environ un quart de la France), et donc d’éviter, dans l’hypothèse d’un défrichement, plus de 4 milliards de tonnes d’émissions de CO2. Des leçons du passé et pour les cinquante prochaines années ont été tirées: Pour les pays développés ou industrialisés des gestions alternatives de l’espace agricole de l’espace et des production accrues de phytomasses à des fins non alimentaires sont possibles et devraient être envisagées. En Afrique Sub-Saharienne où la population devrait doubler, où la fertilité des sols diminue dramatiquement, les pratiques agricoles ne sont plus durables; en l’absence de progrès technologiques les forêts, la biodiversité et les émissions de gaz à effet de serre sont menacées par de nouveaux changements d’utilisation des terres. L’augmentation des rendements devrait y devenir une priorité; cela augmenterait simultanément la sécurité alimentaire, l’atténuation des changements climatiques et l’adaptation à ces derniers, aiderait à combattre les déforestations, la désertification et à mieux préserver la biodiversité et finalement permettrait aussi de produire plus de bioénergie. Cela aiderait donc à accroître la sécurité alimentaire tout en atteignant les objectifs des trois grandes Conventions environnementales et du Millénaire des Nations Unies.
Introduction Climate change mitigation and adaptation, phytomass production on agricultural or forestland for food, bioproducts and bioenergy as well as biodiversity preservation are closely linked. This paper presents a new tool to allow a more integrated approach to assess uses of phytomass and land management – land use and land use change- to promote more sustainable developments as defined in the UN Report (Brundtland 1987) and to achieve the objectives of the three UN Global Environmental Conventions, on Climate Change, Desertification and Biodiversity and of the Millennium Goal.
Up to now, as underlined by IPCC lead authors of the 4th Assessment Report, there is no tool available do deal with these issues in a comprehensive and adequate manner. Moreover approaches by sector, or limited to local sustainable development, can sometimes end up with recommendations contradictory with the promotion of sustainable development. Global and local considerations are to be taken into account. We developed therefore a new tool, the “Integrated Environmental Assessment” (IEA), which takes into account environmental requirements for both global and local sustainable development. It has therefore a two step approach ; a global approach or “Global Integrated Environmental Assessments” (“GIEA”) which is to be considered first, and local approaches, the “Local Integrated Environmental Assessments (“LIEAs”). Recommendations derived from the GEIA are to be confronted with local constraints and then integrated within local regional and global policies, practices, as well as in technological and scientific research and development programs. Integration with socio-economic considerations is also to be considered at various levels. Due to lack of space the latter aspect is however not considered here. 1/ PRESENTATION OF THE IEAs; GIEAs and LIEAs ,THE GLOBAL AND LOCAL INTEGRATED ENVIRONMENTAL ASSESSMENTS.
At the global level (1), due to further increase of consumptions per capita and further
population growth during this century, three major environmental constraints are to be considered; land availability per capita (1.1), fossil fuel availability per capita(1.2), climate change (e.g the capacity of the atmosphere to absorb greenhouse gases (GHG) (1.3). Mitigating climate change implies to stabilize, sooner or later, global GHG concentration in the atmosphere (IPCC 1996) and therefore to divide, sooner or later, the present level of anthropogenic GHG emissions by two at the global level; by 4 in industrialized countries such as France (Riedacker 2003, Radanne 2003, Boissieu 2006), and even more in countries like USA and Canada; developing countries are also to curb their emissions at a later stage. (Riedacker 2003)
Results of GEIAs are then to be completed with (2) “Local Environmental Integrated Assessments (“LEIAs”) where other constraints and requirements appear; preservation or improvement of quality of (2.1) soil fertility, of (2.2) water, of (2.3) air, and for (2.4).adaptation to new climatic conditions. Preservation of biodiversity is to be considered at both levels (3). It implies

4
to reserve more land, for contiguous or non contiguous migration corridors, preferably along river sides, to cope with future climate change; for (3.1) preservation of specific ecosystems, plants and animals which are at risk; for (3.2) more diversified uses and land management, e.g. better integrated pest management (grassland, hedges or windbreaks, forestland wetlands etc.).
GIEAs are to take into account all steps, from the sun, or the underground, up to final human needs. They have three stages; I, II and II bis, and III. (fig 1 to 3) This is briefly illustrated here. But we concentrate here on stage I of the IEAs, as this is the most relevant part to land use issues. Moreover assessments at stage 2 can be made by essentially using classical Life Cycle Analysis (LCAs). Due to space limitation this method is also not compared here with other approaches such as LCAs or Ecological footprints etc. This is done in a more complete description of the approach which is to appear elsewhere (Riedacker submitted for publication) and which has been made in a report submitted to ADEME, the French Agency for Environment and Energy Management (Riedacker 2006). The tool presented here can be used to compare land use, energy and mitigating efficiencies of two (i and j) or more options, with various types of land use and land use change (fig 2 to 6).
Fig. 1 Global Environmental Integrated Assessment (GIEA), from the sun to final use at the
global level Stage I : Solar energy bioconversion - Stage II : Conversion of phytomass and non renewable products into final products and energy carriers - Stage III : Arrangements of final products to meet final needs.
Stage I This stage is characterized by the conversion of solar energy by photosynthesis which is a unique and common feature of all ecosystems and therefore of all rural areas1. It ends up with harvested phytomass (or vegetable biomass2) which can be harvested by men or animals, at the border of the parcel, but ends before any conversion and transportation to factories (level 1). At the end of stage I, at level 1, we may consider partial environmental assessments taking into account all energetic inputs and GHG emissions generated by phytomass production as well as outputs( harvested phytomass) and their Primary GHG Mitigation Potential .
1 We could also introduce a stage Ibis, for various direct conversion of solar energy (hydro, wind, PV, thermal solar energy …) and for various uses. This aspect is not detailed here as the impact on land requirement for these productions is often negligible. 2 This distinction is made to underline that other types of biomass, animal biomass as well as animal, municipal and industrial waste, belong to stage II. For similar reasons we do not use the classical expression “at the gate of the farm”, which would include cattle and animal waste.

5
Main parameters to be considered at stage I Capital are used for total production, for instance for a type of crop of a country or a region, and minuscule for data per ha or per ton of product, at stage i and j : (1.1) Production
• Total production of a type of crop, Qi and Qj, at stage i and j. • Yield (ton of dry matter or protein per ha), qi and qj, at stage i and j (1.2) Land use; total land use, Si and Sj at stage i and j. • Land use intensity: land requirement per ton of product . (=1/yield) • Real land use change per ton of product (rluc, and rlucj/i = sj-si) or for the whole
production change (RLUCj/i = Sj-Si) (fig. 2 & 3) • Virtual land use at j to produce Qj with the technological efficiency of situation i
VLUCj/i= Qj*si - Sj
• Avoided or (additional3) land use change between i and j (AVLUC j/i), is the additional land which would have been necessary for the production Qj at j with the land use efficiency at i, e.g. without technological improvements. [ AVLUCj/i = VLU j/i<- Sj ] (cf. fig 3)
PRODUCT
lucj2000/1950 s200
s1950
SITUATION in 1950S1950 = 0.55 ha = area to produce one ton of grain
( + 0.09 ha for draft animal)
LAND USE CHANGE 2000/1950 Change in land requirement, per ton of grain, between 1950 and
2000luc2000/1950 = - 0.41 ha
(- 0.5 ha when taking into account land for draft animals in 1950)
SITUATION in 2000 S2000= 0.14 ha = area to produce one ton of grain
Fig. 2 Land use intensity per ton of grain, for wheat production in France in 1950 (situation i) and 2000 (situation j), and Land use change between i anf j
(1.3) Energy (cf . table 1) • Total Energy Input in cropland, per ha (TEI/ha) • Primary Energy content (PEC) of harvested phytomass: dry ligno-cellulosic phytomass and
vegetable oil have an average energy content of respectively 0.4 toe/ton and 0.9 toe/ton. • Primary Energy Output per hectare: PEO/ha = primary energy in harvested phytomass /ha • Net Primary Energy Gain per hectare: NPEG/ha = (PEO/ha-TEI/ha). This reflects the
efficiency of solar energy conversion into food and non food phytomass per hectare. Only this factor is to be considered here and not the PEO/E ratio, which is relevant only at stage II4.
• Energy Intensity (EI) ; energy necessary to produce one ton of product.
3 When yields decrease between i and j for instance with more extensive production systems, more land will be necessary at j to produce for instance the same amount of grain as at i. 4 But as not all fossil energy and not all biomass are equivalent; solid fossil fuel such as coal and lignite may be distinguished from liquid fuels (petrol, vegetable oil). At stage II, ligno-cellulosic phytomass may be converted more or less efficiently , in plants of various size, into liquid biofuels for instance by enzymatic hydrolysis or by thermal conversion, into methanol, Fisher-Tropsch synthetic fuel etc... The energy requirement for transportation of phytomass and of such conversion is only taken into account at stage II, which is not detailed here.

6
S2000
S1950
AVLU2000/1950
SITUATION in 1950 S1950 = 4,26 Mha= Total land to
produce 7,79 Mt of grain ( 4,94 Mha with land for draft
animal)
REAL LAND USE CHANGE between 1950 and 2000 RLUC2000/1950 ~ 0
Virtual land use in 2000 with the technological efficiency of 1950VLUC2000/1950= 19,33 Mha
AVOIDED LAND USE CHANGE AVLUC2000/1950~ 14,5 Mha
Virtual land use VLU2000/1950
RLUC
SITUATION in 2000 S2000 = 4,82 Mha Total land to
produce 35,4 Mt of grain
Fig 3 Land use change, at the landscape level, for changes in wheat production in France, between 1950 and 2000.
(1.3) Mitigation efficiency Total GHG emissions from agriculture and forestry at level 1 include • (a) GHG Emissions from the Field: GHGEF =net biotic CO2 emissions resulting from carbon
stock changes in phytomass and soil organic matter5 (fig. 4), N2O emissions resulting from leakages in the nitrogen cycle6 and CH4 emissions mainly from irrigated rice cultivation, but also from the spreading of manure. (cf. table 1 and 2)
• (b) GHG Emissions from Inputs; GHG EI= emissions from inputs , such as CO2 from fuel for tractors, from mineral fertilizer production and transport, emissions from II bis (see below) and from organic manure production at stage II (CH4, and sometimes also N2O, from enteric digestion, manure production and management, fertilizer production7)
• (c) The “Primary Mitigation Potential” of GHG emissions, per ton of dry phytomass: “PMP/t “of harvested dry matter =- 1,28 tCO2eq8, as one ton can potentially avoid that amount of GHG emissions when replacing petrol.
• (d) The “Primary Mitigation Potential” per ha of a crop: PMP/ha = PMP/t*q – (GHG EF- GHGEI), in tCO2eq/ ha (ton of CO2 equivalent per ha) for a crop with q ton of harvested dry phytomass per ha.
The “Primary Mitigation Potential” that we introduced has the same function as the “Primary Energy” for the energy sector. The latter reflects potentialities of a fuel (oil, coal, natural gas, biomass) to deliver a certain quantity of energy. The final service, the final useful energy and the final mitigation effect can however only be obtained at the end of the conversion chain of stage II, at level 2.
5 Carbon content is generally 50 % ot the dry matter for wood and 45% for ligno-cellulosic products, such as straw or grain; As 1 ton of carbon generates 3,67 tCO2, 1 ton of dry wood stores the equivalent of 1,83 tCO2 and 1 ton of dry straw only the equivalent of 1.65 tCO2. 6 According to IPCC Guidelines default emissions factors to be adopted to determine for instance quantities of nitrogen inputs converted into N2O ; this emission factor was 1,25 % before 2006 and 1% in the recent “2006 IPCC Guidelines “ 7 The effect of all these emissions and absorptions of GHG are calculated by using IPCC Global Warming Potentials (GWP) and methodologies (IPCC 1996 and 2001). GWP to be adopted up to 2012, under the UNFCCC, are respectively 21 tCO2eq for CH4 and 310 tCO2eq for N2O . Recent IPCC recommended slight changes ; 23 tCO2eq for CH4 and 296 tCO2eq for N2O 8 Emissions per toe of fossil fuel generated by petrol, natural gas or coal are respectively 3.2 tCO2, 2.4 tCO2, 4 tCO2. (GBE 2006).Without other specification it is assumed that biomass replaces oil, and that therefore one ton of harvested and efficiently used dry phytomass can potentially avoid the emission of 3.2 * 0.4 = 1,28 tCO2. Harvested phytomass may also replace oil, natural gas or coal. This can be determined only at stage II. The ultimate avoided emissions depend also on energy consumption and of GHG emissions during transportation, which may be quite variable and depend on transport distances and type of transportation etc. (GBE 2006). Moreover if anaerobic fermentation of vegetable biomass is also avoided, avoided GHG emissions are more important. This is not considered here.

7
Land use change : conversion Land use change : conversion ofof grasslandgrassland
andand forestlandforestland intointo croplandcropland
DeforestationDeforestation, ,
Phytomass
Soil organicmatter
Fig. 4 French land use and average carbon stocks, in cropland, grassland and forestland.
Carbon stock changes resulting from land use changes can be calculated with such data. When land use take is taking place in other countries, for instance in the tropics, carbon stock changes are different and may be higher.
Changes in net energy budgets at regional or national level are to take into account changes of total phytomass production; that means also changes in phytomass production due to real land use changes and avoided land use changes. We had to introduce here also some other indicators relevant to land use (increasing or decreasing yields per ha) and land use change (deforestation and aforestation, conversions of grasslands etc.).
• The GHG payback period of land use change” is the number of years necessary to pay back the carbon stock decrease (in phytomass and soil organic matter) resulting from land use change (deforestation or conversion of grasslands into cropland) taking into account the difference of primary mitigation potential of the cropland and of the forest (or of the grassland) which has been converted. Sometimes, as we shall see further down, when the cropland is insufficiently productive no payback may be possible. • The “Period of GHG Mitigation Superiority by avoiding land use change with a doubling of cropland yields per ha” is the period during which to double total production, doubling yields of croplands is more friendly for the climate than doubling the area of cropland through deforestation or conversion of grassland into cropland. Its length depends on the type of avoided land use change and on the technological progress which can still be achieved.
The latter parameters are particularly important in the present debate on reducing deforestation under the climate change negotiations (COP12 and COP 13 cf. UNFCCC), and in particular for Africa.
Stage II This stage is characterized by all conversions, of phytomass and non renewable products from the underground, into various products by animals and/or by various industries. It includes recycling of materials and products, and ends up with products and waste disposal (for instance in municipal landfills, in underground storage of CO2 in CCS (CO2 capture and storage). Carbon stocks in wood products are taken into account at this level. Stage II ends up at level 2, with products (calories and proteins) and other energy and bioproducts (including thermal or electric energy, liquid biofuel for transportation and mobility etc.). Energy requirements and GHG emissions for each type of products (per ton of product or unit of energy or protein etc.) are expressed here by taking into account all fossil energy consumption and GHG emissions from stage I and II, as well as energy consumption and GHG emission at stage I and Stage IIbis. Land requirements at level 2 depend on phytomass consumptions at stage I.

8
A stage II bis has been introduced under II to distinguish indirect fossil fuel consumptions and GHG emissions at stage I, II or III. It contains three subsets: (a) Direct energy consumptions and GHG emissions (e.g. for fertilizer and other agrochemical production, fuel for tractors etc.. for stage I), (b) energy for transportation of products (e.g. for transportation of fertilizer and other inputs up to the field for stage I, all transportation of phytomass from the border of the parcel up to the end user, from I to III; (c) Indirect energy consumptions and GHG emissions at stage I and II;9 Information related to this stage II bis are usually scarce. But they may sometimes be important, and even dominant, when long distance transport is involved.10
Stage III
At this stage we no longer consider products but services; nutrition, housing, mobility, health, education etc… Product from stage II may be arranged in different ways to meet mainly the basic needs per capita; e.g. calories and proteins in the diet11, heating of a house or a flat12 energy for mobility etc. For mobility it is important to consider not only the amount of energy consumed per capita, but also land and fossil fuel requirement and GHG emissions for instance per 1000 km/year13.
Assessments
At stage I bioconversion of solar energy is to be optimized: Production per hectare is to be maximised by taking into account, on one hand local ecological constraints and limits for local sustainable development, and on the other hand, final basic needs at stage III and availability of efficient and economically acceptable conversion technologies of phytomass and non renewable products. At stage II fossil fuel consumptions and GHG emissions are to be minimized: Conversions, including of phytomass by animal are therefore to become as efficient as possible. It should be noticed that livestock, and more generally animal phytomass consumption, is not considered in stage I, but at stage II, like any other conversion of phytomass or any non renewable product. Outputs/Inputs ratios (O/I) are here interesting tools to compare conversion efficiencies of various chains. Stage II bis may be very important, in particular when long distance transportations are involved. Without a correct analysis of that part of the system it may sometimes be impossible to make adequate recommendations and policies to promote global sustainable development. Final analyses are to take place at stage III and at level 3. This approach allows however also partial analysis, at the end of stage I at level 1, or at stage II at level 2 and comparisons of impacts on land requirement, on fossil fuel consumption and on net GHG emissions of various technological change, of crop change, of land use change, etc. In fig. 2 and 3 are presented theoretical approaches of impacts of various technological efficiencies for two typical human diets i and j. But final conclusions are to be assessed within the general framework.
9 for building, manufacturing of engines, etc. for stage I, for building of infrastructures (roads including forest and agricultural roads, railroads etc. for stage II, for building of factories, trucks, incinerators and various engines for stage II activities and capture and storage of CO2 from power plants or steal industries at stage II and II bis . 10 For instance energy consumption for commercial production of dessert apple (with pesticides and fertilizer) is considered to be about 0.5 MJ/kg ( or 0,5 GJ/t) , (Stage I and stage IIbis-a), whereas the average energy costs for transportation (Stage II bis-b) of apples consumed in the United Kingdom ranges from 0.1 to 0.25 MJ/kg, when produced in the country, and from 2,5 to 2,6 MJ/kg, (about 84% of the total energy cost), when imported from the US (Jones 2002). Tomato energy production costs in heated greenhouse in Sweden were found to be as high as 58.3 MJ/kg, whereas unprotected production in Spain required but 1.5 MJ/kg. The energy consumption of transport and distribution of tomatoes from mainland Spain to Sweden is 3.9 MJ/kg with truck, and, respectively by ship or plane, 2.2 MJ/kg or 50 MJ/kg from the Canary Island to Sweden, [Carlsson (1997 and 1998) quoted in Jones (2002)]. 11 Which can be satisfied with more or less land (calories from cereals and other phytomass or calories from meat) 12 With more or less energy (in particular of fossil energy) more or less land (if heated with waste or phytomass) depending on insulation, percentage of renewable energy inputs which do not require significant land etc 13 With various standardized cars which may use more or less efficiently various types of fuel.

9
Fig. 5 Detail of a Global Integrated Environmental Assessment for per capita human diet.(cf. fig. 3)
Fig. 6 Results of an assessment at stage 3 for two typical human diet : Comparison of land and fossil energy requirements, and of GHG emissions for the daily diet (for instance 3000 kcal /day) under two situations i and j, with different land use (cropland, grassland and forest land for cooking energy), and different fossil fuel consumptions, for instance with more or less intensive production systems, with various amounts of fossils fuel inputs in fields, various proportions of animal proteins, high or low transportation distances, more or less energy consumption for conversion, storage and cooking and various waste disposal systems etc. Some preliminary data for such analysis have been given recently (Riedacker and Racapé 2006). 3 APPLICATION OF GIEAs, AT LEVEL 1, FOR CHANGES BETWEEN 1950 AND 2000 IN WHEAT PRODUCTION IN FRANCE. Wheat is one of the most important agricultural crop, not only for food, but also for fodder and for industries (e.g. a starch for paper production). It can also become a major crop for heat production (as already in Denmark) and for liquid biofuel production, [either just from starch (first generation of liquid biofuels production),or through complete conversion of harvested phytomass by enzymatic hydrolysis of ligno-cellulosic material, or through Fisher-Tropsch conversion (second generation of liquid biofuels)]. Actual total, and per hectare, related land use, energy and GHG mitigation budgets for wheat production in France between 1950 and 2000 have been used (Fig 8 and table 1 and 2). Details of calculations will appear elsewhere (Riedacker and Gayet in preparation).

10
Fig. 7: A partial “Global Integrated Environmental Assessment” at level 1,for wheat production.
Fig. 8: Evolution of wheat grain yield in France between 1950 and 2000 in France and Ile de France (the region with the highest yields) (in quintal or 100 kg per ha, averages 5 around each year) Notice that yields have been multiplied by 4
Table 1 Average energy and GHG budgets per ha of wheat production in France in 1950 at level 1 (average yield of grain = 1.83 t/ ha/year )
Inputs unit/ha Energy GHG emissions GJ/ha % GJ/t teqCO2/ha % tCO2 eq /t
Fertilizer N P K
27 kg*
70 70
2.65 1.17 0.59
25% 11%
1.45 0.64 0.32
0;54** 0.0896 0.0448
49%
0.295 0 .049 0.024
Herbicide- Pesticide 1 kg 0.2 0.01 0.1 0.005 Human work
Draft animal work Fuel for tractor etc.
100l
0.025* 0.08**
4.1
38%
0.01 0.044 2.2
0 .214 0.32
15%***
23%
0 .117 0.17
Various tools & farm building
- 1.9 18% 1 0.16 0.09
Total 10.71 GJ/ha 0.26t toe/ha
5.77 GJ/t 0.14toe/t/
1.39t CO2eq/ha
0.76t CO2eq/t
* N Fertilizer including 7.5kg of N from manure. ** Emissions of N2O in tCO2eq /ha, from the factory , assuming that only urea, and no nitrate, is used; 0.204 from energy (manufacturing and transport); 0,0336 for N2O from the field ; *** Methane from draft animals
1020304050607080
Ile-de-France
France
18,24q/ha
73,34q/ha

11
Table 2 Average energy and GHG budgets per ha for wheat production in France in 2000 (average yield of grain 7,3 t per hectare), at level 114
Inputs unit/ha Energy GHG emissions GJ/ha % GJ/t teqCO2/ha % tCO2 eq /t
Fertilizer N P K
175kg 64 kg 77kg
10.26 0.67 0.65
52%
1.4 0.09 0.08
2.48* 0.064 0.064
80% 0.338 0.0087 0.0087
Herbicide - Pesticide 4,9 kg 1 0.14 0.064 0.0087 Fuel for tillage with
tractor etc. 93l 3.7 20% 0.50 0.288 0.0392
Various tools & farm building
- 2.3 0.31 0.16 0.0218
Total 18.58 GJ/ha 0.45 toe/ha
2.52 GJ/t 0.06toe/t
3.12 teqCO2/ha
0.43 t CO2eq/t
* N Fertilizer in teqCO2eq /ha ; 0.8 from energy (manufacturing and transport); 1.68 for N2O from the field ; *0 N2O from the factory, assuming that but urea, and no nitrate, is used MAIN CHANGES BETWEEN 1950 AND 2000 (Table 3 and 4 ) Land Use
Between 1950 and 2000 total wheat grain production on an almost constant total land area of 4,8 Mha15, jumped from 7,79 Mt in the 1950s to 35,4Mt in 2000. Total production was multiplied by 4,5, yields per ha by 4 (from 1.83 t/ha to 7.34 t/ha) whereas 0,68 Mha of additional land became available for this crop by replacing draft animals with engines.
During this period land use efficiency in wheat production has been multiplied by 4 ; to produce 1 t of grain 0.55 ha were necessary in 1950 (0.64 with draft animals) and only 0,14 ha in 2000. Table 3 Changes for wheat production in France, between 1950 and 2000, in energy and GHG budgets per ha and per ton of grain
Energy budgets in toe 1950 2000 Changes
Energy consumption/ha 0.26 0.45 + 0.19 Net Energy Gain /ha * 1.2 3.9 + 2.7 Net Energy Gain /ton of grain 0.63 0,54 -0.09
Average GHG budget tCO2eq Gross emissions /ha of wheat 1.39 3.12 + 1.73 Gross emissions /t of grain* 0.76 0.43 - 0.33 Primary Mitigation Potential /ha* for wheat
-2.32** -9.52** -7.20**
(Primary Mitigation Potential” of the French forest /ha)
-4.95** -4.95**
*including grain and straw. ** supposed constant here
Table 4 Changes for wheat production in France, between 1950 and 2000, at the national level Energy budgets in Mtoe
1950 2000 Changes Energy consumption 1.08 2.14 + 1.06 Net gain * 6 21 15
GHG budget MtCO2eq National Gross GHG emissions 5.9 15 +9.1 “Primary Mitigation Potential”* -9.88** - 45.88** -36** *with grain and straw ** The negative sign indicates here the mitigating effect of the crop
14 Energy consumption for stage Ibis , is therefore 14,88 GJ/ha 15Abbreviations: M = million ; Mha = million hectares, Mt =million tonnes - Mtoe = million tonnes of oil equivalent–M CO2teq = million tonnes of carbon dioxide equivalent.

12
MAIN CONCLUSIONS FROME THE GLOBAL INTEGRATED ASSESSMENTS (IEAs)
Changes in energy budgets • Energy consumption raised from 0.26 toe/ha to 0.45 toe/ha. • Net energy gain [by taking into account the primary energy content of phytomass (grain and
straw)] per ton of wheat slightly decreased, from 0.63 toe/t to 0.54 toe/t. But due to yield increase, the net energy gain per ha increased by 2.8 toe/ha, from 1.2 toe/ha in 1950, to 3.95 toe/ha in 2000.
• National annual primary energy consumptions for wheat production doubled during this period, and jumped from 1.08 Mtoe in 1950 to 2.14 Mtoe in 2000, but the net total annual primary energy output rose from 6 to 21 Mtoe, and increased thus by 15 Mtoe/year. The difference in net annual primary energy gain between 2000 and 1950 is therefore about 14 Mtoe/year.
• Straw production alone increased by 14.5 Mt, from 8.4 Mt to almost 22.9 Mt. Thus the supplementary amount of primary energy in straw increased by 5.8 Mtoe /year during this period.
Changes in GHG emissions • Emissions per ton were divided by 1.77 ; from 0.76 tCO2eq/t they came down to 0.43 tCO2eq./t • Mean gross emissions per ha increased, from 1.39 tCO2eq/ha to 3.12 tCO2eq/ha • Gross emissions increased by 9.1 MtCO2eq, from 5.9 MtCO2eq to 15 MtCO2eq.; • The « primary mitigating potential » increased from -2.32 tCO2eq/ha in 1950 to -9.52 tCO2eq/ha
in 2000. (Negative signs indicate a mitigation potential as net emissions have positive signs or no sign)
• In 50 years the primary mitigating potential per ha, like yields, has been multiplied by 4. • Even without taking into account the energy in grain, the primary mitigating potential grew from
-1.14 tCO2eq/ha in 1950 to -2.86 tCO2.eq/ha in 2000. • At the country level the primary mitigation potential increased by 36 MtCO2.eq/year, from - 9.88
MtCO2eq. to – 45.88 MtCO2eq.. • By taking only into account the primary energy content of straw this potential increased by 8.73
M teqCO2., from - 4.86 M teqCO2. to – 13.59 M teqCO2.. It has been multiplied only by 2.7 • Due to technological changes in wheat production, the increase of total wheat production could
avoid 14.5 Mha of land use change, either forest or grassland and other cropland. This area is equivalent to the area of the French forest in year 2000 (fig. 3). The avoided land use change avoided the emission of 4.5 billion tonnes of CO2, or 42 times the annual emissions attributed to French agriculture in 1990 under the UNFCCC format16. With grassland conversion avoided emission would have been lower17.
• The payback period of deforestation with the primary mitigation potential (PMP) of wheat in year 2000 is 69 years18. In 1950 this period would have been infinite as the PMP of forest (- 4.95 tCO2eq/ha) was superior to the PMP of wheat ( - 2.32 tCO2eq/ha). In fact in 1950, if the main purpose would have been climate change mitigation, it would have been preferable to reforest wheat land. This is no longer the case to day.
• The “Period of GHG mitigation superiority by avoiding land use change with a doubling of cropland yields per ha”: For France, an increase and more efficient use of inputs with better wheat strains led to a fourfold increase of grain yield and a GHG emissions increase by 1.73 tCO2eq/ha/year (table 3). Doubling of yields would have only increased annual GHG by 0.87 tCO2eq/ha. The conversion of one hectare of French forest or grassland into cropland would release, on the average, respectively about 311 tCO2eq 19 and 91.5 tCO2eq/ha. In spite of increased
16 1ha of forest land converted into cropland looses on average 85 t of carbon (60 t from the removing the phytomass 25 t from cultivation of forest soils. (Cf .fig. 4) 17 25t of carbon are lost per ha instead of 85 t/ha 18 For wheat the PMP was -9.52 tCO2eq/ha in 2000 and only 2.32 in 1950. The average PMP of forestland was – 4.95 tCO2eq/ha . The payback period was thus 69 years [311/ (9,52- 4,95)] 19 More in the case of deforestation of equatorial forest which have higher total carbon stocks

13
GHG emissions, when previous wood and grass production are not taken into account, doubling cropland yields is more interesting than converting forestland or grassland into cropland during respectively more than 3.6 century and 1 century. When the PMP of wood or grass productions (at least 2.4 tCO2eq/ha/year) are also taken into account, this period becomes infinite.
The present study shows that when crop production is taken into account, increasing inputs, to increase yields, remains a beneficial option for climate change mitigation in spite of the fact that increasing inputs (in particular nitrogen) increases N2O emissions. (table 1 to 4). This must be underlined.. Changes with higher yields (90 quintal per ha):
• Land intensity is even lower in that situation (0.111 ha/t of grain) than for average yields obtained in 2000 (0.136 ha/t). This is important when taking into account land use changes and avoided deforestation, or aforestation, as for the same amount of grain production more land becomes available for other crops or even for aforestation. (cf. below)
• Net energetic gain per ha is then also higher (4.96 toe /ha instead of 3.97 toe /ha) and the PMP reaches -12.63 tCO2eq/ha instead of -9.58 tCO2eq/ha.
This can be explained by the fact that contrary to what happens at stage II, at stage I higher inputs increase efficiency of solar energy conversion by plants. In National GHG inventories under the UNFCCC, N2O emissions at stage 1, should therefore be distinguished from other GHG emissions from stage II and accounted separately as is already done for carbon stock changes. CONFRONTATION OF GIEAs WITH LIEAs But at the local level nitrate leaching has sometimes become excessive, and has to be diminished to reduce water contamination. Several options to achieve this should therefore be considered, however without reducing land use efficiency:
• Breeding high yielding wheat strains requiring less nitrogen and pesticide inputs: This is already an option explored by wheat breeders at INRA (Rolland et al 2006). Decreasing nitrogen inputs by 60 kg /ha (as well as pesticide applications), allows to still reach good or even high yields (7 to 8 t/ha). Moreover as these practices tend to reduce nitrogen applications in winter, when soils have excess of water, they may further reduce N2O emissions, which on saturated soils are higher per units of nitrogen input.
• Reduction of nitrate leaching; N2O emissions are probably well correlated with nitrate production. Therefore reduced nitrate leaching may also reduce N20 emissions. Bertrand et al. (2006) compared various wheat production systems in the Bassin Parisien in France; with and without a vegetable cover after the harvest of wheat, with or without mineral fertilizer inputs. They concluded that nitrate leaching, even from high yielding treatments, may have lower nitrate leaching than crops without such cover crops. They concluded also, like Rolland & al. (2006), that yields with organic farming were almost halved without livestock; from the point of view of land use efficiency this cannot be recommended, unless perhaps more nitrogen fixing species such as alfalfa or clover are used before wheat crops.
• Reduction of nitrification with inhibitors: According to Thomson (2006) from New Zealand, the use of eco-n inhibitors could reduce nitrate leaching in dairy farm by around 60% when applied in may and august. N2O emissions are also reduced and annual pasture production seems at the same time to increase by 10-15% .
• Use of nitrogen fixing species. Nitrogen can be provided by nitrogen fixing species such as alfalfa or clover. It is thought that crops after alfalfa can still have high yields with 50 unit lower nitrogen input /ha. This reduces the energy inputs for fertilizer manufacturing and transport. Alfalfa is also interesting for other reasons; it is a high yielding protein plant and has a higher territorial efficiency than soybean or colza; it may also protect some birds at risk: (Thiebaut et al. 2003), (Poncé-Hernandes (2006) and Bretagnolles and Houte (2005). It could also produce biomethane, which upgraded could become one of the most environmentally friendly biofuel for transportation (Ecotrafffic 1992 in Ventère 1995).
14
Biodiversity .
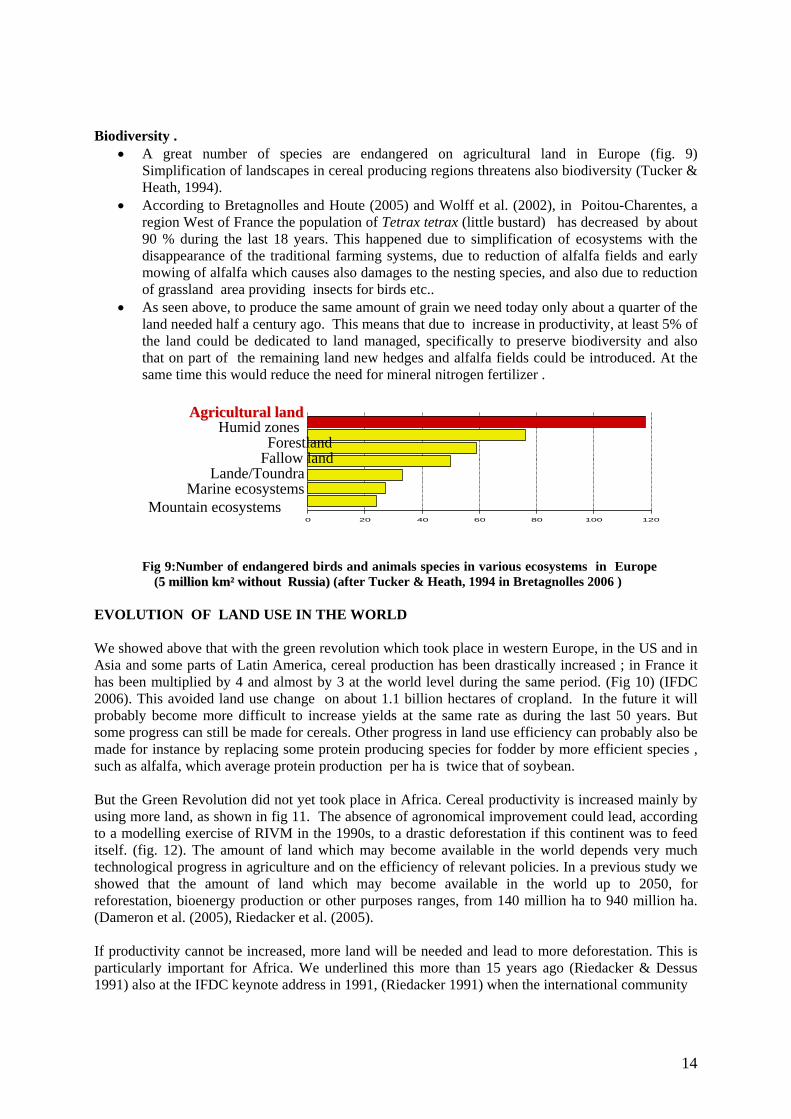
• A great number of species are endangered on agricultural land in Europe (fig. 9) Simplification of landscapes in cereal producing regions threatens also biodiversity (Tucker & Heath, 1994).
• According to Bretagnolles and Houte (2005) and Wolff et al. (2002), in Poitou-Charentes, a region West of France the population of Tetrax tetrax (little bustard) has decreased by about 90 % during the last 18 years. This happened due to simplification of ecosystems with the disappearance of the traditional farming systems, due to reduction of alfalfa fields and early mowing of alfalfa which causes also damages to the nesting species, and also due to reduction of grassland area providing insects for birds etc..
• As seen above, to produce the same amount of grain we need today only about a quarter of the land needed half a century ago. This means that due to increase in productivity, at least 5% of the land could be dedicated to land managed, specifically to preserve biodiversity and also that on part of the remaining land new hedges and alfalfa fields could be introduced. At the same time this would reduce the need for mineral nitrogen fertilizer .
Fig 9:Number of endangered birds and animals species in various ecosystems in Europe
(55 mmiilllliioonn kkmm²² wwiitthhoouutt RRuussssiiaa)) (after Tucker & Heath, 1994 in Bretagnolles 2006 ) EVOLUTION OF LAND USE IN THE WORLD We showed above that with the green revolution which took place in western Europe, in the US and in Asia and some parts of Latin America, cereal production has been drastically increased ; in France it has been multiplied by 4 and almost by 3 at the world level during the same period. (Fig 10) (IFDC 2006). This avoided land use change on about 1.1 billion hectares of cropland. In the future it will probably become more difficult to increase yields at the same rate as during the last 50 years. But some progress can still be made for cereals. Other progress in land use efficiency can probably also be made for instance by replacing some protein producing species for fodder by more efficient species , such as alfalfa, which average protein production per ha is twice that of soybean. But the Green Revolution did not yet took place in Africa. Cereal productivity is increased mainly by using more land, as shown in fig 11. The absence of agronomical improvement could lead, according to a modelling exercise of RIVM in the 1990s, to a drastic deforestation if this continent was to feed itself. (fig. 12). The amount of land which may become available in the world depends very much technological progress in agriculture and on the efficiency of relevant policies. In a previous study we showed that the amount of land which may become available in the world up to 2050, for reforestation, bioenergy production or other purposes ranges, from 140 million ha to 940 million ha. (Dameron et al. (2005), Riedacker et al. (2005). If productivity cannot be increased, more land will be needed and lead to more deforestation. This is particularly important for Africa. We underlined this more than 15 years ago (Riedacker & Dessus 1991) also at the IFDC keynote address in 1991, (Riedacker 1991) when the international community
0 20 40 60 80 100 120
AAggrriiccuullttuurraall llaanndd Humid zones
Forestland
Lande/Toundra Fallow land
Marine ecosystems Mountain ecosystems

15
envisaged to mitigate climate change by aforestation of wasteland and cropland after the Norwick Conference in 1989 ( IPCC 1992 and Riedacker 2004). Already at that time we indicated that avoiding deforestation would be a more efficient option than aforestation: First because CO2 uptake from the atmosphere is much slower with aforestation, than CO2 release caused by deforestation (Riedacker 2004). Future expansions of agriculture and pasture amplify atmospheric CO2 levels in response to fossil-fuel and land use change emission (Gitz & Ciais 2004). Shortening of fallow period also decreases soil carbon content ; for instance for 3 year cultivation periods, by switching from systems with 7 year fallow intervals soil carbon content is after 40 years about 25 tons lower at the end of the fallow period than with systems with 15 year fallow periods (Kellman 1969). And also because, as demonstrated by IPCC working groups (AFOS 1992), it is impossible to find enough land for aforestation each year. We considered already that increasing productivity of cropland by improving soil fertility, in particular by adding phosphorus to the poor African soils, would be a very interesting option to reduce future deforestation which may be caused by to low food production per capita (Fig 13)
Fig 10 Evolution, between 1950 and 2000, of world cereal production (in milled rice equivalent) land used (660 million hectares) and of land spared due to yield increase per hectare (1.1 billions ha) (Data FAO and Agrostat From Borlaug in IFDC 2006)
Fig. 11 Evolution of cereal production (reference 100 for 1960), yield per hectare and land use between 1961 and 2001, in South Asia and Sub-Saharan Africa (Source IFDC 2006).

16
Fig. 12 Land cover change in the world between 1970 and 2050 , if agricultural efficiencies of each
continent were to remain the same as in 1990, and if each continent was to feed its population. In 2050 all African forests would have disappeared except some small forestland in the centre of the Congo Basin (Modelling exercise, personal communication from RIVM )
Fig 13 Evolution, between 1961 and 1999, of Net Food Output per Capita (reference index 100 in 1961) in various part of the world and in Sub Saharan Africa lower line (FAO )

17
But in 1991 it was impossible to calculate the effect of additional nitrogen inputs on GHG emissions; the scientific knowledge was insufficient. This is no longer the case to day and this study is the first to confirm clearly as shown above, that increasing yields with higher inputs both increases the Primary Mitigation Potential on the land receiving more and better applied inputs, but can avoid land use conversion of forestland or grassland into crop land. This is in particularly important for Sub Saharan Africa; inputs are low (fig. 14), about 20 times less than in western Europe, dry matter production is limited not only by low rainfalls but also by insufficient mineral availability, (Fig 15) (Breman and de Wit 1983); African soils have a very low content of phosphorus (Pierri 1991 and Sanchez et al. 1991)); and soils are already being depleted because of insufficient mineral inputs (fig. 16) (IFDC 2006). Increasing soil fertility is probably the best option, not only to reduce deforestation, but also to mitigate climate change, to increase food security, to increase income in the country side and to reduce importation of food.
Fig 14 Average fertilizer input per ha in 2002/ 2003 in various part of the world IFDC 2006 www.ifdc.org
Fig; 15 Range of actual and potential plant production of pasture (in metric tons of dry matter
per ha) in relation to the mean annual rainfall (From Breman and de Wit 1983)

18
Fig 14 Annual mineral nutrient depletion of African soils (in kg/ha) Source IFDC (2006) CONCLUSIONS
To assess impacts of technological changes in crop production on various environmental parameters a new approach was necessary; the new Global Integrated Environmental Assessment GIEA, developed for that purpose has been briefly presented here. New concepts had also to be introduced such as “, “Primary GHG Mitigation Potential”, “Real Land Use” and “Avoided Land Use Change”, Land Use Intensity”, the “Period of GHG mitigation superiority of a doubling of cropland yields per ha by avoiding land use change”, the “Pay back period for deforestation and other land use change” etc. It was also necessary to rely on GHG emissions factors, which were not yet available in the early 1990’s, This prevented us from calculating the mitigating effect of increasing yields with higher inputs (Riedacker 1991, Riedacker et Dessus 1991). Emissions factors, which allow for instance to determine the average GHG emissions resulting from organic or nitrogen input have been measured, assessed and adopted by IPCC only more recently (IPCC 1996 to 2006).
At the global level this study indicates clearly that increasing yields per ha - in particular through higher and more efficiently used inputs- not only decreases land use intensity, but also increases net energy gain per hectare and the “Primary mitigation potential” of crops per hectare. This has been illustrated here by studying the evolution in wheat in France during the past half a century It has been shown that during that period wheat yields per hectare have been multiplied by 4, the net primary energy gain per hectare has been multiplied by more than 3, whereas the primary mitigation potential has also been multiplied by 4. Land use intensity has also been dived by 4 and avoided deforestation reached 14. 5 million ha; this represents about a quarter of the area of the country or the total forest area. When the mitigation potential of wood or grass which could be harvested on the land use change are not taken into account, the “period of GHG mitigation superiority by avoiding land use change with a doubling of cropland yields per ha” is on the average respectively longer than 3.6 centuries with avoided deforestation and one century with avoided grassland conversion into cropland When this production on avoided land use change are considered this period becomes infinite. Increasing yields with more, and more efficient, use of inputs is therefore a good option to be considered to provide more food or biofuels and at the same time reduce deforestation and net GHG emissions. This increases land available in the world for more food production and ultimately also for more bioenergy and bioproducts production. (Dameron et al. 2005, Riedacker et al. 2005, Hodgewicjk et al 2003) Agriculture practices in the 1950’s, with were still with low input), even in industrialized countries, much less efficient than in 2000. Since that, avoided land use change, in particular avoided

19
deforestation due to technological changes and improvements in agriculture have also been very important; more than 1 billion ha of land has been spared in particular in countries which made their green revolution. (Borlaug in IFDC 2006)
At the local level, high inputs for instance of nitrogen may however have negative
environmental effects if not applied efficiently, at the right moment and together with other practices. Other changes should therefore also be considered at the same time ; introduction of cover plants in the end of summer for instance after the harvest of cereals to reduce nitrate leaching, mixing nitrogen fixing species with other species, strain selection of plants to reduce the need of inputs, including pesticides, etc.
A first division by four of GHG emissions per ton of wheat has already been achieved during the last 50 years in many parts of the world. This study shows clearly and for the first time that increasing inputs to raise food production and food security in countries where the green revolution has not yet taken place is also a very good option for climate change mitigation and for biodiversity protection. Future progress in agriculture will now depend on progresses made during the last 50 years, on the species considered, on research, and on future agricultural policies. A triple green revolution is now necessary; it should take into account not only (1) the necessity to produce more food in some parts of the world to meet future demand and (2) more sustainable management of agricultural and forestland, but also (3) human health and global environmental concerns, in particular climate change, biodiversity and energy issues ( Riedacker & Racapé 2006). Priorities vary of course according to regions of the world. In particular Sub Saharan Africa there is an urgent need to raise food production per capita and therefore to increase soil fertility of cropland and establish specific agricultural policies. Great progresses are technically feasible: the use of mineral fertilizer per hectare is for instance, today, the lowest in the world, 20 times lower than in Europe (IFDC 2006). The short term objective is however not to reach an average input of about 200 kg per hectare as in industrialized countries, but only 50 to 60 kg/ha instead of 8 kg /ha to day20: This is still three to four times less than in western countries today. This has of course to be combined with organic inputs for various reasons, but the latter alone would be insufficient, in particular because most African soils are very poor in phosphor. At the Africa Summit on Fertilization in Abuja, the NEPAD has in fact retained, as the first priority, to raise average fertilizer use throughout Africa to 50 kg per ha by 2015. (Africa Fertilizer Summit Declaration of June 2006). Increasing soil fertility in Sub –Saharan Africa, as we suggested already in 1991, is therefore one of the best options, to simultaneously reduce malnutrition, mitigate climate change, increase food security and therefore to adapt to climate change, to reduce deforestation and therefore to preserve biodiversity (Riedacker 1994). This would achieve several objectives for sustainable development; not only those of the of UN Millennium Goal, (food security), of the Climate Change Convention, (were avoiding deforestation has become again a major subject of discussion at COP 12 at Montreal in 2005 and at COP 13 at Nairobi, in 2006), of the Convention to combat desertification but also of the Convention on Biodiversity. Combining reduced cost of fertilizer, through subsidies and other actions, together with some commitments to reduce land use changes, in particular deforestation but also grassland conversion should become the priority of Sub-Saharan countries, also under the UN convention on climate change. Such an approach is probably much more realistic than trying to count precisely carbon stocks changes in forests in a post 2012 regimes under the Kyoto Protocol: It requires much less stringent measurements for at least 50 years, the “period of GHG mitigation superiority by avoiding land use change with a doubling of cropland yields per hectare”, being much higher. Simple land use change monitoring by remote sensing methods and measurements of average carbon stocks could therefore be used to monitor land use change instead of costly and precise measurements of carbon stock changes. Such an approach would be much more beneficial to farmers. 20 Like in Europe during the pre-industrial stage of agriculture (Boulaine 1992)

20
To be applicable in 2012 it should however be tested already now, on a voluntary basis, with countries from Sub-Saharan Africa: Several options should be considered, some of them could be inspired for instance by strategies developed in Kenya to promote the use of agricultural inputs (Seward 2006), This first step could at the same time contribute to the reduction of the global food gap (Mazoyer & Roudart 2005), to better cope with climate change and protect biodiversity and also allow, production of more modern biofuels in the future for further mitigation of climate change.
References Africa Fertilizer Summit Declaration (www.fertilizer.org/ifa/africa/africa_news.asp.) Bertrand M., L. Guichard, Mesnard JM, D. Picard, P Saulas (2006 ) Conception de systèmes de cultures
durables et innovants en grandes cultures ; le cas de l’essai de longue durée de “La Cage “ à Versailles Communication au 10ème Colloque international annuel du Secrétariat francophone à l’évaluation environnementale Colloque (SIFEE) Angers France 20 au 24 Juin 2005 « Evaluation environnementale et développement d’une agriculture durable » Collection s Evaluations Environnementales Vol 5 Actes du Colloque d’Angers pp 229 – 236 www.sifee.org
Boissieu de, C sous la direction (2006) Division par quatre des émissions de gaz à effet de serre de la France à l’horizon 2050. La Documentation Française Paris 2006 139 pages.
Boulaine (1992).Histoire de l’Agronomie en France TEC Doc Paris 392 pages Breman , de Wit 1983 in Pierri C (1990) Les bases agronomiques de l’amélioration et du maintien de la
fertilité des sols des savane au sud du Sahara . Actes de la rencontre internationale Savanes d’Afrique, terres fertiles. Montpellier 10-1’ décembre 1990. focal Coop, ministère de la Coopération/Cirad 1990 43-76
Brundtland HG, under the chair of (1987) Our common future. The world commission on environment and development Report to the UN General assembly Oxford University Press Oxford New York 400 pages
Bretagnolle V & S. Houte (2005) Quels enjeux pour les oiseaux dans les milieux céréaliers intensifs ? in Agriculture et Biodiversité CR Académie d’Agriculture de France 23 Mars 2005.
Carlsson , A (1997) Greenhouse gas emissions in the life cycle of carrots and tomatoes IMES /ESS Reports N° 24 Department of Environment and energy System Studies Lund University Sweden
Carlsson – Kanyama, A (1998 ) Food Production patterns and their influence on climate change Ambio 27 (7) : 528-534
Dameron V, C. Barbier, A. Riedacker (2005) Les enjeux mondiaux du stockage de CO2 par des plantations forestières sur des terres agricoles et de la réduction des consommations d’énergies fossiles par l’utilisation de leurs biomasses. Cahier du CLIP N°17 Septembre 2005 www.iddri.org
Gitz V., P. Ciais (2004).Future expansions of agriculture and pasture acts to amplify atmospheric CO2 levels in response to fossil-fuel and land use change emission. Climatic Change 67 : 161-184 , 2004 Kluwer Academic Publishers
Guide Biomasse-Energie sous la direction de Yves Schenckel et Boufeldja Benabdallah avec la collaboration de Arthur Riedacker et Philippe Girard GBE 396 pages Edited by IEPF & CRA Gembloux Chapitre 1 Les biomasses dans le changement climatique et le développement durable par A . Riedacker p 7-57 http://www.cra.wallonie.be
Ecotraffic, (1992) The life of fuels. Motor fuels from source to end use (cf. Ventère 1995) Hodgewicjk M., A Faaj , R Vanden Broeek , G Berndes, D. Gielen, W Turkenberg (2004) Exploration of the
potential of biomass for energy.. Biomass and bioenergy 25 pp 119-133 IFDC (2006) Africa fertilizer Summit Abuja 9-13 June 2006 www.ifdc.org IPCC (1996 to 2006 ) Guidelines – Good Practice Guidance 2000 - Good practice Guidance for LULUCF
2003Report on degradation and devegetation. November 2004 - National Greenhouse Gas Inventories Programme November 2004 Revised from 1996 & IPCC revised Guidelines 2006 www.ipcc.ch
Jones. A (2002) An Environmental Assessment of Food Supply Chains : A Case Study on Dessert Apples. Environmental Management Vol 30 , N°4 , pp 560-576
Kellman , MC (1969) Some environmental components od shifting cultivation in upland Mindanao Journal of Tropical Geography 28 : 40-56
Mazoyer M, L Roudart sous la direction de (2005) La fracture agricole et alimentaire. Nourrir l’humanité aujourd’hui et demain Edition Universalis 205 Paris 193 pages
Pierri C. (1991) Bilan de phosphore et agriculture durable en Afrique Atelier Scope (Scientific Comittee on Problems of the Environment) Nairobi 18-22 Mars 1991. 33 pages
Poncé- Hernandes R. (2006) A modelling framework for addressing n the synergies between global conventions through land use changes; carbon sequestration, biodiversity conservation, prevention of land degradation and food security in agricultural and forested lands in developing countries. 25 pages, in Climate Change

21
Mitigation Measures in the Agroforestry Sector and biodiversity Future Joint Workshop of EEE, Programme ITCP, UNESCO– MAB, and IIASA ITCP, Trieste Italy 16-16 October 2006
Radanne P. (2004) La division par 4 des émissions de dioxyde de carbone en France d’ici 2050 Introduction au débat 35 pages Missions Interministérielle de l’Effet de Serre Ministère de l’Ecologie et du Développement Durable. http://www.effet-de-serre.gouv.fr
Riedacker A., B. Dessus (1991) Increasing productivity of agricultural land and forests plantations to slow down the increase of the greenhouse effect Biomass for energy industry and environment 6th EC Conference Athens 1991 Edited by G. Grassi London Elsevier 1992 : 228-232
Riedacker (1991) A. Keynote Address.: Fertilizer use at the village level: constraints and impacts Summary Proceedings of Workshop IFDC Lomé October 2-8 , 1991 pp 5-6
Riedacker A (1994) La bioénergie une composante essentielle du développement planétaire durable ? Cahier de Global chance N° 4 Juin 1994 pp .41-55
Riedacker A (2003) Effet de serre et politique de lutte contre le changement. Revue “Monde en développement” vol. 31 -2003 n°121 47-70
Riedacker A. (2004) Changements climatiques et forêts. Edité par Silva et Riat (Réseau International sur les Arbres Tropicaux) avec le soutien de l’Union européenne et de la FAO 231 pp
Riedacker A., V. Dameron, C. Barbier (2005). An integrated approach to stabilize greenhouse concentration in the atmosphere: the impact of aforestation of agricultural land becoming available in the world. 14th European Biomass Conference and Exhibition: Biomass for Energy, Industry and Climate Protection, Paris 17-21 October 2005, 4p
Riedacker A. et J. Racapé (2006) Elaborer des approches intégrées, pour réduire les émissions de gaz à effet de serre de l’agriculture, des forêts et de leurs produits jusqu’en fin de vie. Communication au 10ème Colloque (SIFEE) Angers France 20 -24 Juin 2005 « Evaluation environnementale et développement d’une agriculture durable » Collections Evaluations Environnementales Vol 5 Actes du Colloque d’Angers pp135 -152 www.sifee.org
Riedacker A (in preparation) Integrated Environmental Assessments : A new tool for evaluation of policies for global and local sustainable development. Proposed to the International Journal for Sustainable Development
Riedacker and Gayet (in preparation). L’ Evaluation Environnemental Integrée de la production de blé au cours des 150 dernières années en France
RIVM Personal communication Rolland B, F-X Oury ,C. Bouchard , C Loyce (2006) Vers une évolution de la création variétale pour répondre
aux besoins de l’agriculture durable ? L’exemple du blé tendre. Les dossiers d e l’environnement de l’INRA , « Quelles variétés et semences pour des agricultures paysannes durables 30 , 79-90
Sanchez P., Swift M., Bual S., Dvorack K, Latham M,. Mokwunye U. (1991) Soil Research in Africa ; a long term strategy . a report to the Rockfeller foundation 43 pages
Seward P. (2006). Small Farmers in Kenya Increase Yields up to Five Times with the “Maxi-Maize Production” Planting String Fertilizer- Agriculture October 2006 page 4 www.fertilizer.org and www.fipsafrica.com
Tucker G.M., Heath M.F. (1994) : "Birds in Europe : their conservation status", Birdlife International, Cambridge
Thiébaut P., V. Parnadeau, P. Guy (2003) Quel avenir pour la luzerne en France et en Europe Courrier de l’Environnement de l’INRA n° 49, juin 2003 29-46
Thomson (2006) Ravensdown supports Sustainable Agriculture in New Zealand in Fertilizer Agriculture IFA Bulletin October 2006 pp 5-6 www.ravensdown.co.nz
Wolff A. , Th. Dieuleveut, J-L Martin, V. Bretagnolles (2002) Landscape context and little bustard abundance in fragmented steppes; implication for reserve management in mosaic landscapes. Biological Conservation 107 211-220
Ventère (1995) La qualité des produits écologiques Des écobilans aux écolabels. Editor AFNOR –Sang de la Terre Paris 184 pages

NOTE DI LAVORO DELLA FONDAZIONE ENI ENRICO MATTEI Fondazione Eni Enrico Mattei Working Paper Series
Our Note di Lavoro are available on the Internet at the following addresses: http://www.feem.it/Feem/Pub/Publications/WPapers/default.htm
http://www.ssrn.com/link/feem.html http://www.repec.org
http://agecon.lib.umn.edu http://www.bepress.com/feem/
NOTE DI LAVORO PUBLISHED IN 2007 NRM 1.2007 Rinaldo Brau, Alessandro Lanza, and Francesco Pigliaru: How Fast are Small Tourism Countries Growing?
The 1980-2003 Evidence PRCG 2.2007 C.V. Fiorio, M. Florio, S. Salini and P. Ferrari: Consumers’ Attitudes on Services of General Interest in the EU:
Accessibility, Price and Quality 2000-2004 PRCG 3.2007 Cesare Dosi and Michele Moretto: Concession Bidding Rules and Investment Time Flexibility IEM 4.2007 Chiara Longo, Matteo Manera, Anil Markandya and Elisa Scarpa: Evaluating the Empirical Performance of
Alternative Econometric Models for Oil Price Forecasting PRCG 5.2007 Bernardo Bortolotti, William Megginson and Scott B. Smart: The Rise of Accelerated Seasoned Equity
Underwritings CCMP 6.2007 Valentina Bosetti and Massimo Tavoni: Uncertain R&D, Backstop Technology and GHGs Stabilization CCMP 7.2007 Robert Küster, Ingo Ellersdorfer, Ulrich Fahl (lxxxi): A CGE-Analysis of Energy Policies Considering Labor
Market Imperfections and Technology Specifications CCMP 8.2007 Mònica Serrano (lxxxi): The Production and Consumption Accounting Principles as a Guideline for Designing
Environmental Tax Policy CCMP 9.2007 Erwin L. Corong (lxxxi): Economic and Poverty Impacts of a Voluntary Carbon Reduction for a Small
Liberalized Developing Economy: The Case of the Philippines CCMP 10.2007 Valentina Bosetti, Emanuele Massetti, and Massimo Tavoni: The WITCH Model. Structure, Baseline, Solutions SIEV 11.2007 Margherita Turvani, Aline Chiabai, Anna Alberini and Stefania Tonin: Public Policies for Contaminated Site
Cleanup: The Opinions of the Italian Public CCMP 12.2007 M. Berrittella, A. Certa, M. Enea and P. Zito: An Analytic Hierarchy Process for The Evaluation of Transport
Policies to Reduce Climate Change Impacts NRM 13.2007 Francesco Bosello, Barbara Buchner, Jacopo Crimi, Carlo Giupponi and Andrea Povellato: The Kyoto
Protocol and the Effect of Existing and Planned Measures in the Agricultural and Forestry Sector in the EU25 NRM 14.2007 Francesco Bosello, Carlo Giupponi and Andrea Povellato: A Review of Recent Studies on Cost Effectiveness of
GHG Mitigation Measures in the European Agro-Forestry Sector CCMP 15.2007 Massimo Tavoni, Brent Sohngen, and Valentina Bosetti: Forestry and the Carbon Market Response to Stabilize
Climate ETA 16.2007 Erik Ansink and Arjan Ruijs: Climate Change and the Stability of Water Allocation Agreements ETA 17.2007 François Gusdorf and Stéphane Hallegatte: Compact or Spread-Out Cities: Urban Planning, Taxation, and the
Vulnerability to Transportation Shocks NRM 18.2007 Giovanni Bella: A Bug’s Life: Competition Among Species Towards the Environment IEM 19.2007 Valeria Termini and Laura Cavallo: “Spot, Bilateral and Futures Trading in Electricity Markets. Implications for
Stability” ETA 20.2007 Stéphane Hallegatte and Michael Ghil: Endogenous Business Cycles and the Economic Response to Exogenous
Shocks CTN 21.2007 Thierry Bréchet, François Gerard and Henry Tulkens: Climate Coalitions: A Theoretical and Computational
Appraisal CCMP 22.2007 Claudia Kettner, Angela Köppl, Stefan P. Schleicher and Gregor Thenius: Stringency and Distribution in the
EU Emissions Trading Scheme –The 2005 Evidence NRM 23.2007 Hongyu Ding, Arjan Ruijs and Ekko C. van Ierland: Designing a Decision Support System for Marine Reserves
Management: An Economic Analysis for the Dutch North Sea CCMP 24.2007 Massimiliano Mazzanti, Anna Montini and Roberto Zoboli: Economic Dynamics, Emission Trends and the EKC
Hypothesis New Evidence Using NAMEA and Provincial Panel Data for Italy ETA 25.2007 Joan Canton: Redealing the Cards: How the Presence of an Eco-Industry Modifies the Political Economy of
Environmental Policies ETA 26.2007 Joan Canton: Environmental Taxation and International Eco-Industries CCMP 27.2007 Oscar Cacho and Leslie Lipper (lxxxii): Abatement and Transaction Costs of Carbon-Sink Projects Involving
Smallholders CCMP 28.2007 A. Caparrós, E. Cerdá, P. Ovando and P. Campos (lxxxii): Carbon Sequestration with Reforestations and
Biodiversity-Scenic Values CCMP 29.2007 Georg E. Kindermann, Michael Obersteiner, Ewald Rametsteiner and Ian McCallcum (lxxxii): Predicting the
Deforestation–Trend Under Different Carbon–Prices
CCMP 30.2007 Raul Ponce-Hernandez (lxxxii): A Modelling Framework for Addressing the Synergies between Global Conventions through Land Use Changes: Carbon Sequestration, Biodiversity Conservation, Prevention of Land Degradation and Food Security in Agricultural and Forested Lands in Developing Countries
ETA 31.2007 Michele Moretto and Gianpaolo Rossini: Are Workers’ Enterprises Entry Policies Conventional KTHC 32.2007 Giacomo Degli Antoni: Do Social Relations Affect Economic Welfare? A Microeconomic Empirical Analysis CCMP 33.2007 Reyer Gerlagh and Onno Kuik: Carbon Leakage with International Technology Spillovers CCMP 34.2007 Richard S.J. Tol: The Impact of a Carbon Tax on International Tourism CCMP 35.2007 Reyer Gerlagh, Snorre Kverndokk and Knut Einar Rosendahl: Optimal Timing of Environmental Policy;
Interaction Between Environmental Taxes and Innovation Externalitie SIEV 36.2007 Anna Alberini and Alberto Longo: Valuing the Cultural Monuments of Armenia: Bayesian Updating of Prior
Beliefs in Contingent Valuation CCMP 37.2007 Roeland Bracke, Tom Verbeke and Veerle Dejonckheere: What Distinguishes EMAS Participants? An
Exploration of Company Characteristics CCMP 38.2007 E. Tzouvelekas, D. Vouvaki and A. Xepapadeas: Total Factor Productivity Growth and the Environment: A Case
for Green Growth Accounting CCMP 39.2007 Klaus Keller, Louise I. Miltich, Alexander Robinson and Richard S.J. Tol: How Overconfident are Current
Projections of Anthropogenic Carbon Dioxide Emissions? CCMP 40.2007 Massimiliano Mazzanti
and Roberto Zoboli: Environmental Efficiency, Emission Trends and Labour
Productivity: Trade-Off or Joint Dynamics? Empirical Evidence Using NAMEA Panel Data PRCG 41.2007 Veronica Ronchi: Populism and Neopopulism in Latin America: Clientelism, Trade Union Organisation and
Electoral Support in Mexico and Argentina in the ‘90s PRCG 42.2007 Veronica Ronchi: The Neoliberal Myth in Latin America: The Cases of Mexico and Argentina in the ‘90s CCMP 43.2007 David Anthoff, Cameron Hepburn and Richard S.J. Tol: Equity Weighting and the Marginal Damage Costs of
Climate Change ETA 44.2007 Bouwe R. Dijkstra and Dirk T.G. Rübbelke: Group Rewards and Individual Sanctions in Environmental Policy KTHC 45.2007 Benno Torgler: Trust in International Organizations: An Empirical Investigation Focusing on the United NationsCCMP 46.2007 Enrica De Cian, Elisa Lanzi and Roberto Roson: The Impact of Temperature Change on Energy Demand: A
Dynamic Panel Analysis CCMP 47.2007 Edwin van der Werf: Production Functions for Climate Policy Modeling: An Empirical Analysis KTHC 48.2007 Francesco Lancia and Giovanni Prarolo: A Politico-Economic Model of Aging, Technology Adoption and
Growth NRM 49.2007 Giulia Minoia: Gender Issue and Water Management in the Mediterranean Basin, Middle East and North AfricaKTHC 50.2007 Susanna Mancinelli and Massimiliano Mazzanti: SME Performance, Innovation and Networking Evidence on
Complementarities for a Local Economic System CCMP 51.2007 Kelly C. de Bruin, Rob B. Dellink and Richard S.J. Tol: AD-DICE: An Implementation of Adaptation in the DICE
Mode NRM 52.2007 Frank van Kouwen, Carel Dieperink, Paul P. Schot and Martin J. Wassen: Interactive Problem Structuring with
ICZM Stakeholders CCMP 53.2007 Valeria Costantini and Francesco Crespi: Environmental Regulation and the Export Dynamics of Energy
Technologies CCMP 54.2007 Barbara Buchner, Michela Catenacci and Alessandra Sgobbi: Governance and Environmental Policy
Integration in Europe: What Can We learn from the EU Emission Trading Scheme? CCMP 55.2007 David Anthoff and Richard S.J. Tol: On International Equity Weights and National Decision Making on Climate
Change CCMP 56.2007 Edwin van der Werf and Sonja Peterson: Modeling Linkages Between Climate Policy and Land Use: An
Overview CCMP 57.2007 Fabien Prieur: The Environmental Kuznets Curve in a World of Irreversibility KTHC 58.2007 Roberto Antonietti and Giulio Cainelli: Production Outsourcing, Organizational Governance and Firm’s
Technological Performance: Evidence from Italy SIEV 59.2007 Marco Percolo: Urban Transport Policies and the Environment: Evidence from Italy ETA 60.2007 Henk Folmer and Pierre von Mouche: Linking of Repeated Games. When Does It Lead to More Cooperation
and Pareto Improvements? CCMP 61.2007 Arthur Riedacker (lxxxi): A Global Land Use and Biomass Approach to Reduce Greenhouse Gas Emissions,
Fossil Fuel Use and to Preserve Biodiversity

(lxxxi) This paper was presented at the EAERE-FEEM-VIU Summer School on "Computable General Equilibrium Modeling in Environmental and Resource Economics", held in Venice from June 25th to July 1st, 2006 and supported by the Marie Curie Series of Conferences "European Summer School in Resource and Environmental Economics". (lxxxii) This paper was presented at the Workshop on “Climate Mitigation Measures in the Agro-Forestry Sector and Biodiversity Futures”, Trieste, 16-17 October 2006 and jointly organised by The Ecological and Environmental Economics - EEE Programme, The Abdus Salam International Centre for Theoretical Physics - ICTP, UNESCO Man and the Biosphere Programme - MAB, and The International Institute for Applied Systems Analysis - IIASA.
2007 SERIES
CCMP Climate Change Modelling and Policy (Editor: Marzio Galeotti )
SIEV Sustainability Indicators and Environmental Valuation (Editor: Anil Markandya)
NRM Natural Resources Management (Editor: Carlo Giupponi)
KTHC Knowledge, Technology, Human Capital (Editor: Gianmarco Ottaviano)
IEM International Energy Markets (Editor: Matteo Manera)
CSRM Corporate Social Responsibility and Sustainable Management (Editor: Giulio Sapelli)
PRCG Privatisation Regulation Corporate Governance (Editor: Bernardo Bortolotti)
ETA Economic Theory and Applications (Editor: Carlo Carraro)
CTN Coalition Theory Network


![OSESG-GL - Media Monitoring, 8 October 2015 · 6 octobre 2015 - C'est une annonce très [attendue] en République démocratique du Congo, le nom du prochain patron de la Monusco,](https://img.pdfslide.us/doc/110x75/5f3d14c7713d2b7e1764a6ee/osesg-gl-media-monitoring-8-october-2015-6-octobre-2015-cest-une-annonce-trs.jpg)