Embed Size (px)
Citation preview

CIRJE Discussion Papers can be downloaded without charge from:
http://www.cirje.e.u-tokyo.ac.jp/research/03research02dp.html
Discussion Papers are a series of manuscripts in their draft form. They are not intended for
circulation or distribution except as indicated by the author. For that reason Discussion Papers may
not be reproduced or distributed without the written consent of the author.
CIRJE-F-878
A Global Census of Corporations in 1910
Leslie HannahCIRJE, University of Tokyo and London School of Economics
February 2013

1
A Global Census of Corporations in 1910.1
by Leslie Hannah (CIRJE, University of Tokyo and London School of Economics)
ABSTRACT
Estimates of the extent of the corporate economy in eighty‐one countries in 1910, when the number of corporations globally reached about half a million, show that the US and the British Empire alone accounted for three‐quarters of these. The aggregate market value of approaching a hundred stock exchanges in the Empire exceeded that of the then similarly numerous US securities markets analyzed in Moody’s Manual. However, American corporations outnumbered British ones, because the US had many more, small, private (unquoted and often family‐owned) corporations. Continental Europe collectively lagged the Anglosphere both by number and value of corporations. The capitalist institution that now dominates global business thus initially prospered less under the French or German civil law systems ‐ adopted by most world economies ‐ than under English common law and its derivatives. Within these legal families, the corporate form was preferred to the limited partnership almost everywhere that offered simple, cheap and flexible registration for public and private companies. A century later, despite the suppression of the corporation for many decades in some countries, there were many times more corporations in all countries and patterns of adoption were converging. We find substantial differences in 1910 between relatively poor enclave economies with capital‐importing corporate sectors and economies at various income levels with a vibrant local small private company sector. This new quantitative perspective challenges some orthodoxies and raises new questions about the relationship between early corporate development and economic outcomes.
1 Thanks to James Foreman‐Peck, Viv Nelles, Tetsuji Okazaki, Robert Wright and participants in seminars in Hong Kong, Paris, Seoul and Tokyo for comments on earlier versions. The usual disclaimers apply.

2
Many economists believe that legal institutions matter. La Porta et al (1998) and Djankov et al (2002)
argued ‐ using large, contemporary, cross‐country datasets ‐ that common law provides a better
business environment than civil law. Though focusing on the resolution of agency problems in stock‐
exchange‐traded firms, they also see common law as generally more flexible and more conducive to
new entry and economic growth. Kuran (2011) portrays the failings of sharia law in relation to banks
and corporations as delaying modern economic development in the Islamic world. Sylla (2002) and
Wright (2011) portray the financial revolution masterminded after independence by Alexander
Hamilton as driving the US’s nineteenth century growth, with more enthusiastic encouragement of
the corporate form than in Old England. Also maintaining the significance of law, but skeptical of
American superiority, Guinnane et al (2008) argue that Europeans had a richer menu of
organizational choice ‐ ranging from distinctive private limited company forms to limited
partnerships2 ‐ than Americans, an argument that mainly applies to smaller enterprises. Planners’
dreams of economic growth instantly stimulated by good corporate laws have recently encountered
the harsh reality of failed experiments: gradual, informed, locally‐tailored legal developments may
perform better than transplants of complex, evolved financial institutions (Pistor et al, 2002,
Berkowitz et al, 2003). Russia has adopted the very finest legal blueprint for corporations, yet its
shareholders’ rights are systematically violated; while Meiji Japan, taking a “wrong” turning in 1899
by adopting German corporate law, adapted it cumulatively and creatively to overcome this
“disadvantage.”
In fact, not just Japan, but almost the entire world outside the British Empire and the
US ‐ notably Latin America and China – chose (or had imposed) variants of French (or German) civil
law. We develop a large dataset for the year 1910, to assess the outcome a century ago for their
2 Some translators describe limited partnerships as corporations (all were kaisha in Japanese, sociétés in French, Gesellschaften in German, sociedades in Spanish, etc) and even give them the suffix “Inc.” or “Ltd.” This is not the practice in the US or UK (though the term “company” was applied to partnerships in Victorian English, this usage is less common today) and is not followed here. We use the words “corporation” or “company” interchangeably to refer to joint stock corporations (which usually, but not always, had limited liability and capital divided into shares), not to other limited liability entities.

3
corporations. The decision of the contemporary government‐backed proto‐OECD ‐ the Institut
International de Statistique (Anon 1920) ‐ to drop its quest for internationally comparable corporate
statistics, due to the lack of standardization and missing data, hints at some problems we
encountered. Historians of individual countries have analyzed national corporate statistics (which for
some countries are comprehensive and fine‐grained) though they have rarely made international
comparisons, which can enrich our understanding of the corporate form but have some puzzling
features. Can it really be true that Italy’s corporations were larger than those of the US or Germany?
(That is what their government statistics clearly show). We present a rationale that resolves such
apparent anomalies by situating them in modern research findings. We have very full official counts
of corporations for many countries and reasonable means of estimating others, but some problems
remain. For two‐fifths of the eighty‐one countries that we survey in 1910, we are reduced to
conjectures based on very partial information, though (with the notable exception of mainland
China) these tend to be relatively small countries with (apparently) few corporations. In the spirit of
Angus Maddison, we hope that this attempt at quantification will sharpen scholarly debate because
it is contestable, not because it is the last word.3
In 1910 traditional individual proprietorships and simple partnerships (most with no
more than two or three partners and lacking limited liability) remained globally the most numerous
business organizations, generally favored by small and medium enterprises everywhere (as they still
are in some countries). Even some of the largest businesses ‐ including Rothschild, Mitsui and
Morgan ‐ still used the partnership form, though they preferred the corporate form for most of the
investments they controlled. In some countries, corporations already accounted for most business
assets or output, and in the twentieth century they were to become more dominant as an
organizational form. It was, by our reckoning, only around 1910 that the number of extant
3 The sources of data for each country are fully described in Appendix 1, inviting correction.

4
corporations in the whole world first reached half a million, less than 300 per million people.4 Over
the next century, many countries introduced (or increased) taxes discriminating against the
corporate form, but this proved only a modest disincentive (Liu 2012). Even the communist
countries that more vigorously suppressed capitalist companies for decades eventually experienced
a rapid multiplication in corporate numbers. The Soviet Union tolerated companies under the 1920s
NEP, but Stalin suppressed them, as did Mao from 1949, but their policies have been decisively
abandoned in the last quarter century. Even North Korea now has (slightly) more companies than in
1910. Today the Hong Kong Companies Register (2012) alone contains a million corporations (about
142,000 per million people and twice as many as the whole world in 1910) and there are nearly
three million in the UK (Companies House 2012): at around 43,000 per million people, thirty‐eight
times its ‐ already relatively high ‐ 1910 level.
Nicholas Butler (1911, p.82), president of Columbia University, famously asserted that “the
limited liability corporation is the greatest single discovery of modern times…. Even steam and
electricity are far less important than the limited liability corporation, and they would be reduced to
comparative impotence without it.” The joint stock company has more recently been described by
the editors of the Economist ‐ with a nod acknowledging the possibly superior claim of the family ‐
as “the most important organization in the world” (Micklethwait and Wooldridge, 2003, p.2). There
are many tropes in the literature implying unequal facility in implementing this new general purpose
technology ‐ Germany used the joint‐stock company more than England during industrialisation
(Kocka 1978, pp. 538‐9), British corporate law was an imperial incubus on its colonies (McQueen
1995 on Australia, Sylla 2006 on Canada), Japan took remarkably quickly to corporations and stock
exchanges (Hoshi and Kashyap 2001), American managers and investment bankers precociously
democratized ownership, realizing the potential of divorcing it from control (Chandler 1990, De Long
4 We have counted about 480,000 companies in eighty‐one countries in 1910 with some (mainly African) countries still omitted and perhaps some undercounting of private companies (e.g in Latin America). In 1909‐13 the annual growth (net of disappearances) in the numbers of corporations averaged 4% in the US, Hong Kong and India, 5% in France, 7% in the UK, 8% in Japan and 10% in Germany. If the world had not already attained the half million figure by 1910, it soon did.

5
1991). Doubters suggest such Whiggish views are as contestable as the common law’s virtues or
vices, but we lack systematic descriptions of the historical pattern of the growth of corporations that
are an obvious first step in evaluating this contested terrain. The next section summarises access to
incorporation around the world, setting the scene for a quantified account of the international
spread of corporations. The following section demonstrates that the nature of corporatization in
1910 varied between countries, in particular in the prevalence of private (close) companies. The last
section raises some questions which will be addressed in future work.
THE LEGISLATIVE RISE OF THE CORPORATION
By 1910, all rich (and many developing) nations offered a procedure for registering joint
stock limited liability companies administratively, with varying degrees of cheapness and simplicity,
avoiding the arduous, costly and sometimes monopoly‐enhancing intervention either of the
legislature or of the executive branch.5 Joint‐stock companies, it is true, had often been formed (with
or without government authorization) even before such enabling legislation, but companies had
been made simpler, cheaper, less risky and legally unambiguous by such general incorporation laws.
The location of the world’s earliest truly general law facilitating limited liability and/or incorporation
by simple registration is contested: Ireland in 1782, France in 1791, Spain in 1829 and Connecticut in
1837 all have (weak) support.6 More decisively, an assiduous generation of like‐minded legislators
promoting a competitive (in contemporary language “liberal”) market economy (or conservatives
fearful of legislative corruption or of falling behind the neighbors) ensured that most inhabitants of
Europe, north America, the British Empire and some African and south American republics, if they
were not among the modest numbers with access to general company registration procedures
5 Greenwood (1911) is a contemporary practitioner’s perspective on international legal differences; Bowstead’s (1911‐14) 35 volumes outline in the original language (with English translations facing) the corporate laws of most countries that we survey. 6 These (and other) claims are contestable because the legislation was abandoned, little used, or conferred rights in restricted industries or geographical areas. Also contrary to received wisdom on civil law, French eighteenth century jurists influenced by natural law doctrines had pursued an interpretation more favorable to limited liability without state authorization than the US (Kessler 2003).

6
conferring limited liability in 1850, clearly were by 1870.7 A very few countries resolutely refused to
follow the fashion for statutory regulation. In Norway there was no corporate law until 1910: anyone
wanting to set up a company simply did so by private contract, devising their own governance rules,
though subject to the requirements for public notification via the Handelsregister that applied to
proprietorships and partnerships, as was the norm in civil law countries (Ostergaard and Smith 2011).
Some nations maintained central control of incorporation for a generation or two longer:
legislators cautious of encouraging speculation and default shared with existing corporate
incumbents a desire to maintain entry restrictions. Italy’s commercial code did not allow
incorporation by simple registration until 1883, Sweden’s not until 1895 and Japan’s not until 1899.
The “Young Turks’” Ottoman Law of Associations was promulgated in 1909, Siam’s general law in
1911, Greece’s only in 1920. Colombia precociously allowed incorporation by registration from 1829
but hardly used it and perversely reintroduced the requirement for state authorization toward the
end of the century. The Qing imperial edict of 1904, granting general incorporation in China, was a
bigger step for the Empress in principle than in practice: patronage of the powerful remained
essential for many companies. In other countries bureaucrats also tried to “pick winners,” in the
manner of seventeenth century English kings or early nineteenth century American legislators. In
Russia all corporations still required the Tsar’s authorization until his abdication in 1917. In Korea
and Taiwan the Japanese occupation initially limited native incorporations, until Japan’s own liberal
system was finally extended to its colonies, in 1920 and 1923 respectively. Even in jurisdictions
which routinely granted charters by simple registration, some sectors like banking and insurance
required additional state authorization. Railroads ‐ the classic large‐scale corporations of the
nineteenth century ‐ sometimes registered under general legislation, but also operated under legal
forms appropriate to government ownership, control, subsidy, guarantee or lease.
7 Prussia and the North German Federation belatedly made it in 1870, though some smaller components had done so earlier. Many British colonies, including India and Canada, initially using English corporate law, developed their own registration laws in the 1850s or 1860s; others did so later. California did not offer limited liability until 1931, though registration conferred proportional liability from 1859.

7
At the opposite end of the corporate size spectrum, a German law of 1892 formally
differentiated the GmbH (the private, unquoted ‐ and usually small8 ‐ company or, in American
parlance, close(d) corporation) from the more strictly regulated AG (the corporation with publicly
tradable shares, usually larger and often officially listed on a stock exchange).9 In 1896 Victoria and
in 1901 Portugal enacted versions of the private company, followed in 1906 by Austria, using the
German terminology. The next year the UK gave legal precision to its long‐familiar informal terms
“public company” and “private company” and many colonies soon copied the imperial metropolis.10
In 1919 Poland and Spain followed, in 1925 France, in 1933 Luxemburg, in 1934 Mexico,11 in 1935
Belgium and Palestine, in 1937 Switzerland, in 1940 Japan12 and in 1942 Italy. Incorporation laws
typically specified a minimum number of shareholders (varying between two and ten), but, with
“dummy” holders or post‐formation share transfers, even one‐person companies with limited
liability were possible (Passow 1907, pp. 223‐4 gives the example of Krupp). Private companies did
not need to be explicitly allowed: the close corporation could be “the creation of business men and
their counsel rather than of the courts and the legislatures,” as one American academic lawyer
(Kramer, 1953, p. 433) put it.13 Corporations in countries with flexible legal systems could de facto be
private companies, cheaply constituted and with shares that were closely held by a few holders and
rarely (if ever) traded.
8 In Prussia in 1904 60% of GmbHs had capital below M100,000,, but only 11% of AGs, while less than 4% of GmbHs but 45% of AGs had capitals above M1m (Passow 1907, p. 11) 9 It is misleading to translate GmbH literally as “limited liability company” and AG as “joint stock company,” since each had both stocks and limited liability. We use the term public company to include AGs and their equivalents whose shares were publicly tradable. Not all such firms’ shares were actually traded: when wishing to refer strictly to the latter we use “publicly‐traded.” An alternative usage (“public companies” meaning those owned by government) is clearly not intended in this article. 10 A UK public company was thereafter legally (rather than, as earlier, loosely and conventionally) defined as one with more than 50 shareholders, freely transferable shares and able to appeal for capital to the general public. 11 Mexico had technically been the first in 1884, but abandoned it before it was much used in 1888 see Gómez‐Galvariato et al 2012. 12 Although Japan’s 1899 law was based on German precedent, it did not include the GmbH until 1940, and even then the form was little used, whereas in Germany (and Austria) GmbHs overtook the number of AGs within a few years of their introduction. 13 Guinnane et al (2008) ‐ appropriately de jure ‐ treat the private limited company as something that did not exist in the UK before 1907 or in the US until the later twentieth century, but our interpretation is that private companies existed de facto much earlier and abundantly.

8
CORPORATIONS IN 1910: A GLOBAL VIEW
1910 is the first year for which we have comprehensive official figures for all extant US
corporations, detailing their numbers and share capitals (Commissioner 1911). Many other countries’
corporate statistics go back further, but in the US (where chartering corporations was the
prerogative of individual states, not the federal government) it was only in 1909 that the Internal
Revenue Service began assembling national statistics, following the introduction of a new federal
excise tax on corporations.14 Corporate demographers lack the clarity of human death: there is
some ambiguity, particularly at the smaller end of the corporate spectrum, about whether a stillborn
or failing corporation can reasonably be said to exist in any meaningful sense. The taxman is not only
motivated to identify existence but also has an annual trigger (in non‐payment) impelling verification
of his judgment, though the initial margin of doubt in the US was around 10% of corporate numbers.
Such statistical uncertainties are immaterial to the general picture presented in Table 1: national
figures do not differ by small percentages but by orders of magnitude.
Table 1. Numbers of Corporations in 1910, arranged in descending order of corporations per
million people.
Country No. No. per million Country No. No per million
people people
The Americas Europe
USA 270,202 2,913 Norway 5,048 2,117
Canada (B) 14,607 2,032 UK 55,747 1,241
Newfoundland (B) 200 833 Netherlands 6,874 1,161
Uruguay 450 416 Switzerland 3,960 1,060
Panama 90 276 Sweden 5,751 1,055
Mexico 2,800 187 Denmark 2,876 998
14 Wright (2011) has collected statistics of the flow of special incorporations between 1790 and 1860 nationwide and a minority of states published flow data for later years (Historical Statistics of the United States), but it remains difficult reliably to estimate stocks of all US corporations before 1910.

9
Cuba 375 169 Finland (R) 2,489 850
Chile 510 152 Belgium 4,128 551
Peru 210 107 Germany 25,346 403
Argentina 577 84 Luxemburg 80 308
French America (F) 23 54 France 12,606 306
Colombia 300 53 Portugal 1,151 196
Venezuela 130 46 Hungary 2,778 134
Brazil 750 34 Spain 2,102 106
Gibraltar (B) 3 99
Italy 2,836 78
Austria 1,972 70
Malta (B) 12 60
Rumania 660 56
Asia‐Pacific Bulgaria 140 32
Australia (B) 6,758 1,545 Greece 85 32
New Zealand (B) 1,711 1,637 Serbia 80 27
Hong Kong (B) 577 1,323 Russia 1,575 10
Straits Settlements (B)294 450
Fed. Malay States (B) 427 436 Africa
Samoa (G) 13 351 SW Africa (G) 116 1,160
French Oceania (F) 21 259 South Africa (B) 5,651 952
Kiautschou (G) 14 116 Rhodesia (B) 400 258
Japan 5,026 101 Algeria (F) 246 46
Ceylon (B) 350 75 Tunisia (F) 86 44
E. Indies (N) 2,200 46 Gold Coast (B) 50 33
Philippines (US) 327 37 Egypt 271 23
Fr. Indian Ocean (F)56 19
New Guinea (G) 14 23 Somaliland (F) 4 19
British India (B) 2,786 12 Morocco 80 18
Ind. Native States (B) 790 12 Cameroon (F) 40 16

10
French India (F) 3 11 E Africa (G) 79 11
Taiwan (J) 30 9 Sierra Leone (B) 14 11
Siam 40 5 Togo (G) 10 11
Ottoman Empire 60 4 Nigeria (B) 180 11
Korea (J) 66 4 Kenya (B) 16 7
Indochina (F) 54 3 Fr. Equat. Africa (F) 51 5
China 600 1 Fr. W. Africa (F) 53 5
Afghanistan 2 0 Uganda (B) 6 3
Nepal 0 0 Ethiopia 4 0
Source: Appendix 1.
* The letters in brackets after a country’s name indicate, for colonies, protectorates and dominions, the Empire of which they were part.
The three major industrial powers of the day ‐ the US, UK and Germany ‐ had the largest
absolute numbers of corporations, but differed considerably in their corporation‐intensiveness. The
US ‐ with more than half of all corporations in the world ‐ had 2,913 corporations per million people
and the UK 1,241. Germany had only 403: ranking about the level of Uruguay, Malaya or Singapore
on this measure. The small nations of north‐west Europe ranked well above Germany ‐ despite their
civil law systems ‐ and were very close to the UK’s level of corporatization (indeed Norway exceeded
it).15 Corporatization had made less progress in France, with 306 companies per million people,
Japan with 101, Italy with 78, Brazil with 34, India with 12, Russia with 10 and China only 1. And of
course there were some countries, like Afghanistan and Nepal, with no western‐style companies,
save the occasional foreign venture trespassing over their borders. Some colonies showed
remarkably high levels. (German) South‐West Africa had more corporations per million people than
the mother country. (British) Hong Kong had above a thousand times the corporate density of
15 Norway offers striking support for the libertarian view that state sanction for the corporate form is unnecessary, since it had no corporation law until 1910. Norwegian companies were simply formed contractually and registered locally, like other businesses, somewhat like English “deed‐of‐settlement” companies before 1844.

11
(culturally similar) mainland China. Using the whole population as a scalar is not ideal. In Taiwan,
only Japanese (3% of the population) were legally allowed to form corporations until 1923 (Wang,
2000, pp. 156‐8). Racial and social discrimination elsewhere was sometimes more subtle, but the
extent to which the native or immigrant elites who formed corporations were segmented from the
general population differed only in degree. Many people in Asia or Africa would not have had the
faintest idea what a corporation was, though some ‐ from the Philippines to southern Africa ‐ were
intimately familiar with other aspects of western civilisation such as the Maxim gun.
Even among nations at similar levels of development, substantial differences are
observed in Table 1. One reason, suggested by Guinnane et al (2008), is that commandite
partnerships were preferred in many civil law countries, because they were more effective for small
multi‐owner enterprises than the corporation, while US partnership law made them unattractive.16 A
commandite partnership was one in which the general partners (gérants or commandités) had
unlimited liability but “silent” or “sleeping” partners (commanditaires) were liable only for the
capital they contributed. We have followed contemporary European practice in including as
corporations only those which issued shares (commandites par actions, which could be quite large,
survive the death of a managing partner and were sometimes quoted) while excluding others
(commandites simples, which were more akin to ordinary partnerships, though they did offer partly
limited liability).17 In Japan there were almost as many limited partnerships as corporations, and in
Russia there were possibly more, but counting them all as companies would hardly shift their
country rankings in Table 1.18 For other countries, data on the stock of limited partnerships are
16 We suspect they exaggerate both the inability of shareholders in small close companies (lacking the capacity of partners to threaten dissolution) to use alternative informal means to protect their position and also overstate the legal problems of US relative to French limited partnerships. In the UK (though not in all its colonies) limited partnerships ‐ common in the early nineteenth century ‐ were more seriously suppressed by legislation and judicial interpretation, though, when they were again clearly statutorily permitted from 1907, with the alleged American common law problems mainly removed (Burdick 1908), the take‐up was even lower than in the US. 17 This was the practice of the German imperial statistical office (which combined AGs and KGaAs in its reports) and also commended for France (Saint‐Léon 1907) 18 In 1911 there were 5,801 “trading companies” (partnerships which could be created by municipal registration) in Russia (Owen, 1991, p. 11), many more than the corporations shown in Table 1, but it is not

12
sparse, but France, which particularly favored them, almost certainly had more than anywhere else.
Including its commandites simples would probably double France’s total in Table 1, vaulting it above
Germany in limited liability entities per million people, though leaving it below Scandinavian or US
levels.19 In point of fact the US may have approached France in absolute numbers of its limited
partnerships, which appear to be as much complements as substitutes for corporations.20 The
argument of Guinnane et al that the American organizational menu for capitalist businesses was
unappetizing by France’s gourmet standards, thus faces the objection ‐ even after thus extending
definitions in its favor ‐ that it failed to deter American businesspersons from consuming (in per
capita terms) around five times as much as the French of all forms of limited liability on offer. It
might further be urged that other forms of differently‐constituted multi‐owner enterprise ‐
cooperatives, mutual insurers, credit unions, friendly societies, building societies, savings banks,
municipal utilities and the like ‐ were more common in Europe, though convincingly comprehensive
internationally comparative statistics are lacking.21
clear what portion of these were tovarishchestvo na vere (limited partnerships en commandite). In Japan, 4,783 limited partnerships (goshi kaisha) in 1910 account for as much as 95% of the number of corporations proper (kabushiki kaisha) shown in the table, but less than 8% of their capital. There were special reasons in both cases. In Russia, while limited partnerships could be formed by a simple local registration process, corporations needed the Tsar’s approval. In the Japanese Empire, limited partnerships could maintain confidentiality of accounts, while corporations could not, and the registration fee was only three‐quarters of the rate charged to corporations. 19 From 1890, when we have statistics on new creations less formal dissolutions in France, Jobert (1991, pp. 107, 109) shows net increases of 13,569 for commandites simples but for the two categories we include in Table 1 only 10,238 (888 for commandites par actions and 9,350 for SAs). Some of these entities disappeared without being formally dissolved and commandites simples, being smaller, were more at risk of this, but, even discounting for that, there were likely as many commandites simples extant in 1910 as the corporations we count. By contrast in Germany commandites declined relatively after the legislation of 1892 (Guinnane et al, 2008, figure 4). The 1907 German industrial census (Statistiches Jahrbuch 1911, pp. 64‐5) shows only 1,636 German plants still owned by KGs (commandites simples), just over 7% of the numbers owned by the “corporations” we capture in Table 1: 340 by KGaAs (commandites par actions), 9,832 by AGs (public companies) and 11,001 by GmbHs (private companies). 20 The 1910 US manufacturing census reported 2,879 establishments owned by limited partnerships, more than in Germany. If the proportion in manufacturing was similar to New York in 1853 (Hilt & O’Banion 2009, p. 630) or Japan in 1911 (Department of Finance 1911, pp. 80‐1), this would imply more than 10,000 limited partnerships economy‐wide, amounting to about 4% of the number of US corporations at that date. Unlike the case in Europe, some US limited partnerships were entirely limited: there were no “general” partners (Burdick 1908, p. 527) 21 On German Sparkassen and Raffeisen credit cooperatives, see, for example, Guinnane (2002). Many early corporations, notably turnpikes and other utiilties, bore some resemblance to consumer co‐operatives rather than later for‐profit corporations (Pargender and Hansmann 2013)

13
An alternative measure of corporation‐intensity is the ratio of the paid‐up capital of all
corporations to GDP.22 This is also less exposed to the commandite objection, since almost all
commandites simples were small relative to corporations, so values are affected much less than
numbers. However, this measure is available for only two‐fifths of the countries for which we have
estimates of corporate numbers, though they account for nine‐tenths of the half‐million
corporations then extant. Table 2 shows a narrower range in this
Table 2. Value of Corporate Stock (quoted and unquoted) as a Percentage of GDP in 1910
(arranged in descending order at par).
Country Corporate stock values at par/GDP % (at market value in brackets)
Hong Kong * 480 (1286)
Canada* 206 (187)
US* 173 (173)
UK* 162 (256)
South Africa* 120
Egypt 106 (208)
Argentina 88 (108)
Netherlands 82
Belgium 80 (104)
Switzerland 75 (127)
Sweden 66
New Zealand* 54
France 51 (76)
Norway 45 (56)
Germany 44 (71)
Denmark 42
22 Goldsmith’s (1985) estimates of corporate capital stock for 1912/14 differ markedly (and in both directions) from ours for 1910, because, while ours are standardized, his are variously at market, par and book, and (without acknowledgment in his tables) sometimes include stocks of financial corporations, unquoted companies, partnerships, cooperatives and stocks held overseas, while for other countries excluding some or all of these (see Appendix 2). His pioneering estimates are unusable (albeit much used) for international comparisons of corporate stocks.

14
Finland 40
Hungary 34
Australia* 33
Russia 33
Japan 32 (56)
Italy 31 (40)
Spain 27 (52)
Austria 26 (47)
British India* 24
Bulgaria 10
China 9
Philippines 8
Korea 2 (3)
Afghanistan 0 (0)
Nepal 0 (0)
*Common law countries. The Philippines are counted as a civil law country, since they maintained the Spanish civil code, though some aspects of common law practice were gradually introduced during the American occupation. Argentina and Egypt are counted as civil law countries, though a substantial portion of their corporate capital was registered abroad under foreign common law.
Sources: Appendixes 1 and 2
indicator of corporatization and some changes in rank. Norway is no longer the European leader,
while Hong Kong overtakes the US as the clear global leader. Many mainland Chinese entrepreneurs
then opted to register in common law Hong Kong, relying on its independent courts and political
culture rather than Beijing autocracy, as their successors still do after the colony’s recent re‐
integration into China (Huang, 2008, pp. 5‐6). One of the first companies registered there under its
own 1865 Companies Ordinance, the Hong Kong & Shanghai Bank, had by 1910 extended well
beyond its eponymous cities: it was a global deposit, exchange and investment bank, with branches

15
throughout Asia, in America and in Europe. Paul Romer has famously argued that “China’s
reintegration into Hong Kong” (as he prefers to express it) lies behind China’s successful modern
development, seeing Hong Kong’s historic advantage as a prototype for his “charter” cities proposal.
Some differentials are explained by the role of the state: the nationalization of railways
or municipal ownership of electricity, for example, removed some of the largest corporate
enterprises from stock exchanges. Countries like the US or UK (where all railways were privately‐
owned) thus naturally had higher corporate capital/GDP ratios than Australia, Japan or Germany
(where the state ran most railways).23 We tried several methods of controlling for this effect, but
large differences persist. For example, if we deduct railway capital from both countries’ corporate
capital, Germany still registers only one‐third (rather than, as in table 2, one‐quarter) the ratio of the
US.24
More significant changes come from adjusting par values to market. The US had more
“overcapitalised” firms, reflecting its weak regulation of capital subscriptions compared with civil law
countries like Germany, though this was mainly transparent to investors and naturally reflected in
low market prices for US stocks (Pistor et al, 2002, pp. 821‐3). Fortunately stock indexes showing
market/par ratios are available for many of these countries, though indexes typically encompass
only a small fraction of quoted companies, are inconsistently weighted and, by definition, exclude all
private companies. The adjustment (shown in brackets where it is available in Table 2) is best
interpreted as an indicator of the direction in which par value/GDP ratios are biased by national
propensities to overcapitalize (assumed to apply to all firms not just those in the index), rather than
as a reliable indicator of actual market values. Subject to such caveats, this correction raises
Germany to 41% of the US level (and combining this with the rail correction would raise it further to
around 50%). The market value correction also propels the UK’s ratio above the US’s, though
Britain’s corporate capital remains only half America’s in absolute terms. The US then had 2.1 times
23 Since railway companies were generally large they have little impact on corporate numbers. 24 The adjustment deducting rail capital is reported for some other countries in appendix 1.
16
the UK’s population and 3.3 times the UK’s GDP at current prices and market exchange rates.25
However, Britain had a tiny agricultural sector (farms were only rarely incorporated anywhere) and
its corporations had more international direct investments than other nations. By contrast the US
and Russia were the leading international debtor nations. Much of the proportionately greater
capital in UK‐headquartered companies was actually invested in continental Europe, north and south
America, Asia‐Pacific and Africa.26
Such cross‐border enterprises everywhere were less likely than domestic businesses to
be directly owned by individuals and more likely to be intermediated by corporations. Indeed, if we
add all the colonial capital to the mother country’s at market (with allowance for missing data) the
British Empire more closely approached the USA’s corporate capital in absolute terms though was
smaller as a ratio of the Empire’s larger GDP. This may seem surprising , given some of the higher
figures in Table 2, especially since contemporaries reckoned that accumulated British wealth
invested in traded securities remained higher than the USA’s for more than half a century after the
rapidly‐expanding republic had overtaken the UK’s population and national income (Neymarck 1915,
p. 1309). However, much British wealth around 1910 was in (domestic and overseas) government
securities and the remainder was not only overseas direct investment of UK corporations (which our
measure counts as British) but also foreign portfolio investment, including large UK holdings of
American corporate stock (which we count as American).27 Japanese, Canadian, Australasian, South
African and other foreign corporates were also large net debtors to UK investors.
25 www.measuringworth.com for GDPs at current prices and market exchange rates. On the other hand, Maddison (2006, pp.427, 439, 463, 466) puts US real GDP ‐ with a back‐projected PPP exchange rate ‐ at 2.2 times, not 3.3 times, the UK’s. The implication is that prices were half as high again in the protectionist, high‐wage US as in the free‐trading UK (or that Maddison’s backward projections of real GDPs misrepresent relative incomes). For our present purposes current prices and exchange rates are preferred, because corporations and their investors faced such prices. 26 In 1909 5% of the UK’s corporations assessed for tax and 13% of assessed profits were from “adventures outside the UK” (Worswick and Tipping, 1967, pp. 101, 116, 118) and UK companies with large home operations also had more extensive multinational investments than US equivalents (Hannah 1996). 27 For example, nearly a quarter of the common stock of US Steel (America’s largest corporation) was held in Europe. Corley (1994, p. 78) estimates British portfolio investment (including corporate bonds) in overseas corporations in 1910 at £1,766.2m ($8,596m), which alone was 86% of UK GDP. Even if Britain had had no domestic corporations, this is a higher ratio than many European countries (Table 2)!
17
The market value adjustment, more remarkably, projects Egypt’s ratio above the USA’s,
prompting questions about a measure which perhaps ought not to have been as widely used as it
has been.28 The mass of Egyptians were poor (producing a low GDP denominator) but a large sector
of their economy was a western enclave: it is the massive British and French investment in this
quasi‐colonized outpost of the crumbling Ottoman domain that raises the numerator. In fact just
one corporation ‐ Egyptian‐registered and French‐headquartered ‐ drives this result. The Compagnie
Universelle du Canal Maritime de Suez accounted for around half of Egyptian corporate capital and
had been so successful since incorporation in 1858 that it was quoted on the Alexandria, London and
Paris stock exchanges in 1910 at more than eight times par (a figure about equal to Egypt’s GDP). Its
American twin, the Panama Canal, was still under construction and for the US government, not for
the capitalist sector.
Thus the US led the whole world in the numbers of corporations, while the UK had higher
corporate capital values (at market as a proportion of GDP). Other countries with common law
systems ‐ essentially British colonies ‐ also populate the top of these tables. Some colonies, it is true,
had less companies per million people than the UK, but this was likely because the international
division of labour sensibly directed them to sectors (like agriculture) with a low propensity to
incorporate or because native traditions, local culture, colonial inequalities or developments in
world trade inhibited the formation of human capital, conducive to a modern corporate economy.29
Thus India’s population was dominated by its poor rural peasantry in 1910 and its numbers of
corporations per head were low, albeit twelve times’ China’s. Yet where ‐ as in India’s big coastal
cities ‐ a literate local bourgeoisie prospered, incorporation under the common law was used as
28 The common practice of comparing securities values to GDP (a ratio devoid of theoretical meaning) has arisen because measures of national capital stocks (a more natural denominator) are less internationally consistent than GDP measures. 29 A paradox for most conventional institutional analysis based on the contemporary liberal vision of the “Manchester School” (now more commonly known as the “Washington consensus”) is that British India at an early stage had advanced corporate law, free trade, secure property rights and western‐style banks and stock exchanges but experienced only modest growth. For possible resolutions based on trade patterns see O’Rourke et al 2011, or on inappropriate technologies, see Headrick 1988.

18
enthusiastically by natives as by white settlers, judging by the corporate names that were registered.
Although most of India’s corporate capital was British (and the average size of such overseas‐
registered companies in India was $1,037,852), its domestically‐registered corporations averaged a
more locally attainable $91,866. Many other British colonies in Asia (notably Hong Kong, Malaya and
Singapore, with tiny portions of white settlers) had levels of corporate development above that of
independent Japan, while other countries’ colonies generally did not.
It is been suggested that this apparent correlation of common law with financial and
economic development implies causation, but it may actually mask a third causal factor shared
within the Anglosphere. The idea of Pagano and Volpin (2005) that proportional representation
systems (common in civil law countries) are less supportive of corporate investor protection than
majoritarian ones (normal in common law countries) flies with 1990s data but not in 1910: the few
countries that had then adopted proportional representation were actually relatively highly
corporatized.30 Another hypothesis ‐ and one much favored by contemporaries ‐ is an open and
individualist culture, as proxied by the predominance of protestantism (Stulz and Williamson 2003).
It is notable that small protestant northwest European nations (Norway, Sweden, Denmark, the
Netherlands and Switzerland) ‐ despite their civil law tradition ‐ also rank among the leaders, while
the Catholic nations of southern Europe and Latin America lagged.
Alternatively, it may be the flexibility of corporate law, rather than its systemic or
cultural basis, which is the critical determinant. Even within the UK only England, Ireland and Wales
had common law: Scotland preserved its civil law regime after the 1707 union. Westminster statutes
nonetheless ensured that Scotland’s corporate law was indistinguishable from England’s. Moreover,
Scots judges did not have the same difficulties as French ones, for example, in accepting preference
30 Belgium, Finland, Sweden, South Africa and some Swedish cantons had introduced proportional representation, though so recently that it might be argued that the alleged processes had not had time to work. More significant contemporary political differences that might have had effects similar to that predicted by their model (such as the degree of democratization) are also uncorrelated with corporatization: Foreman‐Peck and Hannah (2013) show little correlation of the Polity IV index with corporatization.

19
shares (even though they were not authorized by statute in either country): the reason for the
difference cannot be civil law.31 Yet the Scots (and Louisianans, who also retained civil law within the
US) were perhaps fortunate. Ottawa’s parallel tolerance of Quebec’s civil corporate law ‐ or perhaps
the lower literacy and/or Catholic culture of Québecois ‐ left the French‐speaking province with
remarkably few corporations relative to common law Ontario.32
Experience within the modern European Union suggests that flexible corporate laws are
appreciated by those who lack them. Historically there was always some cross‐border incorporation:
dozens of Scandinavian and Benelux companies and some from all large European countries were
registered and/or quoted in Britain before 1914. This habit was curtailed by the twentieth century’s
war‐driven tide of national particularism of 1914‐1945 and the peaceful reintegration of Europe
after its long drawn‐out “civil war” was painfully slow. However, recent European Court of Justice
rulings have given cross‐border registrations a renewed green light. Under pressure from Brussels
for greater harmonization, corporate laws even in civil law regimes have become more standardized
and nearer the Anglosphere’s model. Moreover, thousands of European firms now again choose to
incorporate outside their home jurisdiction and Britain has again become Europe’s “Delaware.”
Notably many German firms now choose to incorporate under UK law, aided by specialist
intermediaries helping them overcome the language and legal barriers (Becht et al 2008).
Recent economic analyses of the determinants of such corporate mobility have
emphasised the cost of registration and its ease (measured, for example, by the speed with which
registration can be completed). Unfortunately historical data on these variables are less accessible,
but we may take as a benchmark the winner in the charter‐mongering competition within the US at
the end of the nineteenth century. Delaware was on the point of permanently taking over, but New
Jersey still predominated in the early twentieth century, offering registration for as little as $35
(0.7%)for a $5,000 corporation and $1,010 (0.02%) for a $5m corporation. Since an 1868 court ruling
31 France belatedly authorized such shares by statute in 1902. 32 Ontario was creating corporations at more than seven times’ Quebec’s rate, see Appendix 1.

20
(Paul vs Virginia), states could not discriminate against “foreign” (i.e. out‐of‐state) corporations, so
New Jersey fees were open to all, though most chose to pay ‐ usually slightly higher fees ‐ in their
home state (Borgmeyer 1910 pp.19‐547; Lough 1914, p. 53). Corporations elsewhere ‐ for example,
in Canada, Australia, Russia, China, Norway, Hong Kong and Singapore (Official 1911, p. 268, Trivett
1914, p. 421, Williams 1905, p. 142, Hong Kong 1911, pp. 696‐7, Straits 1912, p. A5) ‐ could register
about as cheaply, or even more cheaply, than in New Jersey,33 though corruption appears to have
raised the effective cost in China and Russia (Borgmeyer 1910, p. 589). Metropolitan Britain was a
little more expensive, feeling more able to tax itself than its colonies: 1776 still weighed heavily
(Davis and Huttenback 1986). Although basic registration fees in London were low (a minimum of £2
and maximum of £50), stamp duties (a tax on the necessary documentation) significantly inflated
this. The combined cost for a £100 company by the early twentieth century was £4.25 but for a £1m
(about $5m) company as much as £2,552 (0.26%, $12,418) (Gore‐Browne 1909, pp. 601‐2). There
was nothing inherent in civil law that required corporate registration to cost even more than this
high British rate.34 Yet in Germany, registering an AG with $5m capital cost more than 5% of the
capital, which was 250 times the contemporary New Jersey rate and twenty times the British rate,
though GmbHs were cheaper (Burhop 2006).35 In France and Japan, fees (at 0.6% and 0.4%
respectively) were between the British and German rate, but there was no relief for private
companies (Priez 1911).36
Also potentially important was what companies were required to do subsequent to
registration. Weak reporting and re‐registration requirements, such as America’s, or the exemption
33 Foreman‐Peck and Hannah 2013. 34 Except perhaps the greater compulsory or voluntary resort to notaries (Guinnane et al 2008, p. 18), whose comprehensive legal training and monopoly raised costs, relative to the competitive and specialized company registration agents favored in common law systems. 35 Germany also restricted and taxed securities transactions early (Michie, 2006, p. 138). 36 Partnerships (including limited partnerships) had a lower rate of 0.3% in Japan. I am grateful to Professors Okazaki and Kitaura for information on the fees under the 1899 law. Registration fees were only part of the story: there were also significant international differences in annual franchise fees, in taxation of profits, dividends and securities transactions, and in intermediation fees for public issues. For example, Austria’s tax regime strongly discriminated against corporations (Rudolph 1972, pp.40‐1), while America’s unusually high investment banking fees were a strong deterrent to formal IPOs (Hannah 2011b)

21
of private companies from stringent public company regulations, like Germany’s, encouraged use of
the corporate form by quite small enterprises.37 On the other hand, weak disclosure and
shareholders’ rights inhibited the flotation of larger companies on stock exchanges. One might
therefore expect corporate laws to have ambiguous effects, depending on their differential
treatment of the various types of corporation.
PRIVATE (CLOSE) CORPORATIONS
The statistics considered so far lump together public (quoted or tradable) and
private (close) companies. Where there was a legal distinction, the contrasts were clear. In Germany,
the mean share capital of the 19,650 GmbHs (private companies) of 1910 was only M197,506
($47,006), while the 5,296 AGs (public companies) averaged fifteen times that size, with mean
capital of M2,954,305 ($703,125). Thus 79% of German companies by number were in the private
company sector, but they accounted for only 20% of corporate capital (though adding the AGs not
listed on a stock exchange would increase that to nearer 30%).38 In the UK, around 6,500 companies
had securities traded on the London Stock Exchange in 1910. Some of the remainder were legally
classified as public but were in fact private (not all firms had yet amended their status under the
1907 act), with securities that were never (or only occasionally) traded. Thus only about 23% of all
UK corporate share capital at par was in the 90% of companies that were de facto private.39 The
average share capital at par of the 6,500 publicly‐traded UK companies of 1914 (a year for which we
have better information than 1910) was £504,369 ($2.454m): thirty‐four times the size of the 60,355
37 GmbHs, for example, were exempt from the requirement of AGs to appoint an Aufsichtsrat (supervisory board) and publish accounts (Krüger 1912, pp. 20‐3). 38 Rajan and Zingales (2003, unpublished data appendix) report the 1913 par values of shares quoted on all German exchanges as M16b, 69% of the combined 1913 par values of all AGs and KGaAs (M17.537b) and GmbHs (M4.81b) plus our approximation of Gewerkschaften (M0.735b). AGs with unquoted stocks – the majority by number, but including many too small for an IPO ‐ would include privately‐held firms incorporated before the GmbH legislation, subsidiaries, those which only listed bonds and/or traded their shares informally, and those which might at some future stage float. 39 Authors’ calculations based on the number of companies in the LSE’s own Stock Exchange Official Intelligence (which included those officially listed but also many which could be traded though not officially listed). Skinner’s Stock Exchange Year Book listed many more, but the additions were mainly small and infrequently traded.

22
infrequently‐traded and private ones, which averaged only £14,860 ($72,309) share capital. The UK
had more public and more private companies than Germany (a country with 40% more people and
much the same real GDP) and in both categories its companies were of higher average size, so it is
hardly surprising that the ratio of corporate capital to GDP was three times higher in the UK than in
Germany.40 This is consistent with Edwards and Ogilvie’s (1996) and Cassis’s (1997) skepticism about
the earlier influential intuitions of Chandler (1990) and others. Germany remained pre‐eminently a
land of personal proprietorships, partnerships and family firms, though its corporations’ modest
aggregate numbers and capitals encompassed a dynamic capitalist sector in banking, shipping,
chemicals, steel and electricals and it had more state‐owned enterprises than the Anglosphere.41
In many other countries, no legal distinction between private and public companies was
made until later. In France before 1925 private companies were inhibited by the relatively expensive
and complex registration and reporting processes imposed on the juridically undifferentiated
company sector, essentially to protect public company shareholders.42 Neymarck’s figures for
corporate securities quoted on the Paris bourse suggest only 20% at par were quoted elsewhere or
were in private companies, an exceptionally low portion of all corporate capital.43 In Belgium in 1914,
the proportion of the share capital in domestic corporations that was private was 25% (Baudhuin
1924, p. 21) and in Italy in 1907 28% (Aganin and Volpin 2005, p. 334). In Asia‐Pacific and Latin
America, private companies also appear to have accounted for only a modest proportion of
corporate capital.44
40 A figure hardly affected by the market value correction in Table 2, though it would be reduced to below three times by eliminating railways from both countries’ totals. 41 Kocka and Siegrist (1979) show that in 1907 some of Germany’s largest industrials were still owned by individuals and partnerships, not by corporations (AGs, GmbHs or Gewerkschaften). 42 Freedeman (1993, p. 23) suggests that French corporations that were de facto private were exempted from the publicity requirements, but this applied only to prospectus publicity: they still had to publish accounts, unlike German GmbHs or British private companies. 43 Appendix 1. However, Neymarck’s calculation includes bonds which were more likely to be quoted than shares. 44See Appendix 1. In 1920/21 19% of Indian‐registered companies were private, accounting for 18% of capital (Narta 1992, p. 68). Neither the Canadian nor Australian data will support the calculation of similarly precise percentages, but it appears that a higher proportion of their corporate capital was quoted than in the USA, despite a weighty domestic literature bemoaning the underdevelopment of their capital markets.

23
In the US, by contrast, typical state regulatory requirements for companies were
minimal,45 so many private (close) corporations could exist unmolested by legal stringency, while US
public corporations before 1933 faced federal apathy and were largely left to their own devices in
developing governance standards.46 Moody offers the best estimate before 1914 of the share
capital of companies that had nonetheless gained listings on a US stock exchange or traded
informally, at auction, on the curb or over‐the‐counter. There were nearly 20,00047 such companies
but the ratio of their share capital at par values to GDP was, at most, 65% in 1907, with about half of
this capital in nearly 300 firms traded on the NYSE, which specialized in creating a large liquid market
for corporate giants (Appendix 1). Comparison with the IRS figures for all 270,202 US corporations in
1910 suggests that well over 90% of American corporations, accounting for as much as 60% of all US
corporate capital at par, were close companies or were too infrequently (or obscurely) traded to be
noticed by Moody. The mean US corporation remained smaller than the mean British corporation, as
had always been the case.48 The modal American corporation was not widely‐held but was rather a
cloak for the individual proprietor seeking limitation of liability, the family firm, the crypto‐
partnership, or the small local utility or bank with shares parked privately by directors among their
families and acquaintances and rarely (if ever) traded.49 This proportion (around three‐fifths) of US
corporate capital in such companies is far above the figures (typically around a quarter) recorded in
45 Only 12 US states required companies to publish balance sheets before 1914 (Wright 2012, pp. 6‐7); and many of even America’s largest industrial companies failed to do so (Hannah 2007, pp. 642‐86.) This was less common in Europe and, even in the relatively laissez‐faire UK, annual balance sheets had long been required by the LSE as a condition of new IPOs and were legally required for statutory companies from 1845 and for registered ones from 1900 (the new requirement being dropped for those registering as private companies from 1907). Similarly, when the SEC tightened up quoted company regulation on a federal level in the 1930s, closed corporations in the US remained exempt.
46 Guinnane et al (2007) see US corporations’ inability to protect minority interests as a severe constraint (as it probably was for the development of US stock exchanges), but the sheer numbers suggest that American owners of close corporations cheerfully carried on regardless. 47 Most of these were small unit banks with locally marketed shares, which were much rarer outside the US 48 Forbes (1986, p. 173) claimed otherwise, citing UK wealth inequality leading to large sole proprietorships and partnerships, in preference to corporate entities. In fact, British companies were more capital‐intensive and larger, whether measured by share capital or numbers of shareholders (Hannah 2013). What was distinctive about American corporations was that they were smaller and more numerous, exceeding Britain’s total perhaps as early as the 1830s. 49 Taussig and Barker (1925) report some pre‐1914 survey evidence on such closed companies.

24
Europe at this time. Even among US quoted companies, ownership by plutocratic families of large
blocks of stock that were not traded remained more common in the US than the UK, where high
levels of divorce of ownership from control were already the norm (Foreman‐Peck and Hannah
2012).
This clarifies that, in order to explain the very large numbers of companies in the
USA, the focus should be on the determinants of corporatization (the numbers of companies and the
amount of their capital, whether publicly‐traded or closely‐held and however small) rather than the
narrower issue of securitization (shares publicly‐traded on stock exchanges of generally larger
companies).50 Indeed the US was well ahead in the former at a time when it was only a modest
practitioner of the latter (Rajan and Zingales 2003, Hannah 2011). The market capitalization quoted
on the nearly 100 British Empire stock exchanges exceeded that on all the similarly numerous US
securities markets noticed by Moody’s Manual.51 Even Europe’s exchanges on some dimensions
exceeded the USA’s. There were more companies quoted on the Berlin or London exchanges in 1875
than on the NYSE forty years later (Gebhard 1928, p. 134; Course of the Exchange 1875; O’Sullivan,
forthcoming). Around 1914, when Europe’s real GDP was more than twice the USA’s, there were ten
times as many companies traded on eight major European exchanges (London, Paris, Berlin,
Amsterdam, Brussels, Vienna, Milan and St Petersburg) combined than the 970 traded on ten
leading US exchanges (the NYSE, NY curb, Boston, Philadelphia, Chicago, Baltimore, Cincinnatti,
Cleveland, New Orleans and Pittsburgh) combined, though the many companies traded off major
50 The term “securitization” is currently used more specifically to describe the selling of bank loans and other asset‐backed securities in capital markets, but seems equally appropriate for the similar process applied earlier to other assets. 51 Rajan and Zingales (2003,p.15) calculate the 1913 market value of all common and preferred stocks of US corporations quoted on five exchanges (NYSE, Chicago, Philadelphia, Baltimore and Boston) as $15.4b and the dozens of smaller exchanges and over‐the‐counter markets perhaps doubled that (Appendix 1). Moore (2010 Table IV) calculates the market value of corporations listed on five Empire stock markets (London, Toronto, Montreal, Sydney and Johannesburg) in 1913 as £3,669m ($17.9b), though correcting for overlaps would reduce this and this figure includes some foreign (as well as British Empire) common stocks. There were also dozens more local stock exchanges in these empire countries as well as in other parts of the Empire (New Zealand, a country of one million people, had six, British Columbia, with just over a third of a million people, about the same number, though the Wellington and Vancouver exchanges were locally dominant; India had only three exchanges). A higher portion of Empire companies were publicly traded than in the US. For example, Nash (1914) shows that all Australasian public companies had 2.7 times as much share capital (even at par) as was captured by Moore on the Sydney stock exchange, while Moody (1907) suggests a lower ratio in the US.

25
exchanges may have raised the totals to the same ballpark numbers (relative to their economic size)
for both continents (Brenninkmayer 1920; Borodkin and Perelman 2011, p. 106; Burhop 2006, p. 10;
De Luca 2002, p. 34; Eigner 2008 p. 33; Hannah 2011,p. 130; O’Sullivan 2007 p. 523)
Contrary to a common misconception encouraged by uncritical readings and
imaginative backward extrapolations of Berle and Means’ (1932) classic work, an extensive
population of small unquoted companies was the distinctive characteristic of “the modern
corporation and private property” in the US. On the other hand, a corporate economy in which the
great bulk of incorporated capital was publicly tradable was the distinctive characteristic of early
twentieth‐century Europe, the British Empire and Japan. The “managerial revolution” ‐ creating an
economy with shares traded on major stock exchanges with ownership somewhat (though in
markedly varying degrees) divorced from control ‐ is sometimes presented as a late twentieth
century phenomenon, with other countries only hesitatingly copying the “modernizing” lead of the
USA. The opposite is the case: the majority (by par value) of the corporate capital of Europe (but not
the US) was already quoted in the pre‐1914 period, though things changed later (Appendix 1, Faccio
and Lang 2002, Morck 2005, Foreman‐Peck and Hannah 2012). Moreover, it is the early US
approach of abundantly developing the private (often personally‐ or family‐owned) company sector
that can more accurately be described as “modern,” in the sense that it was to grow in relative
importance.52 By 1989 the Harvard Business Review was forecasting the “eclipse of the public
corporation,” with the further rise of private equity control over mismanaged, once publicly‐traded,
bureaucratic corporations (Jensen 1989, see also Harris et al 2012). Today unquoted companies
typically account for half or more of corporate assets in rich nations, while only in the USA do we
clearly observe this dominance of personal corporate capitalism before 1914.53
52The widespread contrary view that family‐owned closed corporations are “unprofessional” and “un‐modern” is rooted in Weberian and Chandlerian conceptions of bureaucratization and corporatization, exaggerating their decline in the twentieth century. Compare Colli 2003, Hannah 2009.
53 Private companies (defined to include unquoted but legally “public” companies) accounted for more than two‐thirds of all UK corporate assets by 1993‐2003 (Brav 2009 p. 264), as in the US in 1910. Since 1997, when

26
Table 3. Mean Sizes (share capital, converted to US$) of all Corporations (at par) ca 1910, arranged
in descending order of mean size; and of Publicly‐traded Companies (at market and par, where
available).
Country __________________Mean Share Capital (US$)___________________________
A. Countries with Large Corporations
All Companies Publicly‐traded Companies Publicly‐traded Companies at par54 at market at par (number in brackets) (number in brackets) Argentina 5,917,106 16,391,893† (117) Brazil 2,279,27655 2,646,249† (294) Chile 2,121,05356 5,251,350 (68) 2,233,381 (68) Egypt 2,082,089 9,562,249 (75)
Russia 1,701,936 1,824,440† (316)
China 1,314,851
Mexico 719,00257
Uruguay 574,89158
Austria 483,740 5,379,315 (228)
India 410,339
7 German Colonies 398,17159
Hong Kong 384,979
the number of listed companies in the US peaked at 7,888, it has declined by 38% (and by 48% in the UK) as the regulatory burden has increased (Economist, 19 May 2012, pp. 12, 24). 54 Except where footnoted, figures in this column relate to the numbers of companies in Table 1. 55 São Paolo companies only. 56 Industrial companies only in 1916 and relates to 114 companies, exceptionally more than the listed companies in the next two columns, where the data relate to 1917. 57 Average of new registrations 1886‐1910 58 New foundations only, 1910‐13 (the true average would probably have been higher). 59 1913 data

27
B. Countries with Mid‐Sized Corporations
Italy 358,054 2,818,218 (251) 2,202,063 (251)
Rumania 324,25460
France 321,394 23,063,010 (146)
South Africa 310,055 7,081,504 (133)
UK 290,540 14,065,640 (1,198) 27,815,556 (337)61
Belgium 276,955 1,314,710 (833)
Canada 276,511 6,100,000 (160)
Hungary 253,464
US 214,234 34,940,140 (294) 39,741,497 (294)62
Germany 187,963 4,756,659 (910)
Bulgaria 180,298
Spain 168,080 10,248,000 (40)
C Countries with Small Corporations
Australia 149,889 1,695,399 (213)
Switzerland 140,035 2,968,667 (120)
Straits Settlements 138,67863
Japan 125,819 5,146,182 (55) 2,766,402 (119)64
60 1916 data. 61 1911 data, from Foreman‐ Peck and Hannah, “Extreme Divorce.” Data at par are not available for all the securities evaluated in the previous column: the 1911 figures are for only the larger companies within the broadly similar 1910 population. The equivalent 1911 mean market value of these 337 larger companies (which unlike the 1910 data are per company not per security) was $37,272,844. 62 The NYSE data at par are from Pratt (see Appendix 1, assumed to comprise the same number as Moore found quotations for in 1910) and relate to 1911, while the market capitalization data in the previous column (from Moore) are for securities and relate to 1910. Rajan and Zingales’ figures for 1913 add companies traded on four other US exchanges (making 464 in all) and come up with a figure very close to Moore’s: $33,284,483: the division by companies rather than securities presumably being neutralized by the extra (smaller) companies listed regionally. 63 1916 data, locally‐registered companies only

28
New Zealand 118,608
Sweden 101,593 6,709,097† (108)
Netherlands 96,262 2,801,431 (377)
Philippines 85,440
Denmark 74,276 1,941,603† (114)
Korea 71,344
Finland 40,861
Norway 33,938 967,546† (80)
Sources: cols.1 and 3. Appendix 1. Where the average size in col.1 is not the corporate capital used to calculate Table 2 divided by the number of corporations in Table 1, we have indicated why in a footnote. Col 2 Moore (2010 Tables II and IV) for ten countries (we are particularly grateful to Lyndon Moore for providing precise figures for average capital). Moore’s data relate to December 1910 and are confined to the major national exchange (except for Canada, which includes both Montreal and Toronto, and for the UK, which includes a few provincially‐listed companies) and sometimes to actively‐traded equity shares, rather than all listed or traded companies (though a revised version will eventually expand the coverage). He includes foreign as well as domestic quoted companies, if they are listed on the domestic exchange, and counts each security separately (the numbers of securities is higher than the number of companies because some firms, for example, issued both ordinary and preference stock). Data with a † are for 1913 and derived from Rajan and Zingales (2003, Tables 2 and 5), including only domestic corporations and relating to companies, not securities. Their averages ‐ for Australia $5,108,389, for France $13,440,782, for Italy $1,770,612, for Japan $3,208,129, for the Netherlands $1,557,951, for Switzerland $4,712,209, for the US $33,284,483 ‐ differ from Moore’s. With the exception of Australia and Switzerland, Moore’s figures (preferred in the second column) are higher: often because including foreign quoted companies raises the mean, more than dividing by securities rather than companies reduces it, though there are other reasons for the variations: for example, Rajan and Zingales (but not Moore) include multiple exchanges for the US and Japan. We have not reported some figures from Rajan and Zingales (UK, Cuba, Chile, India) because, on the basis of their unpublished data appendix, we believe they are inaccurate/unsupported and for the capitalization of the Alexandria (Egypt) bourse in 1913 and for Chile we have substituted the figures in Annuaire Internationale de Statistique and for Belgium the January 1911 figure from Neymarck (see Appendix 1 for our justification).
Table 3 shows the average share capital of all companies (at par) in column 1, all
converted to US$ at market exchange rates, with, in the following columns, indicators of the size of
public companies (at market and par), where available. We do not here use the legally‐defined
64 The higher number of companies than of securities in the previous column arises because the newspaper sources used omitted at least half of the Tokyo Stock Exchange’s listed companies (see Appendix 1): it was generally the smaller listed companies that were not reported in the press. Rajan and Zingales figures for 1913 for 389 companies (including some quoted on other Japanese stock exchanges) show a smaller average size at market of $3,208,129.

29
figures already mentioned, because only Germany and Austria, among the countries that made a
legal distinction, reported appropriate statistics for them separately at this time.65 Instead we use as
an indicator of public company size the mean size of listings on their major stock exchange, available
for more countries at market than at par and usually for our target date of 1910 (figures for that year
are in most cases an average per equity security: usually lower than per company because a
company can issue more than one type of equity; for some countries figures are available only per
company and for nearby years). Of course companies listed on major exchanges were larger than
those then traded on the many regional exchanges and, a fortiori, larger than public companies
defined legally (which were sometimes traded infrequently or not at all).66 The proportion of
companies listed on major metropolitan exchanges differed between countries more than the ratio
of these companies’ capital to GDP. For example, the St Petersburg exchange listed as many as one
in six Russian companies, while the NYSE listed only around one in a thousand North American ones,
so their stock market capitalizations were much closer together relative to GDP than our statistics of
corporate capital in table 2 covering all corporations.67
The figures in columns 2 and 3 of Table 3 are highly sensitive to the numbers to which
they relate (shown in brackets after the average capital). The US, for example, appears to have
publicly‐quoted firms on its major exchange which are larger than the UK’s, but that is because the
LSE was more developed than the NYSE, in that it listed many more firms and had a much higher
ratio to GDP. If we take a similar number of large UK‐owned firms traded in London as were listed on
the NYSE, their companies were of similar average size. It is true that no European industrial
companies could match the size of US Steel or Standard Oil, but focus on a few outliers seriously
misleads: lower down the manufacturing size range and in banking, railways, shipping and other
sectors many European corporations were as large or larger. British corporations, in particular, also
65 For example, statistics of paid‐up capital in public and private companies separately appear to be available for India only from 1920 and for the UK only from 1926. 66 Michie (2006, chapter 5) is the best guide to the complexities of stock exchanges around 1910. 67 At market prices in 1913 the NYSE ratio was 24% and the St Petersburg ratio 18% (Rajan and Zingales 2003, Moore 2010).

30
had far more multinational investments serving wider markets. The US’s relatively low ranking in
column 1 (despite its undoubted industrial giants) reinforces our earlier point: America’s
“exceptionalism” consisted not in its corporate giants but in its small corporations outnumbering
those in all the rest of the world.
The mean figures in column 1 offend other conventional characterizations. We will
search the business history literature in vain for explanations of why Argentina had the largest
companies in the world and Japan among the smallest, or of why Italian companies were twice the
size of German ones. Such paradoxes are also easily resolved: the literature highlights conspicuous
examples in the numerator (reflected more obviously in column 2), while the averages in column 1
are driven by the denominator (the means tend to be lower where the corporate form had
penetrated most in numerical terms). Norway had smaller companies than any other country, but it
was also the only European country with more than two thousand companies per million people.
Russia had high mean corporate sizes because many small partnerships and sole proprietorships
(which in Norway would have been incorporated) did not seek the Tsar’s permission to incorporate.
Laggards in Table 1 are naturally “leaders” in Table 3: Argentina had only several dozen companies
per million people. Note, however, that this explanation does not appear to apply to the Asia‐Pacific
region. These countries often had relatively few companies per million people (Australasia is the
exception), but still had relatively small corporations.
The distinctive bunching of countries arranged by the mean capital of all their
corporations in column 1 is remarkable. The top (“A”) division of Table 3 consists almost exclusively
of “enclave” economies in which large foreign enterprises dominated their corporate economies
(Austria is the odd man out).68 In some a racially‐distinct, or distinctly immigrant, local merchant‐
financier elite also dominated much domestic enterprise (Haber 1989). Sometimes most of their
corporate capital was foreign‐owned ‐ and sometimes traded mainly on overseas stock exchanges ‐
and in all of them a large fraction was. Monopolistic or oligopolistic firms with crony capitalist links
68 Austrian GmbHs had already overtaken the number of AGs three years after their introduction, but it took a few more years for them to reach German levels, reducing Austria’s mean company size to the European norm.
31
to government (often involving monopolistic concessions or privileged financial access) were
common. There is scant evidence of a significant and vibrant local private company sector in these
economies; indeed the average size of all companies is near to that of those quoted on their major
stock market.69 In Rio de Janeiro, only 49 of the 199 companies noted in the Jornal de Comercio were
not registered with the Rio stock exchange and Brazil was by no means the least hospitable to new
entry or most prone to crony capitalism: indeed it had relatively vibrant locally‐owned companies
and banks by Mexican standards (Haber 1991, Hanley 1998). The paucity of private companies may
be a reflection at the corporate level of the inequalities in these societies of wealth and human
capital rooted in early factor endowments that others have noted (Sokoloff and Engerman 2000),
rather than a consequence of their corporate laws.
The central section (“B”), with middling average company sizes, basically consists of
European economies, the US and Canada (though South Africa ‐ despite distinct “enclave”
characteristics ‐ had a sufficiently large private company sector to join the more developed
economies). These economies, of course, had some very large companies (indeed the stock
exchange data in columns 2 and 3 suggest, unsurprisingly, that their publicly‐quoted companies
were among the largest in the world), but they also had significant numbers of small, private
companies, bringing the mean size in column 1 down.
The lower section (“C”), with generally small companies, contains two disparate groups:
the small north‐west European nations (which had exceptionally large numbers of companies per
million people) and Asia‐Pacific countries (which did not). The latter, like the “enclave” economies,
had relatively few companies, but they had an impressive critical mass of smaller companies driving
down their average size, a characteristic apparently lacking in most “A” economies at the top of the
table. Although some “C” economies (notably Korea and the Philippines) had “enclave”
characteristics and others (notably Switzerland, Singapore, Australia and New Zealand) were
69 In India, public and private companies were much the same size (n. 44, above), though many public companies were informally traded rather than listed on the stock exchanges of Bombay, Calcutta or Ahmedebad.

32
substantial hosts to inward multinational investment, many of these countries also appear to have
created a significant and vibrant local corporate sector, generally lacking in the “A” economies.70
Perhaps that mattered.
SOME IMPLICATIONS AND FURTHER QUESTIONS
The corporate landscape of 1910 that we have painted contradicts some of the
received wisdom and raises new questions about the nature and role of the corporation. But did
variations in the level and nature of corporatization really matter? Or is our focus on corporations
merely Anglo‐centric “form‐fetishism,” which abstracts from the numerous alternative ways in
which different societies preferred to organise both collectively‐ and personally‐owned businesses?
Were the Muslim sharika, the Sufi brotherhood, the Taiwanese ho‐ku, the Chinese family lineage
trust, the Bulgarian ishljem, the socialist co‐operative, the Asian managing agency house or the
European partnership more culturally appropriate and just as serviceable for most purposes as the
corporation that Anglo‐Americans distinctively favored? We do not doubt that they sometimes were,
though advocates of the point appear to stop short of demonstrating that they were equally
numerous and effective. Moreover, corporations replicating all their characteristics (save their
cultural familiarity) could be constituted in many common law jurisdictions and some civil law ones:
for example, shareholders could be limited to named persons or a family lineage, some (or all)
directors (and/or shareholders) could have unlimited liability, non‐sharia‐compliant loans could be
banned by the corporate charter, profits could be distributed on mutual or cooperative rather than
capitalist lines, and so on. If such modifications were desirable, the demand for them (rather than
the western corporate norm) proved remarkably low.71
70 Some of the small size of companies in “C” countries is because their railways were (mainly) nationalised, though this also applies to some “A” and “B” countries. 71 For example, in 1867 British legislation explicitly permitted companies with unlimited liability directors and limited liability shareholders, but there were hardly any takers. A similar effect could be ‐ and frequently was – more flexibly achieved within ordinary corporations: lenders simply required directors personally to guarantee a loan.

33
The reverse did not generally apply. There were, it is true, some conservative
mutterings against western corporate laws (Rosenthal and Wong, 2011, p. 94), but multicultural
political correctness on this issue did not commend itself to all contemporaries. Many Chinese
entrepreneurs preferred to register in Hong Kong rather than with Qing bureaucrats, native
Taiwanese evaded their racial restriction to traditional ho‐ku by forming corporations with co‐opted
Japanese shareholders (Wang 2000, pp. 156‐7), the colons of Indochina bemoaned their slower
corporate development than neighboring British colonists (Bulletin 1910, p.1) and French
economists openly wondered whether the more liberal corporate laws of Belgium deserved
emulation. Much modern work on path‐dependency and the deep historical roots of development
reminds us of the difficulties of changing developmental trajectories, but we should not forget that
nations do sometimes achieve that change. The evidence seems clear that promoting easy
incorporation was one way that progress could be made in encouraging the competitive diversity
that helps in overcoming pervasive developmental logjams. The twentieth century simply did not
treat form as unimportant: on the contrary the numbers of corporations massively increased in all
countries, even (after a barren interval) in once‐communist societies and faster in many civil law
countries than in the Anglosphere. This trend is difficult to characterize as ill‐advised: the historical
literature supports the view that there are ‐ sometimes moderate, sometimes weaker ‐ links
between corporatization (and other aspects of financial development) and economic growth
(Rousseau and Wachtel 2011, Foreman‐Peck and Hannah 2013). Modern World Bank studies of
business enterprise have also found a significant relationship between the ease of incorporating a
business and the pace of economic development.72 In a world of path‐dependency and information
asymmetry, widespread adoption is not conclusive proof of optimality (and there are many
interesting issues about whether something better would have been possible), but ‐ unlike today’s
defense of intellectual property rights by foisting their patent laws on others by countries that did
72 The studies are reported at www.worldbank.org. Bruhn (201) argues that recent Mexican registration reforms increased corporate numbers by 5%, wage employment by 2.2% and reduced incumbents’ profits by 3%.

34
not themselves respect such rights when they were developing ‐ there is little evidence of coercion
by the self‐interested in the “imperialist” spread of the Anglosphere’s corporate law.
But what exactly did corporations contribute that other forms of business enterprise could
not as easily (or as profoundly) reach? The traditional answer has been that by combining the
resources of multiple owners they gave access to cheaper finance for economies of scale that would
not have been available to individual proprietors with lesser resources seeking to attract funds from
outside creditors or investors without the liquidity and risk benefits of the corporate form.73 That
argument applies mainly to large, stock‐exchange‐listed companies in railways, steel mills, multi‐
branch banking or electric power and thousands of such companies (as table 3 shows) had multi‐
million dollar capitals. Berle and Means believed that such public companies were “so essentially
different in character that they must be regarded as distinct institutions” from private companies
(Berle and Means 1937, p. 418). In the decades after 1910, however, such sectors were declining in
relative importance (despite expanding scale economies in some industries), as wars, revolutions
and market crashes restricted or closed stock exchanges; government securities increasingly
crowded out quoted equities; and technologies like automobiles, electricity and telecoms depended
more on family enterprises (Ford, Fiat, BMW, Siemens, Bosch, Michelin) and tax‐financed state
undertakings (Volkswagen, Shanghai Automotive, roads, electric power and telephone networks)
than had railways, the enterprises that dominated corporate funding of scale economies by
nineteenth century stock exchanges.74 Giant companies also pose dangers: incumbent companies
enjoying market power initially driven by scale economies may resist disruptive change by all means
at their disposal, including political lobbying. Crony capitalist distortions may lead to business rent‐
73 While the Coase (1960) theorem has been used to argue that the liability structure is not important, the existence of transaction costs in monitoring makes limited liability an attractive option (Jensen and Meckling 1976, p. 331). However, there is an extensive modern literature arguing that limitation of liability is not essential to the corporate form, a view which acquires some credibility in light of the fact that in 1910 California had more corporations per million people (Commissioner 1911, p. 75) than anywhere on earth, yet did not introduce limited liability until 1931. 74 Rajan and Zingales (2003). The decline of the ratio of equity capitalization to GDP in France, Germany, Denmark and Sweden was already massive before World War Two and even the US ratio belatedly declined after achieving a peak level in 1929 similar to Europe’s in 1913.

35
seeking overwhelming the creation of new wealth, as in some enclave economies or in recent
excesses by politically‐favored financial institutions.
However, we have noted that the spread of small private companies was also significantly
differentiated internationally: being more common in many advanced economies (and some
developing ones) than in others. Today the dominant corporate business form is the private limited
company. Something more was going on in the twentieth century than increased scale: it was the
promotion of disciplined pluralism through encouraging new entry. This was less evident than scale
economies in the enclave economies at the top of the corporate size table, but flourished in North
America and much of Europe and Asia‐Pacific. That may have been no less critical for future growth.
The most plausibly distinctive service provided by the private corporate form was that of limiting the
downside risk of capitalists and entrepreneurs, so that they were more willing to innovate and take
risks. This benefit was not a free good. The US ‐ and similar promiscuously pluralist economies ‐ not
only had more corporations, but also many more corporate failures than those who chartered less
freely and relied more on central direction by governments and core crony firms.75 In more pluralist
systems experiment and innovation were encouraged, but when they failed they were frequently
and unceremoniously terminated. Corporations thus generated high social costs: it was the creditors
of failed entrepreneurs who shouldered these risks of limited liability.76 Analysts of successful
economic institutions do not usually argue that this is a good idea: on the contrary allowing
entrepreneurs to enjoy upside benefits to the full while externalising their downside costs is usually
75 only about a quarter of US companies established before 1914 survived to that year; in continental Europe the proportion was nearer a half. However, it may be that the high pre‐1914 corporate failure rates, especially noticeable in the US, were merely a consequence of the spread of the corporate form to firms which would have remained simple partnerships in other jurisdictions. Such multi‐owner firms elsewhere no doubt had a similarly high failure rate, albeit in bankruptcies that enforced greater liability on principals and paid greater respect to the property rights of creditors (Jobert and Chevalier, 1986) 76 An alternative argument is that creditors knowingly accept these risks (that is why the law usually requires limited companies to include Ltd, Inc. etc. in their names) and that anyhow ‐ along the lines of the classic Coase (1960) theorem ‐ liability rules are irrelevant, as long as liability is assigned to someone. As with many economic theorems, this is seriously unconvincing, but it provides a useful baseline for assessing why liability rules may actually matter. It should be noted that the political acceptance of capitalism depends partly on the perception of a fair distribution of property rights and that not all creditors are voluntary (in the sense that they have contracted the debt understanding and negotiating its terms): they may for example be tort claimants or day laborers.

36
believed to reduce economic welfare. Were corporations really different or did society pay a high
price for what ought really to be considered a foolish institutional innovation?
The argument in favor of the private corporation is essentially that competitive
assortment of a myriad of small corporate foundations driving Schumpeterian creative destruction ‐
multiple innovations and widespread bankruptcies ‐ increases the rate of successful innovation, so
politicians are wise to socialize as well as privatize at least some of the associated risks. Desirable as
it might be to measure the net benefits of this complex process of creative destruction, it is difficult
with the available corporate data. We cannot easily measure the additional investment induced by
limited liability (though see Foreman‐Peck 1990); the role of limited liability in disciplining monopoly
(John et al 2005); the benefits of risky experimentation that would have been shunned by full
liability partnerships,77 against the large social toll of creditors’ (and shareholders’) losses from the
unpaid debts of corporations, relative to those of principals with full liability. This social downside
had nurtured continuing opposition to the granting of general limited liability in mid‐nineteenth
century Britain and America (Kessler 2003, pp. 531‐2, Bryer, 1997, pp. 45‐8) and legislators later
struggled hard (and often ineffectually) with corporate transparency laws, prospectus regulation and
bankruptcy laws to magnify the positives and limit the negatives. Nonetheless, to borrow a phrase
from an observer of Victorian skulduggery, “dishonesty magnificent in its proportions” (Trollope
1883) has recently reminded us of the downside of corporate fraud and hubris encouraged by
limited liability: from Enron and Lehman Brothers, through Parmalat and Northern Rock to Olympus
Camera .
The notion that economic growth in the Anglosphere was mainly driven by corporations
fostered by flexibly innovative legal systems, while, say, Latin America, France and Japan were
77 In principle something might be done with corporate and non‐corporate patent statistics but we are not aware of that having been systematically attempted. In the special case of UK banks before 1914 (whose liability varied from completely limited to completely unlimited) there is clear evidence that limiting liability increased banks’ appetite for risk (Grossman and Imai, 2012), though, of course, as our present discontents in that department suggest, the optimal level of risk‐taking is not the maximum.

37
handicapped by a legal institutional pathology denying them similar corporatization and growth
appears over‐simplistic. The Scandinavian examples show that civil law could sometimes warm to
corporations. Even civil law countries like France and Argentina that had relatively few corporations
were already comfortably rich in 1910. Common law Malaya and Singapore had proportionately
more corporations than civil law Japan, but were a little poorer. While cheap incorporation and
flexible corporate laws promoted corporatization, other factors ‐ perhaps various mixes of poor
human capital endowments, inequalities inhibiting entrepreneurship, and baneful political, cultural
or trade influences ‐ slowed down the symbiotic growth of both corporatization and living standards
in many developing countries.(Foreman‐Peck and Hannah 2013 and see Appendix 3, below) In the
twentieth century, it was often changes in these other variables, rather than in corporate laws,
which enabled societies like the Asian tigers (not all of which began the twentieth century with high
levels of corporatization) to reverse the divergence of their living standards from those in the west
and at the same time to adopt the corporate form more wholeheartedly. Cheap, easy and flexible
incorporations that were once concentrated in common law countries are, of course, only part of
that story, but one which countries with civil law systems ‐ especially the more sclerotic ones ‐ were
probably very wise to encourage.
Appendixes 1 and 2.
These are 140 pages long. The sections on individual countries can be made available on request to
the author ([email protected]).
Appendix 3. Abstract from Foreman‐Peck and Hannah (2013).
Log GDP in 1975 predicted by log corporations per head in 1910

38
The association of corporatization with high subsequent real incomes per head is confirmed by
regression analysis. It might be thought the correlation arises because corporations per head in 1910
are correlated with GDP per head around that time (which is true), and the real association is
between GDP in 1975 and in 1910/1913. However including 1913 GDP in the OLS regression,
although markedly reducing the size of the coefficient on corporations from 0.36 to 0.13, does not
eliminate its statistical significance.
What does it mean to say that corporatization in 1910 predicts GDP per capita in 1975? At one level,
simply that those influences that boosted earlier corporatisation, unmeasured here, also seem to
have enhanced subsequent GDP. The implication then is that corporatisation need have played no
causal role at all; it is the correlation of the unmeasured influences with corporatisation which
prevents the identification of corporatization’s true effects on 1975 GDP. An approach to controlling
for such unmeasured, and perhaps unmeasurable, influences on 1975 GDP is to instrument log of
corporations with Scandinavian civil law and log of 1913 gdp. This yields a highly significant larger
coefficient on corporatisation of 0.425. So it does look as if there is some evidence that corporate
Algeria (F)
Argentina
Australia (B)Austria Belgium
Brazil
British India (B)
Bulgaria
Cameroon (F)
Canada (B)
Ceylon (B) Sri Lanka
Chile
China
Colombia
Cuba
Denmark
Egypt
Fed. Malay States (B)
Finland (R)FranceGermany
Gold Coast (B)
GreeceHong Kong (B)
Hungary
Indochina (F)
ItalyJapan
Kenya (B)
Korea (J)Malaya Malaysia
Mexico
Morocco
NetherlandsNew Zealand (B)
Nigeria (B)
Norway
Ottoman Empire Turkey PanamaPeru
Philippines (US)
Portugal
Rumania
RussiaSerbia
Siam Tailand
Sierra Leone (B)
South Africa (B)
Spain
SwedenSwitzerland
Taiwan (J)
Togo (G)
Tunisia (F)
Uganda (B)
UK
Uruguay
USA
Venezuela
67
89
10
0 2 4 6 8lc
ly1975 Fitted values
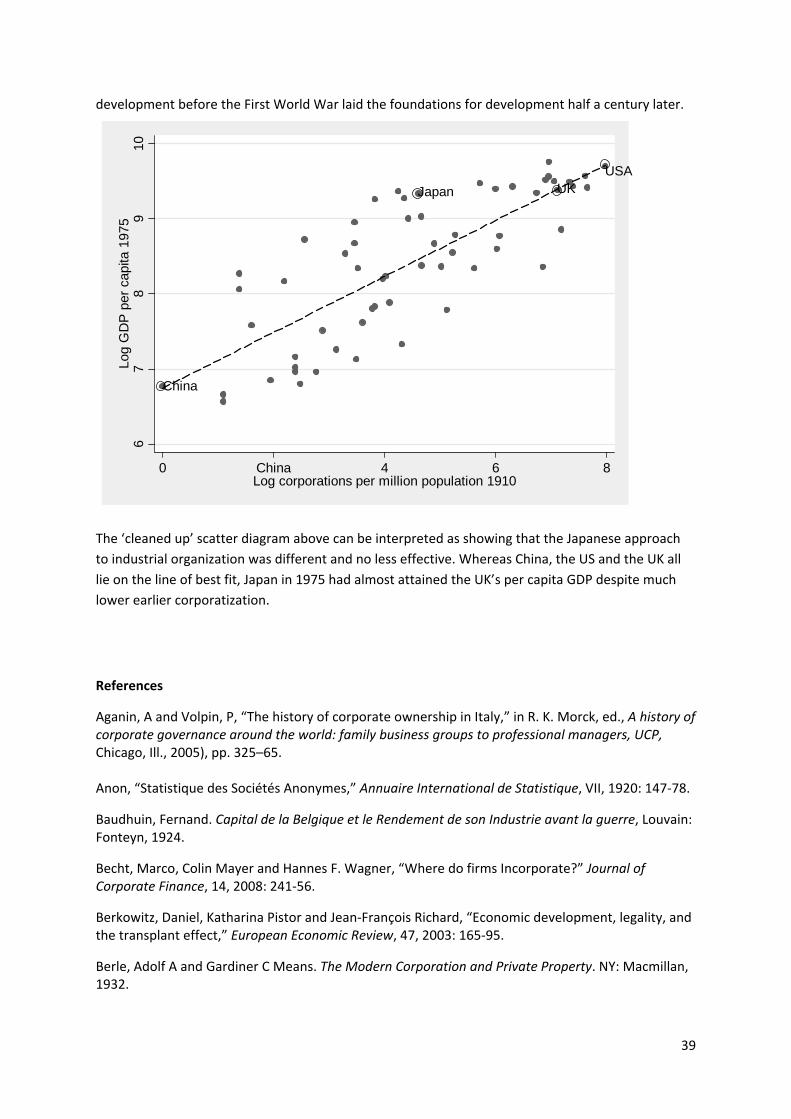
39
development before the First World War laid the foundations for development half a century later.
The ‘cleaned up’ scatter diagram above can be interpreted as showing that the Japanese approach
to industrial organization was different and no less effective. Whereas China, the US and the UK all
lie on the line of best fit, Japan in 1975 had almost attained the UK’s per capita GDP despite much
lower earlier corporatization.
References
Aganin, A and Volpin, P, “The history of corporate ownership in Italy,” in R. K. Morck, ed., A history of corporate governance around the world: family business groups to professional managers, UCP, Chicago, Ill., 2005), pp. 325–65. Anon, “Statistique des Sociétés Anonymes,” Annuaire International de Statistique, VII, 1920: 147‐78.
Baudhuin, Fernand. Capital de la Belgique et le Rendement de son Industrie avant la guerre, Louvain: Fonteyn, 1924.
Becht, Marco, Colin Mayer and Hannes F. Wagner, “Where do firms Incorporate?” Journal of Corporate Finance, 14, 2008: 241‐56.
Berkowitz, Daniel, Katharina Pistor and Jean‐François Richard, “Economic development, legality, and the transplant effect,” European Economic Review, 47, 2003: 165‐95.
Berle, Adolf A and Gardiner C Means. The Modern Corporation and Private Property. NY: Macmillan, 1932.
China
USA
Japan UK
67
89
10Lo
g G
DP
per
cap
ita 1
975
0 4 6 8ChinaLog corporations per million population 1910

40
____________________________. “Corporations,” in International Encyclopedia of the Social Sciences. New York: Macmillan, 1937, vol. 3.
Borgmeyer, Charles L. American Corporation Legal Manual. Plainfield NJ: Corporation Legal Manual Co, 1910.
Borodkin, Leonid I and Gregory Perelman. “St Petersburg Exchange: on the road to maturity. Industrial Stock Index, 1897‐1914.’ In Y. Cassis and L. Quennuoëlle‐Corre, eds., Financial Centres and International Capital Flows in the Nineteenth and Twentieth Centuries, Oxford: OUP, 2011: 96‐125.
Bowstead, William, ed. Commercial Laws of the World, 35 volumes. London: Sweet & Maxwell, n.d. (1911‐14?)
Brav, Omer. “Access to Capital, Capital Structure and the Funding of the Firm.” Journal of Finance, 64, 1, February 2009: 263‐308.
Brenninkmayer, Ludger. Die Amsterdamer Effektenbörse. Berlin: Ebering, 1920.
Bruhn, Miriam. “License to Sell: The Effect of Business Registration Reform on Entrepreneurial Activity in Mexico.” Review of Economics and Statistics, 93, 1, February 2011: 382‐8.
Bryer, R. A. “The Mercantile Laws Commission of 1854 and the political economy of limited liability.” Economic History Review, L, 1, 1997: 37‐56.
Burdick, Francis M. “Limited Partnership in America and England.” Michigan Law Review, VI, 7, May 1908: 525‐32.
Burhop, Carsten. “Die Technik des Gründungsgeschäfts in der Hochindustrialisierung, ” (Translated as “Initial public offerings in the German Empire, 1871‐1913,” University of Muenster working paper, 2006).
Butler, Nicholas Murray. Why should we change our form of Government? address to Commercial Club of St Louis, 17 November 1911, reprinted NY: Scribner’s, 1912.
Cassis, Youssef. Big Business: the European experience in the twentieth century. Oxford: OUP, 1997.
Chandler, Alfred D, Scale and Scope: the dynamics of industrial capitalism. Cambridge MA: Harvard University Press, 1990.
Coase, R. H, “The Problem of Social Cost,” Journal of Law and Economics, 3, 1960: 1‐44.
Colli, Andrea. The history of family business, 1850‐2000. Cambridge: CUP, 2003.
Commissioner of Internal Revenue. Annual Report for the Fiscal Year ending 30 June 1911. Washington DC: GPO. 1911.
Companies House, Annual Report 2012. London: HMSO, 2012.
Corley, T. A. B. “British Overseas Investment in 1914 Revisited,” Business History, 36, 1, January 1994: 71‐88
Davis, Lance E and Robert A Huttenback. Mammon and the Pursuit of Empire: the political economy of British imperialism, 1860‐1912. NY: Cambridge University Press, 1986.
_________ and Robert E Gallman. Evolving financial markets and international capital flows: Britain, the Americas and Australia, 1865‐1914. NY: CUP, 2001.

41
De Long, J Bradford. “Did J P Morgan’s men add value: an economist’s perspective on financial capitalism, in Inside the Business Corporation (ed. Peter Temin), Chicago: UCP, 1990: 205‐36.
De Luca, Guiseppe (ed.), Le sociétà quotate alla Borsa valori di Milano da 1861 al 2000. Milan: Libri Scheiwiller, 2002.
Department of Finance. Financial and Economic Annual of Japan 1911. Tokyo: GPO, 1911.
Djankov, S, R La Porta, F Lopes‐de‐Silanes et al, “Courts: The Lex Mundi Project,” NBER Working paper, no 8890, 2002. Edwards, Jeremy and Sheilagh Ogilvie. “Universal Banks and German Industrialization: a Reappraisal,” Economic History Review, 49, 3, 1996: 427‐46.
Eigner, Peter, “In the Centre of Europe: Vienna as a Financial Hub, 1873‐1914,” in G D Feldman and P Hertner, eds, Finance and Modernization: a Transnational and Transcontinental Perspective on the Nineteenth and Twentieth Centuries. Farnham: Ashgate, 2008.
Faccio, Mara and Larry H P Lang. “The Ultimate Ownership of Western European Corporations.” Journal of Financial Economics, 65, 3, 2002: 365‐95.
Forbes, Kevin F. “Limited Liability and the Development of the Business Corporation.” Journal of Law, Economics and Organization, 2, 1, Spring 1986: 163‐77.
Foreman‐Peck, James, “The 1856 Companies Act and the Birth and Death of Firms, “ in Philippe Jobert and Michael Moss, eds, The Birth and Death of Companies: an Historical Perspective. Carnforth: Parthenon, 1990: 33‐46.
_________________and Leslie Hannah. “Extreme divorce: the managerial revolution in UK companies before 1914.” Economic History Review, 65, 4, November 2012: 1207‐38.
Freeman, Mark, Robin Pearson and James Taylor. Shareholder democracies? Corporate governance in Britain and Ireland before 1850. Chicago: University of Chicago Press, 2012.
Gebhard, Hellmut. Die Berliner Börse. Berlin: Prager, 1928.
Goldsmith, Raymond, W. Comparative national balance sheets: a study of twenty countries, 1688‐1978. Chicago: University of Chicago Press, 1985,
Gómez‐Galvarriato, Aurora and Aldo Musacchio “Organizational choice in a French Civil Law underdeveloped economy: Partnerships, Corporations and the Chartering of business in Mexico, 1886‐1910,” Harvard Business School Discussion Paper, 2012.
Gore‐Browne, Sir Francis. A Handy Book on the Formation, Management and Winding Up of Joint Stock Companies, 24th edition. London: Jordan, 1909.
Greenwood, W. J. Foreign stock exchange practice and company laws of all the chief countries of the world, London: Financial Books, 1911.
Grossman, Richard S and Masami Imai, “Contingent capital and bank risk‐taking among British banks before the First World War.” Economic History Review, 66, 1, February 2013: 135‐55.
Guinnane, Timothy W. “Delegated Monitors, Large and Small: Germany’s Banking System, 1800‐1914.” Journal of Economic Literature, XL, March 2002: 73‐124.

42
Guinnane, T W ,T, R. Harris, N. Lamoreaux and J‐L Rosenthal (“Putting the Corporation in its Place,” Enterprise and Society, 8, September 2007: 687‐729
Guinnane, T.W, T. R. Harris, N. R. Lamoreaux, J‐L. Rosenthal, “Pouvoir et propriété dans l’entreprise: pour une histoire internationale des societies à responsabilité limitée,” Annales, 63, 1, 2008, pp. 73‐110.
Haber, Stephen H. Industry and Underdevelopment: the Industrialization of Mexico, 1890‐1940. Stanford CA: Stanford University Press, 1989.
______________. “Industrial Concentration and the Capital Markets: A Comparative Study of Brazil, Mexico, and the United States, 1840‐1930.” THIS JOURNAL, 51, 3, 1991: 559‐80.
Hanley, Anne. “Business Finance and the São Paolo Bolsa, 1886‐1917,” in John H Coatsworth and Alan M Taylor, eds., Latin America and the World Economy since 1800. Cambridge MA: HUP, 1998: 115‐38.
Hannah, Leslie. “Multinationality: Size of Firm, Size of Country and History‐Dependence,” Business and Economic History, 25.2, winter 1996, pp. 147‐50.
_____________. “Strategic Games, Scale and Efficiency, or Chandler goes to Hollywood,” in R. Coopey and P. Lyth, eds, Business in Britain in the Twentieth Century. Oxford: OUP, 2009: 15‐47.
_____________, a “London as the Global Market for Corporate Securities before 1914,” in Y. Cassis and L. Quennuoëlle‐Corre, eds., Financial Centres and International Capital Flows in the Nineteenth and Twentieth Centuries, Oxford: OUP, 2011: 126‐60
_____________. b“J. P. Morgan in London and New York before 1914,” Business History Review, 85, Spring 2011: 113‐50.
_____________, ”The Corporate Economies of America and Europe, 1790‐1860,” University of Tokyo, CIRJE Discussion paper, February 2013.
Harris, Robert S, Tim Jenkinson and Steven M Kaplan, “Private Equity Performance. What do we Know?” NBER Working paper 17874, Feb 2012.
Headrick, Daniel R. The tentacles of progress: technology transfer in the age of imperialism 1850‐1940. NY: OUP, 1988)
Hilt, Eric and Katharine O’Banion, “The Limited Partnership in New York, 1822‐1858,” Journal of Economic History, 69, 3, September 2009: 615‐45.
Hong Kong Government Gazette, 15 December 1911.
Hong Kong Companies Registry website (accessed 25 December 2012)
Houpin, C. Traité Générale théorique et pratique des Sociétés Civiles et Commerciales, Paris, 4th edition, vol 1, 1912.
Hoshi, Takeo and Amil K Kashyap. Corporate finance and governance in Japan: the road to the future. Cambridge MA: MIT Press, 2001.
Huang, Yasheng, Capitalism with Chinese Characteristics. New York: Cambridge University Press, 2008.

43
Jensen, Michael C and William H Meckling, “Theory of the Firm: Managerial Behaviour, Agency Costs and the Ownership Structure,” Journal of Financial Economics, 3, 1976: 305‐60.
Jensen, Michael C. “Eclipse of the Public Corporation.’ Harvard Business Review, 67, 5, Sep‐Oct 1989: 61‐74.
Jobert, Phillippe and Jean‐Claude Chevalier. “La démographie des entreprises en France au XIXe siècle,” Histoire, économie et société, 5, 2, 1986: 233‐64
John, Teresa A, Lemma W Senbet, Anant K Sundaram and Peter A Woodward, “Limited Liability and Market Power,” Review of Quantitative Finance and Accounting, 25, 2005: 215‐31.
Kessler, Amalia D. “Limited Liability in Context: Lessons from the French Origins of the American Limited Partnership,” Journal of Legal Studies, 32, June 2003: 511‐48.
Kocka, J. “Entrepreneurs and managers in German industrialization”, in M. M. Postan, D. C. Coleman, and P. Mathias, eds.. The Cambridge Economic History of Europe, vil, pt. i. The industrial economies: capital, labour, and enterprise. Cambridge: CUP, 1978: 492‐589. Kocka, J and H. Siegrist, “Die hundert grössten deutschen Industrieunternehmen im späten 19 und frühen 20. Jahrhundert,” in N. Horn and J. Kocka eds., Law and the Formation of Big Enterprises in the 19th and early 20th Centuries, Vandenhoeck and Ruprecht, Göttingen, 1979: 55‐122.
Kramer, Robert, “Foreword.” Law and Contemporary Problems, 18, 4, 1953: 433‐4.
Krüger, Hans, Das Reichgesetz betreffend die Gesellschaft mit beschränkter Haftung. Berlin: Guttentag, 1912.
Kuran, Timur. The Long Divergence: How Islamic Law held back the Middle East. Princeton NJ: PUP, 2011
La Porta,R, F Lopes‐de‐Silanes, A Shleifer and R Vishny, “Law and Finance,” Journal of Political Economy, 106, no 6, 1998: 1113‐1155
Liu, L. “Income Taxation and Business Incorporation: evidence from the early Twentieth Century,” Oxford University Centre for Business Taxation, WP12/05, March 2012.
Lough, W H. Corporation Finace. NY: Alexander Hamilton Institute, 1914.
McQueen, Rob, “Company Law as Imperialism,” Australian Journal of Corporate Law, 5, 2, 1995: 187‐213.
Maddison, Angus, The World Economy. Paris: OECD, 2006.
Michie, Ranald C. The Global Securities Market: A History. Oxford: OUP, 2006.
Micklethwait, J and A. Wooldridge, The Company. London: Weidenfeld & Nicolson, 2003.
Morck, Randall K (ed). History of Corporate Governance around the World. Chicago: UCP, 2005.
Narta, S. S. Capital Issues in India. Delhi: Kanishka, 1992.
Nash, Robert Lucas. Australasian Joint Stock Companies Year Book for 1913‐4. Sydney: Critchley Parker, 1914.

44
Neymarck, Alfred, “La statistique international des valeurs mobilières,” Bulletin of the International Statistical Institute, XIX‐2, 1912: 201‐424.
_________________________________________________________________________________________________, XX‐2, 1915: 1296‐1539.
Official Year Book of New Brunswick 1910. Fredericton: Government Printer, 1911.
O’Rourke, Kevin H, Ahmed S Rahman and Alan M Taylor, “Trade, technology and the Great divergence,” United States Naval Academy Department of Economics Working Paper 2011‐35.
Ostergaard, Charlotte, and David C. Smith. “Corporate Governance before there was Corporate Law.” University of Virginia, McIntire School of Commerce, working paper, April, 2011
O’Sullivan, Mary. Bonding and Sharing Corporate America. NY: Oxford University Press, forth coming.
___________. “The Expansion of the US Stock Market, 1885‐1930: Historical Facts and Theoretical Fashions.” Enterprise and Society, 8, 3, September 2007: 489‐542.
Owen, Thomas C. The Corporation under Russian Law, 1800‐1917, CUP, New York, 1991.
Pargendler, Maria & Henry Hansmann . “A new view of shareholder voting in the nineteenth century: evidence from Brazil, England and France, Business History, DOI:10.1080/00076791.2012.741972 Passow, R. Die wirtschaftliche Bedeutung und Organisation der Aktiengesellschaft, Fischer, jena, 1907. Pistor, K., Y. Keinan, J. Kleinhesterkamp and M. D. West, “The Evolution of Corporate Law: A Cross‐Country Comparison,” University of Pennsylvania Journal of International Economic law, 23, 4, 2002, pp. 791‐876.
Priez, Joseph, Manuel‐Guide Pratique de Fondateurs, Administrateurs et Actionnaires de Sociétés Anonymes. Paris: Roger, 1911.
Rajan Raghuram G and Luigi Zingales. “The great reversals: the politics of financial development in the twentieth century.” Journal of Financial Economics, 69, 2003: 5‐50.
Rosenthal, Jean‐Laurent and R Bin Wong. Before and Beyond Divergence: The Politics of Economic Change in China and Europe. Cambridge MA: HUP, 2011.
Rousseau, Paul and Peter Wachtel. “What is happening to the impact of financial deepening on economic growth?” Economic Inquiry, 49, 1, January 2011: 276‐88.
Rudolph, Richard L. “Austria 1800‐1914,” in Rondo Cameron, ed., Banking and Economic Development. NY: OUP 1972: 26‐57.
Saint‐Léon, Et. Martin. “Commandite in France,” Economic Journal, 17, June 1907: 284‐87.
Sokoloff, Kenneth L and Stanley L Engerman. “Institutions, factor endowments, and paths of development in the New World.” Journal of Economic Perspectives, 14, 3, Summer 2000: 217‐32.
Straits Settlements Blue Book 1911. Singapore: Government Press, 1912.
Stulz, René M, and Rohan Williamson, “Culture, openness and finance,” Journal of Financial Economics, 70, 2003, pp. 313‐49.

45
Sylla, Richard, “Financial Systems and Economic Modernization,” THIS JOURNAL 2002: 277‐92.
__________.”Political economy of financial development: Canada and the United States in the Mirror of the Other, 1790‐1840.” Enterprise and Society, 7, 4, December 2006: 633‐65.
Taussig, F and W.S. Barker, “American Corporations and their Executives: A Statistical Inquiry,” Quarterly Journal of Economics, 40, 1, November 1925: 1‐51.
Trivett, John B. Official Year Book of New South Wales 1914. Sydney: Gullick, 1915.
Trollope, Anthony. Autobiography. 1883 (1962 ed cited)
Wang, Tay‐sheng, Legal Reform in Taiwan under Japanese Rule, 1895‐1945, University of Washington Press, Seattle, 2000.
Williams, E. T. Recent Chinese Legislation relating to Commercial, Railway and Mining Enterprises, Shanghai Mercury, Shanghai, 2nd edition , 1905.
Worswick, G D N and D G Tipping, Profits in the British Economy 1909‐1938, Blackwell, Oxford, 1967.
Wright, Robert E. Corporation Nation: Rise and Demise of the American Economic Juggernaut (forthcoming, University of Pennsylvania Press, online at http://ssrn.com=1855029).
____________. “Chartermongering by South Dakota in the early twentieth century.” Augustana College working paper February 2012, forthcoming in Jon Lauck and John E Miller, eds, Plains Political Tradition series, vol 2: Pierre SD: South Dakota State Historical Society Press.
![STATE CORPORATIONS ACTextwprlegs1.fao.org/docs/pdf/ken106439.pdf · State Corporations CAP. 446 State Corporations Act S17 - 3 [Issue 1] CHAPTER 446 STATE CORPORATIONS ACT ARRANGEMENT](https://img.pdfslide.us/doc/110x75/5e6b30d351fde5425f631977/state-corporations-state-corporations-cap-446-state-corporations-act-s17-3-issue.jpg)