Embed Size (px)
Citation preview
Journal of Civil Engineering and Architecture 10 (2016) 553-562 doi: 10.17265/1934-7359/2016.05.004
A GIS Model for Analyzing Airspace Obstructions and
Safety near Airports
Sze-Wei Chang
Department of Aviation Management, China University of Science and Technology, Hsinchu 31241, Taiwan
Abstract: The purpose of Federal Aviation Regulations Part 77, entitled “Objects Affecting Navigable Airspace”, is to identify potential hazards and prevent adverse impacts to the safe and efficient use of navigable airspace. The OIS (obstruction identification surfaces) represent these regulations, identify objects that penetrate these imaginary surfaces, evaluate hazardous effects, and ensure safe separations of aircraft from obstructions. The OIS evaluation is often used for selecting airfield locations and runway orientations. More importantly, the OIS evaluation is an airport’s safeguard against flawed urban development, especially for airports near rapidly expanding cities. Without accurate analysis tools, hand-calculation errors on the OIS can occur and cause adverse impacts to airport safety. Applying the GIS (geographic information system) features of geospatial data and 3D formats, this paper proposes a model named GIS Obstruction Model which is capable of precisely calculating maximum allowable heights and creating visual imagery of penetrating obstructions. The special features of the model include web-based design, adaptability to any airport, user-friendly multiple inquiry methods, quick response to online inquiries, and response with 3D visual reality. The proposed GIS Obstruction Model is useful for airport planning, architecture design, safety management or civil engineering permit review.
Key words: Obstruction identification surfaces, geographic information systems, airport design, obstruction evaluation, obstacle limitation surfaces.
1. Introduction
Airspace protection and obstacle clearance are vital
to airport and aircraft operation. Restrictions should be
established on the heights of buildings, antennas, trees
and other objects as necessary to protect the airspace
needed for safe operation of the airport and aircraft.
The methods for determining the complex airport
imaginary surfaces are the regulations of the FAR
(Federal Aviation Regulations) Part 77 “Objects
Affecting Navigable Airspace” [1]. They are used to
identify potential aeronautical hazards, thus preventing
or minimizing adverse impacts to the safe and efficient
use of navigable airspace.
The OIS (obstruction identification surfaces), which
graphically represent the FAR Part 77 regulations, are
used to identify objects that penetrate these imaginary
surfaces, to evaluate hazardous effects and to ensure
Corresponding author: Sze-Wei Chang, assistant professor,
research fields: airport design, airline management, air traffic control and fleet planning.
the safe separations between aircraft and obstructions.
The OIS evaluation is often used for new airfield
location selection and runway orientation
determination. More importantly, the OIS evaluation is
an airport’s safeguard against flawed urban
development, especially for airports near rapidly
expanding cities. Market forces often lead real estate
development interests to propose buildings in the
vicinity of an airport. Building developers, of course,
are interested in maximizing their return on investment,
which is most often achieved by developing to the
“highest and best use” potential of their land, and as
such can desire to build structures of substantial height
above the ground. The proposed building permit
evaluation procedures are mainly circulated among
local government, airport authority and aviation
administration [2]. Without accurate and handy tools,
hand-calculation errors on the restrictive height/area of
the OIS could occur and caused adverse impacts to
airport safety. For example, the Taipei Songshan
D DAVID PUBLISHING
A GIS Model for Analyzing Airspace Obstructions and Safety near Airports
554
Airport (IATA (International Air Transport
Association) airport code: TSA; ICAO (International
Civil Aviation Organization) airport code: RCSS) is
adversely affected by the obstructing Taipei 101
Building, because mistakes in restrictive area
calculations were made when the proposal was
reviewed by the Taipei City Government and Civil
Aviation Authority [3]. The objective of this paper is to
develop a model, called the GIS (geographic
information system) Obstruction Model, with the
special features of precisely calculating restrictive
height/area of the OIS and creating visual imagery of
obstacles penetrating them. The model applies a GIS’s
features of geospatial data and 3D visualization to
achieve the overall objective.
2. Literature Review and Methodology
Litsheim and Xiao [4] commented that airspace
protection and obstacle clearance are vital to airport
and aircraft operations. Restrictions should be
established on the heights of buildings, antennas, trees,
and other objects as necessary to protect the airspace
needed for operation of the airports and aircraft. The
most commonly used criteria for determining
complicated airport obstacles are FAR Part 77
imaginary surfaces. Horonjeff’s textbook Planning &
Design of Airports, which is widely-used in colleges
and graduate schools for airport related courses,
demonstrates many OIS example problems. All of
these problems require detailed calculation to firstly
determine which surface affects any considered
obstruction and then determine the restrictive (i.e.,
maximum allowable) height of the obstacle. The
calculation process is quite complicated and
time-consuming. A slight error in obstacle location can
result in large errors in the restrictive height [5].
The NOAA (National Oceanic and Atmospheric
Administration) have provided aeronautical survey
data to the FAA (Federal Aviation Administration) for
nearly 60 years. These aeronautical survey data help
ensuring the safety of the national airspace system and
provide accurate location information for features and
obstructions on and near airports. The emergence of
GPS (global position system)-based navigation has
increased the demand for accurate aeronautical
surveyed data. NOAA and FAA are currently
developing a new approach to aeronautical surveying
in response to this need [6].
Panayotov and Georgiev [7] present a spatial model
of the airport navigation space with coarsening from
the smaller cells to the larger cells. The model is
designed as an analytic tool with the geometrical data
in the ESRI (Environmental Systems Research Institute)
arc GIS environment. The model uses the concept of
octree to represent the airport space as a cube. An
octree is a tree data structure in which each parental
cube has exactly eight children sub-cubes. Octrees are
most often used to partition a three-dimensional space
by recursively subdividing it into eight octants. The
possible obstruction objects are represented with 3D
octrees that are located and analyzed for a conflict with
the airport space. Panayotov and Georgiev’s paper
shows the capability to compare the obstruction and
restrictive height, no evidence of visualization of the
obstructions that penetrate imaginary surfaces.
Panayotov et al. [8] propose an improved spatial
model which a CADD (computer-aided design and
drafting)/BIM (building information modeling)
module for manmade constructions is added to the
previous arc GIS (for airspace runway analysis) and
octrees (for scalable 3D presentation of the whole
airport space) models. The methods are used in Denver
International Airport Planning Office only, not
web-based design.
Ulubay and Altan [9] present an overview of spatial
data integration from different aspects and explore the
role of visualization. They also examine the use of
analytical and visual types of derived information in
solving spatial problems by presenting a study related
to the construction of obstacle-free zones for airports.
OLS (obstacle limitation surfaces), the topography and
man-made objects were used as cartographic input
A GIS Model for Analyzing Airspace Obstructions and Safety near Airports
555
layers in determining dangerous objects for aircraft and
final analyses results were presented with 3D screen
displays. In the paper, they mainly examine the ICAO
Annex 14 regulations “Obstacle Restriction and
Removal” and OLS, which is slightly different from
FAR Part 77 “Objects Affecting Navigable Airspace”
and OIS [10]. Although discussing the spatial data
integration methodologies, this paper is only contented
with exploring a framework for integration of complex
geographic datasets.
The GIS Obstruction Model presented in this paper
is built in a GIS environment. A GIS is a special type of
information system concerned with geographically
referenced data. A GIS has two distinguishing
characteristics that make it different from a standard
information system. First, the data in a GIS are
spatially referenced with x-y-z or latitude-longitude-
elevation 3D coordinates. Second, a GIS has mapping
capabilities associated with those coordinates. The GIS
Obstruction Model presented here is developed with
the Skyline software system. The Skyline can provide
user roaming of 3D terrain and image, modeling of
objects near the airport and answering of 3D
geo-information inquiring about proposed construction
objects. It allows building multiple layers of imaginary
surfaces with geo-referenced data by using points, lines,
polygons and circles. These imaginary surfaces can be
further digitally mapping to the geo-referenced stereo
imagery in the vicinity of the airport. Its powerful
network feature and terrain server technology
efficiently stream massive amounts of 3D geographic
and geo-referenced data to thousands of concurrent
web-site users, giving each user uninterrupted viewing,
roaming, inquiring and answering service. Table 1
shows the comparison of proposed GIS Obstruction
Model and previous works.
By applying the analytical and geometric method,
the proposed runway endpoints and critical points of
the imaginary surfaces along 3D coordinates are
constructed according to the FAR Part 77 regulations
for specific category of runway. The model is
transformed from flat surface coordinates into UTM
(universal transverse mercator) coordinate system, and
then the WGS84 coordinate system with specific
elevation. The transparent imaginary surfaces with
different colors, which graphically represent the FAR
Part 77 regulations, are generated and overlapped with
the geo-referenced stereo imagery in the vicinity of
the airport.
3. FAR Part 77 Objects Affecting Navigable Airspace
FAR Part 77 establishes standards for determining
obstructions to air navigation. The standards apply to
existing and constructed objects, trees and terrain. The
obstruction identification surfaces, depicting the
standards, are used to ensure safe separations between
aircraft and obstructions. The dimensions of the
imaginary surfaces are based on the category of each
runway (e.g., utility runway or runways larger than
utility) and the type of approach planned for that
runway (e.g., visual, non-precision instrument or
precision instrument).
Fig. 1 shows the dimensions of FAR Part 77
imaginary surfaces for various types of runway
and approach [1]. As an example, the Category E, most
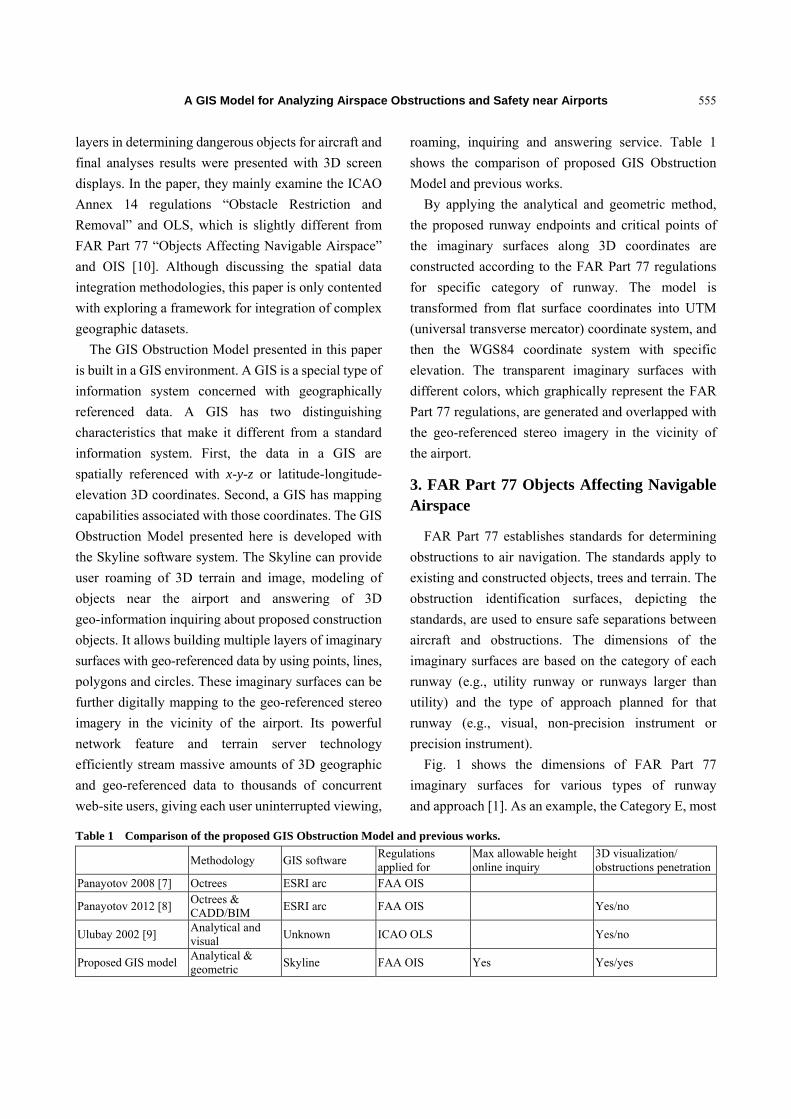
Table 1 Comparison of the proposed GIS Obstruction Model and previous works.
Methodology GIS software Regulations applied for
Max allowable height online inquiry
3D visualization/ obstructions penetration
Panayotov 2008 [7] Octrees ESRI arc FAA OIS
Panayotov 2012 [8] Octrees & CADD/BIM
ESRI arc FAA OIS Yes/no
Ulubay 2002 [9] Analytical and visual
Unknown ICAO OLS Yes/no
Proposed GIS model Analytical & geometric
Skyline FAA OIS Yes Yes/yes
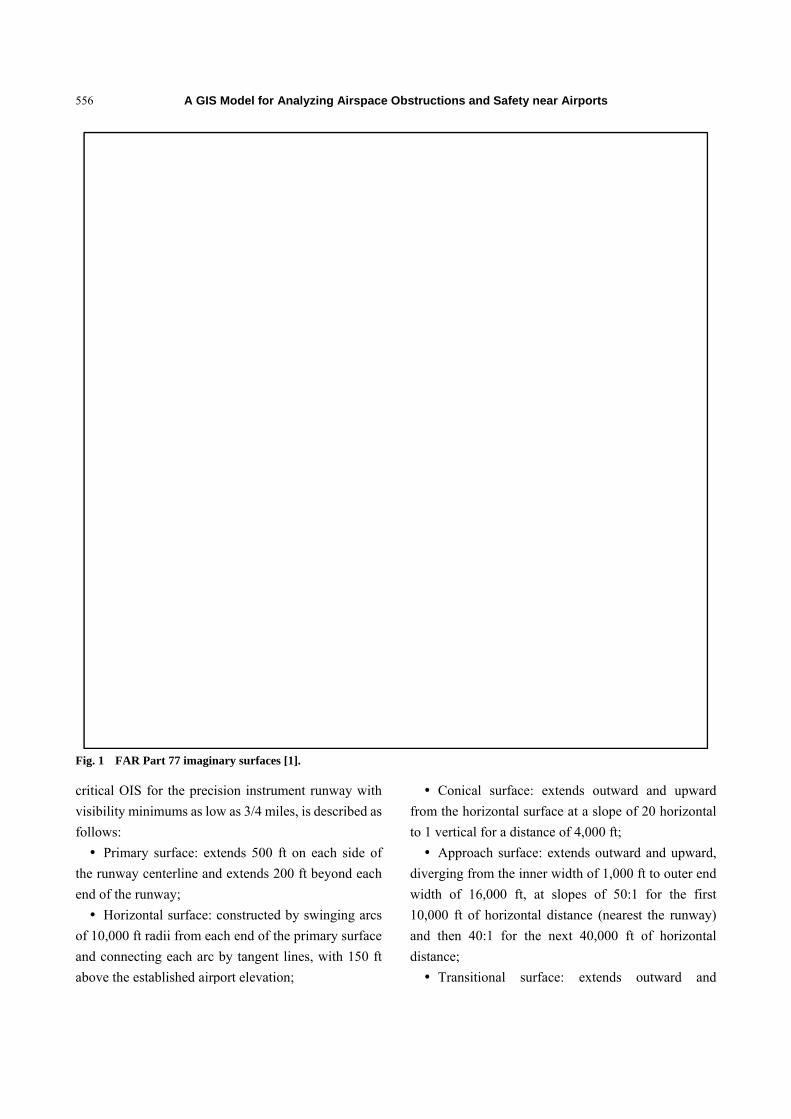
556
Fig. 1 FAR
critical OIS
visibility min
follows:
Primary
the runway
end of the ru
Horizon
of 10,000 ft
and connect
above the es
A GIS
Part 77 imagin
for the preci
nimums as lo
y surface: ex
centerline an
unway;
ntal surface:
radii from ea
ting each arc
stablished airp
S Model for A
nary surfaces [
ision instrum
ow as 3/4 mile
xtends 500 ft
nd extends 20
constructed b
ach end of the
by tangent l
port elevation
nalyzing Airs
[1].
ment runway w
es, is describe
t on each sid
00 ft beyond e
by swinging
e primary sur
lines, with 15
n;
space Obstru
with
ed as
de of
each
arcs
rface
50 ft
from
to 1
dive
wid
10,0
and
dist
uctions and S
Conical su
m the horizon
1 vertical for
Approach s
erging from t
dth of 16,000
000 ft of hor
d then 40:1
tance;
Transitiona
Safety near Ai
urface: exten
ntal surface a
a distance of
surface: exten
the inner wid
0 ft, at slop
rizontal dista
for the next
al surface:
irports
ds outward
at a slope of 2
f 4,000 ft;
nds outward
dth of 1,000 ft
pes of 50:1
ance (nearest
t 40,000 ft o
extends ou
and upward
20 horizontal
and upward,
t to outer end
for the first
the runway)
of horizontal
utward and
d
l
,
d
t
)
l
d
A GIS Model for Analyzing Airspace Obstructions and Safety near Airports
557
upward at a slope of 7:1 from the primary surface up
to the 150 ft horizontal surface, and from the approach
surface over a horizontal distance of 5,000 ft.
3. Design and Features of the Model
Historically, airport obstruction identification was
done with conventional land surveying methods.
Although these methods are the most accurate, they are
also the most costly and time-consuming. Some GIS
obstruction models have been developed in past 10
years. The previous researches create imaginary
surface models based on the TIN (triangulated irregular
network) technique, instead of full DEM (digital
elevation model). The data input of TIN is flexible and
fewer points need to be stored than raster DEM. A TIN
may be less suited than a raster DEM for certain kinds
of GIS applications, such as analysis of a surface’s
slope and aspect. Based on these reasons, Panayotov et
al. [7, 8] propose octree model for scalable 3D
presentation of the whole airport space. The octree
model is lack of features of transparent imaginary
surface overlapping with terrain and, consequently,
unable to visually identify the penetrated obstacles.
In this paper, the proposed model generates the
multiple layers of imaginary surfaces, which represent
the obstruction regulations, with geo-referenced data
by using points, lines, polygons and circles. These
imaginary surfaces are further digitally mapping and
overlapping to the geo-referenced stereo imagery in the
vicinity of the airport. Any terrain, building, antenna,
or other object, which is higher than its relative
restrictive height, will penetrate its relative transparent
imaginary surface and be visually identified.
By applying the analytical and geometric method to
the specific runway and its intended operations type,
the dimensions of imaginary surfaces will be calculated,
the imaginary surfaces along 3D coordinates will be
constructed, and their critical points will be identified.
Each critical point represents an endpoint or cross
section between lines, circles and inclined planes
according to the imaginary surface affecting it. The
critical points are defined by their x-y-z attributes in 3D
coordinates with the origin point in the center of
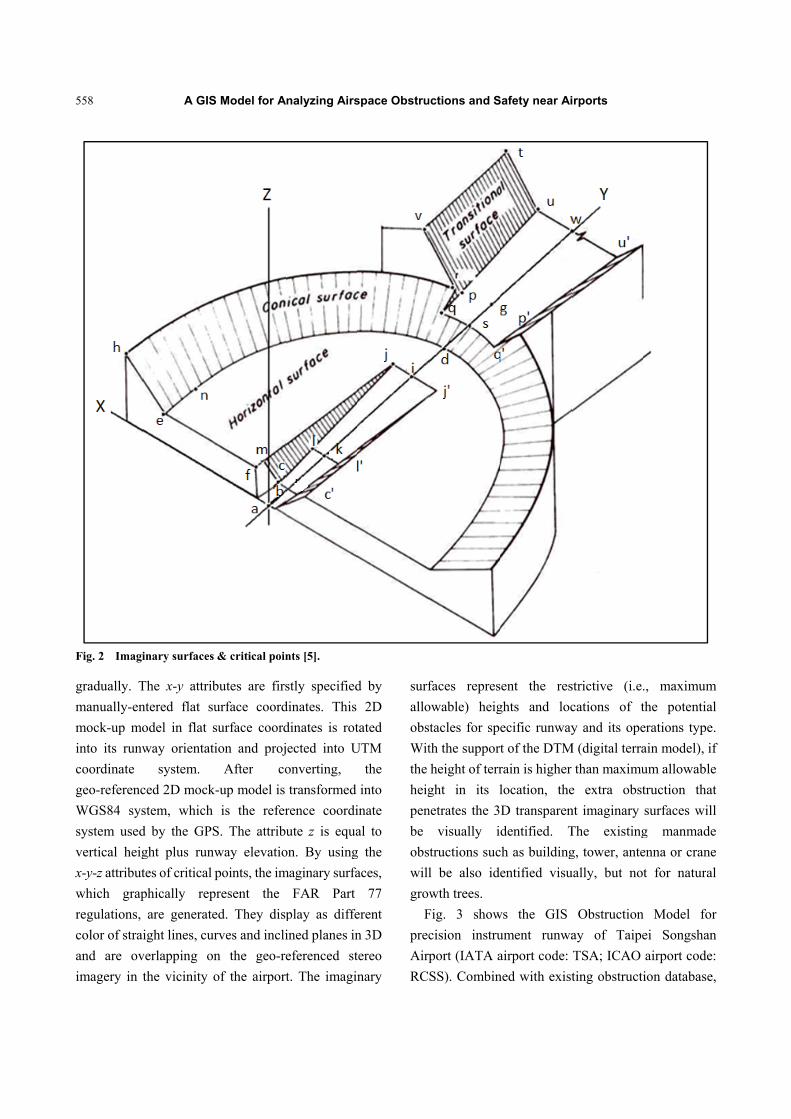
runway. Fig. 2 shows the imaginary surfaces and their
critical points projecting into 3D coordinates. Based on
the critical points which depict the required dimensions
for the regulations, each imaginary surface is
constructed by applying intensive calculation [5].
Taking the example of the approach surface, it is
composed of two inclined trapezoids, one elevated
horizontal surface and one inclined arc. Based on the
given dimensions of the Category E precision
instrument runway, the baselines of inclined trapezoids
are calculated first and shown as follows:
'cc = 1,000 ft in width, 200 ft in distance, 0 ft in
height;
'jj = 3,250 ft in width, 7,700 ft in distance, 150 ft in
height;
'qq = 4,600 ft in width, 12,200 ft in distance, 250 ft
in height;
'uu = 16,000 ft in width,50,200 ft in distance,
1,200 ft in height.
EL (elevation) and HL (half runway length) have to
be added into for specific runway.
Since the calculation result found that allowable height of segment between 'jj and 'qq is higher
than horizontal and conical surfaces in the location, the
elevated surface and inclined arc are constructed for
approach surface. In order to generalize the
applicability of the model, the designed imaginary
surfaces are independent of site-specific inputs of
runway length, width, location, orientation and
elevation. Thus, the critical points are digitized as that
the attribute x is equal to extended width, the attribute y
is equal to distance plus half of runway length and
attribute z is equal to maximum allowable height plus
runway elevation. In here, denotations are done as x-y-z
attributes, c (500, 200+ HL, 0+ EL), j’ (−1,625, 7700+
HL, 150+ EL), q (2,300, 12,200+ HL, 250+ EL), u’
(−8,000, 50,200+ HL, 1,200+ EL).
Based on the same analytical and geometric method,
the critical points of every imaginary surface are solved
558
Fig. 2 Imagi
gradually. T
manually-en
mock-up mo
into its runw
coordinate
geo-referenc
WGS84 sys
system used
vertical heig
x-y-z attribut
which grap
regulations,
color of strai
and are ov
imagery in t
A GIS
inary surfaces
The x-y attrib
ntered flat su
odel in flat s
way orientati
system.
ced 2D mock
stem, which
d by the GPS
ght plus runw
tes of critical
phically rep
are generate
ight lines, cur
verlapping on
the vicinity o
S Model for A
& critical poin
butes are firs
urface coord
surface coord
ion and proj
After co
k-up model is
is the refer
S. The attribu
way elevatio
points, the im
present the
ed. They disp
rves and incli
n the geo-re
of the airport
nalyzing Airs
nts [5].
stly specified
dinates. This
dinates is rot
ected into U
onverting,
transformed
rence coordi
ute z is equa
on. By using
maginary surfa
FAR Part
play as diffe
ined planes in
eferenced st
t. The imagin
space Obstru
d by
2D
tated
UTM
the
into
inate
al to
g the
aces,
77
erent
n 3D
tereo
nary
surf
allo
obs
Wit
the
heig
pen
be
obs
will
grow
F
prec
Airp
RC
uctions and S
faces repres
owable) heig
tacles for spe
th the support
height of terr
ght in its l
netrates the 3
visually id
tructions suc
l be also ide
wth trees.
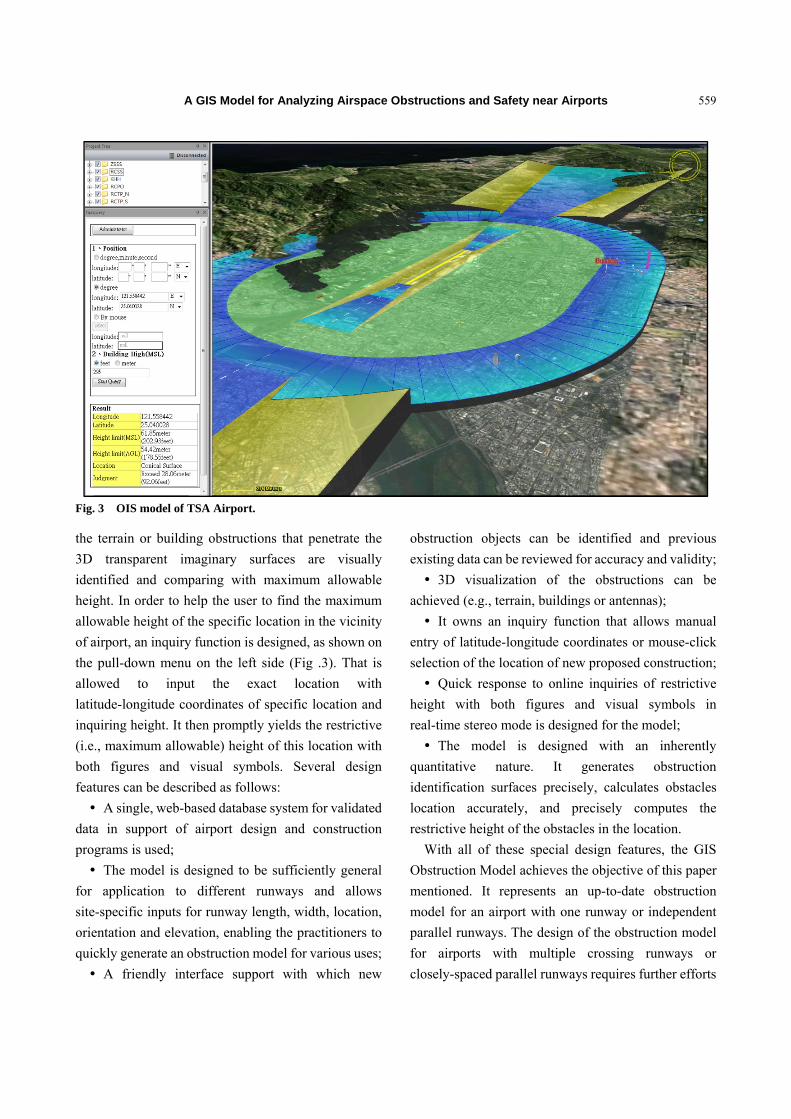
Fig. 3 show
cision instru
port (IATA a
SS). Combin
Safety near Ai
ent the res
ghts and loc
ecific runway
t of the DTM
rain is higher
location, the
D transparen
dentified. T
ch as building
entified visu
ws the GIS
ument runwa
airport code:
ned with exist
irports
strictive (i.e.
cations of t
y and its ope
M (digital terra
than maximu
e extra obst
nt imaginary
The existing
g, tower, ante
ually, but not
Obstruction
ay of Taipe
TSA; ICAO
ting obstructi
., maximum
the potential
erations type.
ain model), if
um allowable
truction that
surfaces will
g manmade
enna or crane
t for natural
n Model for
ei Songshan
airport code:
ion database,
m
l
.
f
e
t
l
e
e
l
r
n
:
,
A GIS Model for Analyzing Airspace Obstructions and Safety near Airports
559
Fig. 3 OIS model of TSA Airport.
the terrain or building obstructions that penetrate the
3D transparent imaginary surfaces are visually
identified and comparing with maximum allowable
height. In order to help the user to find the maximum
allowable height of the specific location in the vicinity
of airport, an inquiry function is designed, as shown on
the pull-down menu on the left side (Fig .3). That is
allowed to input the exact location with
latitude-longitude coordinates of specific location and
inquiring height. It then promptly yields the restrictive
(i.e., maximum allowable) height of this location with
both figures and visual symbols. Several design
features can be described as follows:
A single, web-based database system for validated
data in support of airport design and construction
programs is used;
The model is designed to be sufficiently general
for application to different runways and allows
site-specific inputs for runway length, width, location,
orientation and elevation, enabling the practitioners to
quickly generate an obstruction model for various uses;
A friendly interface support with which new
obstruction objects can be identified and previous
existing data can be reviewed for accuracy and validity;
3D visualization of the obstructions can be
achieved (e.g., terrain, buildings or antennas);
It owns an inquiry function that allows manual
entry of latitude-longitude coordinates or mouse-click
selection of the location of new proposed construction;
Quick response to online inquiries of restrictive
height with both figures and visual symbols in
real-time stereo mode is designed for the model;
The model is designed with an inherently
quantitative nature. It generates obstruction
identification surfaces precisely, calculates obstacles
location accurately, and precisely computes the
restrictive height of the obstacles in the location.
With all of these special design features, the GIS
Obstruction Model achieves the objective of this paper
mentioned. It represents an up-to-date obstruction
model for an airport with one runway or independent
parallel runways. The design of the obstruction model
for airports with multiple crossing runways or
closely-spaced parallel runways requires further efforts
A GIS Model for Analyzing Airspace Obstructions and Safety near Airports
560
in the future. The proposed model should be useful to
transportation infrastructure planers in determining the
airport location and runway orientation, to building
developers in determining the restrictive height of
proposed buildings, to government officials in
evaluating the proposed constructions, and to airfield
safety managers in monitoring obstructions and safety
separations.
4. Numerical Examples and Comparison
In order to verify the model’s design features, the
problem of the 101 Building obstruction to Taipei
Songshan Airport is analyzed both with hand
calculations and this proposed model. The Songshan
Airport has one precision instrument runway whose
length is 8,547 ft and whose width is 197 ft. The
runway orientation is 10~28. The runway elevation
AMSL (above mean sea level) is 18 ft. The Taipei 101
Building is located on a bearing of 184° and distance of
12,467 ft off the end centerline of Runway 28. For the
precision instrument runway, the dimensional standard
of Category E is applied. Based on runway information,
the size and direction of each surface have to be
calculated and drawn in a relatively small scale map.
Then, based on the building location, the surfaces
affecting the building will be determined. The building
in the example problem is located under the conical
surface and horizontal surface. The maximum
allowable height of the building can be solved as
follows:
chbr hheeh
chbhbr rddhee )(
20
1)000,10467,12(150018
ft291
where:
h = restrictive (i.e., maximum allowable) height of
the building location AGL (above ground level);
er = runway elevation AMSL;
eb = elevation difference of building location;
hh = restrictive height of horizontal surface;
hc = restrictive height of selected location in conical
surface;
db = building distance to the end centerline of
Runway 28;
dh = arc distance of horizontal surface;
rc = slope ratio of conical surface.
Compared to hand calculation, using the GIS
Obstruction Model to determine the restrictive height
of the building is much easier and accurate. After
opening the web page of the Songshan Airport GIS
Obstruction Model, the imaginary surfaces
over-lapping with digital terrain (Fig. 3) are shown. By
inputting the latitude and longitude of the building
location (or simply clicking to select the location) and
inquiring height of the proposed building, the model
determines in real time that the restrictive height is
291.33 ft and visually indicates the building under
specific surface on which the building is located. The
proposed GIS Obstruction Model has been verified for
accuracy in calculations and proved an up-to-date
design.
The container terminals of Kaohsiung Seaport are
located close to the approach surface of the Runway 09
of Kaohsiung International Airport (IATA airport code:
KHH; ICAO airport code: RCKH). Some types of
container gantry cranes, such as super-post Panamax,
reach 90 m (295 ft) in total height. When their booms
are lifted in the air to clear the ships for navigation,
they are higher than the maximum allowable height and
penetrate the OISs. Using the proposed model to solve
this problem is very simple, comparing to measure and
calculate every location of height of hundreds of cranes.
The nearest allowable location of 295 ft crane is the
distance of 12,950 ft from the center of runway. From
GIS Obstruction Model of KHH Airport shown in
Fig. 4, it can be visually identified the OIS penetration
of hazardous obstruction if any crane is located in
horizontal surface, inner three-quarters of conical
surface or inner one-third of approach surface.

A GIS Model for Analyzing Airspace Obstructions and Safety near Airports
561
Fig. 4 OIS model of KHH Airport.
5. Conclusions
The OIS evaluation is often used for new airfield site
selection and runway orientation determination. More
importantly, the OIS evaluation is an airport’s
safeguard against flawed urban development,
especially for airports near rapidly expanding cities.
Without accurate and handy tools, hand-calculation
errors on the restrictive height/area of the OIS could
occur and cause adverse impacts to airport safety.
Applying the GIS features of geospatial data and 3D
formats, this paper develops the GIS Obstruction
Model which is capable of calculating restrictive height
accurately and creating visual imagery of penetrating
obstructions. The special features of the model include
web-based design, adaptability to any airport, friendly
multiple inquiry methods, accurate calculation, quick
response to online inquiring, and response with 3D
visual reality. The proposed GIS Obstruction Model
presents an up-to-date design for an airport with one
runway or multiple distant runways. An airport cost
minimization model, which combines airfield land use
and multiple runway orientation optimizations [11], is
the long-term goal for airport design. The proposed
model in this paper is one of the essential modules for
this. Even the proposed GIS Obstruction Model itself,
it has been demonstrated as an useful tool for airport
design, transportation infrastructure planning, urban
development and airfield safety management.
References
[1] FAA (Federal Aviation Administration). 1993. FAR Part
77: Objects Affecting Navigable Airspace. Washington,
D.C.: FAA.
[2] TRB (Transportation Research Board). 2010.
Understanding Airspace, Objects, and Their Effects on
Airports. ACRP (Airport Cooperative Research Program)
report 38, 8-40.
[3] Chang, S. W., and Chin, Y. R. 2010. “Comparison of
Obstacle Restriction and Analysis of Safety Airspace
between RCSS Airport and FAA OIS.” In 2010
Proceeding of Aeronautical & Astronautical Society,
217-23.
[4] Litsheim, S., and Xiao, X. 2009. “Airport Obstacle
Surfaces.” Journal of Advanced Transportation 43:
347-66.
[5] Horonjeff, R., and McKelvey, F. X. 1994. Planning and
Design of Airport. 4th ed. New York: McGraw-Hill.
[6] Vidal, S., Graham, D., and Steele, J. 2004. “FAA Airport

A GIS Model for Analyzing Airspace Obstructions and Safety near Airports
562
Surveying-GIS Program: The Presentation to Airport GIS Committee.” National Geodetic Survey. Accessed March 30, 2009. http://www.ngs.noaa.gov/AERO/eAOC/p1635. pdf.
[7] Panayotov, A., Georgiev, I. K. 2008. “Modelling of the Airport Navigation Apace Obstructions.” Presented at 3rd International Conference from Scientific Computing to Computational Engineering, Athens, Greece.
[8] Panayotov, A., Georgiev I., and Georgiev, I. 2012. “A Practical Approach for Airport Spatial Modeling.” In Proceedings of the 13th International Conference on Computer Systems and Technologies,
321-8. [9] Ulubay, A., and Altan, M. O. 2002. “A Different
Approach to the Spatial Data Integration.” Presented at 2002 Symposium on Geospatial Theory, Processing and Applications, Ottawa, Canada.
[10] ICAO (International Civil Aviation Organization). 2004. Aerodrome Design and Operations. Annex 14 to the Convention on International Civil Aviation. Quebec: ICAO.
[11] Chang, S. W. 2015. “Crosswind-Based Optimization of Multiple Runway Orientations.” Journal of Advanced Transportation 49: 1-9.