Embed Size (px)
Citation preview
PALEOCEANOGRAPHY, VOL. 14, NO. 3, PAGES 360-373, JUNE 1999
A geostrophic transport estimate for the Florida Current from the oxygen isotope composition of benthic foraminifera
Jean Lynch-Stieglitz Department of Earth and Environmental Sciences, Lamont-Doherty Earth Observatory. of Columbia University Palisades, New York
William B. Curry Woods Hole Oceanographic Institution, Woods Hole, Massachusetts
Niall Slowey Department of Oceanography, Texas A & M University, College Station, Texas
Abstract. We present a new method for the quantitative reconstruction of upper ocean flows for during times in the past. For the warm (T>5øC) surface ocean, density can be accurately reconstructed from calcite precipitated in equilibrium with seawater, as both of these properties increase with decreasing temperature and increasing salinity. Vertical density profiles can be reconstructed from the oxygen isotopic composition of benthic foraminifera. The net volume transport between two vertical density profiles can be calculated using the geostrophic method. Using benthic foraminifera from surface sediment samples from either side of the Florida Straits (Florida Keys and Little Bahama Bank), we reconstruct two vertical density profiles and calculate a volume transport of 32 Sv using this method. This agrees well with estimates from physical oceanographic methods of 30-32 Sv for the mean annual volume transport. We explore the sensitivity of this technique to various changes in the relationship between temperature and salinity as well as salinity and the oxygen isotopic composition of seawater.
1. Introduction
Ocean circulation plays a crucial role in the distribution of heat and carbon within the ocean/atmosphere system. Accu- rate reconstruction of ocean flow fields for times in the geo- logic past not only will provide us with a better understanding of these past climate regimes but will help to validate the ability of ocean and atmospheric models to simulate climate regimes different from the present. Qualitative information about deep water sources and paths during times in the past is inferred from tracer (carbon isotope and trace metals) distri- butions as recorded by benthic foraminifera [e.g., Boyle and Keigwin, 1987; Duplessy et al., 1988; Boyle, 1992; Lynch- Stieglitz and Fairbanks, 1994; Sarnthein et al., 1994]. Quan- titative information about deep water flow (residence times) is obtained from paired radiocarbon analyses on benthic and planktonic foraminifera [e.g., Broecker et al. 1988; Shackleton et al., 1988; Adkins and Boyle, 1997]. Sediment properties can yield some qualitative information about near-bottom oceanic currents but can be difficult to relate to the large-scale flow. For example, Gardner et al. [1989] find sedimentologi-
qsotopic data are available electronically at the World Data Center-Afor Paleoclimatology, NOAA/NGDC, 325 Broadway, Boulder, Colorado (ftp://ftp.ngdc.noaa.gov/paleo/contributions_by_author/lynch- stieglitz1999).
Copyright 1999 by the American Geophysical Union.
Paper number 1999PA900001. 0883-8305/99/1999PA900001 $12.00
cal evidence for southward flowing near-bottom currents in the Florida Straits, while the vast majority of waters travel northward through the Florida Straits. The positions of major surface water flows such as the North Atlantic Drift can be in-
ferred on the basis of reconstructions of the oceanographic fronts along which they travel [e.g., Mcintyre et al., 1976]. However, there is no existing method for the quantitative re- construction of upper ocean transports.
Here we propose a new method for estimating transport in the upper ocean for times in the past via the reconstruction of the density structure of the upper ocean. Vertical density pro- files can be reconstructed using oxygen isotope measurements on benthic foraminifera from cores collected from a range of depths. The mean flow of large-scale low-frequency ocean currents can be reconstructed from density gradients within the ocean using the geostrophic method. The reliability of this method, in which a vertical profile of velocity is reconstructed from two adjacent density profiles, was demonstrated by Wust [1924] using hydrographic data in the Florida current along with direct current measurements obtained by Pillsbury [1891 ]. The geostrophic method has since become a standard tool in physical oceanography and has been successfully ap- plied in numerous oceanographic regimes. While closely spaced density profiles are necessary for a detailed recon- struction of the flow velocity, the mean velocity or transport between the two profiles does not depend on the details of the density structure between the two profiles. In this way the vertical distribution of transport, as well as net transport rela- tive to an assumed reference level, can be calculated through a section defined by only two vertical density profiles.
360
LYNCH-STIEGLITZ ET AL.: FLORIDA STRAITS GEOSTROPHIC TRANSPORT 361
The oxygen isotopic composition of foraminifera has been used as an indicator of paleo-temperature by paleoceanogra- phers for 50 years, and the geostrophic method has been used by physical oceanographers for almost 80 years. Here, for the first time, we bring these two tools together and present a method for the quantitative reconstruction of upper ocean cur- rents for the paleo-ocean.
2. The Geostrophic Method
2.1. Geostrophic Currents
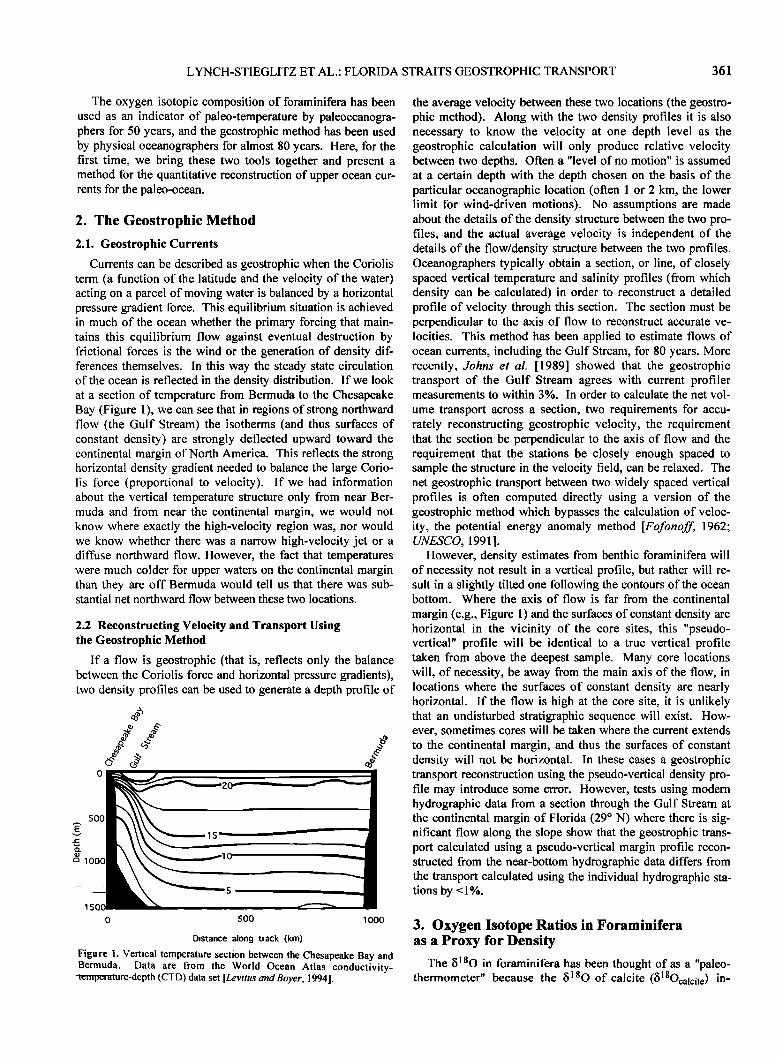
Currents can be described as geostrophic when the Coriolis term (a function of the latitude and the velocity of the water) acting on a parcel of moving water is balanced by a horizontal pressure gradient force. This equilibrium situation is achieved in much of the ocean whether the primary forcing that main- tains this equilibrium flow against eventual destruction by frictional forces is the wind or the generation of density dif- ferences themselves. In this way the steady state circulation of the ocean is reflected in the density distribution. If we look at a section of temperature from Bermuda to the Chesapeake Bay (Figure 1), we can see that in regions of strong northward flow (the Gulf Stream) the isotherms (and thus surfaces of constant density) are strongly deflected upward toward the continental margin of North America. This reflects the strong horizontal density gradient needed to balance the large Corio- lis force (proportional to velocity). If we had information about the vertical temperature structure only from near Ber- muda and from near the continental margin, we would not know where exactly the high-velocity region was, nor would we know whether there was a narrow high-velocity jet or a diffuse northward flow. However, the fact that temperatures were much colder for upper waters on the continental margin than they are off Bermuda would tell us that there was sub- stantial net northward flow between these two locations.
2.2 Reconstructing Velocity and Transport Using the Geostrophic Method
If a flow is geostrophic (that is, reflects only the balance between the Coriolis force and horizontal pressure gradients), two density profiles can be used to generate a depth profile of
500
ca 1000
15
5
1500
0 500 1000
Distance along track (km)
Figure 1. Vertical temperature section between the Chesapeake Bay and Bermuda. Data are from the World Ocean Atlas conductivity- tc•pc•aiare-depth (CTD) data set [Levitus and Boyer, 1994].
the average velocity between these two locations (the geostro- phic method). Along with the two density profiles it is also necessary to know the velocity at one depth level as the geostrophic calculation will only produce relative velocity between two depths. Often a "level of no motion" is assumed at a certain depth with the depth chosen on the basis of the particular oceanographic location (often 1 or 2 km, the lower limit for wind-driven motions). No assumptions are made about the details of the density structure between the two pro- files, and the actual average velocity is independent of the details of the flow/density structure between the two profiles. Oceanographers typically obtain a section, or line, of closely spaced vertical temperature and salinity profiles (from which density can be calculated) in order to reconstruct a detailed profile of velocity through this section. The section must be perpendicular to the axis of flow to reconstruct accurate ve- locities. This method has been applied to estimate flows of ocean currents, including the Gulf Stream, for 80 years. More recently, Johns et aL [1989] showed that the geostrophic transport of the Gulf Stream agrees with current profiler measurements to within 3%. In order to calculate the net vol-
ume transport across a section, two requirements for accu- rately reconstructing geostrophic velocity, the requirement that the section be perpendicular to the axis of flow and the requirement that the stations be closely enough spaced to sample the structure in the velocity field, can be relaxed. The net geostrophic transport between two widely spaced vertical profiles is often computed directly using a version of the geostrophic method which bypasses the calculation of veloc- ity, the potential energy anomaly method [Fofonoff, 1962; UNESCO, 1991 ].
However, density estimates from benthic foraminifera will of necessity not result in a vertical profile, but rather will re- sult in a slightly tilted one following the contours of the ocean bottom. Where the axis of flow is far from the continental
margin (e.g., Figure 1) and the surfaces of constant density are horizontal in the vicinity of the core sites, this "pseudo- vertical" profile will be identical to a true vertical profile taken from above the deepest sample. Many core locations will, of necessity, be away from the main axis of the flow, in locations where the surfaces of constant density are nearly horizontal. If the flow is high at the core site, it is unlikely that an undisturbed stratigraphic sequence will exist. How- ever, sometimes cores will be taken where the current extends to the continental margin, and thus the surfaces of constant density will not be horizontal. In these cases a geostrophic transport reconstruction using the pseudo-vertical density pro- file may introduce some error. However, tests using modern hydrographic data from a section through the Gulf Stream at the continental margin of Florida (29 ø N) where there is sig- nificant flow along the slope show that the geostrophic trans- port calculated using a pseudo-vertical margin profile recon- structed from the near-bottom hydrographic data differs from the transport calculated using the individual hydrographic sta- tions by < 1%.
3. Oxygen Isotope Ratios in Foraminifera as a Proxy for Density
The •5180 in foraminifera has been thought of as a "paleo- thermometer" because the •51•O of calcite (•18Ocalcite) in-
362 LYNCH-STIEGLITZ ET AL.: FLORIDA STRAITS GEOSTROPHIC TRANSPORT
0 ''''1 .... I .... I''''l .... I''''
200
4OO
6OO
E
.c 800
r',, 1000
12OO
14OO
4'
'1'
-2 -1 0 1 2 3
Cibicidoides and Planulina
Orbulina universa culture
Inorganic calcite
0 5 10 15 20 25 4
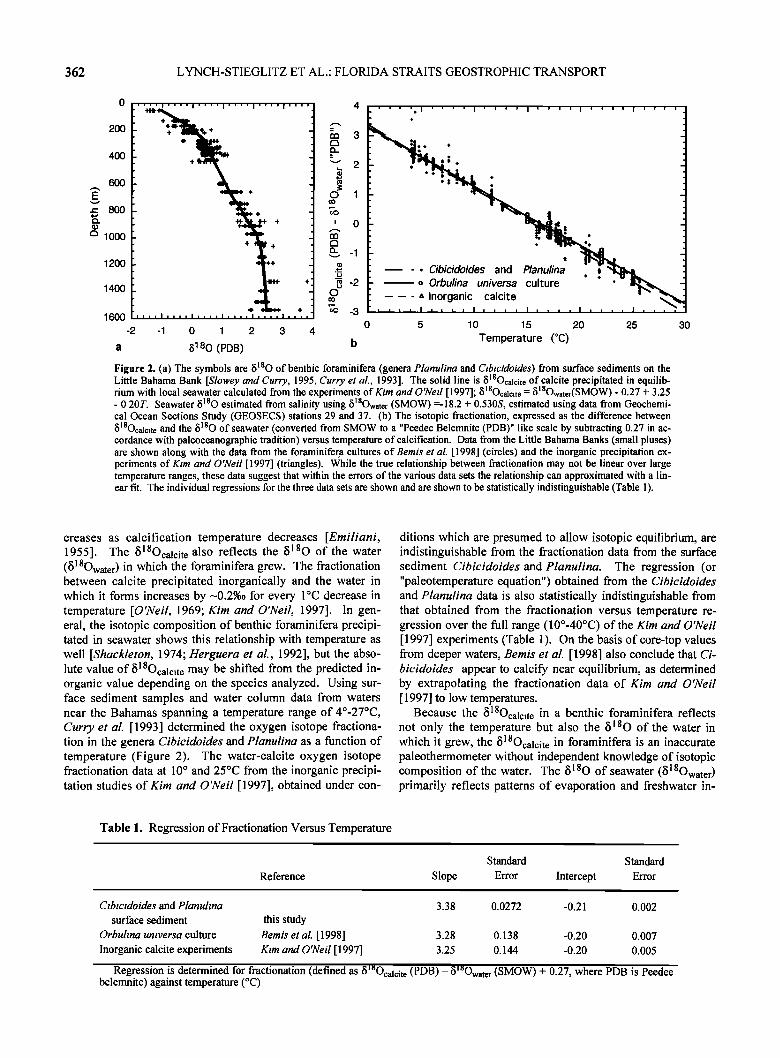
a 5180 (PDB) b Temperature (øC) Figure 2. (a) The symbols are •5180 of benthie foraminifera (genera Planulina and Cibicidoides) from surface sediments on the
Is Little Bahama Bank [Slowey and Curry, 1995, Curry et al., 1993]. The solid line is •50calcite of calcite precipitated in equilib-
ß , 18 18 rlum with local seawater calculated from the experiments of Kim and O•Veil [1997]; 80calcit½ = • Owatcr(SMOW) - 0.27 + 3.25 - 0.20T. Seawater 8•80 estimated from salinity using 8•8Owater (SMOW)=-18.2 + 0.530S, estimated using data from Geochemi- cal Ocean Sections Study (GEOSECS) stations 29 and 37. (b) The isotopic fractionation, expressed as the difference between •18Ocalcite and the 8•80 of seawater (converted from SMOW to a "Peedee Belemnite (PDB)" like scale by subtracting 0.27 in ac- cordance with paleoceanographic tradition) versus temperature of calcification. Data from the Little Bahama Banks (small pluses) are shown along with the data from the foraminifera cultures of Bemis et al. [1998] (circles) and the inorganic precipitation ex- periments of Kim and O'Neil [ 1997] (triangles). While the true relationship between fractionation may not be linear over large temperature ranges, these data suggest that within the errors of the various data sets the relationship can approximated with a lin- ear fit. The individual regressions for the three data sets are shown and are shown to be statistically indistinguishable (Table 1).
3O
creases as calcification temperature decreases [Emiliani, 1955]. The •518Ocalcite also reflects the •5180 of the water (•518Owater) in which the foraminifera grew. The fractionation between calcite precipitated inorganically and the water in which it forms increases by -0.2%o for every IøC decrease in temperature [O'Neil, 1969; Kirn and O'Neil, 1997]. In gen- eral, the isotopic composition of benthie foraminifera precipi- tated in seawater shows this relationship with temperature as well [Shackleton, 1974; Herguera et al., 1992], but the abso- lute value of fi18Ocalcit e may be shifted from the predicted in- organic value depending on the species analyzed. Using sur- face sediment samples and water column data from waters near the Bahamas spanning a temperature range of 4ø-27øC, Curry et aL [1993] determined the oxygen isotope fractiona- tion in the genera Cibicidoides and Planulina as a function of temperature (Figure 2). The water-calcite oxygen isotope fractionation data at 10 ø and 25øC from the inorganic precipi- tation studies of Kirn and O'Neil [1997], obtained under con-
ditions which are presumed to allow isotopic equilibrium, are indistinguishable from the fractionation data from the surface sediment Cibicidoides and Planulina. The regression (or "paleotemperature equation") obtained from the Cibicidoides and Planulina data is also statistically indistinguishable from that obtained from the fractionation versus temperature re- gression over the full range (10ø-40øC) of the Kirn and O'Neil [1997] experiments (Table 1). On the basis of core-top values from deeper waters, Bernis et al. [1998] also conclude that Ci- bicidoides appear to calcify near equilibrium, as determined by extrapolating the fractionation data of Kirn and O'Neil [ 1997] to low temperatures.
Because the •18Ocalcit e in a benthie foraminifera reflects not only the temperature but also the •5180 of the water in which it grew, the fi18Ocalcit e in foraminifera is an inaccurate paleothermometer without independent knowledge of isotopic composition of the water. The •5180 of seawater (•518Owater) primarily reflects patterns of evaporation and freshwater in-
Table 1. Regression of Fractionation Versus Temperature
Reference
Standard Standard
Slope Error Intercept Error
Cibicidoides and Planulina 3.38 0.0272 -0.21 0.002 surface sediment this study
Orbulina universa culture Bernis et al. [1998] 3.28 0.138 -0.20 0.007 Inorganic calcite experiments Kirn and O'Neil [1997] 3.25 0.144 -0.20 0.005
Regression is determined for fractionation (defined as •Sl•Ocalcit e (PDB)- •Sl•Owater (SMOW) + 0.27, where PDB is Peedee belemnite) against temperature (øC)
LYNCH-STIEGLITZ ET AL.: FLORIDA STRAITS GEOSTROPHIC TRANSPORT 363
1.2
1.0
0.8
0.6
0.4
0.2
0.0
ß
ß
ß
ß 6180wate r = -14.34 + .419S
-0.2
33.5 34.0 34.5 35.0 35.5 36.0 36.5 37.0 37.5
Salinity
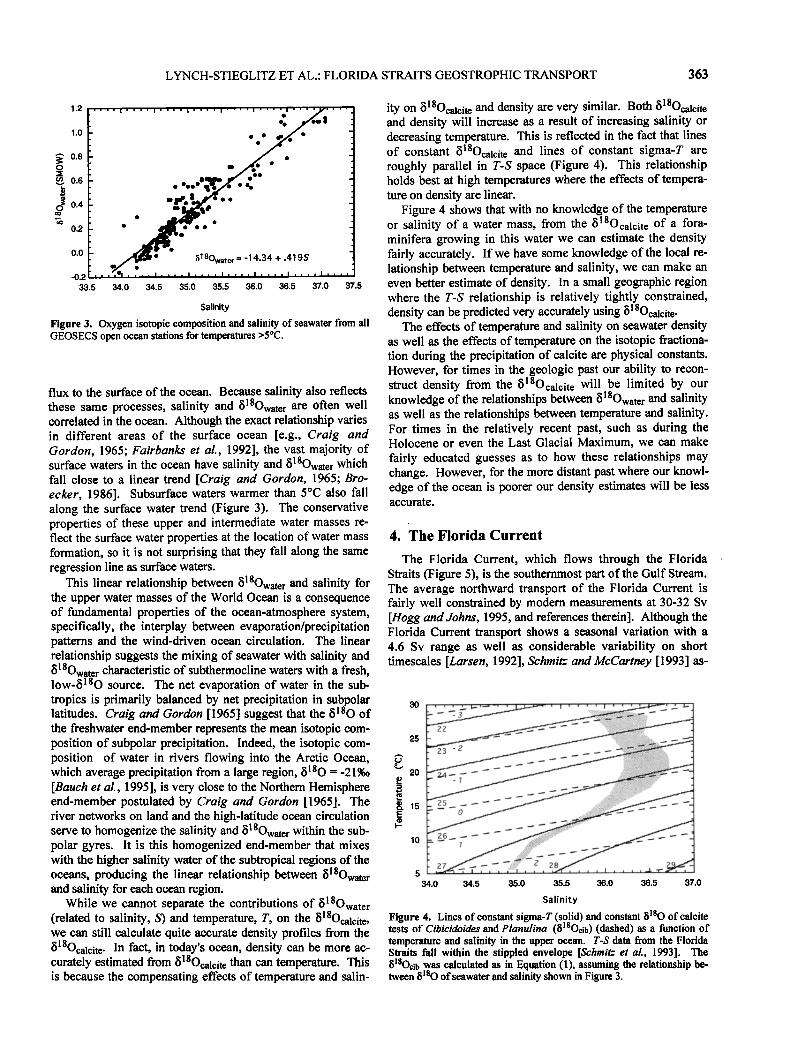
Figure 3. Oxygen isotopic composition and salinity of seawater from all GEOSECS open ocean stations for temperatures >5øC.
flux to the surface of the ocean. Because salinity also reflects these same processes, salinity and •518Owater are often well correlated in the ocean. Although the exact relationship varies in different areas of the surface ocean [e.g., Craig and Gordon, 1965; Fairbanks et al., 1992], the vast majority of surface waters in the ocean have salinity and •518Owater which fall close to a linear trend [Craig and Gordon, 1965; Bro- ecker, 1986]. Subsurface waters warmer than 5øC also fall along the surface water trend (Figure 3). The conservative properties of these upper and intermediate water masses re- flect the surface water properties at the location of water mass formation, so it is not surprising that they fall along the same regression line as surface waters.
This linear relationship between •518Owate r and salinity for the upper water masses of the World Ocean is a consequence of fundamental properties of the ocean-atmosphere system, specifically, the interplay between evaporation/precipitation patterns and the wind-driven ocean circulation. The linear relationship suggests the mixing of seawater with salinity and •518Owate r characteristic of subthermocline waters with a fresh, low-•5180 source. The net evaporation of water in the sub- tropics is primarily balanced by net precipitation in subpolar latitudes. Craig and Gordon [1965] suggest that the •5180 of the freshwater end-member represents the mean isotopic com- position of subpolar precipitation. Indeed, the isotopic com- position of water in rivers flowing into the Arctic Ocean, which average precipitation from a large region, 5180 =-21%o [Bauch et al., 1995], is very close to the Northern Hemisphere end-member postulated by Craig and Gordon [1965]. The river networks on land and the high-latitude ocean circulation serve to homogenize the salinity and •518Owate r within the sub- polar gyres. It is this homogenized end-member that mixes with the higher salinity water of the subtropical regions of the oceans, producing the linear relationship between •518Owate r and salinity for each ocean region.
While we cannot separate the contributions of •518Owate r (related to salinity, S) and temperature, T, on the •518Ocalcite, we can still calculate quite accurate density profiles from the •518Ocalcit e. In fact, in today's ocean, density can be more ac- curately estimated from •518Ocalcit e than can temperature. This is because the compensating effects of temperature and salin-
ity on •518Ocalcite and density are very similar. Both •518Ocalcit e and density will increase as a result of increasing salinity or decreasing temperature. This is reflected in the fact that lines of constant •518Ocalcit e and lines of constant sigma-T are roughly parallel in T-S space (Figure 4). This relationship holds best at high temperatures where the effects of tempera- ture on density are linear.
Figure 4 shows that with no knowledge of the temperature or salinity of a water mass, from the •518Ocalcit e of a fora- minifera growing in this water we can estimate the density fairly accurately. If we have some knowledge of the local re- lationship between temperature and salinity, we can make an even better estimate of density. In a small geographic region where the T-S relationship is relatively tightly constrained, density can be predicted very accurately using •18Ocalcit e.
The effects of temperature and salinity on seawater density as well as the effects of temperature on the isotopic fractiona- tion during the precipitation of calcite are physical constants. However, for times in the geologic past our ability to recon- struct density from the •5180calcite will be limited by our knowledge of the relationships between fi18Owate r and salinity as well as the relationships between temperature and salinity. For times in the relatively recent past, such as during the Holocene or even the Last Glacial Maximum, we can make fairly educated guesses as to how these relationships may change. However, for the more distant past where our knowl- edge of the ocean is poorer our density estimates will be less accurate.
4. The Florida Current
The Florida Current, which flows through the Florida Straits (Figure 5), is the southernmost part of the Gulf Stream. The average northward transport of the Florida Current is fairly well constrained by modern measurements at 30-32 Sv [Hogg and dohns, 1995, and references therein]. Although the Florida Current transport shows a seasonal variation with a 4.6 Sv range as well as considerable variability on short timescales [Larsen, 1992], Schmitz and McCartney [1993] as-
25
• •5
lO
.-- -3/•_•-.----'-- _.. -- '•.'i::?:i:'.::•::??-:•?:i!?:?:?:?:?:?:i::iiii!?:iiii; :.
34.0 34.5 35.0 35.5 36.0 36.5 37.0
Salinity
Figure 4. Lines of constant sigma-T (solid) and constant/5]80 of calcite tests of Cibicidoides and Planulina (/5]SOcib) (dashed) as a function of temperature and salinity in the upper ocean. T-S data from the Florida Straits fall within the stippled envelope [Schmitz et al., 1993]. The /5]$Ocib was calculated as in Equation (1), assuming the relationship be- tween/5•80 of seawater and salinity shown in Figure 3.
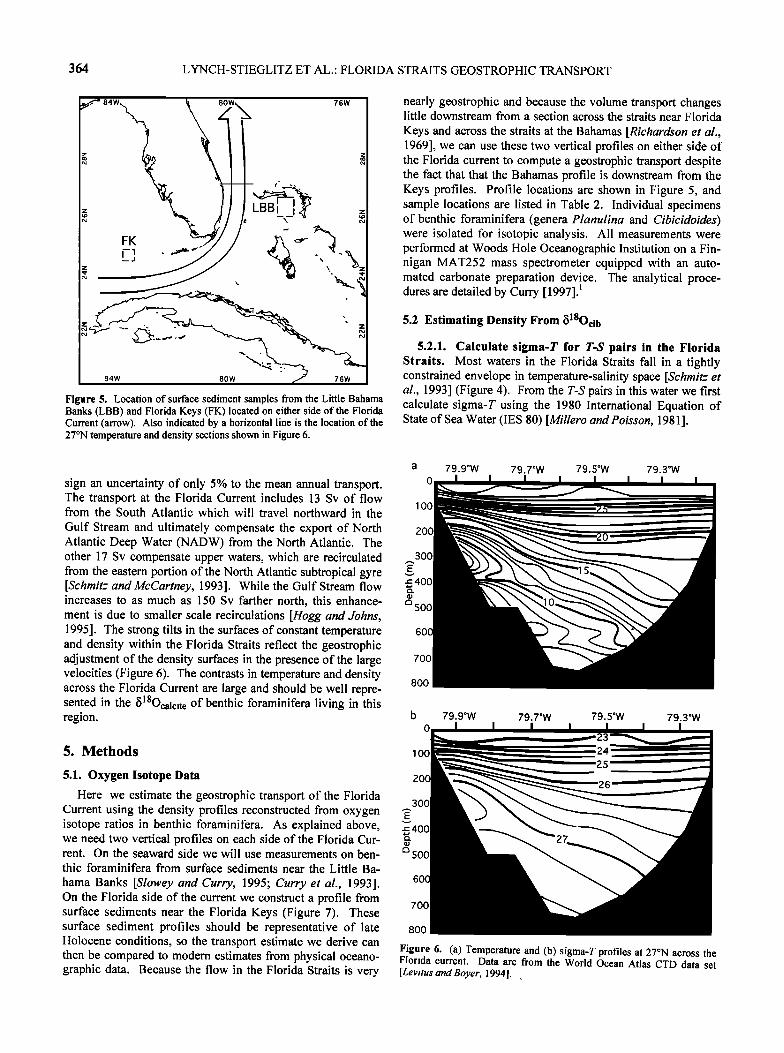
364 LYNCH-STIEGLITZ ET AL.' FLORIDA STRAITS GEOSTROPHIC TRANSPORT
., 84W 76W
84W 80W • !'• 76W(•, Figure 5. Location of surface sediment samples from the Little Bahama Banks (LBB) and Florida Keys (FK) located on either side of the Florida Current (arrow). Also indicated by a horizontal line is the location of the 27øN temperature and density sections shown in Figure 6.
nearly geostrophic and because the volume transport changes little downstream from a section across the straits near Florida
Keys and across the straits at the Bahamas [Richardson et al., 1969], we can use these two vertical profiles on either side of the Florida current to compute a geostrophic transport despite the fact that that the Bahamas profile is downstream from the Keys profiles. Profile locations are shown in Figure 5, and sample locations are listed in Table 2. Individual specimens of benthic foraminifera (genera Planulina and Cibicidoides) were isolated for isotopic analysis. All measurements were performed at Woods Hole Oceanographic Institution on a Fin- nigan MAT252 mass spectrometer equipped with an auto- mated carbonate preparation device. The analytical proce- dures are detailed by Curry [ 1997]. •
5.2 Estimating Density From 618Oci b
5.2.1. Calculate sigma-T for T-$ pairs in the Florida Straits. Most waters in the Florida Straits fall in a tightly constrained envelope in temperature-salinity space [Schmitz et al., 1993] (Figure 4). From the T-S pairs in this water we first calculate sigma-T using the 1980 International Equation of State of Sea Water (IES 80) [Millero andPoisson, 1981].
sign an uncertainty of only 5% to the mean annual transport. The transport at the Florida Current includes 13 Sv of flow from the South Atlantic which will travel northward in the
Gulf Stream and ultimately compensate the export of North Atlantic Deep Water (NADW) from the North Atlantic. The other 17 Sv compensate upper waters, which are recirculated from the eastern portion of the North Atlantic subtropical gyre [Schmitz and McCartney, 1993]. While the Gulf Stream flow increases to as much as 150 Sv farther north, this enhance- ment is due to smaller scale recirculations [Hogg and dohns, 1995]. The strong tilts in the surfaces of constant temperature and density within the Florida Straits reflect the geostrophic adjustment of the density surfaces in the presence of the large velocities (Figure 6). The contrasts in temperature and density across the Florida Current are large and should be well repre- sented in the •518Ocalcite of benthic foraminifera living in this region.
a 79.9ow 79.7ow 79.5ow 79.3ow 0
lOO
200
300
400
5OO
700
800
b 79.9øW 79.7øW 79.5øW 79.3øW
5. Methods lOO
5.1. Oxygen Isotope Data
Here we estimate the geostrophic transport of the Florida Current using the density profiles reconstructed from oxygen isotope ratios in benthic foraminifera. As explained above, we need two vertical profiles on each side of the Florida Cur- rent. On the seaward side we will use measurements on ben- thic foraminifera from surface sediments near the Little Ba-
hama Banks [Slowey and Curry, 1995; Curry et al., 1993]. On the Florida side of the current we construct a profile from surface sediments near the Florida Keys (Figure 7). These surface sediment profiles should be representative of late Holocene conditions, so the transport estimate we derive can then be compared to modern estimates from physical oceano- graphic data. Because the flow in the Florida Straits is very
200
300
=400
500
700
800
Figure 6. (a) Temperature and (b) sigma-T profiles at 27øN across the Florida current. Data are from the World Ocean Atlas CTD data set [Levitus and Boyer, 1994]..
LYNCH-STIEGLITZ ET AL.: FLORIDA STRAITS GEOSTROPHIC TRANSPORT 365
lOO
200 -
• 300 E
.c: 400
• 500
600
700
800 a)
0 I 2 3 -2
0
100
200
300
400
500
600
700
800 0 I 2
8180calcit e 8180calcit e
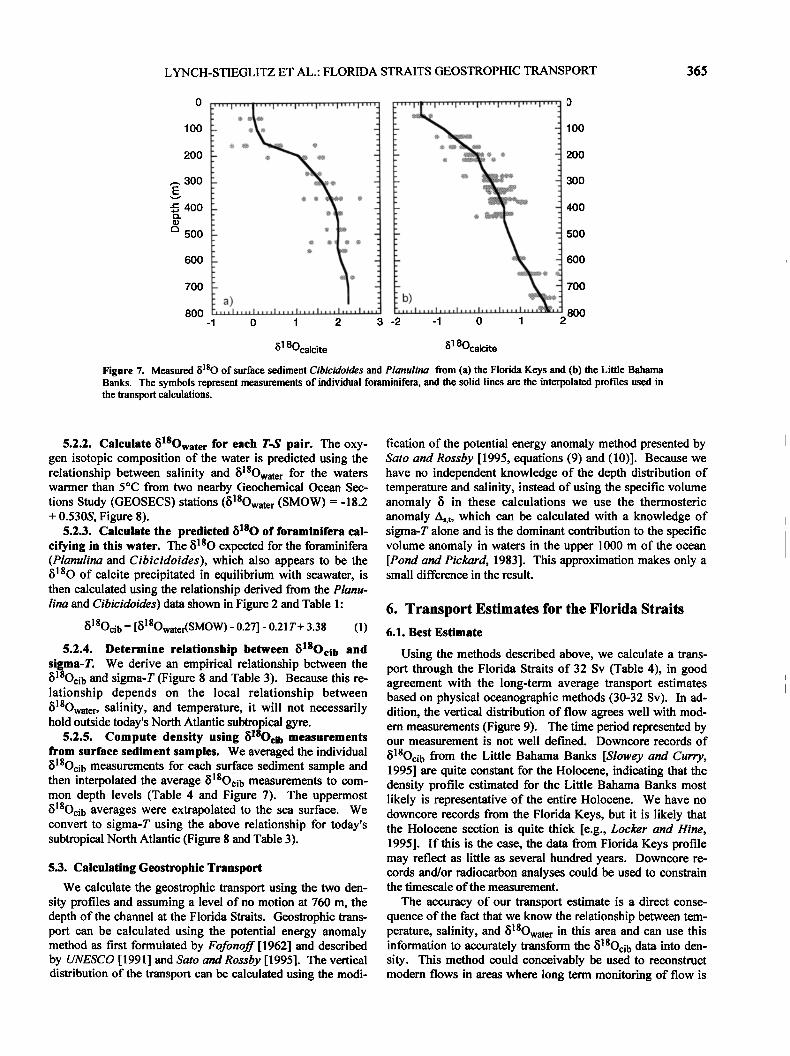
Figure 7. Measured 8]80 of surface sediment Cibicidoides and Planulina from (a) the Florida Keys and (b) the Little Bahama Banks. The symbols represent measurements of individual foraminifera, and the solid lines are the interpolated profiles used in the transport calculations.
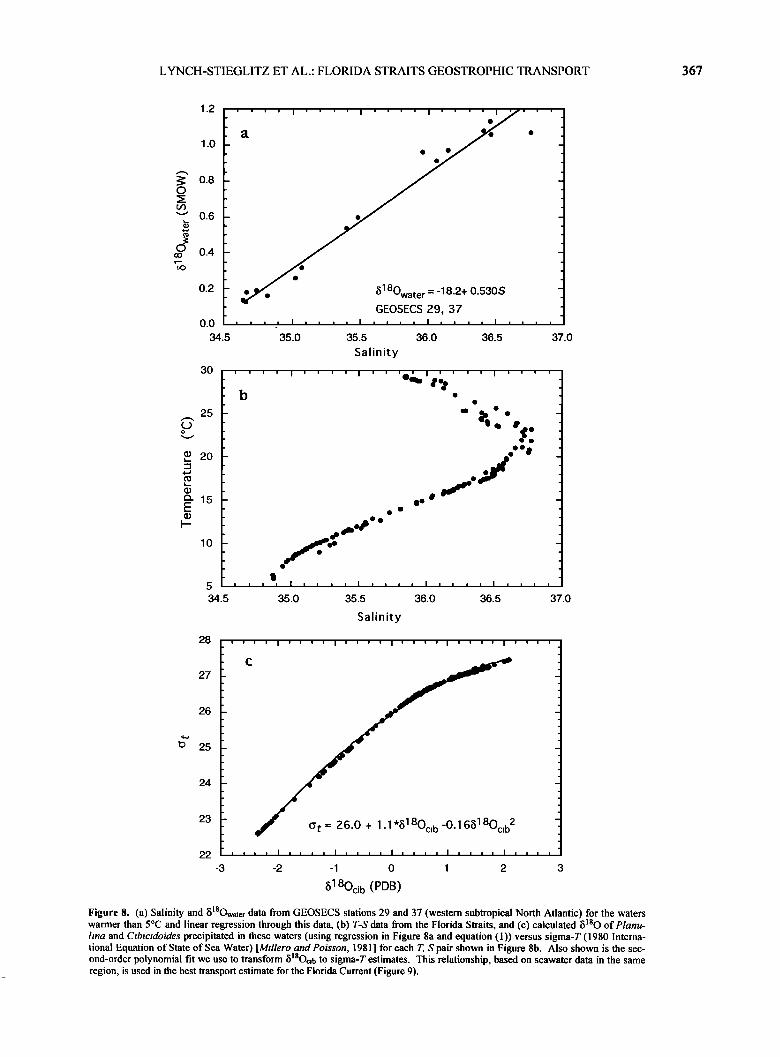
5.2.2. Calculate •18Owate r for each T-S pair. The oxy- gen isotopic composition of the water is predicted using the relationship between salinity and 818Owate r f•3r the waters warmer than 5øC from two nearby Geochemical Ocean Sec- tions Study (GEOSECS) stations (81BOwater (SMOW) = -18.2 + 0.530S, Figure 8).
5.2.3. Calculate the predicted 81SO of foraminifera cal- cifying in this water. The 5180 expected for the tbraminit•ra (Planulina and Cibicidoides), which also appears to be the 8]80 of calcite precipitated in equilibrium with seawater, is then calculated using the relationship derived from the Planu- lina and Cibicidoides) data shown in Figure 2 and Table 1:
•18Ocib = [•18Owater(SMOW) - 0.27] - 0.21 T+ 3.38 (1)
5.2.4. Determine relationship between 818Oci b and sigma-T. We derive an empirical relationship between the 818Oci b and sigma-T (Figure 8 and Table 3). Because this re- lationship depends on the local relationship between fi18Owater, salinity, and temperature, it will not necessarily hold outside today's North Atlantic subtropical gym.
5.2.5. Compute density using 818Ocm measurements from surface sediment samples. We averaged the individual •518Oci b measurements /br each surfbee sediment sample and then interpolated the average fi18Oci b measurements to com- mon depth levels (Table 4 and Figure 7). The uppermost fi18Oci b averages were extrapolated to the sea sur/hce. We convert to sigma-T using the above relationship for today's subtropical North Atlantic (Figure 8 and Table 3).
5.3. Calculating Geostrophic Transport
We calculate the geostrophic transport using the two den- sity profiles and assuming a level of no motion at 760 m, the depth of the channel at the Florida Straits. Geostrophic trans- port can be calculated using the potential energy anomaly method as first lbrmulated by Fofonoff[1962] and described by UNESCO [ 1991 ] and Sato and Rossby [ 1995]. The vertical distribution of the transport can be calculated using the modi-
fication of the potential energy anomaly method presented by Sato and Rossby [1995, equations (9) and (10)]. Because we have no independent knowledge of the depth distribution of temperature and salinity, instead of using the specific volume anomaly 8 in these calculations we use the thermosteric anomaly As, t, which can be calculated with a knowledge of sigma-T alone and is the dominant contribution to the specific volume anomaly in waters in the upper 1000 m of the ocean [Pond and Pickard, 1983]. This approximation makes only a small difference in the result.
6. Transport Estimates for the Florida Straits 6.1. Best Estimate
Using the methods described above, we calculate a trans- port through the Florida Straits of 32 Sv (Table 4), in good agreement with the long-term average transport estimates based on physical oceanographic methods (30-32 Sv). In ad- dition, the vertical distribution of flow agrees well with mod- ern measurements (Figure 9). The time period represented by our measurement is not well defined. Downcore records of
818Oci b from the Little Bahama Banks [Slowey and Curry, 1995] are quite constant lbr the Holocene, indicating that the density profile estimated lbr the Little Bahama Banks most likely is representative of the entire Holocene. We have no downcore records from the Florida Keys, but it is likely that the Holocene section is quite thick [e.g., Locker and Hine, 1995]. If this is the case, the data fi'om Florida Keys profile may reflect as little as several hundred years. Downcore re- cords and/or radiocarbon analyses could be used to constrain the timescale of the measurement.
The accuracy of our transport estimate is a direct conse- quence of the lhct that we know the relationship between tem- perature, salinity, and •18Owate r in this area and can use this infbrmation to accurately transform the •18Oci b data into den- sity. This method could conceivably be used to reconstruct modern flows in areas where long term monitoring of flow is
366 LYNCH-STIEGLITZ ET AL.: FLORIDA STRAITS GEOSTROPHIC TRANSPORT
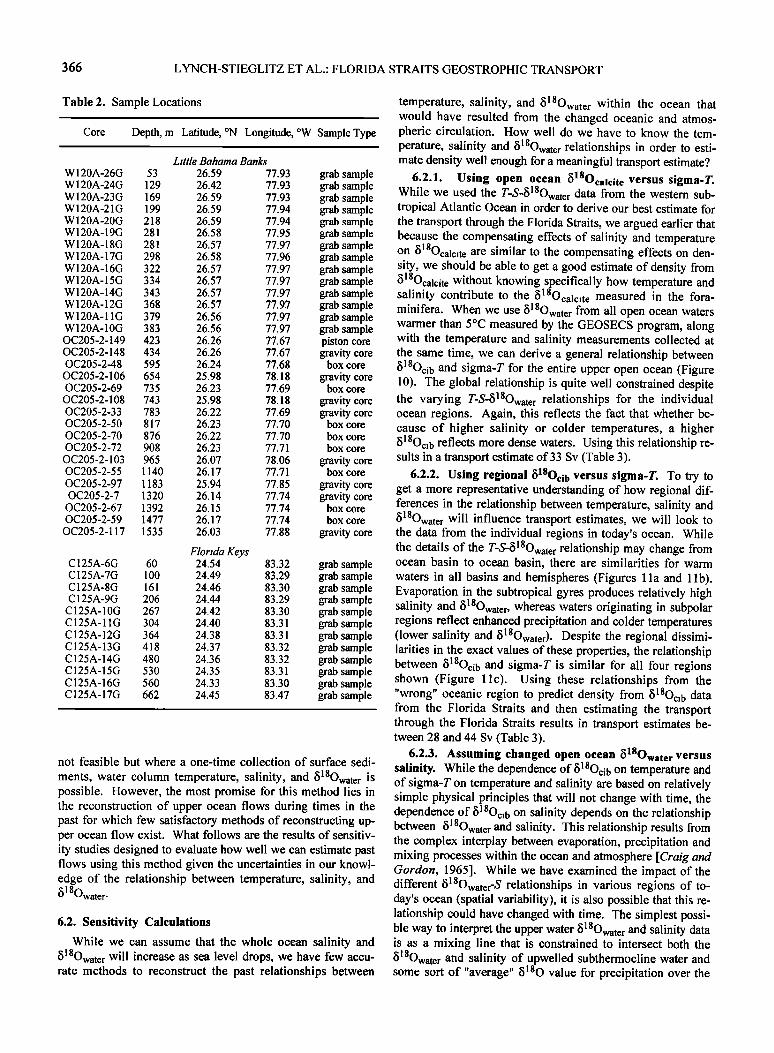
Table 2. Sample Locations
Core Depth, m Latitude, øN Longitude, øW Sample Type
Little Bahama Banks
W120A-26G 53 26.59 77.93 grab sample W120A-24G 129 26.42 77.93 grab sample W120A-23G 169 26.59 77.93 grab sample W120A-21G 199 26.59 77.94 grab sample W120A-20G 218 26.59 77.94 grab sample W120A-19G 281 26.58 77.95 grab sample W120A-18G 281 26.57 77.97 grab sample W120A-17G 298 26.58 77.96 grab sample W120A-16G 322 26.57 77.97 grab sample W120A-15G 334 26.57 77.97 grab sample W120A-14G 343 26.57 77.97 grab sample W120A-12G 368 26.57 77.9.7 grab sample W120A-11G 379 26.56 77.97 grab sample W120A-10G 383 26.56 77.97 grab sample OC205-2-149 423 26.26 77.67 piston core OC205-2-148 434 26.26 77.67 gravity core OC205-2-48 595 26.24 77.68 box core OC205-2-106 654 25.98 78.18 gravity core OC205-2-69 735 26.23 77.69 box core OC205-2-108 743 25.98 78.18 gravity core OC205-2-33 783 26.22 77.69 gravity core OC205-2-50 817 26.23 77.70 box core OC205-2-70 876 26.22 77.70 box core OC205-2-72 908 26.23 77.71 box core
OC205-2-103 965 26.07 78.06 gravity core OC205-2-55 1140 26.17 77.71 box core
OC205-2-97 1183 25.94 77.85 gravity core OC205-2-7 1320 26.14 77.74 gravity core
OC205-2-67 1392 26.15 77.74 box core OC205-2-59 1477 26.17 77.74 box core
OC205-2-117 1535 26.03 77.88 gravity core
Florida Keys C125A-6G 60 24.54 83.32 grab sample C125A-7G 100 24.49 83.29 grab sample C125A-8G 161 24.46 83.30 grab sample C125A-9G 206 24.44 83.29 grab sample C125A-10G 267 24.42 83.30 grab sample C125A-11G 304 24.40 83.31 grab sample C125A-12G 364 24.38 83.31 grab sample C125A-13G 418 24.37 83.32 grab sample C125A-14G 480 24.36 83.32 grab sample C125A-15G 530 24.35 83.31 grab sample C125A-16G 560 24.33 83.30 grab sample C125A-17G 662 24.45 83.47 grab sample
not feasible but where a one-time collection of surface sedi-
ments, water column temperature, salinity, and •18Owate r is possible. However, the most promise for this method lies in the reconstruction of upper ocean flows during times in the past for which few satisfactory methods of reconstructing up- per ocean flow exist. What follows are the results of sensitiv- ity studies designed to evaluate how well we can estimate past flows using this method given the uncertainties in our knowl- edge of the relationship between temperature, salinity, and • 18Owater '
6.2. Sensitivity Calculations
While we can assume that the whole ocean salinity and •18Owate r will increase as sea level drops, we have few accu- rate methods to reconstruct the past relationships between
temperature, salinity, and •j18Owate r within the ocean that would have resulted from the changed oceanic and atmos- pheric circulation. How well do we have to know the tem- perature, salinity and •18Owate r relationships in order to esti- mate density well enough for a meaningful transport estimate?
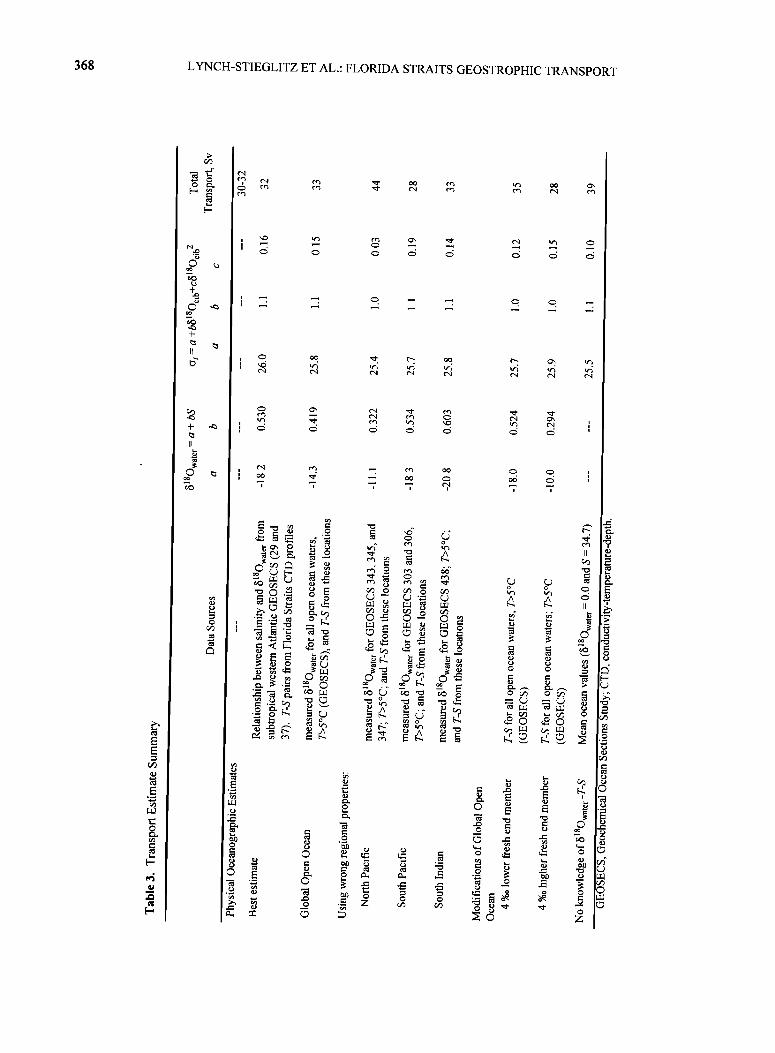
6.2.1. Using open ocean •18Ocaicit e versus sigma-T. While we used the T-S-•18Owate r data from the western sub- tropical Atlantic Ocean in order to derive our best estimate for the transport through the Florida Straits, we argued earlier that because the compensating effects of salinity and temperature on •18Ocalcit e are similar to the compensating effects on den- sity, we should be able to get a good estimate of density from •18Ocalcit e without knowing specifically how temperature and salinity contribute to the •18Ocalcit e measured in the fora- minifera. When we use b l BOwater from all open ocean waters warmer than 5øC measured by the GEOSECS program, along with the temperature and salinity measurements collected at the same time, we can derive a general relationship between •18Oci b and sigma-T for the entire upper open ocean (Figure 10). The global relationship is quite well constrained despite the varying T-S-•18Owate r relationships for the individual ocean regions. Again, this reflects the fact that whether be- cause of higher salinity or colder temperatures, a higher •18Oci b reflects more dense waters. Using this relationship re- sults in a transport estimate of 33 Sv (Table 3).
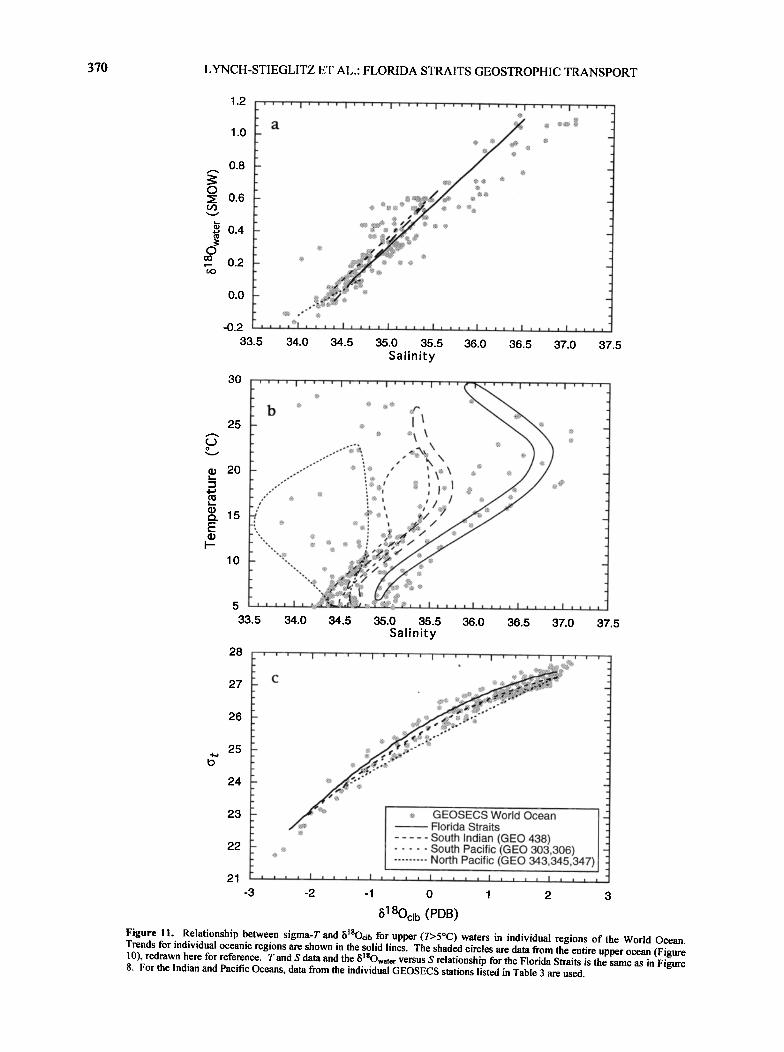
6.2.2. Using regional •18Oci b versus sigma-T. To try to get a more representative understanding of how regional dif- ferences in the relationship between temperature, salinity and •18Owate r will influence transport estimates, we will look to the data from the individual regions in today's ocean. While the details of the T-S-•18Owater relationship may change from ocean basin to ocean basin, there are similarities for warm waters in all basins and hemispheres (Figures 1 la and 1 lb). Evaporation in the subtropical gyres produces relatively high salinity and •18Owater, whereas waters originating in subpolar regions reflect enhanced precipitation and colder temperatures (lower salinity and •18Owater). Despite the regional dissimi- larities in the exact values of these properties, the relationship between •18Oci b and sigma-T is similar for all four regions shown (Figure 11c). Using these relationships from the "wrong" oceanic region to predict density from •18Oci b data from the Florida Straits and then estimating the transport through the Florida Straits results in transport estimates be- tween 28 and 44 Sv (Table 3).
6.2.3. Assuming changed open ocean •18Owate r versus salinity. While the dependence of •518Oci b on temperature and of sigma-T on temperature and salinity are based on relatively simple physical principles that will not change with time, the dependence of •5•8Ocib on salinity depends on the relationship between •18Owate r and salinity. This relationship results from the complex interplay between evaporation, precipitation and mixing processes within the ocean and atmosphere [Craig and Gordon, 1965]. While we have examined the impact of the different •5•8Owater-S relationships in various regions of to- day's ocean (spatial variability), it is also possible that this re- lationship could have changed with time. The simplest possi- ble way to interpret the upper water •18Owate r and salinity data is as a mixing line that is constrained to intersect both the •18Owate r and salinity of upwelled subthermocline water and some sort of "average" •5•80 value for precipitation over the
LYNCH-STIEGLITZ ET AL.' FLORIDA STRAITS GEOSTROPHIC TRANSPORT 367
1.2
1.0
o.8
0.6
O.4
0.2
0.0
34.5
3O
25
ß water - ß ß
GEOSECS 29, 37
35.0 35.5 36.0 36.5 37.0
Salinity
ee•
-
15 ß e •e •
5 ' ' ' ' •' I .... I , , , , I , , , , I , , , 34.5 35.0 35.5 36.0 36.5 '3 0
Salinity
28 , ' ' I .... I .... I .... I .... I ' ' '
c
27
26
25
24
23 ß 18 18 2
22 , , , , I , , , , I , , , , I .... I .... I , -3 -2 -1 0 1 2 3
6180ci b (PDB)
Figure 8. (a) Salinity and •lSOwater data from GEOSECS stations 29 and 37 (western subtropical North Atlantic) for the waters warmer than 5øC and linear regression through this data, (b) T-S data from the Florida Straits, and (c) calculated 6•80 of Planu- lina and Cibicidoides precipitated in these waters (using regression in Figure 8a and equation (1)) versus sigma-T (1980 Interna- tional Equation of State of Sea Water) [Millero and Poisson, 1981] for each T, $ pair shown in Figure 8b. Also shown is the sec- ond-order polynomial fit we use to transform •5•8Ocib to sigma-T estimates. This relationship, based on seawater data in the same region, is used in the best transport estimate for the Florida Current (Figure 9).
368 LYNCH-STIEGLITZ ET AL.: FLORIDA STRAITS GEOSTROPHIC TRANSPORT
+ .-• ! c:;
! ! !
LYNCH-STIEGLITZ ET AL.: FLORIDA STRAITS GEOSTROPHIC TRANSPORT 369
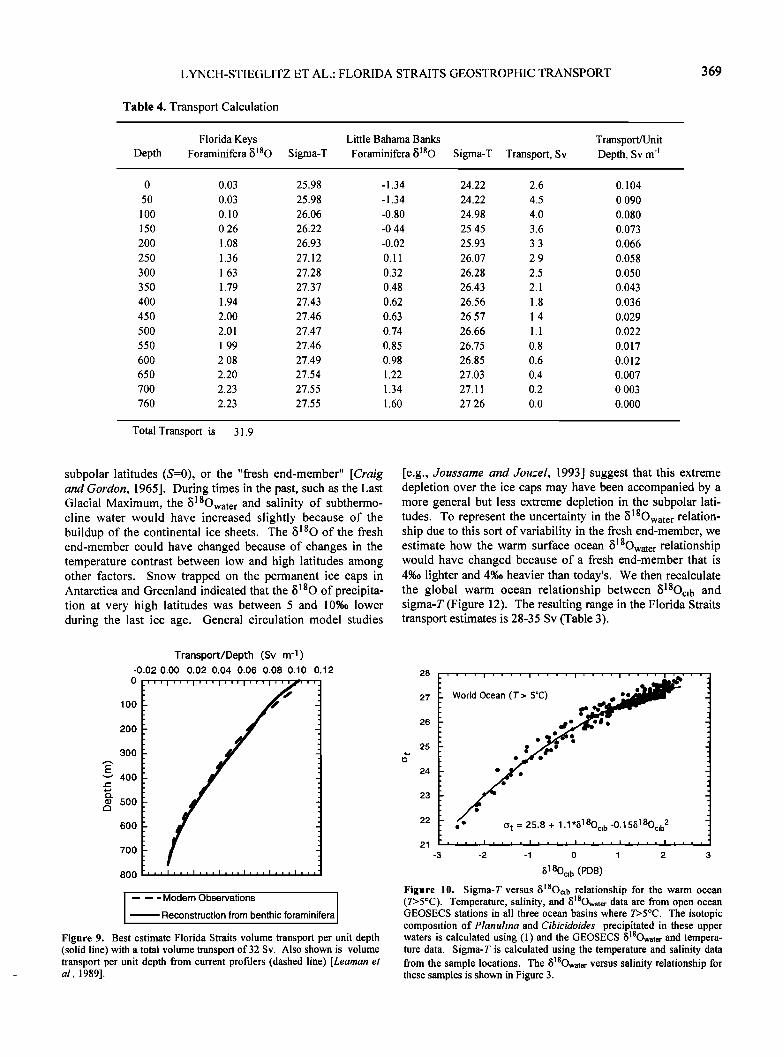
Table 4. Transport Calculation
Florida Keys Little Bahama Banks Depth Foraminifera/5180 Sigma-T Foraminifera/5180 Sigma-T Transport, Sv
Transport/Unit Depth, Sv m '1
0 0.03 25.98 -1.34 24.22 2.6
50 0.03 25.98 -1.34 24.22 4.5
100 0.10 26.06 -0.80 24.98 4.0
150 0.26 26.22 -0.44 25.45 3.6
200 1.08 26.93 -0.02 25.93 3.3
250 1.36 27.12 0.11 26.07 2.9
300 1.63 27.28 0.32 26.28 2.5
350 1.79 27.37 0.48 26.43 2.1
400 1.94 27.43 0.62 26.56 1.8
450 2.00 27.46 0.63 26.57 1.4
500 2.01 27.47 0.74 26.66 1.1
550 1.99 27.46 0.85 26.75 0.8
600 2.08 27.49 0.98 26.85 0.6
650 2.20 27.54 1.22 27.03 0.4
700 2.23 27.55 1.34 27.11 0.2
760 2.23 27.55 1.60 27.26 0.0
0.104
0.090
0.080
0.073
0.066
0.058
0.050
0.043
0.036
0.029
0.022
0.017
0.012
0.007
0.003
0.000
Total Transport is 31.9
subpolar latitudes (S=0), or the "fresh end-member" [Craig and Gordon, 1965]. During times in the past, such as the Last Glacial Maximum, the /518Owate r and salinity of subthermo- cline water would have increased slightly because of the buildup of the continental ice sheets. The/5 ] 80 of the fresh end-member could have changed because of changes in the temperature contrast between low and high latitudes among other factors. Snow trapped on the permanent ice caps in Antarctica and Greenland indicated that the/5180 of precipita- tion at very high latitudes was between 5 and 10%o lower during the last ice age. General circulation model studies
lOO
200
300
400
500
600
700
8OO
Transport/Depth (Sv m -1) -0.02 0.00 0.02 0.04 0.06 0.08 0.10 0.12
0
''' ''' 'J' ''' ''' ''' '''1
-,,,I,,,I,,,I,,,I,,,I,,,I,,,
-- -- - Modern Observations
Reconstruction from benthic foraminifera
Figure 9. Best estimate Florida Straits volume transport per unit depth (solid line) with a total volume transport of 32 Sv. Also shown is volume transport per unit depth from current profilers (dashed line) [Learnan et al., 1989].
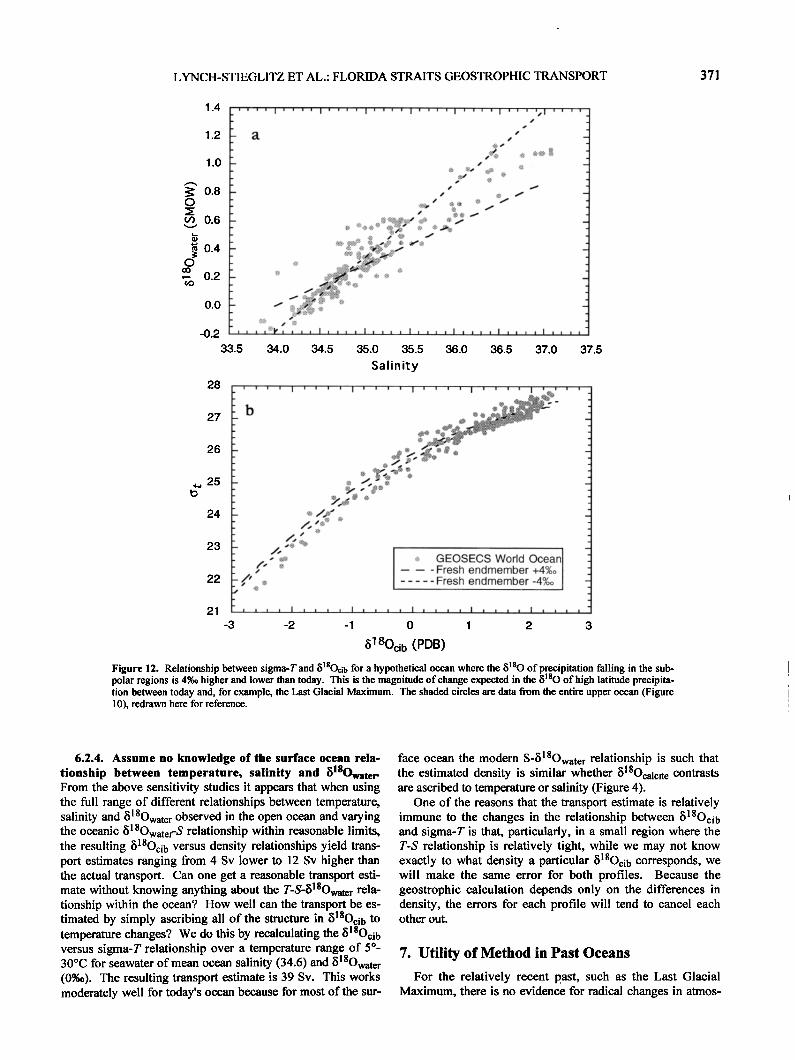
[e.g., doussame and douzel, 1993] suggest that this extreme depletion over the ice caps may have been accompanied by a more general but less extreme depletion in the subpolar lati- tudes. To represent the uncertainty in the/518Owate r relation- ship due to this sort of variability in the fresh end-member, we estimate how the warm surface ocean /518Owate r relationship would have changed because of a fresh end-member that is 4%o lighter and 4%o heavier than today's. We then recalculate the global warm ocean relationship between /518Oci b and sigma-T (Figure 12). The resulting range in the Florida Straits transport estimates is 28-35 Sv (Table 3).
28
27
26
25
24
23
22
21
-3
World Ocean (r > SøC) • '•_• ß 'j e•• e • ß
ß o t = 25.8 + 1.1 5 Oci b -0.15b Oci b
-2 -1 0 I 2 3
•5180ci b (PDB)
Figure 10. Sigma-T versus fi18Ocib relationship for the warm ocean (T>5øC). Temperature, salinity, and •5•8Owater data are from open ocean GEOSECS stations in all three ocean basins where T>5øC. The isotopic composition of Planulina and Cibicidoides precipitated in these upper waters is calculated using (1) and the GEOSECS •18Owater and tempera- ture data. Sigma-T is calculated using the temperature and salinity data from the sample locations. The •18Owater versus salinity relationship for these samples is shown in Figure 3.
370 LYNCH-STIEGLITZ ET AL.' FLORIDA STRAITS GEOSTROPHIC TRANSPORT
1.2
1.0
0.8
o % 0.6
• 0.4
0 co 0.2
0.0
-0.2
..-.:.
.• %•.•-'?".-&.>....• ..... .½- ,•o..%
.... ß .... • .'.:4: .- ";:"
' ' ' •1 • • ' • I • •r • • I ' ' • • I • • ' ' I • • • , I , , , , I , , , , 33.5 34.0 34.5 35.0 35.5
Salinity 36.0 36.5 37.0 37.5
30
25
• 20
•_ 15
10
33.5 34.0 34.5 35.0 35.5 36.0 36.5 37.0 37.5 Salinity
28
27
26
• 25
24
23
22
21
-3 -2 -1 0 1 2 3
b180cib (PDB)
Figure I 1. Relationship between sigma-T and $18Oci b for upper (T>5øC) waters in individual regions of the World Ocean. Trends for individual oceanic regions are shown in the solid lines. The shaded circles are data from the entire upper ocean (Figure 10), redrawn here for reference. T and S data and the • 8Owate r versus S relationship for the Florida Straits is the same as in Figure 8. For the Indian and Pacific Oceans, data from the individual GEOSECS stations listed in Table 3 are used.
LYNCH-STIEGLITZ ET AL.' FLORIDA STRAITS GEOSTROPHIC TRANSPORT 371
1.4
1.2
1.0
•: o.8 ¸
(/) 0.6
• 0.4
o
,--. 0.2
0.0
-0.2
33.5
28
27
26
•., 25
24
23
22
21
34.0 34.5 35.0 35.5 36.0 36.5 37.0
Salinity
! ! ! ! ]
b
37.5
• GEOSECS World Ocean -- -- - Fresh endmember +4%0 ..... Fresh endmember -4%0
' , , , , I , , • , I , , , , I , , , , I , , , , I I I I I
-3 -2 -1 0 1 2
(•180cib (PDB) Figure 12. Relationship between sigma-T and •18Oci b for a hypothetical ocean where the 5180 of precipitation falling in the sub- polar regions is 4%o higher and lower than today. This is the magnitude of change expected in the •180 of high latitude precipita- tion between today and, for example, the Last Glacial Maximum. The shaded circles are data from the entire upper ocean (Figure 10), redrawn here for reference.
6.2.4. Assume no knowledge of the surface ocean rela- tionship between temperature, salinity and •j18Owate r From the above sensitivity studies it appears that when using the full range of different relationships between temperature, salinity and •518Owate r observed in the open ocean and varying the oceanic •5 ] 8Owater-S relationship within reasonable limits, the resulting •j18Oci b versus density relationships yield trans- port estimates ranging from 4 Sv lower to 12 Sv higher than the actual transport. Can one get a reasonable transport esti- mate without knowing anything about the r-s-•j18Owater rela- tionship within the ocean? How well can the transport be es- timated by simply ascribing all of the structure in •j18Oci b to temperature changes? We do this by recalculating the •j18Oci b versus sigma-T relationship over a temperature range of 5 ø- 30øC for seawater of mean ocean salinity (34.6) and •j18Owate r (0%o). The resulting transport estimate is 39 Sv. This works moderately well for today's ocean because for most of the sur-
face ocean the modern S-•j18Owater relationship is such that the estimated density is similar whether •j18Ocalcit e contrasts are ascribed to temperature or salinity (Figure 4).
One of the reasons that the transport estimate is relatively immune to the changes in the relationship between •j18Oci b and sigma-T is that, particularly, in a small region where the T-S relationship is relatively tight, while we may not know exactly to what density a particular •j18Oci b corresponds, we will make the same error for both profiles. Because the geostrophic calculation depends only on the differences in density, the errors for each profile will tend to cancel each other out.
7. Utility of Method in Past Oceans
For the relatively recent past, such as the Last Glacial Maximum, there is no evidence for radical changes in atmos-
372 LYNCH-STIEGLITZ ET AL.: FLORIDA STRAITS GEOSTROPHIC TRANSPORT
pheric and thus surface ocean circulation. Although the pat- terns of atmospheric and surface ocean circulation might have shifted in latitude, we still expect that there existed an evapo- rative subtropical gyre and a fresh subpolar gyre during even the periods of maximum glaciation. While the changes in oceanic and atmospheric circulation could have resulted in a glacial T-S relationship in the subtropical Atlantic Ocean dif- ferent from today's, once we account for the whole ocean changes in salinity:due to the ice sheet buildup, we imagine that the difference between glacial and modern property dis- tributions at any one location was probably no larger than the differences between the different ocean basins today. Using this assumption, we estimate that the uncertainty in a transport estimate due to the incomplete knowledge of the T-S- •51 SOwate r distributions within the glacial ocean will be compa- rable to the error in transport when we calculated it using the •18Oci b versus sigma-T relationships for different ocean basins (Table 3). While uncertainties in the •518Owater-S relationship due to changes in the •5180 of the fresh end-member can also be important, the expected temporal (e.g. glacial-interglacial) changes in the •5180 of the fresh end-member are no larger than the range for different oceanographic regions today. In essence, we have come to the same conclusion as Craig and Gordon [1965] who, without the benefit of general circulation models or isotopic measurements on glacial ice, write that [Craig and Gordon, 1965, p. 65]
Our discussion leads us to conclude that the isotopic variations in surface ocean waters may well be about the same in both gla- cial and non-glacial periods. (Of course the absolute oceanic values for •5 and S shift along a slope somewhat similar to the high latitude surface water •5-S slope with the addition and re- moval of water from the oceans by the continental glaciers. Also there are transients during the growth and decay periods because of the mixing time between surface and deep waters. We speak here of the variations in the surface ocean waters at any given time) .... We do not wish to discuss the effects of glaciation on ocean mixing and precipitation and evaporation, as these effects are very complicated. But for applications to pa- leotemperatures, it is probably most reasonable to assume that variations fairly similar to those seen today have generally been present in the surface ocean waters.
Independent knowledge of temperature from the benthic fo- raminifera, perhaps from Mg/Ca ratios [Rosenthal et al., 1997], or T-•518Owate r relationships estimated for surface wa- ters in the region of upper water ventilation [Labeyrie et al., 1992] can help to constrain the T-S relationship and to reduce this source of uncertainty.
While this method shows great promise for the reconstruc- tion of oceanic volume transport during times in the past, it is also important to note its limitations. Transport estimates will be limited to upper waters and to relatively warm waters. While deepwater flows can also be largely geostrophic, the density contrasts in the deep ocean are much smaller and can- not be discerned given the amount of "noise" in the ability of foraminifera to record the temperature and •518Owate r of its surroundings (Figure 2). While this method can be used for flow in cold regions, in these regions the sigma-T becomes relatively insensitive to temperature, whereas the •518Ocalcite will still become heavier with decreasing temperature (Figure 4). Because of this, an increase in •518Ocalcit e does not trans- late into a significant increase in density. In this situation it
would be necessary to have a separate measure of temperature (e.g., Mg/Ca in the benthic foraminifera). In high latitudes another potential complication is the decoupling of •518Owater from salinity. While sea ice formation and melt will change salinity, the •518Owater is left relatively unaffected, further de- grading the density estimate from •518Ocalcit e. The best hope for accurate flow reconstructions using this method is in the oceanic warm sphere, those waters 5øC and above.
Another limitation of this method is geographical: in order to reconstruct flow one needs a vertical density profile on ei- ther side of the main flow. Many currents travel along an ocean boundary, and one density profile can be from the con- tinental margin. However, the other profile will probably need to be from an island or shallow seamount. It is important to note that while we have shown a relatively constricted flow in this example, the two density profiles can be quite widely spaced in longitude even if there are flow reversals between the two density profiles. The calculated transport will be the net transport between these two profiles. One way around the problem of needing an island or continental boundary to con- struct a density profile is to use planktonic foraminifera. Planktonic foraminifera live at different depths in the water column and generally have •518Ocalcit e in equilibrium with the seawater in which they grow [Emiliani, 1954; Fairbanks et al., 1982]. Some efforts have been made to use •518Ocalcit e from planktonic foraminifera for qualitative estimates of geostrophic flow [Ortiz et al., 1997]. However, before planktonic foraminifera can be used for quantitative flow re- construction a method for determining the depth at which they calcify is needed.
8. Conclusions
In this study we have shown that (1) the oxygen isotopic composition of calcite precipitated in equilibrium with mod- ern seawater is an excellent proxy for the density of seawater. (2) Over a temperature range of 5ø-27 øC, benthic fora- minifera of the genera Cibicidoides and Planulina calcify close to isotopic equilibrium with seawater. (3) Transport es- timates for the Florida Straits using density profiles recon- structed from benthic foraminifera and the geostrophic method agree very well with estimates from more conven- tional physical oceanographic techniques. (4) The use of this method is most accurate in the warm (T>5øC) surface ocean. Finally, (5) this method can be used for estimates of transport during the past, but uncertainties will be introduced because of changes in the distribution of the temperature, salinity, and b 18 0 of seawater.
Acknowledgments. This work would not have been conceived with- out the time and freedom allowed by a WHOI postdoctoral fellowship to JL-S. This work was also supported by U.S. National Science Foundation grants OCE-9402804 and OCE-9503135 to WBC and OCE-9712147 to JL-S. We also thank P. Lohmann and the Sea Edu-
cation Association for collecting the grab samples from the Westward 120 and the Cramer 125 cruises and D. Ostermann for help with the sample preparation and analyses. We are also grateful to T. Rossby for his suggestions on the transport calculations and a thorough re- view of the manuscript, and to C. Schaefer-Neth and M. Delaney for their helpful comments on the manuscript. This is LDEO contribu- tion 5899 and WHOI contribution 9876.
LYNCH-STIEGLITZ ET AL.: FLORIDA STRAITS GEOSTROPHIC TRANSPORT 373
References
Adkins, J.F., and E.A. Boyle, Changing atmos- pheric AI4c and the record of deep water pa- leoventilation ages, Paleoceanography, 12, 337- 344, 1997.
Bauch, D., P. Schlosser and R.G. Fairbanks, Fresh- water balance and the sources of deep and bot- tom waters in the Arctic Ocean inferred from the
distribution of H2180, Prog. Oceanogr., 35, 53- 80, 1995.
Bernis, B.E., H.J. Spero, J. Bijma, and D.W. Lea, Reevaluation of the oxygen isotopic composi- tion of planktonic foraminifera: Experimental results and revised palcotemperature equations, Paleoceanography, 13, 150-160, 1998.
Boyle, E.A., Cadmium and 15•3C palcochemical ocean distributions during the stage 2 glacial maximum, Annu. Rev. Earth Planet. Sci., 20, 245-287, 1992.
Boyle, E.A. and L. Keigwin, North Atlantic ther- mohaline circulation during the past 20,000 years linked to high-latitude surface tempera- ture, Nature, 330, 35-40, 1987.
Broecker, W.S., Oxygen isotope constraints on sur- face ocean temperatures, Quat. Res., 26, 121- 134, 1986.
Broecker, W.S, et al., Accelerator mass spectrome- try radiocarbon measurements on marine car- bonate samples from deep-sea cores and sedi- ment traps, Radiocarbon, 30, 261-295, 1988.
Craig, H., and L.I. Gordon, Deuterium and oxygen 18 variations in the ocean and the marine at- mosphere: Stable isotopes in oceanographic studies and palcotemperatures, in Proceedings of the Third Spoleto Conference, Spoleto, Italy, edited by E. Tongiori, pp. 9-130, Sischi and Figli, Pisa, Italy, 1965.
Curry, W.B., Late Quaternary deep circulation in the western equatorial Atlantic in The South At- lantic: Present and Past Circulation, edited by G. Wefer et al., Springer-Verlag, New York, 1997.
Curry, W.B., N.C. Slowey, and G.P. Lohmann, Oxygen and carbon isotopic fractionation of aragonitic and calcitic benthic foraminifera on Little Bahama Bank, Bahamas, EOS, Trans. AGU, 74, (43), Fall Meet. Suppl., 368, 1993.
Duplessy, J.C., N.J. Shackleton, R.G. Fairbanks, L. Labeyrie, D. Oppo and N. Kallel, Deepwater source variations during the last climatic cycle and their impact on the global deepwater circu- lation, Paleoceanography, 3, 343-360, 1988.
Emiliani, C., Depth habitats of some species of pe- lagic foraminifera as indicated by oxygen iso- tope ratios, Am. J. Sci., 252, 149-158, 1954.
Emiliani, C., Pleistocene temperatures, d. Geol., 63, 538-578, 1955.
Fairbanks, R.G., M. Sverdlove, R. Free, P.H. Wiebe, and A.W.H. Be, Vertical distribution and isotopic composition of living planktonic foraminifera from the Panama Basin, Nature, 298, 841-844, 1982.
Fairbanks, R.G., C.D. Charles and J.D. Wright, Ori- gin of global meltwater pulses, in Radiqcarbon after Four Decades, edited by R.E. Tay16r et al., pp. 473-500, Springer-Verlag, New York, 1992.
Fofonoff, N.P., Dynamics of ocean currents, in The Sea: Ideas and Observations on Progress in the Study of the Seas, vol. 1, Physical Oceanogra- phy, edited by M.N. Hill, pp. 323-395, John Wiley, New York, 1962.
Gardner, W.D., M.J. Richardson and D.A. Cac-
chione, Sedimentological effects of strong southward flow in the Straits of Florida, Mar. Geol., 86, 155-180, 1989.
Herguera, J.C., E. Jansen, and W.H. Berger, Evi- dence for a bathyl front at 2000-m depth in the glacial Pacific, based on a depth transect on Ontong Java Plateau, Paleoceanography, 7, 273-288, 1992.
Hogg, N.G., and W.E. Johns, Western boundary
the methods employed in the investigation, and the results of the research, Rep. U.S. Coast Geod. Surv., 10, 459-620, 1891.
Pond, S., and G.L. Pickard, Introducto,rv Dynamical Oceanography, 329 pp., Pergamon, Tarrytown, N.Y., 1983.
Richardson, W.S., W.J. Schmitz Jr., and P.P. Niiler, The velocity structure of the Florida Current from the Straits of Florida to Cape Fear, Deep
currents, Rev. Geophys., 33, 1311-1344, 1995. Sea Res., Suppl. to 16, 225-231, 1969. Johns, E., D. R. Watts and H.T. Rossby, A test of Rosenthal Y., E.A. Boyle and N. Slowey, Tem-
geostrophy in the Gulf Stream, J. Geophys. Res., perature control on the incorporation of magne- 94, 3211-3222, 1989.
Joussame, S. and J. Jouzel, Paleoclimatic tracers: An investigation using an atmospheric general circulation model under ice age conditions, 2, Water isotopes, J. Geophys. Res., 98, 2807- 2830, 1993.
Kim, S.-T., and J. O'Neil, Equilibrium and non- equilibrium oxygen isotope effects in synthetic carbonates, Geochirn. Cosrnochirn. Acta, 61, 3461-3475, 1997.
Labeyrie, L.D., J.-C. Duplessy, J. Duprat, A. Juillet- Leclerc, J. Moyes, E. Michel, N. Kallel and N.J. Shackleton, Changes in the vertical structure of the North Atlantic Ocean between glacial and modern times, Quat. Sci. Rev., 11, 401-413, 1992.
Larsen, J.C., Transport and heat flux of the Florida Current at 27øN derived from cross-stream volt-
ages and profiling data: Theory and observa- tions, Philos. Trans. R. Soc. London, Ser. A, 338, 169-236, 1992.
Leaman, K.D., E. Johns, and T. Rossby, The Aver- age Distribution of Volume Transport and Po- tential Vorticity With Temperature At 3 Sec- tions Across the Gulf-Stream, Journal of Physi- cal Oceanography, 19,36-51, 1989.
Levitus, S., and T.P. Boyer, World Ocean Atlas 1994, Nat. Oceanic and Atmos. Admin., Silver Spring, Md., 1994.
Locker, S.D., and A.C. Hine, Late Quaternary se- quence stratigraphy, South Florida margin, pa- per presented at the 27 th Annual Offshore Tech- nology Conference, Houston, Tex., 1-4 May, 1995.
sium, strontium, fluorine, and cadmium into benthic foraminiferal shells from Little Bahama
Bank: Prospects for thermocline paleoceanogra- phy, Geochirn. Cosrnochirn. Acta, 61, 3633- 3643, 1997.
Sarnthein, M., K. Winn, S.J.A. Jung, J.C. Duplessy, L. Labeyrie, H. Erlenkeuser, and G. Ganssen, Changes in East Atlantic Deep-Water Circula- tion Over the Last 30,000 Years - 8 Time Slice Reconstructions, Paleoceanography, 9 (2), 209- 267, 1994.
Sato, O.T., and T. Rossby, Seasonal and low fre- quency variations in dynamic height anomaly and transport of the Gulf Stream, Deep Sea Res. Part I., 42, 149-164, 1995.
Schmitz, W.J., and M.S. McCartney, On the North Atlantic circulation, Rev. Geophys., 31, 29-49, 1993.
Schmitz, W.J., J.R. Luyten and R.W. Schmitt, On the Florida Current T/S envelope, Bull. Mar. Sci., 53, 1048-1065, 1993.
Shackleton, N.J., Attainment of isotopic equilibrium between ocean water and the benthonic fora- minifera genus Uvigerina: Isotopic changes in the ocean during the last glacial, Cent. Nat. Rech., Sci. Colloq. Int., 219, 203-209, 1974.
Shackleton, J.J., J.-C. Duplessy, M. Arnold, P. Maurice, M.A. Hall, and J. Cartlidge, Radiocar- bon age of the last glacial Pacific, Nature, 335, 708-711, 1988.
Slowey, N.C., and W.B. Curry, Glacial-interglacial differences in circulation and carbon cycling within the upper western North Atlantic, Paleo- ceanography, 10, 715-732, 1995.
Lynch-Stieglitz, J., and R.G. Fairbanks, A conser- UNESCO, Processing of oceanographic station vative tracer for glacial ocean circulation from data, Joint Program on Oceanogr. Tables and carbon isotope and paleo-nutrient measurements in benthic foraminifera, Nature, 369, 308-310, 1994.
Mcintyre, A., N.G. Kipp, A.W.H. Be, T.J. Crowley, T. Kellogg, J.V. Gardner, W. Prell, W. and W.F. Ruddiman, The glacial North Atlantic 18,000 years ago: A CLIMAP reconstruction, in Inves- tigation of late Quaterna,rv Pateoceanography and Paleoclimatology, edited by R.M. Cline, and J.D. Hays, Geol. Soc. Am. Mern., 145, 43- 76, 1976.
Millero, F.J., and A. Poisson, International one- atmosphere equation of state of seawater, Deep Sea Res., Part A., 28, 625-629, 1981.
O'Neil, J.R., R.N. Clayton, and T.K. Mayeda, Oxy- gen isotope fractionation in divalent metal car- bonates, d. Chern. Phys., 5, 5547-5558, 1969.
Ortiz, .J.D., A.C. Mix, S. Hostetler and M. Kashgarian, The California Current of the Last• Glacial Maximum: Reconstruction at 42øN
based on multiple proxies, Paleoceanography,
Stand., 138 pp., Paris, 1991. Wust, G., Florida- und Antillenstrom: Eine hydro-
dynamische Untersuchung, Geogr. Natur. Reihe, 12, 1-48, 1924.
W.B. Curry, Woods Hole Oceanographic Insti- tution, Woods Hole, MA 02543. (wcurry•whoi.edu)
J. Lynch-Stieglitz, Lamont-Doherty Earth Ob- servatory, Palisades, NY 10964. (jean•ldeo.columbia.edu)
N. Slowey, Department of Oceanography, Texas A&M University, College Station, TX 77843. (slowey•ocean.tamu. edu)
(Received September 21, 1998; 12, 191-206, 1997. revised December 30, i998;
Pillsbury, J.E., The Gulf Stream--A description of accepted December 31, 1998)


![A Geostrophic Transport Estimate for the Florida Current ... · For example, Gardner et al. [1989] find sedimentologi- qsotopic data are available electronically at the World Data](https://img.pdfslide.us/doc/110x75/5d0489d188c993ab5c8cf614/a-geostrophic-transport-estimate-for-the-florida-current-for-example-gardner.jpg)