Embed Size (px)
Citation preview
ORIGINAL ARTICLE
A geological and geotechnical investigation of the settlementarea of Zumrut Building (Konya, Turkey) which caused 92fatalities due to its collapse
Adnan Ozdemir
Received: 24 November 2006 / Accepted: 23 April 2007 / Published online: 19 June 2007
� Springer-Verlag 2007
Abstract This study examines the local geological con-
ditions and soil structure as possible causes of the collapse
of the Zumrut Building 2 February 2004. This catastrophe
resulted in 92 fatalities and 35 injuries. This study also
examines other views which claim weak soil structure,
elastic and consolidation settlement of soil and excessive
groundwater extraction as well as subsidence resulting
from the underground silt erosion as possible factors.
Zumrut Building was constructed on normally consoli-
dated, low plasticity clay. The underground water table was
30 m in depth. The internal friction angle of soil was 8�–
30�, its cohesion was between 34 and 127 kN/m2 and
standard penetration test numbers varied between 11 and
50. The underground water level beneath Zumrut Building
had risen 4.5 m since its construction. Therefore the claim
that subsidence resulting from the decrease of underground
water level contributed to the collapse is incorrect. Sec-
ondly the settlement, resulting from the filling up of the
pores created by the silt receding with the underground
water, was 4.4 mm in total, and attributing this as the
primary cause of the collapse is also incorrect. Soil prop-
erties, in situ and laboratory test results showed that the
existing and/or expected settlement and the differential
ground settlement in the Zumrut building vicinity had the
potential to cause structural damage. The tensile stresses
caused by differential settlements recorded here are
thought to be an indicator, but not the main cause con-
tributing to the collapse of the building. The Zumrut
Building collapse was due to several compounding mis-
takes during the construction phase. These were geotech-
nical and other project faults and the use of low quality
construction materials. The resulting catastrophe caused 92
fatalities, 35 injuries and a material loss of approximately
US$7 million.
Keywords Building collapse � Soil settlement �Soil � Zumrut Building � Konya � Turkey
Introduction
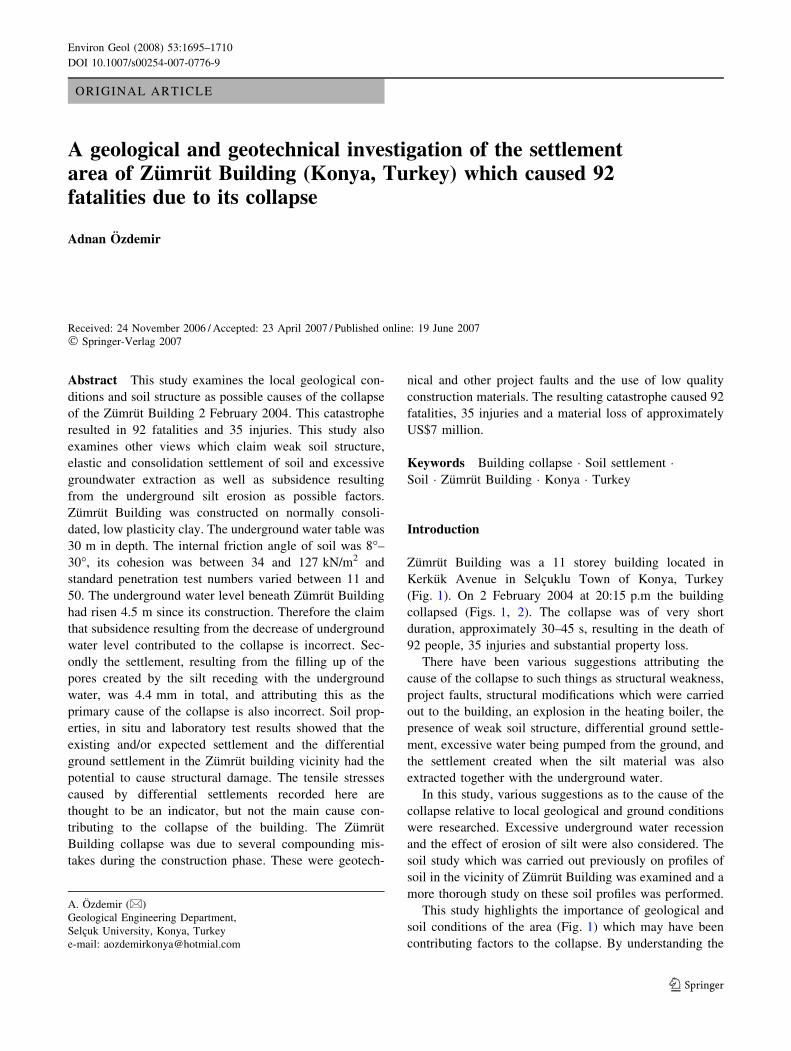
Zumrut Building was a 11 storey building located in
Kerkuk Avenue in Selcuklu Town of Konya, Turkey
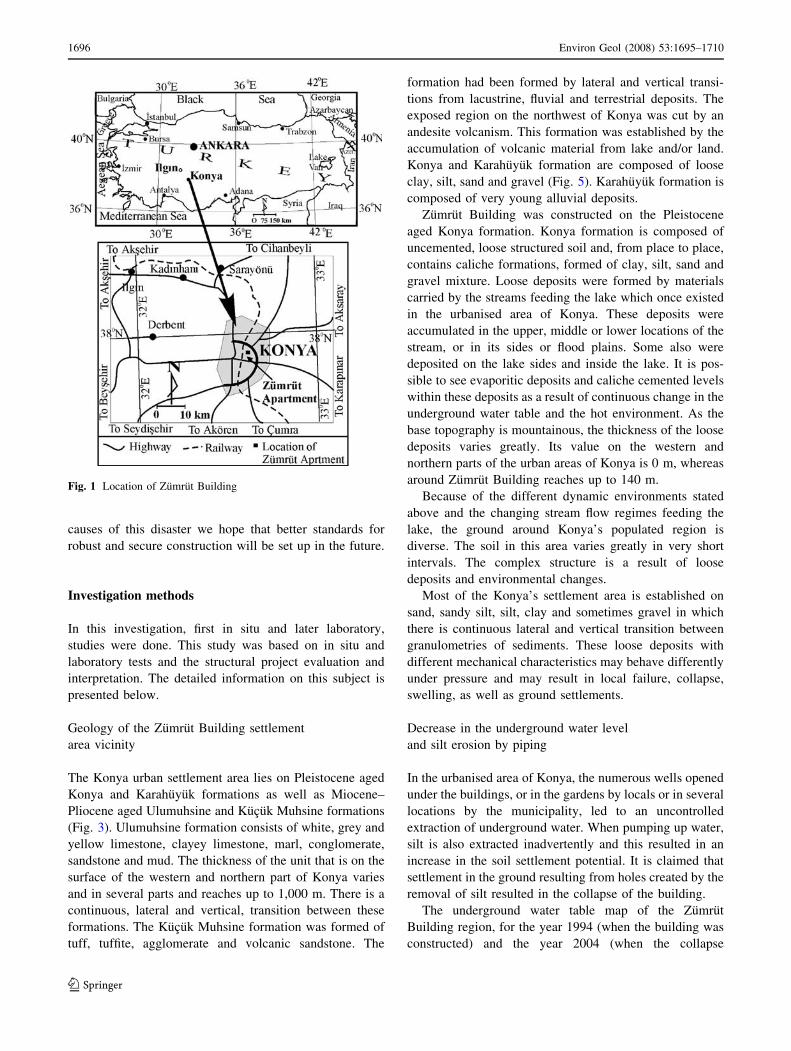
(Fig. 1). On 2 February 2004 at 20:15 p.m the building
collapsed (Figs. 1, 2). The collapse was of very short
duration, approximately 30–45 s, resulting in the death of
92 people, 35 injuries and substantial property loss.
There have been various suggestions attributing the
cause of the collapse to such things as structural weakness,
project faults, structural modifications which were carried
out to the building, an explosion in the heating boiler, the
presence of weak soil structure, differential ground settle-
ment, excessive water being pumped from the ground, and
the settlement created when the silt material was also
extracted together with the underground water.
In this study, various suggestions as to the cause of the
collapse relative to local geological and ground conditions
were researched. Excessive underground water recession
and the effect of erosion of silt were also considered. The
soil study which was carried out previously on profiles of
soil in the vicinity of Zumrut Building was examined and a
more thorough study on these soil profiles was performed.
This study highlights the importance of geological and
soil conditions of the area (Fig. 1) which may have been
contributing factors to the collapse. By understanding the
A. Ozdemir (&)
Geological Engineering Department,
Selcuk University, Konya, Turkey
e-mail: [email protected]
123
Environ Geol (2008) 53:1695–1710
DOI 10.1007/s00254-007-0776-9
causes of this disaster we hope that better standards for
robust and secure construction will be set up in the future.
Investigation methods
In this investigation, first in situ and later laboratory,
studies were done. This study was based on in situ and
laboratory tests and the structural project evaluation and
interpretation. The detailed information on this subject is
presented below.
Geology of the Zumrut Building settlement
area vicinity
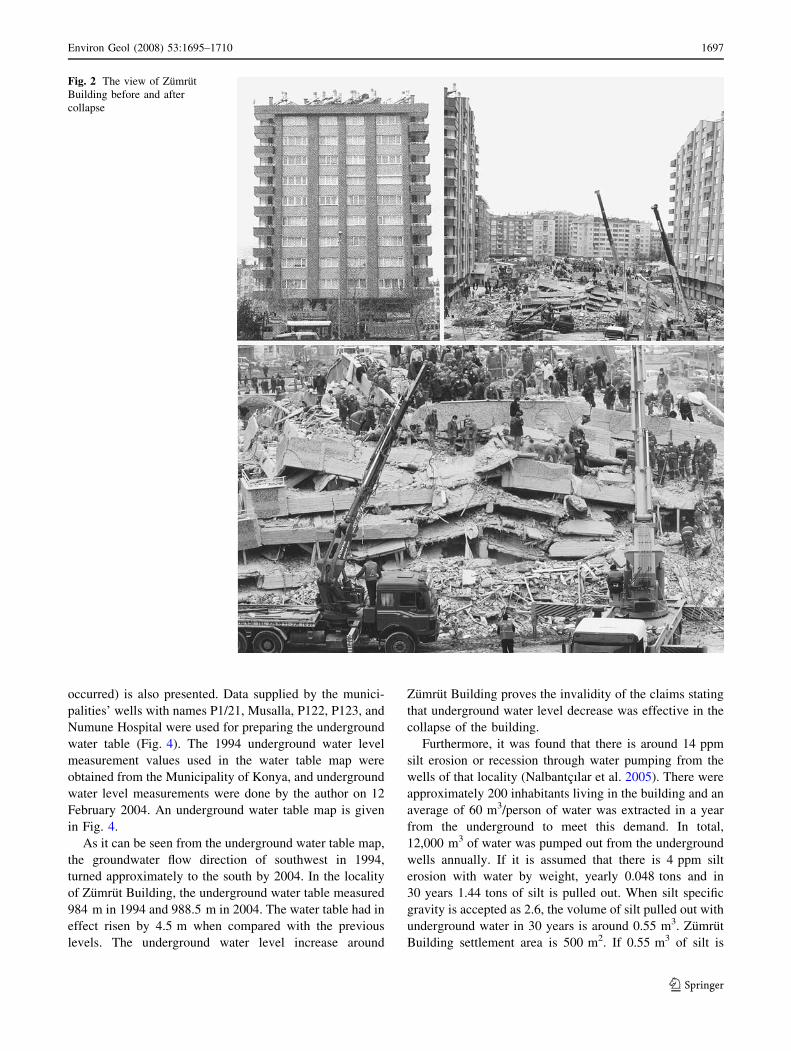
The Konya urban settlement area lies on Pleistocene aged
Konya and Karahuyuk formations as well as Miocene–
Pliocene aged Ulumuhsine and Kucuk Muhsine formations
(Fig. 3). Ulumuhsine formation consists of white, grey and
yellow limestone, clayey limestone, marl, conglomerate,
sandstone and mud. The thickness of the unit that is on the
surface of the western and northern part of Konya varies
and in several parts and reaches up to 1,000 m. There is a
continuous, lateral and vertical, transition between these
formations. The Kucuk Muhsine formation was formed of
tuff, tuffite, agglomerate and volcanic sandstone. The
formation had been formed by lateral and vertical transi-
tions from lacustrine, fluvial and terrestrial deposits. The
exposed region on the northwest of Konya was cut by an
andesite volcanism. This formation was established by the
accumulation of volcanic material from lake and/or land.
Konya and Karahuyuk formation are composed of loose
clay, silt, sand and gravel (Fig. 5). Karahuyuk formation is
composed of very young alluvial deposits.
Zumrut Building was constructed on the Pleistocene
aged Konya formation. Konya formation is composed of
uncemented, loose structured soil and, from place to place,
contains caliche formations, formed of clay, silt, sand and
gravel mixture. Loose deposits were formed by materials
carried by the streams feeding the lake which once existed
in the urbanised area of Konya. These deposits were
accumulated in the upper, middle or lower locations of the
stream, or in its sides or flood plains. Some also were
deposited on the lake sides and inside the lake. It is pos-
sible to see evaporitic deposits and caliche cemented levels
within these deposits as a result of continuous change in the
underground water table and the hot environment. As the
base topography is mountainous, the thickness of the loose
deposits varies greatly. Its value on the western and
northern parts of the urban areas of Konya is 0 m, whereas
around Zumrut Building reaches up to 140 m.
Because of the different dynamic environments stated
above and the changing stream flow regimes feeding the
lake, the ground around Konya’s populated region is
diverse. The soil in this area varies greatly in very short
intervals. The complex structure is a result of loose
deposits and environmental changes.
Most of the Konya’s settlement area is established on
sand, sandy silt, silt, clay and sometimes gravel in which
there is continuous lateral and vertical transition between
granulometries of sediments. These loose deposits with
different mechanical characteristics may behave differently
under pressure and may result in local failure, collapse,
swelling, as well as ground settlements.
Decrease in the underground water level
and silt erosion by piping
In the urbanised area of Konya, the numerous wells opened
under the buildings, or in the gardens by locals or in several
locations by the municipality, led to an uncontrolled
extraction of underground water. When pumping up water,
silt is also extracted inadvertently and this resulted in an
increase in the soil settlement potential. It is claimed that
settlement in the ground resulting from holes created by the
removal of silt resulted in the collapse of the building.
The underground water table map of the Zumrut
Building region, for the year 1994 (when the building was
constructed) and the year 2004 (when the collapse
Fig. 1 Location of Zumrut Building
1696 Environ Geol (2008) 53:1695–1710
123
occurred) is also presented. Data supplied by the munici-
palities’ wells with names P1/21, Musalla, P122, P123, and
Numune Hospital were used for preparing the underground
water table (Fig. 4). The 1994 underground water level
measurement values used in the water table map were
obtained from the Municipality of Konya, and underground
water level measurements were done by the author on 12
February 2004. An underground water table map is given
in Fig. 4.
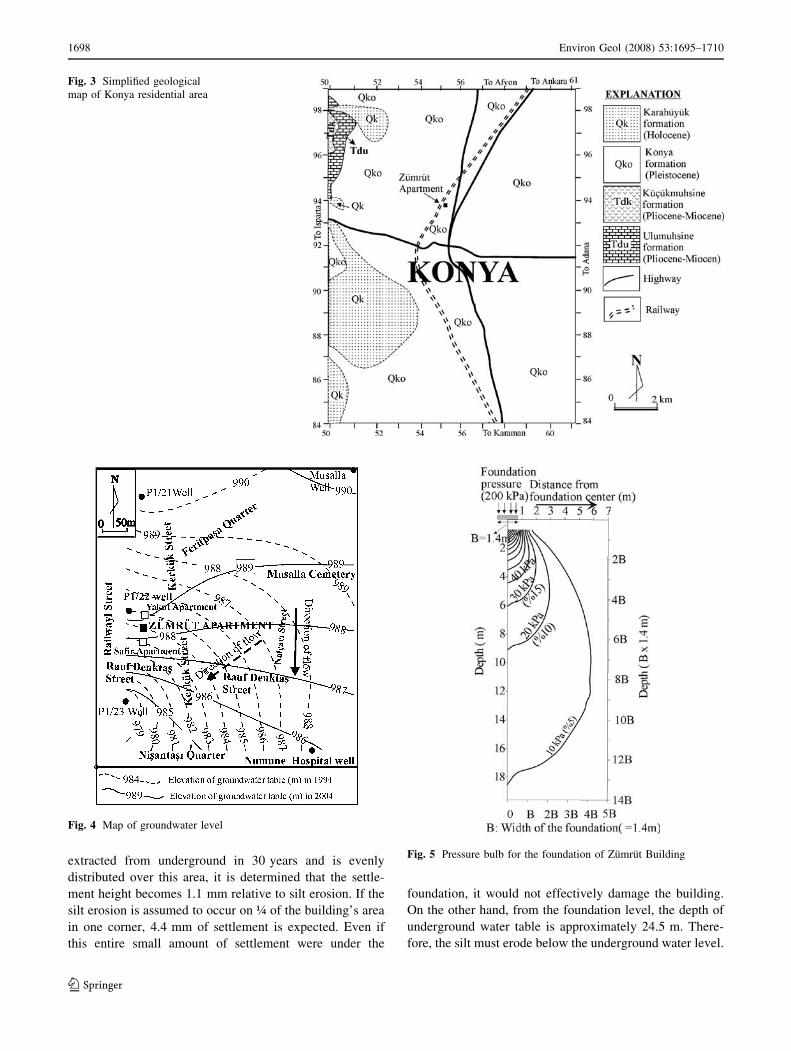
As it can be seen from the underground water table map,
the groundwater flow direction of southwest in 1994,
turned approximately to the south by 2004. In the locality
of Zumrut Building, the underground water table measured
984 m in 1994 and 988.5 m in 2004. The water table had in
effect risen by 4.5 m when compared with the previous
levels. The underground water level increase around
Zumrut Building proves the invalidity of the claims stating
that underground water level decrease was effective in the
collapse of the building.
Furthermore, it was found that there is around 14 ppm
silt erosion or recession through water pumping from the
wells of that locality (Nalbantcılar et al. 2005). There were
approximately 200 inhabitants living in the building and an
average of 60 m3/person of water was extracted in a year
from the underground to meet this demand. In total,
12,000 m3 of water was pumped out from the underground
wells annually. If it is assumed that there is 4 ppm silt
erosion with water by weight, yearly 0.048 tons and in
30 years 1.44 tons of silt is pulled out. When silt specific
gravity is accepted as 2.6, the volume of silt pulled out with
underground water in 30 years is around 0.55 m3. Zumrut
Building settlement area is 500 m2. If 0.55 m3 of silt is
Fig. 2 The view of Zumrut
Building before and after
collapse
Environ Geol (2008) 53:1695–1710 1697
123
extracted from underground in 30 years and is evenly
distributed over this area, it is determined that the settle-
ment height becomes 1.1 mm relative to silt erosion. If the
silt erosion is assumed to occur on ¼ of the building’s area
in one corner, 4.4 mm of settlement is expected. Even if
this entire small amount of settlement were under the
foundation, it would not effectively damage the building.
On the other hand, from the foundation level, the depth of
underground water table is approximately 24.5 m. There-
fore, the silt must erode below the underground water level.
Fig. 4 Map of groundwater level
Fig. 3 Simplified geological
map of Konya residential area
Fig. 5 Pressure bulb for the foundation of Zumrut Building
1698 Environ Geol (2008) 53:1695–1710
123
It is obvious that the effect of the pores caused by silt
erosion, at a depth of 25 m or more under the foundation
will be reduced by the thick ground layer above the
underground water table and the settlement here will be
ineffective under the foundation. Even if all the silt were
extracted from a region, an underground void of 0.55 m3
would be filled by loose particles falling from the 25 m
thick soil layer. This would not by itself pose a danger to
the foundation. By doing conservative calculations, it can
be concluded that there is no significant influence of soil
settlement caused by silt erosion, which can lead to the
collapse of the building.
Geotechnical investigation
One hour after the collapse of Zumrut Building, a visual
observation of the site was done. No perceivable ground
settlement, swelling or sliding were observed. It was decided
that further studies were needed to investigate the ground
under the building. Five geotechnical bore holes were drilled
in order to ascertain if there were any adverse ground con-
ditions that may have been responsible for the collapse.
Determination of borehole locations and their depths
Zumrut Building collapsed 5 years after its completion and
10 years after the commencement of construction. Four
boreholes were planned around the building’s base area;
hoping to collect data about the effect of the building’s
weight on the surroundings. There was a possibility that
boreholes drilled further away from the building’s base
would not provide the correct data since ground character-
istics could be different there. Boreholes were drilled close to
the structure at appropriate points subjected to the least
weight effect of the building. Pressure bulb calculations were
used to find suitable borehole locations and their depths.
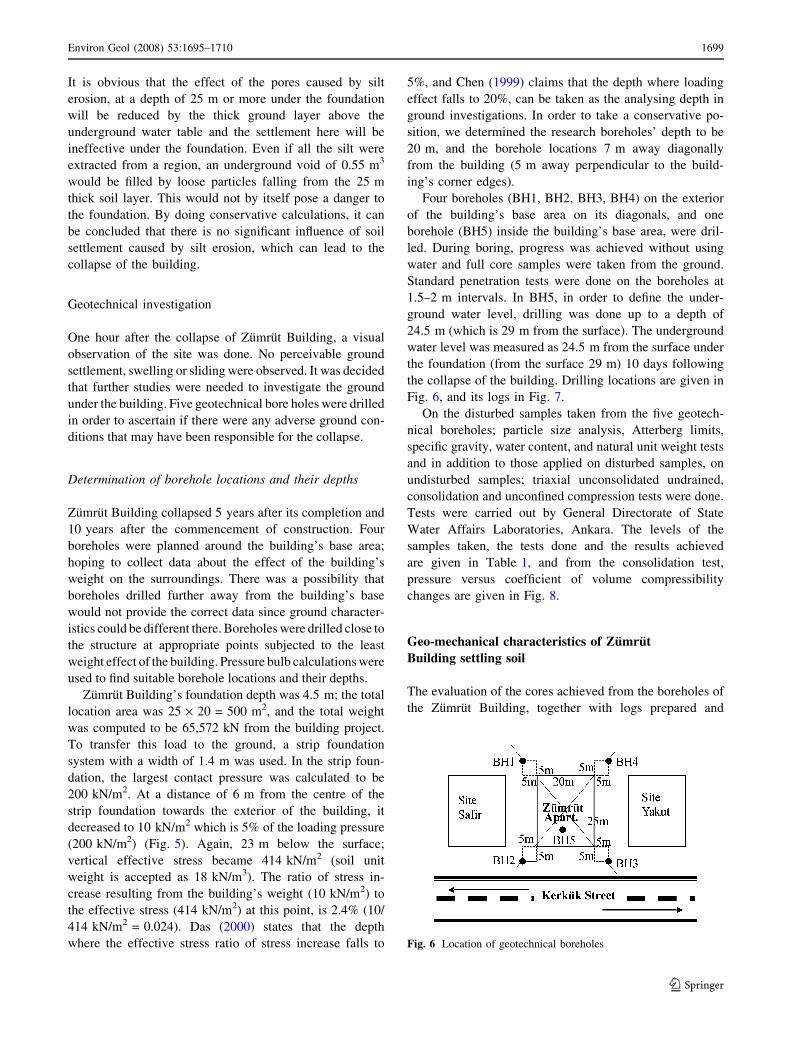
Zumrut Building’s foundation depth was 4.5 m; the total
location area was 25 · 20 = 500 m2, and the total weight
was computed to be 65,572 kN from the building project.
To transfer this load to the ground, a strip foundation
system with a width of 1.4 m was used. In the strip foun-
dation, the largest contact pressure was calculated to be
200 kN/m2. At a distance of 6 m from the centre of the
strip foundation towards the exterior of the building, it
decreased to 10 kN/m2 which is 5% of the loading pressure
(200 kN/m2) (Fig. 5). Again, 23 m below the surface;
vertical effective stress became 414 kN/m2 (soil unit
weight is accepted as 18 kN/m3). The ratio of stress in-
crease resulting from the building’s weight (10 kN/m2) to
the effective stress (414 kN/m2) at this point, is 2.4% (10/
414 kN/m2 = 0.024). Das (2000) states that the depth
where the effective stress ratio of stress increase falls to
5%, and Chen (1999) claims that the depth where loading
effect falls to 20%, can be taken as the analysing depth in
ground investigations. In order to take a conservative po-
sition, we determined the research boreholes’ depth to be
20 m, and the borehole locations 7 m away diagonally
from the building (5 m away perpendicular to the build-
ing’s corner edges).
Four boreholes (BH1, BH2, BH3, BH4) on the exterior
of the building’s base area on its diagonals, and one
borehole (BH5) inside the building’s base area, were dril-
led. During boring, progress was achieved without using
water and full core samples were taken from the ground.
Standard penetration tests were done on the boreholes at
1.5–2 m intervals. In BH5, in order to define the under-
ground water level, drilling was done up to a depth of
24.5 m (which is 29 m from the surface). The underground
water level was measured as 24.5 m from the surface under
the foundation (from the surface 29 m) 10 days following
the collapse of the building. Drilling locations are given in
Fig. 6, and its logs in Fig. 7.
On the disturbed samples taken from the five geotech-
nical boreholes; particle size analysis, Atterberg limits,
specific gravity, water content, and natural unit weight tests
and in addition to those applied on disturbed samples, on
undisturbed samples; triaxial unconsolidated undrained,
consolidation and unconfined compression tests were done.
Tests were carried out by General Directorate of State
Water Affairs Laboratories, Ankara. The levels of the
samples taken, the tests done and the results achieved
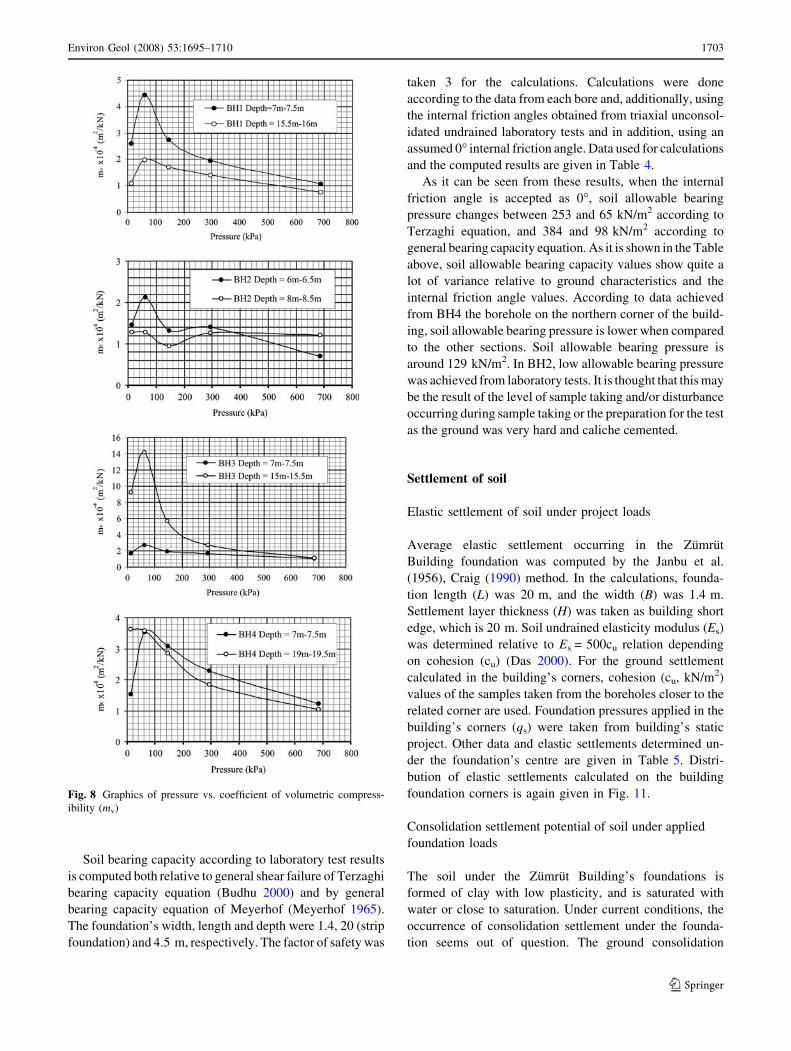
are given in Table 1, and from the consolidation test,
pressure versus coefficient of volume compressibility
changes are given in Fig. 8.
Geo-mechanical characteristics of Zumrut
Building settling soil
The evaluation of the cores achieved from the boreholes of
the Zumrut Building, together with logs prepared and
Fig. 6 Location of geotechnical boreholes
Environ Geol (2008) 53:1695–1710 1699
123
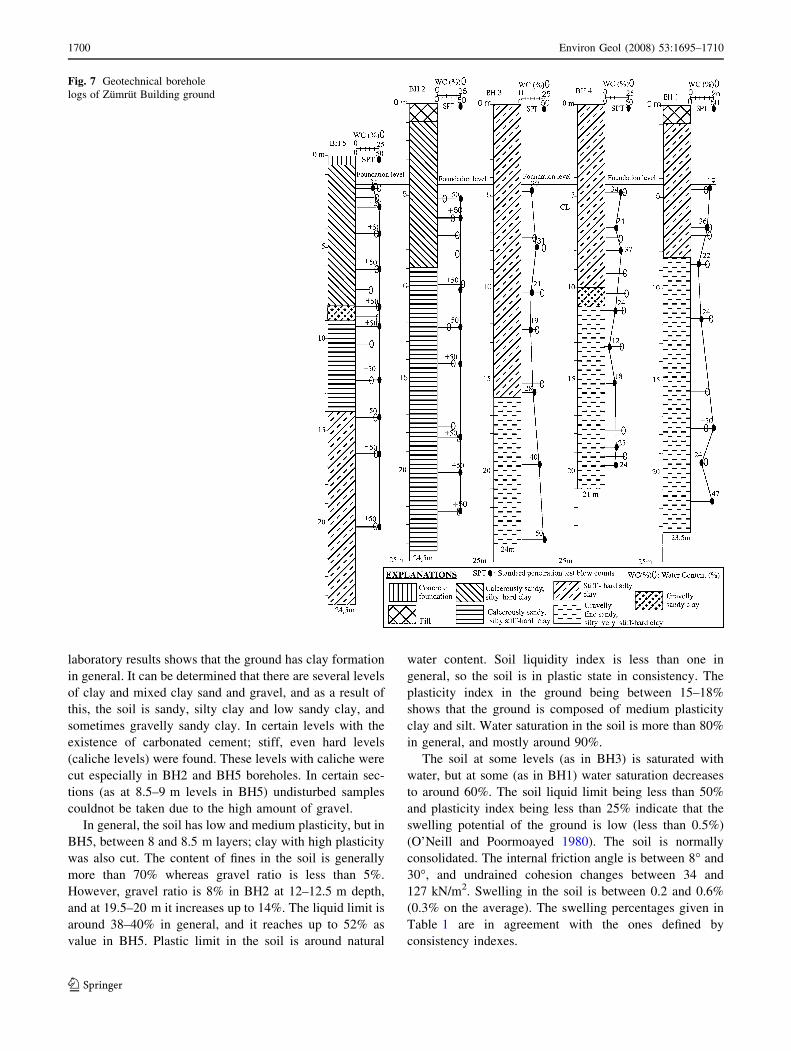
laboratory results shows that the ground has clay formation
in general. It can be determined that there are several levels
of clay and mixed clay sand and gravel, and as a result of
this, the soil is sandy, silty clay and low sandy clay, and
sometimes gravelly sandy clay. In certain levels with the
existence of carbonated cement; stiff, even hard levels
(caliche levels) were found. These levels with caliche were
cut especially in BH2 and BH5 boreholes. In certain sec-
tions (as at 8.5–9 m levels in BH5) undisturbed samples
couldnot be taken due to the high amount of gravel.
In general, the soil has low and medium plasticity, but in
BH5, between 8 and 8.5 m layers; clay with high plasticity
was also cut. The content of fines in the soil is generally
more than 70% whereas gravel ratio is less than 5%.
However, gravel ratio is 8% in BH2 at 12–12.5 m depth,
and at 19.5–20 m it increases up to 14%. The liquid limit is
around 38–40% in general, and it reaches up to 52% as
value in BH5. Plastic limit in the soil is around natural
water content. Soil liquidity index is less than one in
general, so the soil is in plastic state in consistency. The
plasticity index in the ground being between 15–18%
shows that the ground is composed of medium plasticity
clay and silt. Water saturation in the soil is more than 80%
in general, and mostly around 90%.
The soil at some levels (as in BH3) is saturated with
water, but at some (as in BH1) water saturation decreases
to around 60%. The soil liquid limit being less than 50%
and plasticity index being less than 25% indicate that the
swelling potential of the ground is low (less than 0.5%)
(O’Neill and Poormoayed 1980). The soil is normally
consolidated. The internal friction angle is between 8� and
30�, and undrained cohesion changes between 34 and
127 kN/m2. Swelling in the soil is between 0.2 and 0.6%
(0.3% on the average). The swelling percentages given in
Table 1 are in agreement with the ones defined by
consistency indexes.
Fig. 7 Geotechnical borehole
logs of Zumrut Building ground
1700 Environ Geol (2008) 53:1695–1710
123
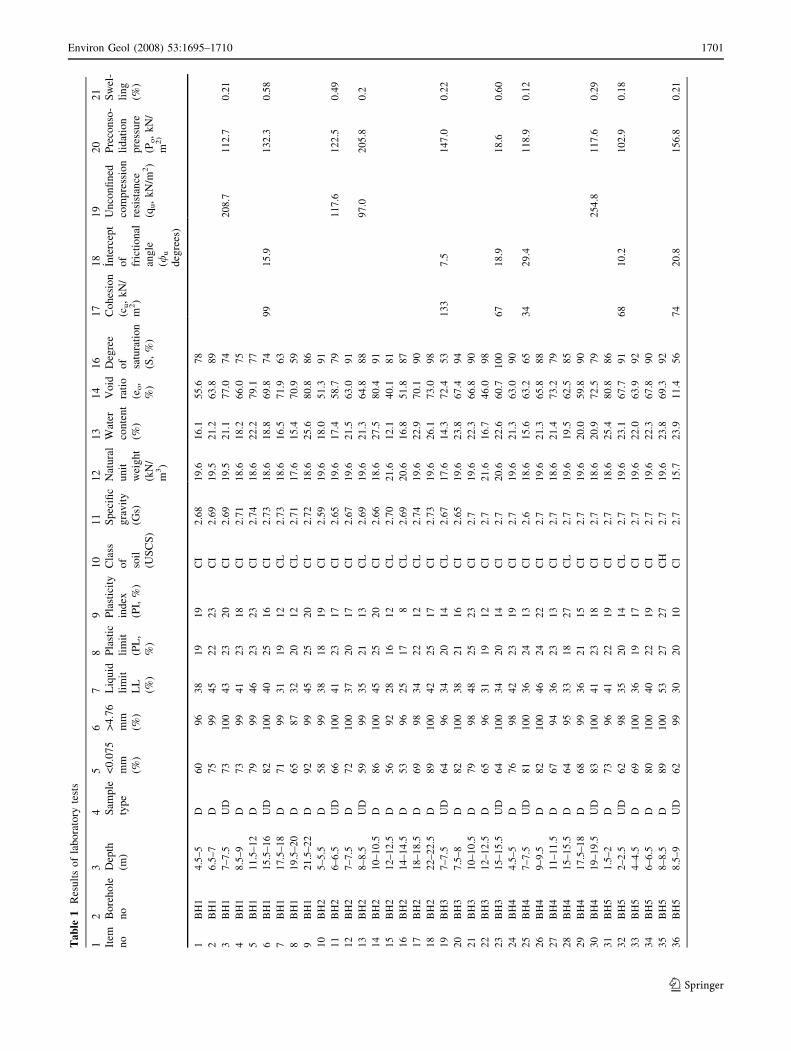
Ta
ble
1R
esu
lts
of
lab
ora
tory
test
s
12
34
56
78
91
01
11
21
31
41
61
71
81
92
02
1
Item
no
Bo
reh
ole
no
Dep
th
(m)
Sam
ple
typ
e
<0
.07
5
mm
(%)
>4
.76
mm
(%)
Liq
uid
lim
it
LL
(%)
Pla
stic
lim
it
(PL
,
%)
Pla
stic
ity
ind
ex
(PI,
%)
Cla
ss
of
soil
(US
CS
)
Sp
ecifi
c
gra
vit
y
(Gs)
Nat
ura
l
un
it
wei
gh
t
(kN
/
m3)
Wat
er
con
ten
t
(%)
Vo
id
rati
o
(eo,
%)
Deg
ree
of
satu
rati
on
(S,
%)
Co
hes
ion
(cu,
kN
/
m2)
_ Inte
rcep
t
of
fric
tio
nal
ang
le
(/u
deg
rees
)
Un
con
fin
ed
com
pre
ssio
n
resi
stan
ce
(qu,
kN
/m2)
Pre
con
so-
lid
atio
n
pre
ssu
re
(Po,
kN
/
m2)
Sw
el-
lin
g
(%)
1B
H1
4.5
–5
D6
09
63
81
91
9C
I2
.68
19
.61
6.1
55
.67
8
2B
H1
6.5
–7
D7
59
94
52
22
3C
I2
.69
19
.52
1.2
63
.88
9
3B
H1
7–
7.5
UD
73
10
04
32
32
0C
I2
.69
19
.52
1.1
77
.07
42
08
.71
12
.70
.21
4B
H1
8.5
–9
D7
39
94
12
31
8C
I2
.71
18
.61
8.2
66
.07
5
5B
H1
11
.5–
12
D7
99
94
62
32
3C
I2
.74
18
.62
2.2
79
.17
7
6B
H1
15
.5–
16
UD
82
10
04
02
51
6C
I2
.73
18
.61
8.8
69
.87
49
91
5.9
13
2.3
0.5
8
7B
H1
17
.5–
18
D7
19
93
11
91
2C
L2
.73
18
.61
6.5
71
.96
3
8B
H1
19
.5–
20
D6
58
73
22
01
2C
L2
.71
17
.61
5.4
70
.95
9
9B
H1
21
.5–
22
D9
29
94
52
52
0C
I2
.72
18
.62
5.6
80
.88
6
10
BH
25
–5
.5D
58
99
38
18
19
CI
2.5
91
9.6
18
.05
1.3
91
11
BH
26
–6
.5U
D6
61
00
41
23
17
CI
2.6
51
9.6
17
.45
8.7
79
11
7.6
12
2.5
0.4
9
12
BH
27
–7
.5D
72
10
03
72
01
7C
I2
.67
19
.62
1.5
63
.09
1
13
BH
28
–8
.5U
D5
99
93
52
11
3C
L2
.69
19
.62
1.3
64
.88
89
7.0
20
5.8
0.2
14
BH
21
0–
10
.5D
86
10
04
52
52
0C
I2
.66
18
.62
7.5
80
.49
1
15
BH
21
2–
12
.5D
56
92
28
16
12
CL
2.7
02
1.6
12
.14
0.1
81
16
BH
21
4–
14
.5D
53
96
25
17
8C
L2
.69
20
.61
6.8
51
.88
7
17
BH
21
8–
18
.5D
69
98
34
22
12
CL
2.7
41
9.6
22
.97
0.1
90
18
BH
22
2–
22
.5D
89
10
04
22
51
7C
I2
.73
19
.62
6.1
73
.09
8
19
BH
37
–7
.5U
D6
49
63
42
01
4C
L2
.67
17
.61
4.3
72
.45
31
33
7.5
14
7.0
0.2
2
20
BH
37
.5–
8D
82
10
03
82
11
6C
I2
.65
19
.62
3.8
67
.49
4
21
BH
31
0–
10
.5D
79
98
48
25
23
CI
2.7
19
.62
2.3
66
.89
0
22
BH
31
2–
12
.5D
65
96
31
19
12
CI
2.7
21
.61
6.7
46
.09
8
23
BH
31
5–
15
.5U
D6
41
00
34
20
14
Cl
2.7
20
.62
2.6
60
.71
00
67
18
.91
8.6
0.6
0
24
BH
44
.5–
5D
76
98
42
23
19
CI
2.7
19
.62
1.3
63
.09
0
25
BH
47
–7
.5U
D8
11
00
36
24
13
CI
2.6
18
.61
5.6
63
.26
53
42
9.4
11
8.9
0.1
2
26
BH
49
–9
.5D
82
10
04
62
42
2C
I2
.71
9.6
21
.36
5.8
88
27
BH
41
1–
11
.5D
67
94
36
23
13
CI
2.7
18
.62
1.4
73
.27
9
28
BH
41
5–
15
.5D
64
95
33
18
27
CL
2.7
19
.61
9.5
62
.58
5
29
BH
41
7.5
–1
8D
68
99
36
21
15
CI
2.7
19
.62
0.0
59
.89
0
30
BH
41
9–
19
.5U
D8
31
00
41
23
18
CI
2.7
18
.62
0.9
72
.57
92
54
.81
17
.60
.29
31
BH
51
.5–
2D
73
96
41
22
19
CI
2.7
18
.62
5.4
80
.88
6
32
BH
52
–2
.5U
D6
29
83
52
01
4C
L2
.71
9.6
23
.16
7.7
91
68
10
.21
02
.90
.18
33
BH
54
–4
.5D
69
10
03
61
91
7C
I2
.71
9.6
22
.06
3.9
92
34
BH
56
–6
.5D
80
10
04
02
21
9C
I2
.71
9.6
22
.36
7.8
90
35
BH
58
–8
.5D
89
10
05
32
72
7C
H2
.71
9.6
23
.86
9.3
92
36
BH
58
.5–
9U
D6
29
93
02
01
0C
l2
.71
5.7
23
.91
1.4
56
74
20
.81
56
.80
.21
Environ Geol (2008) 53:1695–1710 1701
123
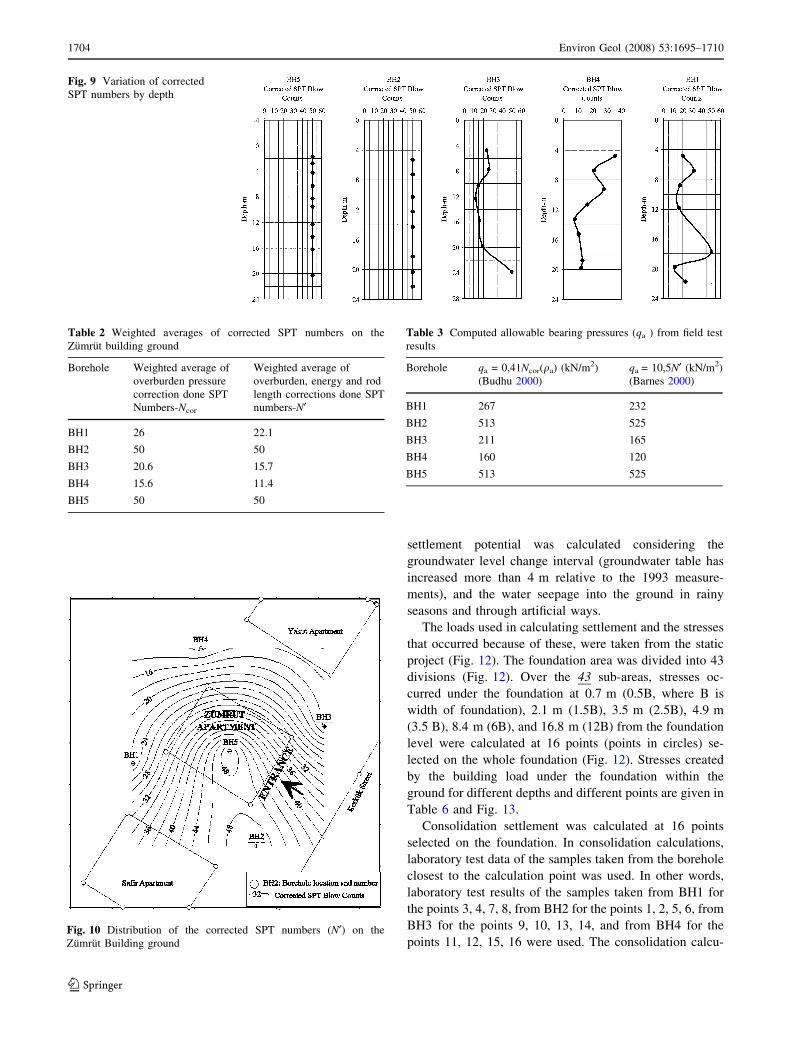
On the other hand, when overburden pressure correction
(Liao and Whitman 1985) is done, the change of the
standard penetration number (SPT) (Ncor) by depth is
analysed (Fig. 9). As a result of this analysis, in BH5 and
BH2, SPT numbers are found to be very high (>50), and in
BH3 (between 10 and 19 m depth) become very low. The
SPT number declines to 15 in BH1 between 8 and 12 m, in
BH3 between 10 and 19 m, and to 10 in BH4 between 12
and 16 m depth. After calculations, the SPT number
decreases to 12 in BH4 at 13 m depth. It can be concluded
that the soil in the research area varies considerably con-
sidering the high SPT numbers observed in BH5 and BH2
and the above mentioned low SPT numbers.
In order to make the comparison in an easier way,
correction of overburden pressure on SPT numbers and
energy correction (=0.75) as well as correction of rod
length and underground water level have been done. In this
study, overburden pressure correction was done according
to Liao and Whitman (1985), and the energy correction
coefficient accepted as 0.75 according to Skempton (1986).
Rod length and underground water level correction coef-
ficients were taken as 1, again according to Skempton
(1986). From these corrected SPT numbers, the weighted
average of corrected SPT numbers (N¢) for each well was
determined (Table 2). The changes in N¢ numbers on hor-
izontal plain of Zumrut Building settlement area and its
close surrounding are given in Fig. 10.
The soil allowable bearing capacity
The soil allowable bearing capacity according to corrected
SPT numbers (Ncor and N¢) was determined by the equa-
tions given below:
qa ¼ 0:14NcorqaSettlement qað Þ ¼ 25 mm½ � ð1Þ
(Budhu 2000)
qa ¼ 10:5N 0 ð2Þ
(Barnes 2000)
where
qa allowable bearing pressure (kN/m2)
Ncor corrected SPT numbers (Ncor = NCN),
N¢ corrected SPT numbers (N¢ = NCECNCRCW),
N field SPT numbers,
CE correction for energy (CE = 0.75) (Skempton 1986),
CN correction for overburden pressure (Liao and Whit-
man (1985),
CR correction for rod length (Skempton 1986),
CW correction for groundwater depth (CW = 1).
Soil allowable bearing pressures determined according
to the relations given above are given in Table 3.Ta
ble
1co
nti
nu
ed
12
34
56
78
91
01
11
21
31
41
61
71
81
92
02
1
Item
no
Bo
reh
ole
no
Dep
th
(m)
Sam
ple
typ
e
<0
.07
5
mm
(%)
>4
.76
mm
(%)
Liq
uid
lim
it
LL
(%)
Pla
stic
lim
it
(PL
,
%)
Pla
stic
ity
ind
ex
(PI,
%)
Cla
ss
of
soil
(US
CS
)
Sp
ecifi
c
gra
vit
y
(Gs)
Nat
ura
l
un
it
wei
gh
t
(kN
/
m3)
Wat
er
con
ten
t
(%)
Vo
id
rati
o
(eo,
%)
Deg
ree
of
satu
rati
on
(S,
%)
Co
hes
ion
(cu,
kN
/
m2)
_ Inte
rcep
t
of
fric
tio
nal
ang
le
(/u
deg
rees
)
Un
con
fin
ed
com
pre
ssio
n
resi
stan
ce
(qu,
kN
/m2)
Pre
con
s-
oli
dat
ion
pre
ssu
re
(Po,
kN
/
m2)
Sw
el-
lin
g
(%)
37
BH
51
0–
10
.5D
68
99
27
19
10
Cl
2.7
20
.61
7.0
54
.38
6
38
BH
51
2–
12
.5D
63
99
27
18
10
Cl
2.7
19
.61
6.7
56
.78
1
39
BH
51
4–
14
.5D
73
98
35
21
14
Cı
2.8
19
.62
0.6
69
.28
2
40
BH
51
6–
16
.5D
77
96
35
19
16
CI
2.7
19
.62
1.3
64
.89
0
41
BH
52
0–
20
.5D
82
10
03
82
11
7C
I2
.71
8.6
21
.07
3.6
78
1702 Environ Geol (2008) 53:1695–1710
123
Soil bearing capacity according to laboratory test results
is computed both relative to general shear failure of Terzaghi
bearing capacity equation (Budhu 2000) and by general
bearing capacity equation of Meyerhof (Meyerhof 1965).
The foundation’s width, length and depth were 1.4, 20 (strip
foundation) and 4.5 m, respectively. The factor of safety was
taken 3 for the calculations. Calculations were done
according to the data from each bore and, additionally, using
the internal friction angles obtained from triaxial unconsol-
idated undrained laboratory tests and in addition, using an
assumed 0� internal friction angle. Data used for calculations
and the computed results are given in Table 4.
As it can be seen from these results, when the internal
friction angle is accepted as 0�, soil allowable bearing
pressure changes between 253 and 65 kN/m2 according to
Terzaghi equation, and 384 and 98 kN/m2 according to
general bearing capacity equation. As it is shown in the Table
above, soil allowable bearing capacity values show quite a
lot of variance relative to ground characteristics and the
internal friction angle values. According to data achieved
from BH4 the borehole on the northern corner of the build-
ing, soil allowable bearing pressure is lower when compared
to the other sections. Soil allowable bearing pressure is
around 129 kN/m2. In BH2, low allowable bearing pressure
was achieved from laboratory tests. It is thought that this may
be the result of the level of sample taking and/or disturbance
occurring during sample taking or the preparation for the test
as the ground was very hard and caliche cemented.
Settlement of soil
Elastic settlement of soil under project loads
Average elastic settlement occurring in the Zumrut
Building foundation was computed by the Janbu et al.
(1956), Craig (1990) method. In the calculations, founda-
tion length (L) was 20 m, and the width (B) was 1.4 m.
Settlement layer thickness (H) was taken as building short
edge, which is 20 m. Soil undrained elasticity modulus (Es)
was determined relative to Es = 500cu relation depending
on cohesion (cu) (Das 2000). For the ground settlement
calculated in the building’s corners, cohesion (cu, kN/m2)
values of the samples taken from the boreholes closer to the
related corner are used. Foundation pressures applied in the
building’s corners (qs) were taken from building’s static
project. Other data and elastic settlements determined un-
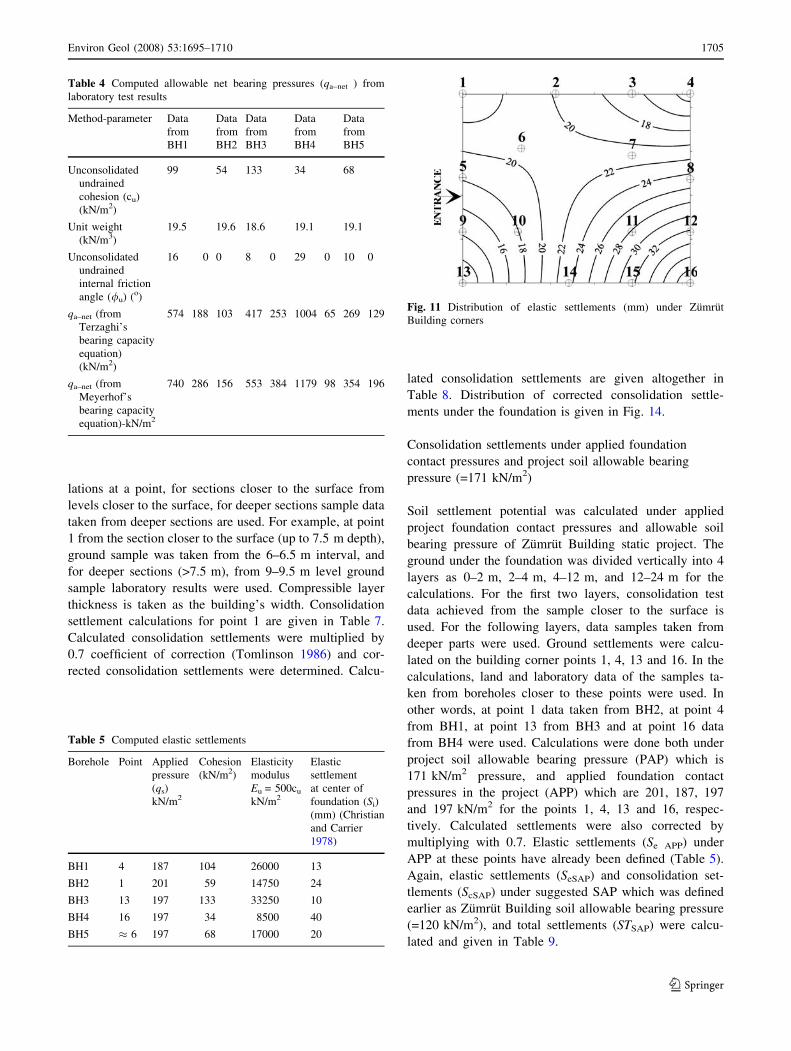
der the foundation’s centre are given in Table 5. Distri-
bution of elastic settlements calculated on the building
foundation corners is again given in Fig. 11.
Consolidation settlement potential of soil under applied
foundation loads
The soil under the Zumrut Building’s foundations is
formed of clay with low plasticity, and is saturated with
water or close to saturation. Under current conditions, the
occurrence of consolidation settlement under the founda-
tion seems out of question. The ground consolidation
Fig. 8 Graphics of pressure vs. coefficient of volumetric compress-
ibility (mv)
Environ Geol (2008) 53:1695–1710 1703
123
settlement potential was calculated considering the
groundwater level change interval (groundwater table has
increased more than 4 m relative to the 1993 measure-
ments), and the water seepage into the ground in rainy
seasons and through artificial ways.
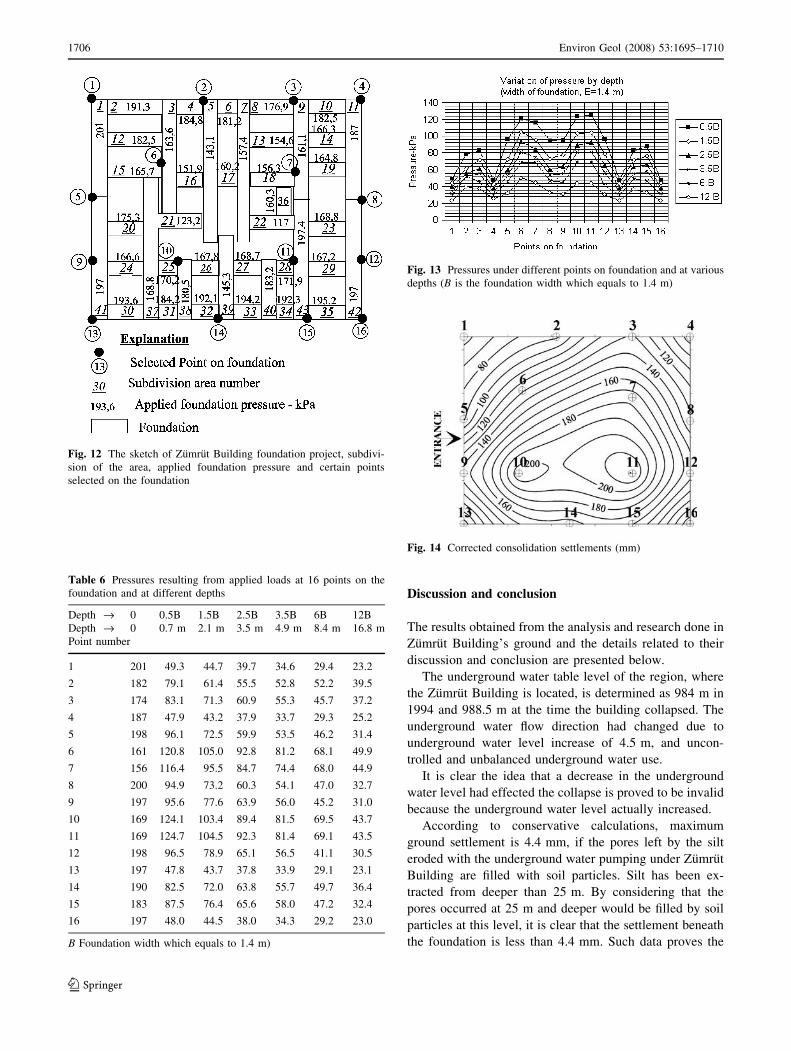
The loads used in calculating settlement and the stresses
that occurred because of these, were taken from the static
project (Fig. 12). The foundation area was divided into 43
divisions (Fig. 12). Over the 43 sub-areas, stresses oc-
curred under the foundation at 0.7 m (0.5B, where B is
width of foundation), 2.1 m (1.5B), 3.5 m (2.5B), 4.9 m
(3.5 B), 8.4 m (6B), and 16.8 m (12B) from the foundation
level were calculated at 16 points (points in circles) se-
lected on the whole foundation (Fig. 12). Stresses created
by the building load under the foundation within the
ground for different depths and different points are given in
Table 6 and Fig. 13.
Consolidation settlement was calculated at 16 points
selected on the foundation. In consolidation calculations,
laboratory test data of the samples taken from the borehole
closest to the calculation point was used. In other words,
laboratory test results of the samples taken from BH1 for
the points 3, 4, 7, 8, from BH2 for the points 1, 2, 5, 6, from
BH3 for the points 9, 10, 13, 14, and from BH4 for the
points 11, 12, 15, 16 were used. The consolidation calcu-Fig. 10 Distribution of the corrected SPT numbers (N¢) on the
Zumrut Building ground
Fig. 9 Variation of corrected
SPT numbers by depth
Table 2 Weighted averages of corrected SPT numbers on the
Zumrut building ground
Borehole Weighted average of
overburden pressure
correction done SPT
Numbers-Ncor
Weighted average of
overburden, energy and rod
length corrections done SPT
numbers-N¢
BH1 26 22.1
BH2 50 50
BH3 20.6 15.7
BH4 15.6 11.4
BH5 50 50
Table 3 Computed allowable bearing pressures (qa ) from field test
results
Borehole qa = 0,41Ncor(qa) (kN/m2)
(Budhu 2000)
qa = 10,5N¢ (kN/m2)
(Barnes 2000)
BH1 267 232
BH2 513 525
BH3 211 165
BH4 160 120
BH5 513 525
1704 Environ Geol (2008) 53:1695–1710
123
lations at a point, for sections closer to the surface from
levels closer to the surface, for deeper sections sample data
taken from deeper sections are used. For example, at point
1 from the section closer to the surface (up to 7.5 m depth),
ground sample was taken from the 6–6.5 m interval, and
for deeper sections (>7.5 m), from 9–9.5 m level ground
sample laboratory results were used. Compressible layer
thickness is taken as the building’s width. Consolidation
settlement calculations for point 1 are given in Table 7.
Calculated consolidation settlements were multiplied by
0.7 coefficient of correction (Tomlinson 1986) and cor-
rected consolidation settlements were determined. Calcu-
lated consolidation settlements are given altogether in
Table 8. Distribution of corrected consolidation settle-
ments under the foundation is given in Fig. 14.
Consolidation settlements under applied foundation
contact pressures and project soil allowable bearing
pressure (=171 kN/m2)
Soil settlement potential was calculated under applied
project foundation contact pressures and allowable soil
bearing pressure of Zumrut Building static project. The
ground under the foundation was divided vertically into 4
layers as 0–2 m, 2–4 m, 4–12 m, and 12–24 m for the
calculations. For the first two layers, consolidation test
data achieved from the sample closer to the surface is
used. For the following layers, data samples taken from
deeper parts were used. Ground settlements were calcu-
lated on the building corner points 1, 4, 13 and 16. In the
calculations, land and laboratory data of the samples ta-
ken from boreholes closer to these points were used. In
other words, at point 1 data taken from BH2, at point 4
from BH1, at point 13 from BH3 and at point 16 data
from BH4 were used. Calculations were done both under
project soil allowable bearing pressure (PAP) which is
171 kN/m2 pressure, and applied foundation contact
pressures in the project (APP) which are 201, 187, 197
and 197 kN/m2 for the points 1, 4, 13 and 16, respec-
tively. Calculated settlements were also corrected by
multiplying with 0.7. Elastic settlements (Se APP) under
APP at these points have already been defined (Table 5).
Again, elastic settlements (SeSAP) and consolidation set-
tlements (ScSAP) under suggested SAP which was defined
earlier as Zumrut Building soil allowable bearing pressure
(=120 kN/m2), and total settlements (STSAP) were calcu-
lated and given in Table 9.
Table 4 Computed allowable net bearing pressures (qa–net ) from
laboratory test results
Method-parameter Data
from
BH1
Data
from
BH2
Data
from
BH3
Data
from
BH4
Data
from
BH5
Unconsolidated
undrained
cohesion (cu)
(kN/m2)
99 54 133 34 68
Unit weight
(kN/m3)
19.5 19.6 18.6 19.1 19.1
Unconsolidated
undrained
internal friction
angle (/u) (o)
16 0 0 8 0 29 0 10 0
qa–net (from
Terzaghi’s
bearing capacity
equation)
(kN/m2)
574 188 103 417 253 1004 65 269 129
qa–net (from
Meyerhof’s
bearing capacity
equation)-kN/m2
740 286 156 553 384 1179 98 354 196
Table 5 Computed elastic settlements
Borehole Point Applied
pressure
(qs)
kN/m2
Cohesion
(kN/m2)
Elasticity
modulus
Eu = 500cu
kN/m2
Elastic
settlement
at center of
foundation (Si)
(mm) (Christian
and Carrier
1978)
BH1 4 187 104 26000 13
BH2 1 201 59 14750 24
BH3 13 197 133 33250 10
BH4 16 197 34 8500 40
BH5 � 6 197 68 17000 20
Fig. 11 Distribution of elastic settlements (mm) under Zumrut
Building corners
Environ Geol (2008) 53:1695–1710 1705
123
Discussion and conclusion
The results obtained from the analysis and research done in
Zumrut Building’s ground and the details related to their
discussion and conclusion are presented below.
The underground water table level of the region, where
the Zumrut Building is located, is determined as 984 m in
1994 and 988.5 m at the time the building collapsed. The
underground water flow direction had changed due to
underground water level increase of 4.5 m, and uncon-
trolled and unbalanced underground water use.
It is clear the idea that a decrease in the underground
water level had effected the collapse is proved to be invalid
because the underground water level actually increased.
According to conservative calculations, maximum
ground settlement is 4.4 mm, if the pores left by the silt
eroded with the underground water pumping under Zumrut
Building are filled with soil particles. Silt has been ex-
tracted from deeper than 25 m. By considering that the
pores occurred at 25 m and deeper would be filled by soil
particles at this level, it is clear that the settlement beneath
the foundation is less than 4.4 mm. Such data proves the
Fig. 12 The sketch of Zumrut Building foundation project, subdivi-
sion of the area, applied foundation pressure and certain points
selected on the foundation
Table 6 Pressures resulting from applied loads at 16 points on the
foundation and at different depths
Depth fi 0 0.5B 1.5B 2.5B 3.5B 6B 12B
Depth fi 0 0.7 m 2.1 m 3.5 m 4.9 m 8.4 m 16.8 m
Point number
1 201 49.3 44.7 39.7 34.6 29.4 23.2
2 182 79.1 61.4 55.5 52.8 52.2 39.5
3 174 83.1 71.3 60.9 55.3 45.7 37.2
4 187 47.9 43.2 37.9 33.7 29.3 25.2
5 198 96.1 72.5 59.9 53.5 46.2 31.4
6 161 120.8 105.0 92.8 81.2 68.1 49.9
7 156 116.4 95.5 84.7 74.4 68.0 44.9
8 200 94.9 73.2 60.3 54.1 47.0 32.7
9 197 95.6 77.6 63.9 56.0 45.2 31.0
10 169 124.1 103.4 89.4 81.5 69.5 43.7
11 169 124.7 104.5 92.3 81.4 69.1 43.5
12 198 96.5 78.9 65.1 56.5 41.1 30.5
13 197 47.8 43.7 37.8 33.9 29.1 23.1
14 190 82.5 72.0 63.8 55.7 49.7 36.4
15 183 87.5 76.4 65.6 58.0 47.2 32.4
16 197 48.0 44.5 38.0 34.3 29.2 23.0
B Foundation width which equals to 1.4 m)
Fig. 13 Pressures under different points on foundation and at various
depths (B is the foundation width which equals to 1.4 m)
Fig. 14 Corrected consolidation settlements (mm)
1706 Environ Geol (2008) 53:1695–1710
123
incorrectness of the thought claiming that erosion of silt
was effective in Zumrut Building collapse.
Konya city is built on Konya and Karahuyuk formation
composed of silty sand and gravel mixture presenting
lateral and vertical transitions in short distances. The
location of the Zumrut Building consists of low and med-
ium plasticity clay. From place to place high plasticity
levels can also be determined. The liquid limit is around
38–40% in general, where the plastic limit is 21%, and
natural water content is around the plastic limit. Water
saturation of the soil is more than 85%. The soil is hard in
general, but there are loose zones in between the layers. In
the soil, there are hard sections composed by inter linking
soil particles through carbonated cement. It is possible to
see these hard sections in the south–eastern corner of the
Zumrut Building. Swelling potential of the soil is low.
Internal friction angle of the soil is between 8� and 30�, and
cohesion changes between 34 and 127 kN/m2.
Soil weighted average SPT change between 11 and 50.
Low bearing capacity soil zone was determined between 9
and 12 m depth on especially the western corner of the
Zumrut Building. This depth range is between 10 and 18 m
in BH3, and between 10 and 20 m in BH4. On the northern
corner of the building, this soil zone starts from a deeper
section and continues sloping to the north. As it can be seen
by analysing Table 2, SPT decline in the Zumrut Building
foundation soil from south to north (Figs. 5, 9). High soil
SPT numbers on the south side of Zumrut Building show
that bearing capacity of the soil is high, settlement potential
is low, but on the northern side soil bearing capacity is
comparatively lower and settlement potential is higher.
It was found that net allowable bearing capacity of soil is
between 120 and 525 kN/m2 according to in situ tests, and
between 65 and 384 kN/m2 according to laboratory tests
results where the internal friction angle is accepted as 0�.
When the distribution of elastic settlement of the
Zumrut Building foundation base was analysed (Fig. 11); it
was determined that elastic settlement of the building was
40 mm at point 16 and 10 mm at point 13. The high dif-
ference in elastic settlements at points 16 and 13 may have
created tensile stresses between the related parts of the
building.
Fifty-six millimeters consolidation settlement potential
at point 1, and 221 mm at point 11 were determined by the
analysis of the Zumrut Building settlement potential map
determined under applied foundation contact pressures.
Besides, although it is not exactly known in what level
elastic and consolidation settlements are realised, the
existence of different settlement areas beneath the building
with approximately a fourfold difference were determined
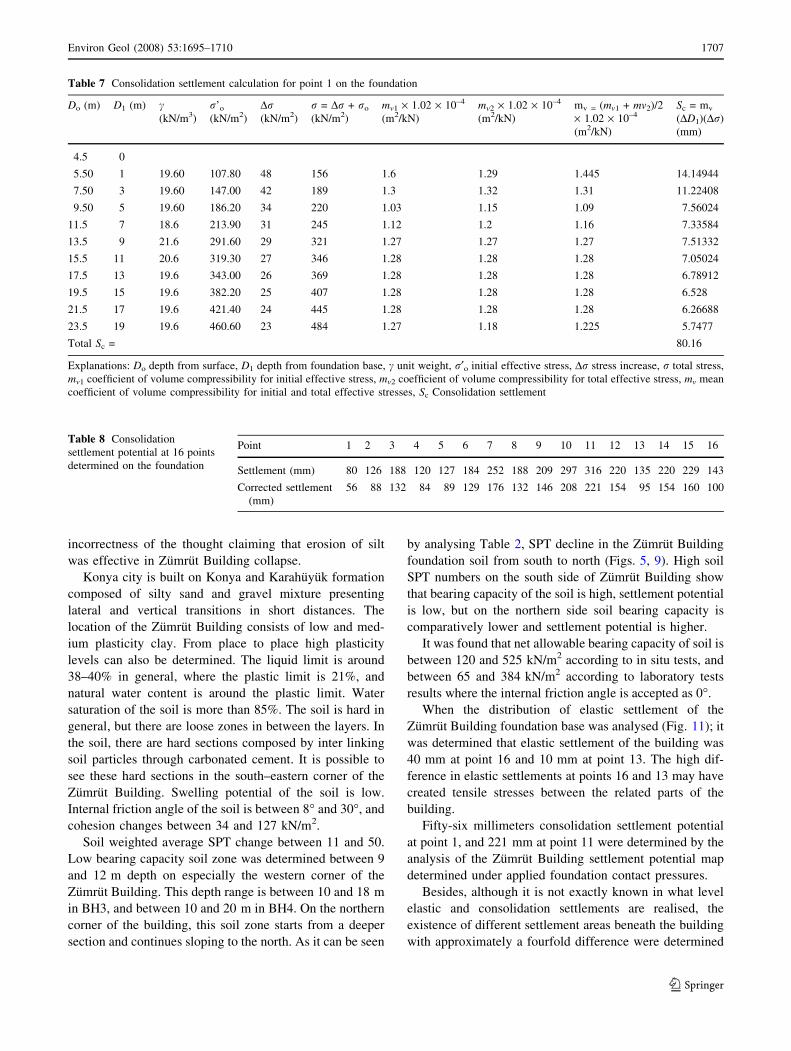
Table 7 Consolidation settlement calculation for point 1 on the foundation
Do (m) D1 (m) c(kN/m3)
r’o
(kN/m2)
Dr(kN/m2)
r = Dr + ro
(kN/m2)
mv1 · 1.02 · 10–4
(m2/kN)
mv2 · 1.02 · 10–4
(m2/kN)
mv = (mv1 + mv2)/2
· 1.02 · 10–4
(m2/kN)
Sc = mv
(DD1)(Dr)
(mm)
4.5 0
5.50 1 19.60 107.80 48 156 1.6 1.29 1.445 14.14944
7.50 3 19.60 147.00 42 189 1.3 1.32 1.31 11.22408
9.50 5 19.60 186.20 34 220 1.03 1.15 1.09 7.56024
11.5 7 18.6 213.90 31 245 1.12 1.2 1.16 7.33584
13.5 9 21.6 291.60 29 321 1.27 1.27 1.27 7.51332
15.5 11 20.6 319.30 27 346 1.28 1.28 1.28 7.05024
17.5 13 19.6 343.00 26 369 1.28 1.28 1.28 6.78912
19.5 15 19.6 382.20 25 407 1.28 1.28 1.28 6.528
21.5 17 19.6 421.40 24 445 1.28 1.28 1.28 6.26688
23.5 19 19.6 460.60 23 484 1.27 1.18 1.225 5.7477
Total Sc = 80.16
Explanations: Do depth from surface, D1 depth from foundation base, c unit weight, r¢o initial effective stress, Dr stress increase, r total stress,
mv1 coefficient of volume compressibility for initial effective stress, mv2 coefficient of volume compressibility for total effective stress, mv mean
coefficient of volume compressibility for initial and total effective stresses, Sc Consolidation settlement
Table 8 Consolidation
settlement potential at 16 points
determined on the foundation
Point 1 2 3 4 5 6 7 8 9 10 11 12 13 14 15 16
Settlement (mm) 80 126 188 120 127 184 252 188 209 297 316 220 135 220 229 143
Corrected settlement
(mm)
56 88 132 84 89 129 176 132 146 208 221 154 95 154 160 100
Environ Geol (2008) 53:1695–1710 1707
123
in terms of both elastic settlement values and consolidation
settlement values.
In buildings used for residential purposes, the suggested
allowable maximum settlement limits for the foundation
settlement on clay are 100 mm by Wahls (1981), 50–
100 mm by Sowers (1979) and Spigolon (2001), 63.5 mm
by Mac Donald and Skempton (1955), Bowles 1982) and
75 mm by Budhu (2000). In this work for foundations
settling in clay, the maximum settlement limit is accepted
to be 75 mm as suggested by Budhu (2000). When
potential consolidation settlements are added to the elastic
settlement, the building had settlement values that exceeded
acceptable tolerable settlement limits (Figs. 11, 14).
In terms of consolidation and elastic settlement values,
the settlements around the right rear of the building with
reference to the entrance are higher. SPT numbers are
relatively small in this area when compared to other parts
of the building.
On the other hand, different settlements beneath the
building exceeded the allowable limits. Between points 1
and 11, which were 25 m away from each other, the differ-
ence in corrected consolidation settlement values was
165 mm (Table 8). Between these two points angular dis-
tortion ratio was around 1/150. This ratio is the limit at which
the structural damage may occur in buildings (Wahls 1981).
On top of the consolidation settlements, when elastic set-
tlements in these two points were taken into consideration;
the total settlement at point 1 was determined as (24 + 56)
80 mm, and at point 11 became (28 + 221) 249 mm
(Fig. 11; Table 8). In this case, angular distortion ratio rose
up to (@249/25,000) 1/100. Under this angular distortion,
considerable structural deformation was expected to occur.
Corrected total settlements (ST PAP) determined con-
sidering 171 kN/m2 pressure which was assumed as the
PAP and used in the structural project reach at 59 mm at
point 4, and 84 mm at point 16. Again, under APP and at
the same points; settlements rose up to 65 and 92 mm.
Ninety-two and 84 mm settlement values were above the
allowable settlement limits in buildings.
Pressure measuring 171 kN/m2, was accepted as soil
allowable bearing pressure in the static project, but, this
does not satisfy the settlement limits. Because of this,
171 kN/m2 pressure defined as soil allowable bearing
pressure is incorrect.
It was determined that the ground settlement amount
towards the right rear direction with reference to the
Zumrut Building entrance and the different settlements
between the right rear area and the rest of the foundation
area exceed the allowable distortion limits. After the
application of building loads, 90% of the settlements of the
ground occurred within 5 years, and 98% within 10 years
period, and then, the collapse of the building occurred.
In this study, the settlements were calculated separately
for 171 kN/m2 which is the accepted soil allowable bearing
pressures in the project, 187–201 kN/m2 which are the
calculated foundation contact pressures from the project,
and 120 kN/m2 which is the allowable soil bearing pressure
determined through laboratory and in-situ tests. If the set-
tlements were calculated using 120 kN/m2, consolidation
settlements would be 18 mm at point 1, and 37 mm at
point 13 (Table 9). Under the same pressure, elastic set-
tlements would be 6 mm at point 13, and 24 mm at point
16. In addition, total settlements (ST SAP) would be 32 mm
at point 1, and 56 mm at point 16. As can be seen, the
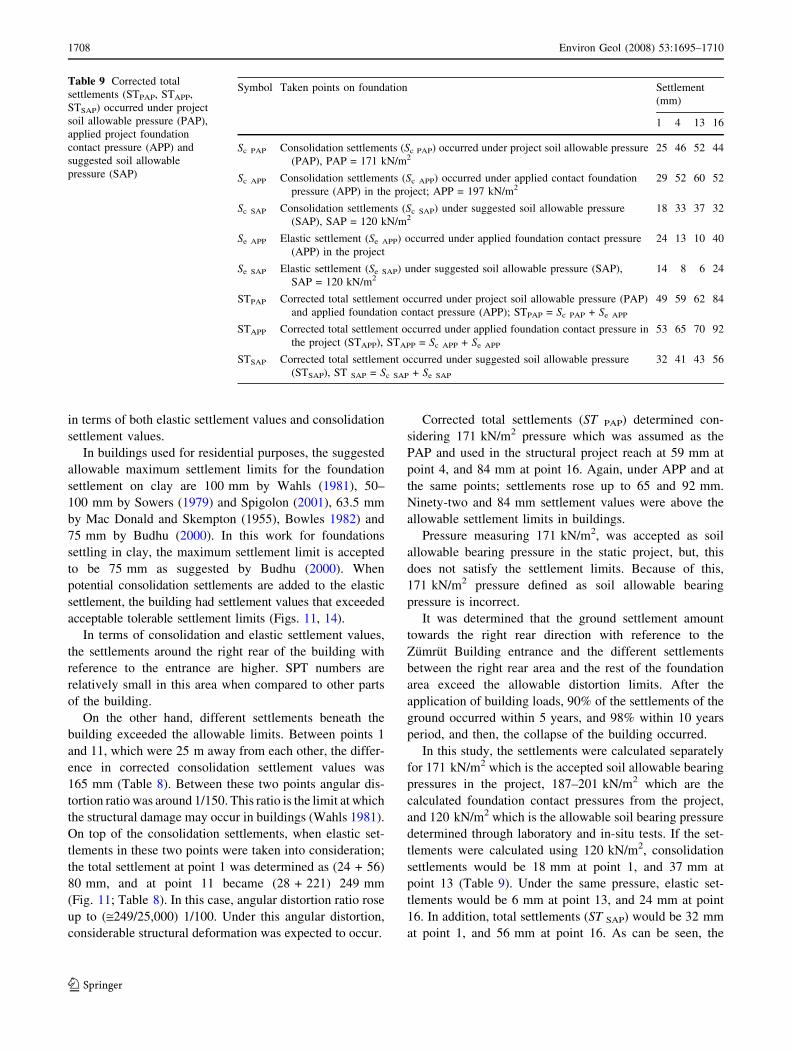
Table 9 Corrected total
settlements (STPAP, STAPP,
STSAP) occurred under project
soil allowable pressure (PAP),
applied project foundation
contact pressure (APP) and
suggested soil allowable
pressure (SAP)
Symbol Taken points on foundation Settlement
(mm)
1 4 13 16
Sc PAP Consolidation settlements (Sc PAP) occurred under project soil allowable pressure
(PAP), PAP = 171 kN/m225 46 52 44
Sc APP Consolidation settlements (Sc APP) occurred under applied contact foundation
pressure (APP) in the project; APP = 197 kN/m229 52 60 52
Sc SAP Consolidation settlements (Sc SAP) under suggested soil allowable pressure
(SAP), SAP = 120 kN/m218 33 37 32
Se APP Elastic settlement (Se APP) occurred under applied foundation contact pressure
(APP) in the project
24 13 10 40
Se SAP Elastic settlement (Se SAP) under suggested soil allowable pressure (SAP),
SAP = 120 kN/m214 8 6 24
STPAP Corrected total settlement occurred under project soil allowable pressure (PAP)
and applied foundation contact pressure (APP); STPAP = Sc PAP + Se APP
49 59 62 84
STAPP Corrected total settlement occurred under applied foundation contact pressure in
the project (STAPP), STAPP = Sc APP + Se APP
53 65 70 92
STSAP Corrected total settlement occurred under suggested soil allowable pressure
(STSAP), ST SAP = Sc SAP + Se SAP
32 41 43 56
1708 Environ Geol (2008) 53:1695–1710
123
settlements and different settlements are less than the
allowable settlement and different settlement limits under
120 kN/m2 soil allowable bearing pressure. If this soil
allowable bearing pressure had been considered during the
design of Zumrut Building, there would have been no
problem with the settlements.
Based on the given information in the project, on the
Zumrut Building foundation, the soil ultimate bearing
capacity was not exceeded. However, the factor of safety
considered in the design was not satisfied. In other words, a
building with a lower safety level was constructed. Ground
settlement was at a level that could produce structural and
architectural damage to the building. Settlements are den-
ser under point 11 at Zumrut Building settlement area.
There exist low strength soil zones at 8–12 m depth on
the western part of the Zumrut Building, and at 10–20 m
depth on the northern and northwestern part when compared
to other parts. This situation shows that the building was
constructed on ground where one side has a higher bearing
capacity, lower settlement capacity and the other has a
relatively lower bearing capacity, higher settlement capac-
ity. It is a known fact that when a building is constructed on
ground with different strengths, different settlements and
thus, structural deformations may occur in the building.
It can be seen that Zumrut Building soil bearing capacity
and settlement characteristics show great variation and as a
result of this, there are different settlements in the building.
The settlements increase towards the right rear of the
building’s entrance. This is the direction that the building
collapsed_Ibrahim Pocanoglu, who actively participated in the
construction phase and resided in the building untill its
collapse, in his statement to the police said ‘‘wall plaster
had been falling down since the completion of construc-
tion’’. The other residents said that tiles had been falling
off since the date they moved in and there had been cracks
in the building. These statements prove that there had been
a continuous deformation in the building. This deformation
in the building shows a strong resemblance to the defor-
mation caused by ground settlements. Furthermore, the
collapse occurred towards the right rear of the building so,
it can be concluded that the weak soil structure and
excessive settlements in this section contributed to the
collapse. Due to different settlements on the ground, a
significant amount of bending takes place in structures with
high strength, and structures with low strength usually
collapse. Thus, total collapse of Zumrut Building can also
be attributed to its weakness.
On either sides of Zumrut Building, Safir and Yakut
buildings have the same number of stories and similar
dimensions. After the collapse of Zumrut Building, suspi-
cions arose about the leaning of the Safir and Yakut
buildings. The situation of Safir and Yakut buildings was
analysed by a commission comprising architects, a civil
engineer, a geology engineer and a geodesy-photogram-
metry engineer. The measurements done in the buildings
through geodesic methods, showed that the corners of the
buildings were not vertical. According to the geology and
civil engineers analysis, for a safe use of these buildings;
rehabilitation and strengthening studies were suggested.
Currently, these buildings are being strengthened by
engineers.
In the appendix of the Zumrut Building static project, a
loading-settlement chart related to allowable soil bearing
pressure existed and was used in the analysis. Issues like;
‘‘Was the plate-loading test done, to what depth was it
done, at how many locations, and how was the underlying
soil structure?’’ were insufficiently analysed. It was found
out that the ground investigation for the building was not
done, the documents on soil allowable pressure in the
project do not represent reality, and were prepared hypo-
thetically without any on-site research or analysis. These
facts were known to the project engineers and managers of
the related chambers of profession who approved the
projects, and administrators and technical personnel of the
local authority.
Previous warnings on this issue; ‘‘Ground characteristics
of the settled area of Konya represent a large variance in
horizontal and vertical distances. It must not be forgotten that
without making local ground investigations and determining
soil characteristics, those undertaking construction projects
and making general assumptions, construction engineers,
local authorities inspecting these, and any other technical
personnel taking part in this chain will all be responsible for
life and property losses (Ozdemir and Akbulut 1999)’’; were
not taken into consideration.
The Zumrut Building collapsed as a result of a chain of
mistakes made at different phases from the geotechnical,
structural and reinforced concrete project design phases to
the final construction phase with different contribution ra-
tios. Therefore, the collapse of the Zumrut Building was
due to a failure to apply engineering principles and this
mistake resulted in 92 fatalities and 35 injuries and
approximately US$7 million of material loss.
References
Barnes G (2000) Soil mechanics principles and practice. Macmillan,
New York, p 492
Bowles JE (1982) Foundation analysis and design. McGraw-Hill,
New York, p 816
Budhu M (2000) Soil mechanics and foundations. Wiley New York,
p 568
Chen FH (1999) Soil engineering testing and remedation. CRC Press,
London, p 288
Christian JT, Carrier WD (1978) Janbu, Bjerrum and Kjaernsli’s chart
reinterpreted. Can Geotech J 15:123–128
Environ Geol (2008) 53:1695–1710 1709
123

Craig RF (1990) Soil mechanics. Chapman & Hall, London, p 410
Das BM (2000) Fundamentals of geotechnical engineering. Brooks-
Cole, Belmont p 593
Liao SSC, Whitman RV (1985) Overburden correction factors for
SPT in sand. J Geotech Eng Div ASCE 112(3):373–377
Meyerhof GG (1965) Shallow foundations. J Soil Mech Found, Div.
ASCE 91(SM2):21–31
Nalbantcılar MT, Nalvuran MK, Aslan AF (2005) Apartman altı
kuyulardan saglanan suların zeminden katı tane cekmesi
(Solid particle erosion by groundwater pumping from wells
beneath buildings). Yer Bilimi ve Teknigi Dergisi, 2 28–29s,
Konya
O’Neil MW, Poormoayed N (1980) Methodology for foundations on
expansive clays. J Geotech Eng Div ASCE 106:1345–1367
Ozdemir A, Akbulut _I (1999) Konya formasyonunun jeoteknik
ozellikleri (Geotechnical properties of Konya formation),
Yerbilimleri/Geosound 34:89–105s, Adana
Skempton AW (1986) Standard penetration test procedures and the
effects in sands of overburden pressure, relative density, particle
size, ageing and over consolidation. Geotechnique 36(3):425–447
Sowers GF (1979) Introductory soil mechanics and foundations.
Geotechnical engineering, 4th edn. Mac Millan, New York
Spigolon SJ (2001) Geotechnical engineering, civil engineering PE
exam depth guide. McGraw-Hill, New York
Tomlinson MJ (1986) Foundation design and construction, 5th edn.
Longman, London, p 270
Whals HE (1981) Tolerable settlement of buildings. J Geotech Eng
Div ASCE 107(No GT11):1489–1504
1710 Environ Geol (2008) 53:1695–1710
123


![arXiv:1903.07762v4 [physics.soc-ph] 30 Apr 2020 · ict pro les collapse over a range of scales. Duration, diameter, extent, fatalities, and report totals satisfy mutually consistent](https://img.pdfslide.us/doc/110x75/5f862b7e97c51019627db246/arxiv190307762v4-30-apr-2020-ict-pro-les-collapse-over-a-range-of-scales.jpg)