Embed Size (px)
Citation preview

A Genetic Algorithm-Based Approach for Building Accurate Decision Trees
by
Z. Fu, Fannie MaeZ. Fu, Fannie Mae
Bruce Golden, University of MarylandBruce Golden, University of Maryland
S. Lele, University of MarylandS. Lele, University of Maryland
S. Raghavan, University of MarylandS. Raghavan, University of Maryland
Edward Wasil, American UniversityEdward Wasil, American University
Presented at INFORMS National Meeting Pittsburgh, November 2006

2
A Definition of Data Mining
Exploration and analysis of large quantities of data
By automatic or semi-automatic means
To discover meaningful patterns and rules
These patterns allow a company to
Better understand its customersImprove its marketing, sales, and customer support
operations

3
Data Mining Activities
Discussed in this sessionClassification
• Decision trees
Visualization• Discrete models• Sammon maps• Multidimensional scaling

4
Classification
Given a number of prespecified classes
Examine a new object, record, or individual and assign it, based on a model, to one of these classes
Examples
Which credit applicants are low, medium, high risk?Which hotel customers are likely, unlikely to return?Which residents are likely, unlikely to vote?

5
Background
A decision tree is a popular method for discovering meaningful patterns and classification rules in a data set
With very large data sets, it might be impractical, impossible, or time consuming to construct a decision tree using all of the data points
Idea: combine C4.5, statistical sampling, and genetic algorithms to generate decision trees of high quality
We call our approach GAIT- a Genetic Algorithm for Intelligent Trees

6
Flow Chart of GAIT
Partition random sample into subsets
Generate a tree foreach subset using C4.5
Createthe initial population
Select random sample of points from
original data set
EvolveSelectionCrossoverMutation
Evaluatefitness function
Results
Feasibility checkPrune

7
The initial population of trees is generated by C4.5 on the subsets from the partitioned random sample
Trees are randomly selected for the crossover and mutation operations, proportional to tree fitness
Fitness = the percentage of correctly classified observations in the scoring data set
Crossover and mutation are illustrated next
GAIT Terminology

8
Crossover Operations
Subtree-to-subtree Crossover
Parent 1
Child 2Child 1
Parent 2 Parent 2Parent 1
Child 2Child 1
Subtree-to-leaf Crossover

9
Mutation Operations
Subtree-to-subtree Mutation Subtree-to-leaf Mutation

10
Feasibility Check
x1<=5
x3>10 x3<=10
x1>3
x1<=5
x3>10 x3<=10
x2>7
x2>7
x2<=7
x2<=7
x1>5
x1<=3x1<=3x1<=3
x1>5
Before feasibility check After feasibility check

11
Pruning
Yes No
x3
NoYes
NoYes
x4
NoYes
NoYes
x5
Class B(5/1)
x1
Yes No
x4
NoYes
Class A(200/1)
Class B(5/1)
Before pruning After pruning
Class A(120/0)
Class A(120/0)
Class A(80/0)
Class B(1/0)
Class A(0/0)
Class A(120/0)
Number correctly classified/ number misclassified
x1
x2

12
Real-life marketing data set in transportation services industry
Approx. 440,000 customers with demographic and usage information
Key question: Do the customers reuse the firm’s services following a marketing promotion?
The goal, then, is to predict repeat customers
In the data set, 21.3% are repeat customers
Computational Experiments

13
We focused on 11 variables
We seek to identify customers who will respond positively to the promotion
The primary performance measure is the overall classification accuracy
We coded GAIT in Microsoft Visual C++ 5.0
Experiments were run on a Windows 95 PC with a 400 MHz Pentium II processor and 128 MB of RAM
Computational Experiments - - continued

14
Training set of 3,000 points
Scoring set of 1,500 points
Test set of 1,000 points
The test set is not available in the development of any classifiers
The combined size of the training and scoring sets is approx. 1% of the original data
We designed three different experiments
Experimental Design

15
Partition the 3,000 points in the training set into 50 subsets of 60 points each
From each subset, obtain a decision tree using C4.5
The GA runs for 10 generations
Save the best 50 trees at the end of each generation
The GAIT tree is the one with the highest fitness at the end
Finally, we computed the accuracy of the best GAIT tree on the test set
Experiment 1
16
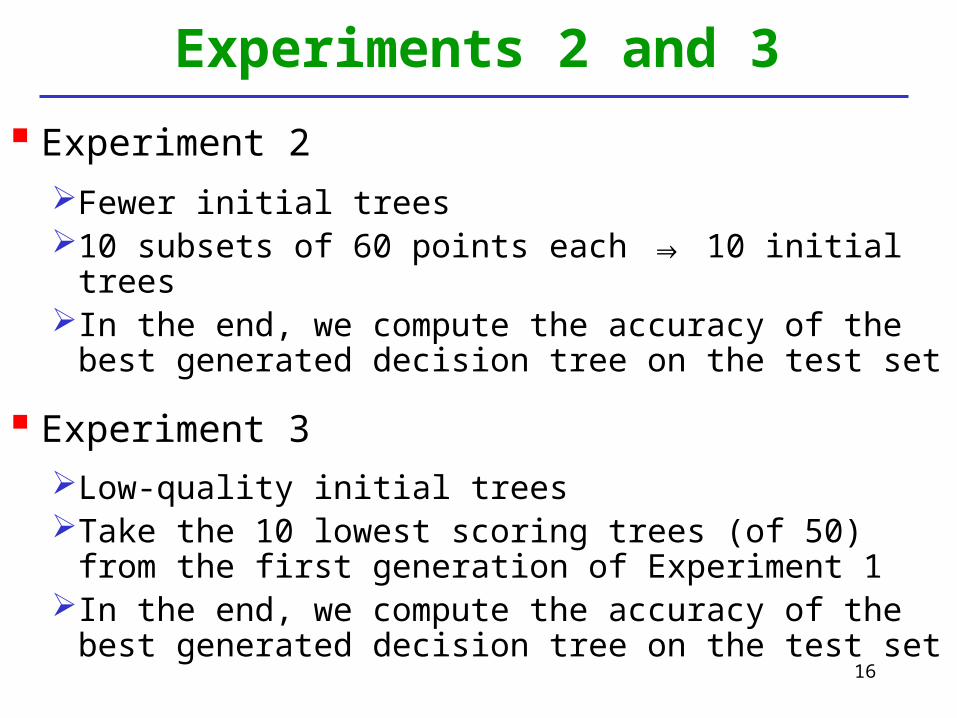
Experiments 2 and 3
Experiment 2
Fewer initial trees10 subsets of 60 points each ⇒ 10 initial treesIn the end, we compute the accuracy of the best
generated decision tree on the test set
Experiment 3
Low-quality initial treesTake the 10 lowest scoring trees (of 50) from the first
generation of Experiment 1In the end, we compute the accuracy of the best
generated decision tree on the test set

17
Details of Experiments
Two performance measures
Classification accuracy on the test setComputing time for training and scoring
Five different decision trees
Logistic Regression (SAS)Whole-TrainingBest-InitialAggregate InitialGAIT

18
The Whole-Training tree is the C4.5 tree generated from the entire training set
The Best-Initial tree is the best tree (w.r.t. scoring set) from the first generation of trees
The Aggregate-Initial classifier uses a majority voting rule from the first generation of trees
The GAIT tree is the result of our genetic algorithm
Decision Tree Classifiers

19
Classification Accuracy on the Test SetSize Method Experiment 1 Experiment 2 Experiment 3
500 Logistic Regression
Whole-Training
Best-Initial
Aggregate-Initial
GAIT
0.7563
0.7612
0.7525
0.7853
0.7903
0.7412
0.7491
0.7392
0.7784
0.7854
0.7228
0.7226
0.6767
0.7687
0.7787
1000 Logistic Regression
Whole-Training
Best-Initial
Aggregate-Initial
GAIT
0.7627
0.7595
0.7557
0.7849
0.7910
0.7432
0.7457
0.7394
0.7775
0.7853
0.7317
0.7316
0.6778
0.7661
0.7784
1500 Logistic Regression
Whole-Training
Best-Initial
Aggregate-Initial
GAIT
0.7598
0.7603
0.7527
0.7830
0.7898
0.7478
0.7495
0.7398
0.7790
0.7844
0.7305
0.7312
0.6791
0.7691
0.7756
Note: Average accuracy from ten replications. The left-most column gives the size of the scoring set.

20
Computing Time (in Seconds) for Training and Scoring
Size Method Experiment 1 Experiment 2 Experiment 3
500 Logistic Regression
Whole-Training
Best-Initial
Aggregate-Initial
GAIT
0.94
2.07
1.34
2.17
16.70
0.53
1.23
0.54
1.33
8.15
0.57
1.35
0.59
1.35
8.14
1000 Logistic Regression
Whole-Training
Best-Initial
Aggregate-Initial
GAIT
0.95
2.12
1.39
2.17
31.26
0.55
1.29
0.57
1.19
14.38
0.59
1.40
0.63
1.44
14.40
1500 Logistic Regression
Whole-Training
Best-Initial
Aggregate-Initial
GAIT
1.02
2.14
1.44
2.07
45.70
0.54
1.37
0.59
1.28
20.77
0.61
1.45
0.68
1.51
20.74
Note: Average time from ten replications. The left-most column gives the size of the scoring set.

21
In general, GAIT outperforms Aggregate-Initial which outperforms Whole-Training which outperforms Logistic Regression which outperforms Best-Initial
The improvement of GAIT over non-GAIT procedures is statistically significant in all three experiments
Regardless of where you start, GAIT produces highly accurate decision trees
We experimented with a second data set with approx. 50,000 observations and 14 demographic variables and the results were the same
Computational Results

22
We increase the size of the training and scoring sets while the size of the test set remains the same
Six combinations are used from the marketing data set
Scalability
Percent (%)
Size
Training Set Scoring Set
99
72
51
25
3
1
310,000
240,000
160,000
80,000
10,000
3,000
124,000
96,000
64,000
64,000
4,000
1,500

23
51 721 3 25 99
GAIT
Whole-Training
Logistic Regression
Best-Initial
75.00
76.00
77.00
78.00
79.00
80.00
81.00
82.00
Percentage (%) of Total Data Size
Cla
ssif
icat
ion
Acc
ura
cy (
%)
Classification Accuracy vs. Training/Scoring Set Size

24
1 51 72
GAIT
993 25
Best-Initial
Whole-Training
Logistic Regression
0.00
50.00
100.00
150.00
200.00
250.00
300.00
350.00
400.00
Percentage (%) of Total Data Size
Com
puting T
ime (
min
ute
s)
Computing Time for Training and Scoring

25
GAIT generates more accurate decision trees than Logistic Regression, Whole-Training, Aggregate-Initial, and Best-Initial
GAIT scales up reasonably well
GAIT (using only 3% of the data) outperforms Logistic Regression, Best-Initial, and Whole Training (using 99% of the data) and takes less computing time
Computational Results

26
GAIT generates high-quality decision trees
GAIT can be used effectively on very large data sets
The key to the success of GAIT seems to be the combined use of sampling, genetic algorithms, and C4.5 (a very fast decision-tree package from the machine-learning community)
References
INFORMS Journal on Computing, 15(1), 2003Operations Research, 51(6), 2003Computers & Operations Research, 33(11), 2006
Conclusions