Embed Size (px)
Citation preview

A Generation of Data: The General Social Survey, 1972-2002
Tom W. Smith
National Opinion Research Center University of Chicago
March, 2003
GSS Project Report No. 24
Overview
The National Data Program for the Social Sciences is a social indicators and data diffusion program. Its basic purposes are 1) to gather and disseminate data on contemporary American society in order to a) monitor and explain trends and constants in attitudes, behaviors, and attributes and b) examine the structure and functioning of society in general as well as the role played by various sub-groups; 2) to compare the United States to other societies in order to a) place American society in comparative perspective and b) develop cross-national models of human society; and 3) to make high quality data easily accessible to scholars, students, policy makers, and others with minimal cost and waiting.
These purposes are accomplished by the regular collection and distribution of the NORC General Social Survey (GSS) and its allied surveys in the International Social Survey Program (ISSP) . Both the GSS and the ISSP surveys have been efficiently collected, widely distributed, and extensively analyzed by social scientists around the world.
Since 1972 the GSS has conducted 24 independent cross- sectional surveys of the adult household population of the United States and in 1982 and 1987 carried out oversamples of Black Americans. Each year the data have been collected in February- April, coded and entered in March-May, and distributed to the user community along with appropriate software and documentation by the Fall. As Table 1 details, there have been a total of 42,991 respondents interviewed from the cross-sections, plus 707 Black respondents from the two oversamples.
While the population sampled has remained constant, transitional sample designs have been employed three times: in 1975-76 to calibrate the shift from the original block-quota sample to the full-probability design utilized since 1977, in 1983 when the 1970 NORC sample frame was compared with the new NORC sample frame based on the 1980 Census, and in 1993 when the 1980 NORC sample frame and the new 1990 NORC sample frame based on the 1990 Census were used. Since then, the 1990 sample frame has been employed. '
By using a strict, full-probability sample design, rigorous field efforts, and extensive quality control, the GSS produces a high-quality, representative sample of the adult population of the United States. The GSS response rate has generally been in the upper 70s, with a high in 1993 of 82.4%. This rate is higher than that achieved by other major social science surveys (the response rate for the American National Election Studies from 1990 to 1998 ranged from 63.9% to 74.0% and averaged 70%) and 30-40 percentage
'A sample frame based on the 2000 Census w i L l be integrated i n a simi Lar manner as soon as the data from the Census are available.

points higher than the industry average (Council for Marketing and Opinion Research, 1998; Steeh, et al., 1999). However, the GSS response rate has declined in recent years.
In order to accommodate more questions the GSS employs a questionnaire design under which most questions are asked of only a subset of respondents. From 1972 to 1987 that was accomplished with a rotation design under which questions appeared on two out of every three years. In 1988 the GSS switched from an across-survey rotation design to a split-ballot design. Under this design questions are asked every year, but only on two of three sub- samples. Over a three-year period, questions that would have appeared on two surveys with a total of 3,000 respondents (2 * 1,500) under the old rotation design, now appear on two-thirds sub- samples on all three surveys for a total of 3,000 respondents (3 * 1,000). This shift eliminated the problem of periodic gaps in the annual time series and facilitated time series analysis (Davis, Smith, and Marsden, 2001). With the shift to biennial, double surveys the split-ballot rotation minimizes the interval between observations.
Starting in 1994 GSS switched to a biennial, double sample design. In effect the 1994 GSS was two surveys in one with an A sample of 1,500 representing the "regularu 1994 GSS and a B sample of 1,500 representing the I1missingl1 1995 GSS . The double-sample design literally combines two separate GSS with distinct topical and ISSP modules into one field operation. (And similarly for the subsequent pairs of year.)
In almost all years the GSS has used split-ballots for numerous experiments. Experimental forms have seen especially extensive usage in recent years, with factorial vignettes used in the 1986 study of welfare support, 12 sub-samples employed for the 1989 occupational prestige study, 90 experimental versions of the mental health vignettes used in 1996, and six terminal-care vignettes in 1998.
Components
The GSS is divided into five components: 1) the replicating core, 2) topical modules, 3) cross-national modules, 4) experiments, and 5) reinterviews and follow-up studies. The replicating core takes up half of the interviewing time (45 minutes) and the topical, cross-national, and supplemental modules take up the other half (15 minutes for each module). Experiments are done within either the core or the modules and reinterviews and follow-up studies involve additional interviewing after the GSS has been completed.
i. ~eplicating Core
The replicating core consists of questions that regularly appear in surveys either as full-coverage items or on sub-samples. The content of the core are periodically reviewed by the PIS and Board of Overseers to insure that the content remains relevant and
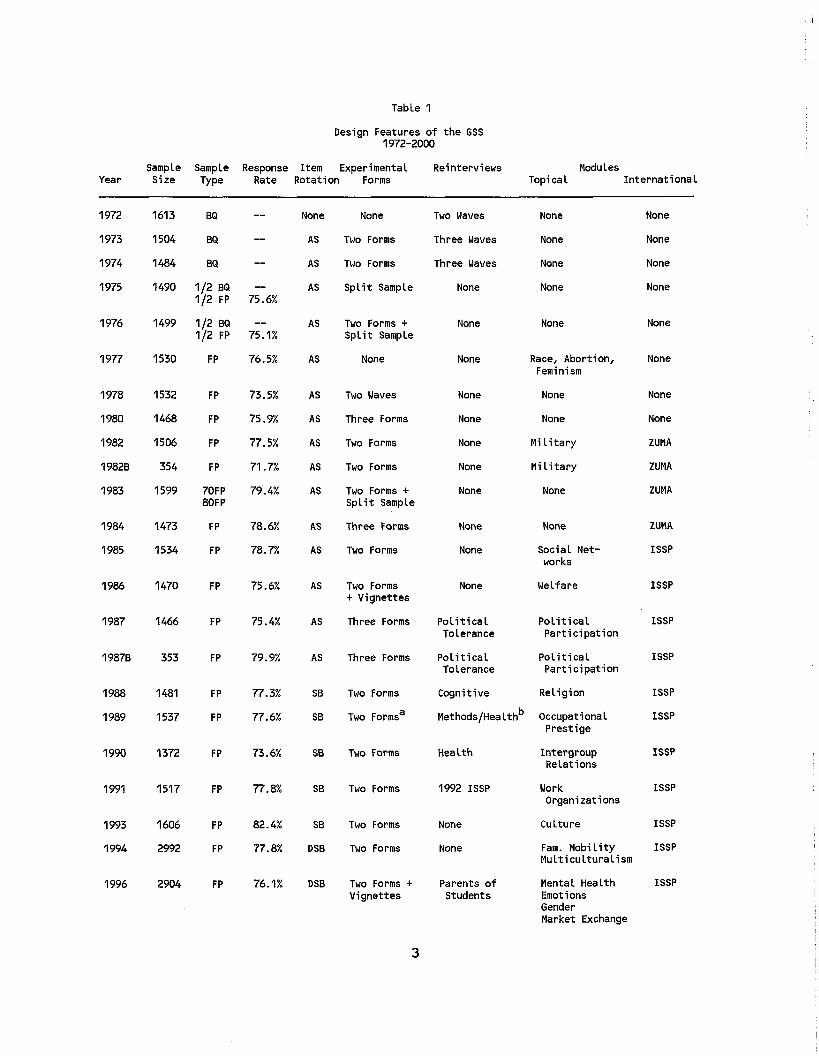
Table 1
Design Features o f the GSS 1972-2000
Sample Sample Size Type
Response Item Experimental Reinterviews Modules Rate Rotation Forms Topi ca 1 International Year
None
AS
AS
AS
None
Two Forms
Two Forms
Sp l i t Sample
Two Waves None None
None
None
None
Three Waves None
Three Waves None
None None
Two Forms + Sp l i t Sample
None None None
None Race, Abortion, Feminism
None None
Two Waves None None None
Three Forms None None None
ZUMA
ZUMA
ZUMA
None M i l i t a r y Two Forms
Two Forms None M i l i t a r y
Two Forms + Sp l i t Sample
None None
Three Forms None None ZUM A
I S S P None Social Net- works
Two Forms
None Welfare ISSP Two Forms + Vignettes
Po l i t i ca l Po l i t i ca l Tolerance Part icipation
ISSP Three Forms
Po l i t i ca l Po l i t i ca l Tolerance Part icipation
I S S P Three Forms
Cognitive Religion I S S P
I S S P
Two Forms
Two ~ o r m s ~ ~ e t h o d s l ~ e a l t h ~ Occupational Prestige
Two Forms Health Intergroup Relations
ISSP
Two Forms 1992 I S S P Work Organizations
ISSP
SB
DSB
Two Forms
Two Forms
None Culture ISSP
I S S P None Fam. Mobi l i ty Mult icultural ism
DSB Two Forms + Vignettes
Parents o f Mental Health Students Emotions
Gender Market Exchange
I S S P

Table 1 (continued)
Sample Sample Response Item Experimental Reinterviews Modules Year Size Type Rate Rotation Forms Topi ca 1 International
1998 2832 FP 75.6 DSB Two Forms+ Health Use Religion ISSP Vignettes & Knowledge Job Experiences
Health and Menta 1 Health
Medical Ethics Culture Inter-racia l Friendships
2000 2817 FP 70.0 DSB Two Forms Internet Use Religion I S S P Computers Multi-Ethnic Health Status Freedom
2002 2765 F P 70.1 DSB Two Forms Worker Health Altruism I S S P Internet Intergroup Relations
Quality o f work Worker pay Adulthood Doctors Mental Health The Arts
a b
For the Occupational Prestige module 12 subsamples were used. The 1990 Health Reinterview used 1989 and 1990 GSS respondents.
B=BLack oversample
BQ=Block quota sampling FP=FuLL probabi l i ty sampling
AS=Across-survey rotat ion SB=Split-ballot rotat ion DSB=Double sample, sp l i t -ba l lo t rotat ion
up-to-date. Currently the replicating core makes up about half of the overall lenqth of the GSS (about 45 of 90 minutes) and consists of about one- thlrd demographic questions and two- thirds attitudes and behaviors. The replicating core forms the basis for the trend analysis and pooling of cases for sub-group analysis.
The GSS is intentionally wide ranging in its contents with 3,836 variables in the 1972-2000 cumulative file. One can peruse the GSS Cumulative Codebook (Davis, Smith, and Marsden, 2001) or the on-line version of the codebook (www.icpsr.umich. edu/gss) to fully appreciate the scope of the GSS.
The GSS is different from most surveys in the wide variety of demographics included and the detail in which they are asked and coded. In addition to covering the standard background variables on the respondent's current status (e.g. race, age, sex, marital and labor force status), the GSS has extensive information on the respondent's family of origin and parental characteristics. Among the family of origin items are questions on the intactness of families (and reasons for "broken homesI1) , number of siblings,
religion, region, and community type. Additionally, parental variables include mother' s and father' s education, church attendance, occupation, and industry. There are also many questions about spouses including labor force involvement, occupation and industry, self-employment, education, religion, and church attendance. Respondent background variables are also quite extensive, covering not only the basics, but also such other areas as veteran's status, self-employment, home ownership, ethnicity, and divorce history.
In addition, questions are usually asked in a very detailed manner. For example, occupation and industry use both the Census three-digit classification codes and also the four-digit International Standard Classification of Occupations, age is based on date of birth, education codes both number of years in school and highest degree obtained, and up to three ethnic and racial identifications are coded.
The GSS has included detailed household composition variables on the age, gender, marital status, and relationship to head of household of all household members from 1975 to the present. On the 2000 GSS these were further expanded to ascertain the precise status of children living in complex family situations (e.g. biological or step children).
Besides the demographics, the core items cover a variety of behaviors, personal evaluations, and attitudes about central social and political issues from death (e.g. capital punishment, suicide, euthanasia) to taxes (as a redistribution measure, paying too much?). Among the many topics covered are abortion, civil liberties, confidence in institutions, crime and punishment, government spending priorities, poverty and inequality, race and ethnic relations, religion, and women's rights.
ii. Topical Modules
Topical modules (special sections on a particular theme) first appeared in 1977 and have been an annual feature since 1984. The topical modules are designed to facilitate both innovation and greater depth. They introduce new topics not previously investigated by the GSS and cover existing topics in greater detail with more fully specified models. It usually takes about two years to develop a topical module. The original concept for a module may come from the principal investigators (PIS), the Board of Overseers, or other interested scholars. Possible themes are assigned to Board sub-committees consisting of the PIS and both Board and non-Board specialists. These committees consult widely with scholars in the field. They then develop a module and present it to the Board for approval. It is then pretested during the Summer prior to its scheduled inclusion. The themes covered and the design committees involved in each module are listed in Table 2.
The 1985 social networks module locates the respondent in a web of social ties. Respondents are first asked to name people they have discussed important, personal matters with and then asked about their intimates including relationships to the respondent and

Table 2
Topical Modules
Year
1977
1982
1984
1985
1986
Theme
Extending scales on Race, Abortion, and Feminism
Att i tudes on the M i l i t a r y and M i l i t a r y Recruitment
Att i tudes on the M i l i t a r y and M i l i t a r y Recruitment
Social Networks
Development Committee
Arthur stinchcombea
James Davis b
James Davis b
Ronald Burt
Factorial Vignettes on Welfare Peter Rossi, Richard Berk, Gregory Duncan, Karen Mason
Socio-Political Part icipation (Part ia l repl icat ion of 1967 Verba-Nie Study of Po l i t i ca l Part icipation)
Religion
David Knoke, Thomas Gutterbock, Lawrence ~ o b o ~
Duane ALwin, Andrew Greeley, Wade Clark Roof
Occupational Prestige (Part ia l R Lication of 1963-65 Prestige Study) bP
Robert Hodge6 Judith Tanur Kei ko Nakao
Intergroup Relations Lawrence Bobo, Mary Jackman, James Kluegel, John Shelton Reed, Howard Schuman, A. Wade Smith
Work Organizations James Kluegel, Arne Kalleberg, David Kn ke, Peter Marsden, 8 Joe Spaeth
Culture Judith Blau, Paul DiMaggio, Pete Peterson, Peter Marsden, Ann Swidler
Robert Hauser, Robert h are^ Fami Ly Mobi li t y
Mult icultural ism
Emotions
David Sears, Jack C i t r i n
Lynn Smith-Lovin, Theodore Kemper, Catherine Ross, John Mirowsky, Robert Sutton, Wendy Rahn, Gerald Clore
Mental Health Bruce Link, Bernice Pescosolido, Carol Boyer, W i l l iam Gronfein, Pamela Braboy Jackson, John Monahan, Jo Phelan, Brian Powell, Ann Stueve, Ralph swindleh
Market ExchangeIGiving & Volunteering Paul DiMaggio, Glenn Firebaugh, Mark Granovetter, Daniel Kahneman, . Viviana Zelizer, Tom W. smith1
Gender Karen Campbell, Peter Marsden, Kathleen Gerson, Mary Jackman, Michael Kimmel, Barbara Reskin, Lynn Smith-Lovin
Medical Care Bernice Pescosolido, Carol Boyer, Thomas Croghan, Catherine Melfi,

Table 2 (continued)
Year - 1998/2000
Theme
Medical Care (continued)
Medical Ethics
Religion
Religion and Health
Culture
Job Experiences
Inter-racia l Friendships
Multi-Ethnic United States
Information Society
Development Committee
Michael Morgan, Fred Hafferty, John Kasten, Keri Lubell, Peter Marsden, David Mechanic, Mark schlesingerJ
Bernice Pescosolido, David Phil l ips, Carol Boyer, Roger Dworkin, Meg Gaffney, Greg Gramalsp$cher, Peter Marsden, David Smith, Frank V i lardo
Michael Hout, Mark Chaves, Tom W. Smith, Christopher Ellison, Robert Wuthnow, Michele Dillon, Christian Smith, Larry Iannaccone, Dan Olson
David Williams, Christopher Ellison, Linda George, El len Idler, Neal Krause, Jeff Levin, Kenneth Pargament, Lynda Powel lm
Peter Marsden, Robert Wuthnow, Paul ~i ~ a ~ ~ i o "
Tony Tam, Peter Marsden, Stanley Presser, Arne Kalleberg, Tom W . smith0
Tom W. Smith, Ken Rasinski
Richard Alba, Larry Bobo, Jennifer Hochschild, Mary Jackman, Barbara Reskin, Rueben Rumbaut, Tom W. smithP
John Robinson, Paul DiMaggio, Peter ~ a r s d e n ~
Freedom Orlando Patterson, Peter ~ a r s d e n ~
Religion Andrew M. Greeley, Michael Emerson, David Sikkink, Rodney Stark, Dean R. ~ o ~ e '
Health Status Bernice Pescosolido t
Child Stigma Bernice ~escoso l i do~
Qual i ty of Working L i f e National I ns t i t u te f o r Occupational Safety & ~ e a l t h '
Employee Compensation Joseph Blasi
Part icipation i n the Arts Peter V. MarsdenV
Altruism Tom W. Smith, Kenneth A. asi in ski'
Prejudice Bernadette parkX
Doctors and Patients Wendy ~ e v i n s o n ~
Transition t o Adulthood Ruben Rumbaut, Frank Furstenberg, Connie ~ l a n a ~ a n '
Information Society John Robinson, Paul ~ i ~ a ~ ~ i o ~ ~
This data col lect ion was supported by a grant t o Stinchcombe from the National Science Foundation (NSF) . The 1982 and 1984 data col lections were supported by a grant t o Davis from the Ford Foundation.
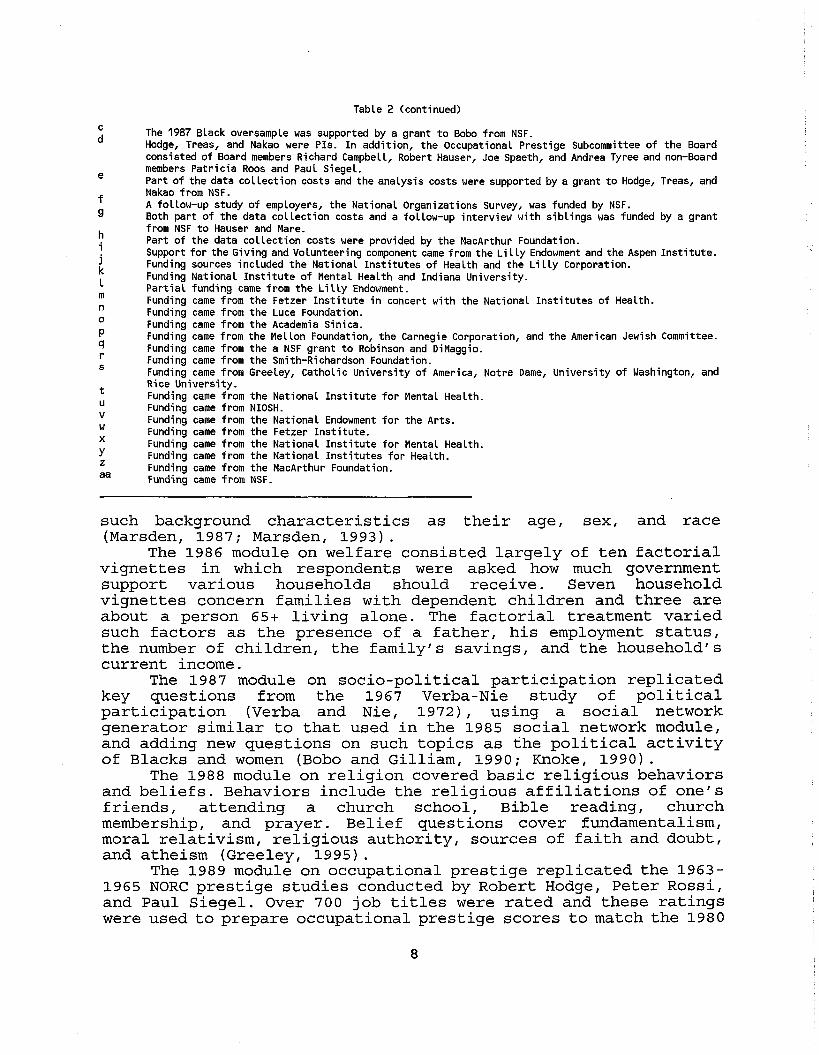
Table 2 (continued)
The 1987 Black oversample was supported by a grant t o Bobo from NSF. Hodge, Treas, and Nakao were PIS. I n addition, the Occupational Prestige Subcommittee of the Board consisted of Board members Richard Campbell, Robert Hauser, Joe Spaeth, and Andrea Tyree and non-Board members Patr ic ia Roos and Paul Siegel. Part of the data col lect ion costs and the analysis costs were supported by a grant t o Hodge, Treas, and Nakao from NSF. A follow-up study o f employers, the National Organizations Survey, was funded by NSF. Both part of the data col lect ion costs and a follow-up interview with sibl ings was funded by a grant from NSF t o Hauser and Mare. Part of the data col lect ion costs were provided by the MacArthur Foundation. Support f o r the Giving and Volunteering component came from the L i l l y Endowment and the Aspen Ins t i tu te . Funding sources included the National Ins t i tu tes of Health and the L i l l y Corporation. Funding National I ns t i t u te of Mental Health and Indiana University. Par t ia l funding came from the L i l l y Endowment. Funding came from the Fetzer I ns t i t u te i n concert with the National Ins t i tu tes of Health. Funding came from the Luce Foundation. Funding came from the Academia Sinica. Funding came from the Mellon Foundation, the Carnegie Corporation, and the American Jewish Committee. Funding came from the a NSF grant t o Robinson and DiMaggio. Funding came from the Smith-Richardson Foundation. Funding came from Greeley, Catholic University of America, Notre Dame, University o f Washington, and Rice University. Funding came from the National I ns t i t u te f o r Mental Health. Funding came from NIOSH. Funding came from the National Endowment f o r the Arts. Funding came from the Fetzer Ins t i tu te . Funding came from the National I ns t i t u te f o r Mental Health. Funding came from the National Ins t i tu tes fo r Health. Funding came from the MacArthur Foundation. Funding came from NSF.
such background characteristics as their age, sex, and race (Marsden, 1987; Marsden, 1993).
The 1986 module on welfare consisted largely of ten factorial vignettes in which respondents were asked how much government support various households should receive. Seven household vignettes concern families with dependent children and three are about a person 65+ living alone. The factorial treatment varied such factors as the presence of a father, his employment status, the number of children, the family's savings, and the household's current income.
The 1987 module on socio-political participation replicated key questions from the 1967 Verba-Nie study of political participation (Verba and Nie, 1972), using a social network generator similar to that used in the 1985 social network module, and adding new questions on such topics as the political activity of Blacks and women (Bobo and Gilliam, 1990; Knoke, 1990).
The 1988 module on religion covered basic religious behaviors and beliefs. Behaviors include the religious affiliations of one's friends, attending a church school, Bible reading, church membership, and prayer. Belief questions cover fundamentalism, moral relativism, religious authority, sources of faith and doubt, and atheism (Greeley, 1995).
The 1989 module on occupational prestige replicated the 1963- 1965 NORC prestige studies conducted by Robert Hodge, Peter Rossi, and Paul Siegel. Over 700 job titles were rated and these ratings were used to prepare occupational prestige scores to match the 1980

Census occupation codes (Nakao, Hodge, and Treas, 1990; Nakao and Treas, 1994). In addition, these new prestige codes were released on the 1972-1991 cumulative file. NORC's earlier study of ethnic prestige was also replicated (Smith, 1994a).
The 1990 module on intergroup relations examined ethnic stereotyping, social distance, and affirmative action. It also explored the links between authoritarianism and racism and between egalitarianism and racism (Smith, 1990a; Bobo and Kluegel, 1991).
The 1991 module on work organizations investigated both the general role of employers in society as well as the role of employed respondents within their work organizations. Issues covered include genetic employment screening, finding jobs, promotions, fringe benefits, labor-management relations, supervision and control over one's work, employee evaluations, and productivity. In addition, a list of employers was compiled to form a master sample of employers for a follow-up NSF study of these organizations (See Reinterviews and Follow-Ups below) (Marsden, Kalleberg, and Cook, 1993; Kalleberg and Marsden, 1993; Kalleberg, Knoke, Marsden, and Spaeth, 1996) .
The 1993 module on culture used measures of participation in cultural and leisure time activities and musical preferences to delineate lifestyle classes. It also explored support for central social values such as egalitarianism vs. freedom, conformity vs. tolerance of diversity, and beliefs about opportunity. In addition, it looked at the role of area of education (favorite high school class and college major) in shaping attitudes and at collective memory (Marsden and Swingle, 1994).
The 1994 module on family mobility reconceptualized social mobility as a family-level process rather than solely an individual process (Warren, 1998; Mare and Chang, 1998). In addition, to the standard information on respondent's education and occupation and that of respondent's father, information was collected on respondent, both parents, brothers and sisters, spouses and former spouses, parents-in-law, and children. This allows mobility to be examined across the family unit and for three generations. Besides the detailed demographic and socio-economic data respondents were also given a measure of verbal ability. A random sibling was selected for a follow-up interview conducted by the University of Wisconsin (See Reinterviews and Follow-Ups below).
The 1994 module on multiculturalism examined the issues of national identity, pluralism, egalitarianism, and tolerance. It included measures of patriotism and American identity, sub-group identity, assimilation, bilingualism, group rights and proportional group representation, immigration, attitudes towards and stereotypes about Blacks, Asians, and Hispanics, affirmative action, authoritarianism, and economic insecurity (Citrin, Sears, Muste, and Wong, 1995; Sears, Citrin, van Laar, 1995).
The 1996 module on gender covers the following aspects: 1) cohabitation and interest in marriage, 2) work place discrimination, 3) affirmative action policies, 4) sexual harassment, 5) preferred types of partnerships (e.g. traditional vs. modern, dependent vs. independent), 6) household division of

labor, 7) self-evaluations of success in balancing work and family roles, 8) pressures and sacrifices that conflicts between work and family roles have caused, 9) employer policies to help people cope with work and family responsibilities, 10) assessments of whom benefits and whom is harmed by the traditional pattern of men working and women taking care of the home and family, 11) judgments about why women are paid less than men and why women are more likely than men to care for children, 12) childbearing decisions, and 13) feminism and its impact on various social groups such as female homemakers, women in management and the professions, children, and men.
The 1996 emotions module includes 1) an inventory of 19 recent emotional experiences including happiness, sadness, anxiety, anger, and embarrassment, 2 ) emotional expression or suppression, 3 ) locus of control, 4) detailed report on a recent episode of anger, including the object of the anger, its intensity and duration, coping strategies, perceived blame, etc., and 5) emotional attachment to the country, including the importance of national identity and worry, hopefulness, and anger toward the country (Campbell and Smith-Lovin, 1997).
The 1996 market exchange module covers a variety of topics including 1) the social embededness of economic transactions and preferences for conducting economic exchanges with friends and relatives as opposed to others, 2) employment in family businesses, 3) loans between private individuals, 4) the informal economy, 5) non-market transactions (e.g. organ transplants, adoptions, surrogate mothers), 6) social justice and inequality (e.g. income redistribution), and 7) economic decision making within households. The related giving and volunteering module includes detailed reports of hours of volunteer work and cash and non-cash contributions to 15 types of organizations (e-g. environment, religious, educational) and charitytowards individuals rather than organizations (DiMaggio and ouch, 1998).
The 1996 mental health module investigates attitudes towards and experiences with mental health. It replicates key items from Shirley Starr's classic 1950 study of mental health, includes rich open-ended questions describing personal experiences, and uses randomized vignettes to examine public assessment of archetypical cases of mental illness. The module contains questions on the following topics: 1) self-reports of ways of dealing with personal problems and unhappiness, 2) vignettes about people with standard symptoms of various mental illnesses such as alcohol dependence, major depression, and schizophrenia. (People assess the seriousness, causes, and nature of the described cases, willingness to associate with these people, recommended steps to solve the problem, compulsory treatment, and related matters.), 3) support for public spending for mental health, 4) definitions of mental illness and nervous breakdown, 5) knowing someone with a mental illness or seeing a therapist, and 6) personal experience with mental health problems, including how the person felt and what steps were taken to deal with the problem (Surgeon General, 1999; Link, et al., 1999) .

The 1998 religion module consists of four parts: 1) collecting information on the congregations where people attended church to construct a sample frame for the National Congregations Study (Chaves, Konieczny, Beyerlein, and Barman, 1999), 2) examining the relationship between physical and mental health and various religious beliefs and behaviors, 3) replication of key elements of the 1988 religion module to study secularization and other religious change, and 4) expanding knowledge on various activities such as religious and non-religious charitable giving and volunteering, the process of searching for a religious faith and congregation, and religious schooling.
The 1998 health and mental health module focused on 1) attitudes toward the use of psychiatric medicine, 2) attitudes about the use of such by children, 3) willingness to personally consider using such medicine, 4) past mental health treatment, 5) use of psychiatric medications, 6) health insurance, 7) selecting medical providers, 8) evaluations of HMOs, and 9) assessments of doctors (Phelan, et al., 2000) .
The 1998 medical ethics module focused on end-of-life decisions. It asked whether people 1) had ever been involved in such matters, 2) the concerns people have about terminal illnesses (e.g. pain, financial matters, family stress), 3) who would be trusted with making decisions on ones behalf if incapacitated, and 4) vignettes about a dying patient. The vignettes asked about what treatment options the patient should be allowed to chose and covered possibilities such as hospice care, physician-assisted suicide, and living wills. The vignettes varied the age, gender, and life expectancy of the patient.
The 1998 culture module repeated some elements of the longer 1993 culture module and added items on 1) the nexus of religion and the arts and volunteering and the arts, 2) public support for the arts, 3) free speech and artistic expression, and 4) participation in the arts.
The 1998 module on job experiences and training asked about 1) specialized on-the-job training vs. general education, 2) details of formal and informal on-the-job-training, 3) job history, 4) seniority, and 5) structural attributes of employing organization.
The 1998 module on inter-racial friendships consisted of a three-way experiment on the reliability and validity of alternative methods of measuring these relationships (Smith, forthcomingc) .
The 2000 module on Multi-ethnic United States contained items on ethnic, racialland immigrant groups including items on contact, social distance, stereotypes, and languages used (Smith, 2001a).
The 2000 module on the information society covered use of computers and the Internet both at home, on the job, and elsewhere.
The 2000 module on freedom asked about what freedom means to people and how much they value it.
The 2000 religion module included items on what 1) religious traditions people identify with and how they label themselves and 2) among church attenders how people evaluate the job their local minister is doing in various areas.
The 2000 health status module was aimed at developing and
validating measures of health functionality. This included the use of items in the SF-36 scale of functional health status.
The 2002 module on child stigma uses a vignette approach to describe child with various psychological problems as well as a normal, control case. Then people were ask to evaluate the child described in the vignette and how that children should be treated both medically and socially.
The 2002 module on employment collected information on employee compensation, especially special compensation such as bonuses and stock options to test various economic theories about motivation.
The 2002 module on participation in the arts repeated a number of items from the 1993 culture module to measure level of participation in various cultural activities, especially those involving the arts.
The 2002 module on the quality of working life built on the Quality of Employment Surveys from the 1970s to study the contemporary nature of work. This included items on stress, cooperations with co-workers, relationship to supervisors, management-labor issues, productivity, and health issues.
The 2002 module on altruism adopted well-established scales of empathy, altruistic behaviors, and altruistic values to establish the first national norms for these constructs.
The 2002 module on prejudice adopted a psychological perspective to measure the extent of stereotypes towards racial and ethnic groups.
The 2002 doctors and patients module examined communication between these two groups. Using an experimental design, random samples heard different audio recordings of doctors discussing medical conditions with a patient. Respondents then evaluated the adequacy and content of these communications.
The 2002 transition to adulthood module consisted of two parts. The first measured the importance of achieving various states (e.g. finishing schooling, becoming self-supporting, having a child) for someone becoming an adult and then indicating at what age that state should be attained by. The second part measured various forms of social and political participation to study the different profiles of young vs. older adults.
The 2002 information society module largely replicated the module from the 2000 GSS.
iii. Cross-National Modules
The GSS has spurred cross-national research by inspiring other nations to develop data collection programs modelled on the GSS (e.g. the ALLBUS (Germany), British Social Attitudes, National Social Science Survey (Australia), Polish General Social Survey, and the Japanese General Social Survey) and by organizing these and other programs into a collaborative program of comparative research known as ISSP. The fundamental goal of ISSP is to study important social and political processes in a comparative perspective. As indicated above, the primary comparative perspective that ISSP

utilizes is the cross-national. In addition, by replicating earlier modules, ISSP not only has a cross-national perspective, but also an over time perspective. With ISSP it is possible not only to compare nations and test whether similar social science models operate across societies, but it is also possible to see if there are similar international trends and whether parallel models of social change operate across nations. Thus, by combining an across time with a cross-national design, ISSP incorporates two powerful perspectives for studying societal processes.
ISSP evolved from a bilateral collaboration between the Allgemeinen Bevolkerungsumfragen der Socialwissenschaften (ALLBUS) of the Zentrum fuer Umfragen, Methoden, und Analysen (ZUMA) in Mannheim, West Germany and the GSS of NORC, University of Chicago. In 1982 and 1984 ZUMA and NORC devoted a small segment of the ALLBUS and GSS to a common set of questions on job values, important areas of life, abortion, feminism, class differences, equality, and the welfare state (Peterson, 1985).
Meanwhile, in late 1983 Social and Community Planning Research (SCPR), which was starting an annual social indicators series called the British Social Attitudes Survey (BSA) similar to the ALLBUS and GSS, secured funds to hold meetings to further international collaboration. Representatives from ZUMA, NORC, SCPR, and the Research School of Social Sciences, Australian National University organized ISSP in 1984 and agreed to 1) jointly develop topical modules dealing with important areas of social science, 2) field the modules as fifteen-minute supplements to the regular national surveys (or a special survey if necessary), 3) include an extensive common core of background variables, and 4) make the data available to the social science community as soon as possible.
Each research organization funds all of its own costs. There are no central funds. The merging of the data into a crossnational data set is performed at its own expense by the Zentralarchiv fuer Empirische Sozialforschung, University of Cologne (hereafter cited as the Central Archive) . Coordination is supplied by one nation serving as the secretariat. The United States is serving as the secretariat from 1997 to 2003.
Since 1984, ISSP has grown to 38 nations, the founding four-- Germany, the United States, Great Britain, and ~ustralia-- plus Austria, Bangladesh, Brazil, Bulgaria, Canada, Chile, Cyprus, the Czech Republic, Denmark, Finland, Flanders, France, Hungary, Ireland, Israel, Italy, Japan, Latvia, Mexico, the Netherlands, New Zealand, Norway, the Philippines, Poland, Portugal, Russia, Slovakia, Slovenia, South Africa, Spain, Sweden, Switzerland, Taiwan, and Venezuela. In addition, East Germany was added to the German sample upon reunification. In addition, a number of non- members have replicated one or more ISSP modules. This includes Argentina (Buenos Aires metro area only), Lithuania, Singapore, and the former-Yugoslavia. Countries that have inquired about future membership include Argentina, China, Costa Rica, Iceland, India, Korea, and Ukraine.
ISSP members (Table 3) generally represent the leading social science institutes in each country and most are part of or

affiliates of leading universities or academies of science. (Exceptions include the Netherlands, which is represented by a division of the government's census and statistics office, and Japan, which is part of the quasi-public broadcasting industry.)
The annual topics for ISSP are developed over several years. Members propose topics for development. If there is sufficient general interest, a position paper is developed and presented to the next plenary session. This paper presents the theories being examined, reviews the extant literature, and outlines the topics and measures that would be included. When a topic is approved by ISSP, a drafting group of three to five nations is then appointed. They consult widely with the world social science communities and develop and pretest a draft of the proposed module and circulate the draft and supporting materials two months prior to the next annual session. Comments are then solicited from all ISSP members and the revised draft is then discussed and approved word-by-word at the plenary session. The drafting group then prepares a final version, resolves any additional technical issues, and circulates the final questionnaire to all members for fielding.
The ISSP researchers concentrate on developing questions that are 1) meaningful and relevant to all countries and 2) can be expressed in an equivalent manner in all relevant languages. The questionnaire is originally drafted in British English and then translated to other languages using rigorous translation procedures such as committee tran~lation.~
ISSP maintains high standards of survey research. Each nation uses full-probability sampling, carefully monitors all phases of the data collection, and cleans and validates the data. The Central Archive further checks all data archived by the member nations. All countries applying for membership must answer a series of standard questions about methodology and survey procedures (e.g. description of sampling and data cleaning procedures). Only after the secretariat has received satisfactory responses to all questions is a country's membership application considered by ISSP. Each country reports to ISSP its methods and various technical details such as its response rate. To check on the representativeness of the sample each country compares distributions on key demographics (e.g. gender, education, and labor force participation) from ISSP surveys to the best data sources in their respective countries (e.g. the Current Population Survey in the United States - smith, Young, and Berktold, 1999).
The themes covered in the ISSP module and the nations collecting data are listed in Table 3.
The first theme on the role of government covered attitudes towards a) civil liberties, b) education and parenting, c) welfare and social equality, and d) the economy.
The second theme was on social networks and support systems.
'~ecause the questionnaires are jo in t ly developed and agreed t o by b i l ingual researchers from each country, translation problems are minimized a t the design stage by avoiding English formulations that are especially problematic i n other Languages and by clar i fy ing the meaning and intent of the or ig ina l English wordings.
14

RSSS Australia I S Austria BUP Bangladesh IUPERJ Brazi 1 ASA Bulgaria SC Canada CES Chile CAR Cyprus ISCAS Czech ~ e ~ u b l i c ~ DEPPA Denmark FSD Fin Land CDA F Landers France-ISSP France ZUMA Germany b
NCSR G r t ~ r i t a i n ' Tarkai Hungary SSRC Ireland TAU Israeb Eurisko/CENSIS I t a l y BCRI Japan LAS~LSRC Latvia CEO Mexico SCP The Netherlands MU New Zealand NSD Norway SWS The Phi Lippines I S S Poland I C S Portugal VCIOM Russia IS-SAS Slovakia POMCRC s loveniae HSRC South Africa CIS~ASEP Spain UU Sweden SIDOS Switzerland f
AS Taiwan NORC United States LACS0 Venezuela Others: I F S Poland BS Lithuania D=Done P=P lanned
Table 3 ISSP
I S S P Modules Role of Social Social Family/ Work Role of Religion Social Enviro- Govt Support Equality Gender Govt I1 Equal. I1 ment
ISSP Members Countries
Family/ Gender I1

Table 3 (continued)
I S S P Members
RSSS I S BUP IUPERJ AS A SC CEP CAR ISCAS DEPPA FSD CDA FRANCE-ISSP ZUMA NCSR Tarkai SSRC TAU Eurisko/CENSIS BCRI LAS/LSRC CEO SCP MU NSD SWS I S S I C S VCIOM IS-SAS POMCRC HSRC CISIASEP UU SIDOS AS NORC LACS0
Countries
Australia Austria Bangladesh Brazi 1 Bulgaria Canada Chi l e Cyprus Czech Republi ca Denmark Finland F Landers France Germany G r t Br i ta in b
Hungary Ireland Israeg I t a l y Japan Latvia Mexico The Netherlands New Zealand Norway The Phi Lippines Poland Portugal Russia Slovakia Slovenia South Afr ica Spain Sweden Switzerland Taiwan United States Venezuela
National Role Ident i ty of Govern-
ment I11
Work Social Enviro. Religion Equal. I11 I1
I I 11
Social Fami Ly/ National Networks Gender 111 I D I1
PO1 PO1 POI PO1 PO1 PO1 PO1 PO1 PO1 PO1 PO1 PO1 PO1 PO1 PO1 PO1 PO1 PO1 --
P O I PO1 PO1 P O I PO1 PO1 PO1 PO1 PO1 PO1 PO1 PO1 PO1 PO1 PO1 P O I P O I DO2 PO1
Notes: Table 3 (continued)
~ lnc ludes Slovakia i n 1992. Includes East Germany s tar t ing i n 1990.
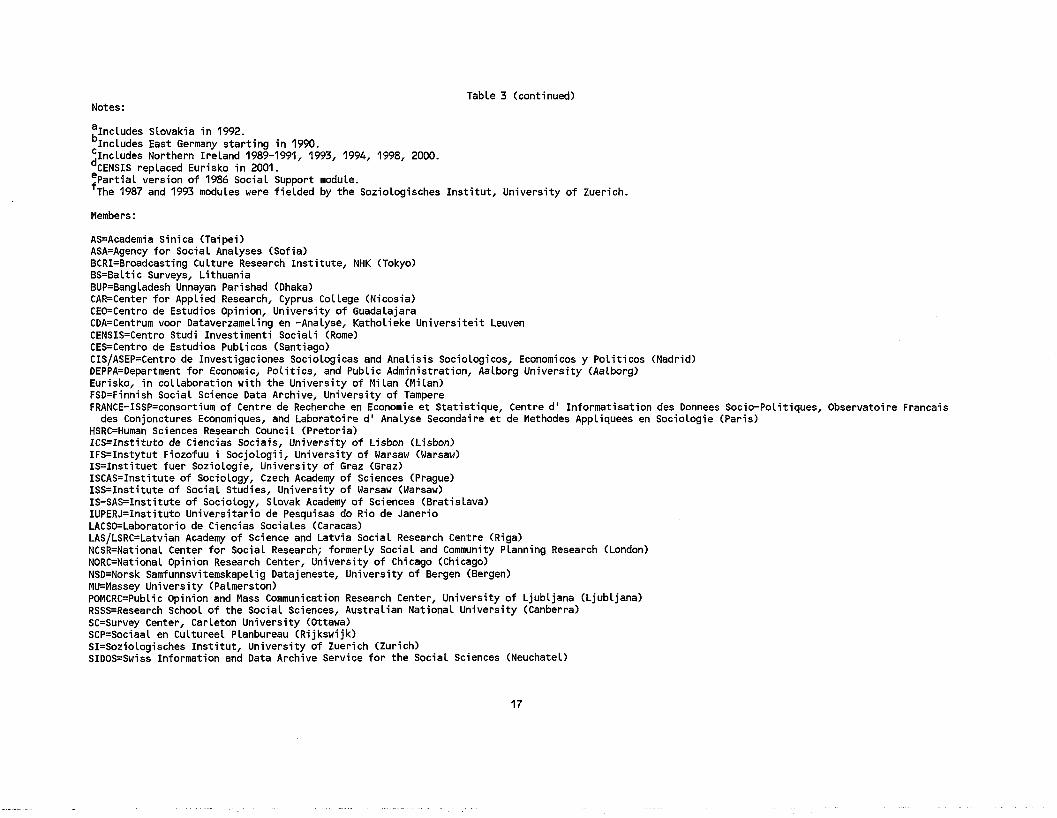
C~ncludes Northern Ireland 1989-1991, 1993, 1994, 1998, 2000. d~~~~~~ replaced Eurisko i n 2001. e ~ a r t i a l version o f 1986 Social Support module. f ~ h e 1987 and 1993 modules were f ie lded by the Soziologisches Ins t i tu t , University of Zuerich.
Members:
AS=Academia Sinica (Taipei) ASA=Agency fo r Social Analyses (Sofia) BCRI=Broadcasting Culture Research Insti tute, NHK (Tokyo) BS=Baltic Surveys, Lithuania BUP=Bangladesh Unnayan Parishad (Dhaka) CAR=Center f o r Applied Research, Cyprus College (Nicosia) CEO=Centro de Estudios Opinion, University of Guadalajara CDA=Centrum voor Dataverzameling en -Analyse, Katholieke Univers i te i t Leuven CENSIS=Centro Studi Investimenti Sociali (Rome) CES=Centro de Estudios Publicos (Santiago) CIS/ASEP=Centro de Investigaciones Sociologicas and Analisis Sociologicos, Economicos y P o l i t i cos (Madrid) DEPPA=Department f o r Economic, Poli t ics, and Public Administration, Aalborg University (Aalborg) Eurisko, i n collaboration with the University of Milan (Milan) FSD=Finnish Social Science Data Archive, University of Tampere FRANCE-ISSP=consortium of Centre de Recherche en Economie e t Statistique, Centre d ' Informatisation des Donnees Socio-PoLitiques, Observatoire Francais
des Conjonctures Economiques, and Laboratoire d ' Analyse Secondaire e t de Methodes Appliquees en Sociologie (Paris) HSRC=Human Sciences Research Council (Pretoria) ICS=Instituto de Ciencias Sociais, University o f Lisbon (Lisbon) IFS=Instytut Fiozofuu i Socjologii, University of Warsaw (Warsaw) IS=Insti tuet fuer Soziologie, University of Graz (Graz) ISCAS=Institute of Sociology, Czech Academy of Sciences (Prague) ISS=Institute of Social Studies, University of Warsaw (Warsaw) IS-SAS=Institute of Sociology, Slovak Academy o f Sciences (Bratislava) IUPERJ=Instituto Universitario de Pesquisas do Rio de Janerio LACSO=Laboratorio de Ciencias Sociales (Caracas) LAS/LSRC=Latvian Academy of Science and Latvia Social Research Centre (Riga) NCSR=NationaL Center f o r Social Research; formerly Social and Community Planning Research (London) NORC=Nat ionaL Opinion Research Center, University of Chicago (Chicago) NSD=Norsk Samfunnsvitemskapelig Datajeneste, University of Bergen (Bergen) MU=Massey University (Palmerston) POMCRC=Public Opinion and Mass Communication Research Center, University of Ljubljana (Ljubljana) RSSS=Research School o f the Social Sciences, Australian National University (Canberra) SC=Survey Center, Carleton University (Ottawa) SCP=Sociaal en Cultureel Planbureau (Rijkswijk) SI=SozioLogisches Inst i tut , University of Zuerich (Zurich) SIDOS=Swiss Information and Data Archive Service fo r the Social Sciences (Neuchatel)
n 3
n C
8 9,-
m A
0
a E V
3 n n V
L: E O .r
Q h L Q
m w m L:
0 m Q C
A 8 m s a m -.. n arz o m
U U w 3 Q C
,X e * $ .,- m x m m L A m Q 3 U C 5 - m -r x L
c a c w m
m 3 .r i-
u U
C C 0 3
L ' C 3 .,- C C Q O ' F h . F W W N W > nu c Q m . 7 Q = E > O.2 U a L a o w cw$?An5g ~ m ~ ~ m a L C H I - Q 3 C g.z.,-w4n g, u , r r n x v ; i ~ 8 m mi-, IY i-, i - , ~ m v - Y -
c n m m o , E O C I L E L 3 O L S W 3 Q C O Y > i-,L Q C E . r Y - s Q . F i - , o r o Q a o m 2 3 UY- c n a m
3 - 5 ,XCI E A m .,- .,- m d m > ut.? 2 ~a L > W
gz,!?A $ $ g V) 0 I1 Q .r II N 11 W -,- I- C E I1 2&*%752 ~3 m a ~ u 3 W r n I - I - 3 5 N
It contained detailed behavioral reports on contacts with various friends and relatives and then a series of questions about where one would turn for help when faced with various situations such as financial need and emotional distress.
The third module, on social equality, concerned beliefs about what factors affect one's chances for social mobility (e.g. parental status, education, race, etc.), explanations for inequality, assessments of social conflicts, and related questions. It also asked people to estimate the average earnings of various occupations and what the average earnings of these occupations should be.
The fourth module covered the impact on the family of the changing labor force participation of women. It included attitudes on marriage and cohabitation, divorce, children, and child care and special demographics on labor force status, child care, and earnings of husband and wife.
The fifth module, on orientations towards work, dealt with motivations to work, desired job characteristics, problems relating to unemployment, satisfaction with one's own job (if employed) , and working conditions (if employed).
The sixth module in 1990 repeated the role of government theme. This replication marked the first application of ISSPrs across time perspective. 3
The seventh module in 1991 covered the impact of religious beliefs and behaviors on social, political, and moral attitudes. It included questions on religious upbringing, current religious activities, traditional Christian beliefs, and existential beliefs. The non-religious items concerned such topics as personalmorality, sex roles, crime and punishment, and abortion.
The eighth module in 1992 replicated and extended the 1987 social equality module.
The ninth module in 1993 and 1994 covered the environment. It included questions on scientific knowledge; ratings of environmental problems relating to such matters as air and water pollution, nuclear power, the greenhouse effect, and pesticides; activism and behavioral involvement; and other factors.
The tenth module in 1994 partly replicated and extended the 1988 module on the impact on the family of the changing labor force participation of women.
The eleventh module in 1995 dealt with national identity. It included questions on national pride and patriotism, identification with various geographic and governmental units from the neighborhood to the world, pluralism and minority rights, protectionism vs. free trade, immigration, and citizenship.
The twelfth module in 1996 was the second replication of the role of government module.
The 13th module in 1997 was the first replication of the 1989 work orientation module. Among the topics added or expanded were organizational loyalty, the state of the unemployed, and job
3~epeated I S S P topics typical ly consist of two-thirds replication and one-third new items.
19

training and human capital development. The 14th module in 1998 replicated the 1991 religion module.
It added items on religious particularism, moral universalism, and religious tolerance.
The 15th module in 1999 was the second replication of social inequality. Among its innovations were using graphical presentations of social structure to assist people in their assessment of and preference for social equality.
The 16th module in 2000 was the first replication of the 1993 environmental module. It covered additional environmental problems (e . g . genetically modified food) and added items on what sources of information about green issues are trusted and third-world developmental issues.
The 17th module in 2001 was the first replication of the 1986 '
module on social networks and social support. It considerably reformatted the earlier module and added items on participation in volunteering.
The 18th 2002 module in 2002 was the second replication of the 1988 and 1994 modules on gender, work, and family.
In 2003 ISSP will replicate the 1995 national identity module and in 2004 there will a new module on citizenship focusing on rights and obligation of citizens.
Research from ISSP is covered in the section on cross-national research below.
iv. Experiments
Experimental forms have been a regular part of the GSS since its inception. The GSS has used split samples in 1973, 1974, 1976, 1978, 1980 and 1982-2002. Two forms were used in 1973, 1974, 1976, 1978, 1982, 1983, 1985, 1986, and 1988-2002, and three forms were used in 1980, 1984, and 1987. They have been an integral part of the GSS1s program of methodological research which is discussed below (See Methodological Research). Dozens of experiments have examined differences in question wording, response categories, and context.
Experiments are carried as part of the replicating core, topical modules, and supplements. In some years the experiments consist of additional questions not regularly appearing on the GSS, such as the inter-racial friendships experiments in 1998 and the wording and response order experiments on genetic screening items in 1991 and 1996. Most of the time, however, the experiments compare a variant wording or order with the standard GSS wording and/or order being the control. Examples are the experiments on measuring race and ethnicity in 1996 and 2000.
In addition, in many years there have been experiments within the topical modules. For example, in 1990 the intergroup relations module conducted three wording experiments to test the impact of class vs. racial references, in 1994 the multiculturalism module compared various formulations of affirmative action policies, in 1996 the mental health module used 18 different versions of five basic vignettes (90 versions in all) to examine stigmatization of
troubled individuals and also in 1996 the gender module examined how gender framing influenced judgments and preferences, in 1998 factorial vignettes were used to study terminal care decisions, and in 2000 there were experiments in the health status and computer use modules.
v. Reinterviews and Follow-Ups
Occasionally GSS respondents have been reinterviewed both as part of methodological and substantive studies. The methodological uses have included studies of reliability, cognition, and wording and context. In 1972, 1973, 1974, and 1978, test/retest studies of item stability and reliability were conducted (Smith and Stephenson, 1979; Alwin and Krosnick, 1989). In 1988, a group of cognitive scientists at the University of Chicago (Norman Bradburn, Janellen Huttenlocher, and Steven Shevell) expanded the normal GSS validation effort by increasing the sample size to almost half (n=629) and adding recall questions about the timing and content of the initial interview. Respondents were recontacted by phone about two months after their initial interview. The reports were then validated against the known information on date and content and models of memory were developed to explain the discrepancies (Huttenlocher, Hedges, and Bradburn, 1990) .
In 1990, NORC and the University of Chicago supported a project by a seminar on survey research methods to study wording and context effects. About a third (n=590) of the 1989 GSS cases were recontacted by phone about a year after their initial interview. The reinterview included two experimental forms. Comparisons were made between standard and variant questions across sub-samples on the reinterview, between standard questions on the GSS and the reinterview, and between standard questions on the GSS and variant questions on the reinterview (Ramirez, 1990; Junn and Nie, 1990).
The GSS has also served as a list sample for several substantive studies. GSS respondents are a representative sample of adults living in households and can be used as a list or sample frame for a follow-up study. While one must naturally adjust for any bias from panel mortality, the GSS offers an excellent frame for a follow-up study. First of all, since respondent names, addresses, and telephone numbers are known, GSS respondents are relatively easy to recontact. Second, a rich amount of information is known about respondents. This information can be used in several ways. For unchanging attributes like year of birth, income during the past year, or nationality, one can link the data obtained on the GSS to the follow-up study and thereby free up time on the follow-up study. Third, one can use any GSS variables to study panel mortality and, if necessary, adjust for panel mortality bias.
There have been seven substantive reinterviews of GSS respondents. The first was in 1987 and contained questions on political tolerance designed by James Gibson (with support from NSF) and C. William Cloningeris Tridimensional Personality Scale. 1,267 respondents were reinterviewed in person about three to four

months after the 1987 GSS (Cloninger, Przybeck, and Svrakic, 1991; Gibson, 1992a; Gibson, 1992b; Gibson, 1995). The second reinterview study was the 1990 National Survey of Functional Health Status conducted for John Ware at the New England Medical Center Hospitals with support from the Kaiser Foundation. Respondents from the 1989 and 1990 GSS, plus an additional sample of people 65 and older from these households were contacted in late 1990 and early 1991 (Thalj i, & a. , 1991) . An experimental comparison of mail and telephone reinterviewing was also carried out. Later, in 1994/95, respondents were reinterviewed a second time. In the third reinterview study in 1992 respondents to the 1991 GSS were reinterviewed in order to collect information for the ISSP social inequality module and study changes in negative life events over time (Smith, 1992a; Smith, 1992b). In the fourth reinterview in 1997 contacted parents of students in grades 1-8 from the 1996 GSS for the U. S. Department of Education and the Partnership for Family Involvement in Education (Datta and de Kanter, 1998) . The fifth completed reinterview dealt with knowledge about and attitudes towards the role of behavioral interventions and social science treatments in health care. It was conducted for the Office of Behavioral and Social Science Research at NIH and consisted of 1,945 cases (Miller, Kimmel, and Smith, 1999). The sixth reinterview was an extension of the 2000 topical module on computers and the Internet by John Robinson and Paul DiMaggio. 2000 respondents were reinterviewed in 2001 on this topic. The latest reinterview is of employed people on the 2002 GSS. In late 2002 and early 2003 they were reinterviewed about work-related, health issues.
The GSS has also served as the source for five special follow- up studies. First, in 1991 a record of the employer of respondents and spouses was collected. These employers were contacted as part of another NSF sponsored study of work organizations, the ~ational Organizations Study (NOS). Information on employer policies (e.9. fringe benefits, promotion policies, etc.) was collected. This information is being analyzed in its own right as well as linked back to the attitudes of the original GSS respondents (Marsden, Kalleberg, and Cook, 1993; Kalleberg and Marsden, 1993; Kalleberg, Knoke, Marsden, and Spaeth, 1996) . Second, in 1994 a random sibling was selected for an interview in order to study social mobility within sibsets (Warren, 1998; Mare and Chang, 1999). These siblings were contacted by the Letters and Sciences Survey Center at the University of Wisconsin. Third, in 1998 and 2000 a sample of respondents' congregations was created. In 1998 a follow-up survey of these congregations was fielded (Chaves, Konieczny, Beyerlein, and Barman, 1999). For the 2000 National Congregations Study there were follow-up surveys both of congregations and of people attending services of these congregations. Finally, as with the 1991 NOS, on the 2002 GSS information was collected on respondent' s employers (spouse's employers were not covered in 2002). The 2002 NOS is now being conducted with support from the National ~nstitute for Occupational Health and Safety, the Commonwealth ~oundation, the National Institutes of Health, and labor economists at Rutgers
and Harvard.
Usages
The National Data Program for the Social Sciences strives to make the GSS available to as many users as possible, as quickly as possible, and in formats that are easy to use and well-documented.
i. Data Availability and Documentation
The GSS is available in many different forms and formats: 1) Cross-time/Cumulative files (both mainframe and micro oriented), 2) Cross-national files, 3) Supplemental files, 4) Micro Subsets, and 5) Teaching Subsets. First, since 1978, when the cumulative format was first adopted, the basic form of distributing the GSS has been the cumulative file available as raw data and as an SPSS file. The Cross-time/Cumulative files cover all years and all cases. Second, the Cross-national files contain not only data from the GSS, but also data from our international collaborators. They are available in both raw data and SPSS versions. They contain common demographics and the shared items from the GSS-ALLBUS and ISSP collaborations. Third, the Supplemental files consist mostly of reinterview and follow-up surveys. In addition, the special factorial vignettes asked on the 1986 GSS are included here. These files appear in a variety of formats. In some cases they are already linked to the baseline GSS data and in other cases links using case ID can be carried out. Fourth, Micro Subsets are files that cover a subset of variables and/or years. Finally, Teaching Subsets contain a sample of variables organized as part of instructional computer programs. In some instances case-level data are available, while in other cases aggregated data in the form of cross-tabulations or some other format is utilized. Which of these data files would be most appropriate for a given user depends on the intended use and the locally available computing facilities. Altogether there are over 110 different versions of GSS/ISSP files.
In addition, GSS marginals are available from the Public Opinion Location Library (POLL) of the Roper Center, University of Connecticut. This database contains 7000 GSS items.
Documentation for the GSS comes in five major forms: 1) the Cumulative Codebook, 2) the SPSS control and comment statements, 3) the GSS Report Series (Social Change Reports, Methodological Reports, Cross-national Reports, Topical Reports, and Project Reports), 4) the GSS Data and Information Retrieval System (GSSDIRS), and 5) ISSP Web sites and other materials.
First, the basic documentation for the GSS is the Cumulative Codebook that is updated with the creation of every new cumulative file. The 1972-2000 edition has 1,659 pages. It contains the exact wording of all questions and response categories, the physical location and mnemonic names of all variables, and the distributions for both all years and for the most recent years. In addition, the Cumulative Codebook has 22 appendices which contain information on sampling and weighting, field procedures, coding instructions,
recodes, distributions for multi-columned variables such as age, occupations, occupational prestige, industry, denomination, and hours worked, the open-ended codes for abortion and ERA items, changes in wording across years, question origin, experiments, item rotation, cross-national modules, and GSS publications. There are also two indexes: one using GSS mnemonics and the other using topical headings.
Second, SPSS control and comment statements are prepared to create an SPSS system file. They provide variable names (mnemonics), variable descriptors, value labels, and missing value definitions for all variables. For the 1972-2000 cumulative file this amounted to over 24,000 lines of code. The Cumulative Codebook and SPSS file documentation are coordinated (e. g. both referring to questions by the same mnemonic names and having variables in the same order) to allow analysts to refer back and forth between them. While no substitute for the full documentation provided by the Cumulative Codebook, the file definition statements allow analysts easy access to the data and are usually sufficient for analysts to understand computer output (e.g. frequencies, cross-tabulations) .
Third, the GSS Report Series provide additional detail on many issues. There are currently 222 reports: 48 GSS Social Change Reports, 96 GSS Methodological Reports, 22 GSS Cross-National Reports, 33 Topical Reports, and 23 Project Reports. GSS Social Change Reports include time series and trend analyses. The GSS Methodological Reports are probably of most interest to the analyst trying to understand the GSSr s design and dealing with technical issues such as weighting, sampling, item rotation, nonresponse bias (survey, supplement, and item), and mode effects. In addition, the GSS Methodological Reports examine experiments, item and scale reliability, and other measurement error issues. GSS Cross-National Reports investigate the GSS collaborations with other countries. GSS Topical Reports concern substantive research not primarily dealing with time or nation. GSS Project Reports mostly cover usage patterns, based on the annotated bibliography and several surveys of GSS users. Many have been published and all are available from the GSS.
Fourth, NORC and the Inter-university Consortium for Political and Social Research (ICPSR) received support from the National Science Foundation to develop state-of-the-art Internet services for GSS users (GSSDIRS). Services include facilities for hypertext viewing and searching of complete survey documentation, an ability to draw customized and documented extracts from data sets, statistical analyses, and File Transfer Protocol (FTP) delivery of extracted data sets. GSSDIRS has been extremely popular with users. In the last 12 months it has had nearly 4 million visits. Also, it has been singled out for praise and recognition by various groups. It was named a I1Site-to-See" by American Demosraphics (Jan., 1997), p. 25; selected as a "Hot Picksl1 by Science magazine (May 29, 1998), p. 1219; awarded a ~ i n k s ~ ~ o Key Resources Award in the Social Sciences in July, 1998, given a top, four-stars rating as an academic, survey Web site by Communication Studies at the University of Kansas in April, 1999, and won the American

Association for Public Opinion Research Innovators Award in May, 2000.
Finally, extensive documentation also exists for the ISSP cross-national files. The Central Archive in Cologne prepares electronic and hard-copy codebooks in English, flat and SPSS system files, and a CD-ROM that not only includes the codebook and files, but also copies of the original language questionnaires from each survey and country from 1985 to the present. The ZA-ISSP web (www.gesis.org/issp) was visited 58,836 times in 1999 and the projected level for all of 2000 is 70,136. The ISSP Secretariat also maintains a Web site (www.issp.org) which contains descriptions of ISSP and all member institutes, a bibliography of ISSP uses, and other information on the organization and operation of the group. It was visited 39,528 times during 12 months in 1999- 2000.
ii. Notification and User Services
The GSS also tries to keep users informed about developments and to answer user inquires. The GSS carries out an extensive and multi-faceted program of reaching out to and informing users. First, the pro j ect communicates general information to users via notices in the newsletters of various professional organizations, archives, software analysis firms, etc. (e.g PS, ASA Footnotes, AmStat News, APA Monitor, SINET, Survey Research, AAPOR News, ICPSR Bulletin, ESRC Data Archive Bulletin, MicroCase Bulletin, Social Science Newsletter, and SPSSI Newsletter). Special notices on the cross-national and topical notices are also sent to specialized journals and newsletters. For example, notices on ISSP have appeared in Social Indicators Research, the Journal of Official Statistics, the European Political Data Newsletter, Comparative Public Opinion, the International Journal of Public 0 inion Research, ZUMA-Abreitsbericht, the ICPSR Bulletin, and the newsletters of various ASA sections.
Second, the project also has worked with the major archives (ICPSR, the Roper Center, Central Archive) and other data purveyors (MicroCase, SPSS) to prepare notices and announcements.
Third, the GSS sends out special announcements over the Internet to various news groups such as AAPORNET, METHODS, POR, and WAPORNET .
Fourth, the PIS also frequently give special presentations at professional meetings and other venues. For example:
1. At the invitation of the American Sociological Association annually has exhibits on the GSS and ISSP at its special session on data resources.
2. On behalf of the American Sociological Association prepared GSS exhibits for Congress as part of the "science fairu of the Coalition for National Science Funding in 1996, 1998, and 2001.
3. Smith has made presentation on GSSDIRS to the ~merican Association for Public Opinion Research and the ~merican Sociological Association.
4. Davis presented talks on the GSS/ISSP at a conference of the Swiss National Science Foundation and at the Essex Summer School in Social Science Data Collection and Analysis.
Fifth, the GSS has had its own annual newsletter, GSSNews, since 1987. It currently has a circulation of about 2,900 and is also distributed as part of GSSDIRS. This publication describes the latest additions to the GSS and future plans. It also highlights important trends and other substantive findings (called liTrendletsli ) . Other topics covered include using microcomputers to analyze the GSS and instructional uses of the GSS.
Sixth, the GSS prepares several other documents to inform users about the GSS and what research has been done using the GSS. For people unfamiliar with the GSS a 11-page booklet giving a general introduction is available ( "The NORC General Social Survey : Questions and AnswersIii Revised and Updated, July, 2000).
For a complete overview of the GSS Davis and Smith prepared The NORC General Social Survey: A User's Guide (1992). It describes the GSS' s history and mission, content, study design, sample design and weighting, field procedures, data processing and distribution, and provides examples of data analysis.
Another valuable informational source for users is the GSS annotated bibliography. It is a compilation of known usages of the GSS. It includes books, articles, academic papers, dissertations and theses, and reports. It does not include newspaper articles, term papers, or most unpublished material. Each entry includes a full reference, a list of other surveys analyzed, the GSS mnemonics utilized, and a short abstract. The bibliography is indexed by GSS mnemonic so one can locate references that employed variables of interest. This is particularly useful as part of a literature review to see what research has already been conducted on one's topic. The GSS makes the bibliography available as part of GSSDIRS.
Finally, the GSS also tries to answers users' queries. Contacts via email, regular mail, and telephone climbed from about 1,100 in 1990-91 to 9,900 in 2001-2002. For those with specific questions, the GSS will try to provide the needed information. Often papers in the GSS Report Series address the issue at hand. In other cases, we try to refer people to appropriate references in the annotated bibliography. Information that the GSS frequently supplies includes 1) the content of the Other Specify lists, 2) questionnaires, 3) sampling locations, and 4) nonresponse records. Special data runs are however generally not performed, since we encourage people to carry out their own analyses.
iii. Distribution
While it has not been possible to track the distribution of any of the instructional and more specialized data sets, figures

from the major data archives and micro-computer companies alone indicate that 4,731 GSS files and 2,246 ISSP files were distributed in 1995-2000. Since most of these are cumulative files covering multiple years or countries, this translates into approximately 101,000 GSS surveys and nearly 45,000 ISSP surveys. The GSS is the most frequently ordered data set from the Roper Center and the second most requested data set from ICPSR (after the American National Election Studies).
Of course data access has also shifted significantly to the Internet. GSSDIRS was visited by almost 4,000,000 times in 2001 and in 2001 over 4200 sites were linked to GSSDIRS. Also, as of April 3, 2000 the top three accessed sites under the Google directory for surveys were pages offering the GSS (the ICPSR site, NORC site, and UC-San Diego site).
iv. Publications by the User omm mu nit^ As of April, 2000, the project was aware of 5,431 uses of the
GSS . Estimates as of the end of 2002 put total usage at over 7,000. These include 2,676 journal articles, 1,201 books, 959 scholarly papers, 442 reports, and 153 student dissertations and theses (Smith, 2000b). Most users (79%) have been academics with college affiliations. Other users include scholars at research centers, foundations, and related organizations (lo%), and government researchers, (2%) and others and unknown (9%) . Among the academics sociologists predominate (58%), followed by political scientists (13%) , doctors and other health professionals (5%) , business management/administration professors (4%) , psychologists (4%) , other social scientists (e.g. economists and anthropologists) (13%), and non-social scientists and miscellaneous (3%).
Usages have continued to grow over the years. As Table 4 indicates, confirmed usages reached 200 per annum in the late 1980s and 300 per annum in the early 1990s. The estimates are that current use is now running at over 400 per annum. The increase during the last few years as well as the recent expansion of usage by foreign scholars indicates that future usage should match or exceed the current levels.
Moreover, with the exception of the Census and its Current Population Survey, the GSS is the most frequently used data set in the top sociology journals .4 As Table 5 shows, the GSS has been used in 104 articles over the last nine years - as often as the total of the next six most frequently used data sets combined.
Similarly, the GSS has been popular with leading social scientists. For example:
16 of the last 19 presidents of the American Sociological Association have used the GSS in their research and/or teaching.
4 ~ e used the American Sociological Review, the American Journal of Sociology, and Social Forces. They are the consensus choice as the top, general sociological journals (Allen, 1990; McNamee, Wi l l is , and Rotchford, 1990; Glenn and Vi llemez, 1970; Jacobs, 1989; Kamo, 1996; Presser, 1984; and Gi les and Wright, 1975).

The National Academy of Sciences has used the GSS in 17 publications.
In 1995 the American Association for Public Opinion Research compiled a list of the top 50 books in public opinion research from 1946 to 1995. Of the 11 books published since 1974, 5 used the GSS (Gollin, 1995).
In addition, the influence of the GSS on the research field goes well beyond direct uses. Research based on the GSS is frequently cited by researchers working with other data. First, GSS articles are frequently cited in scholarly journals. We took samples of 50 GSS articles published in the American Sociolosical Review, the American Journal of Sociolosv, and Social Forces between 1988 and 1995 (25 from 1988-1991 and 25 from 1992-1995). Social Science Citation Index was then used to determine how often these articles were referenced in other articles by five years after the end of the covered periods (in 1996 for the first period and 2000 for the second period) . In the 1988-1991 sample the GSS articles were cited an average of 11 times by other articles. This compares to a control sample of 25 non-GSS articles selected from the same issues of the same journals (immediately preceding or following the GSS articles) which were cited an average of 6.9 times. In the 1992-1995 sample the GSS articles were cited an average of 31.6 times and the control articles an average of 13.6 times. GSS articles are thus 1) widely cited by other authors, 2) used even more than a matched set of non-GSS articles, and 3) the GSS edge over the control articles grew from 1.6:l in 1988-1991 to 2.3:l in 1992-1995.
Similarly, use of ISSP has been strong and growing. Since the first ISSP publications in 1987, 1208 pieces of research have appeared. These include 252 book chapters, 66 books, 342 journal articles, 293 conference papers, 75 newsletter articles, and 180 theses, dissertations, and unpublished reports. Usage has also shifted away from conference papers and newsletter pieces to journal articles and books/book chapters). Furthermore, usage has been rapidly accelerating. In recent years 200+ new ISSP uses have been completed annually.
i v . Teaching
The GSS is widely used in teaching at the undergraduate and graduate levels. About 250,000 students annually take courses that utilize the GSS. Dozens of articles have discussed and illustrated how to use the GSS to improve teaching sociology and the social sciences (e.g. Carter, 1998; Hong, 1992; Stewart, 1996a, 1996b). As Babbie (1996) notes "It's difficult to exaggerate how important it is to the discipline, not to mention teaching the discipline."
Illustrative of the GSS1s impact on the teaching of the social sciences are the following:
1. Davis was awarded the Distinguished Contribution in

Table 4
Observed and Estimated GSS Usages by Year
Year
Observed ~stimated~
1972 1973 1974 1975 1976 1977 1978 1979 1980 1981 1982 1983 1984 1985 1986 1987 1988 1989 1990 1991 1992 1993 1994 1995 1996 1997 1998 1999 2000 Forthcoming Unknown
Total
aEach succeeding GSS bibliography has turned up more uses for given years than earlier edition have found. The estimate column is not an estimate of all uses, just those that will eventually be documented by later updates of the bibliography. b~eing based on a small number of cases and a large multiplier, the 2000 projection is much less reliable than that for earlier years.

Table 5
Most Frequently Used Data Sets in Leading Sociology Journals, 1991-1999
Census/CPS GSS National Longitudinal Survey of Youth Panel Survey of Income Dynamics National Survey of Families and Households High School and Beyond National Educational Longitudinal Survey National Election Studies Occupational Change in a Generation I1 National Survey of Black Americans
Teaching Award of the American Sociological Association and the Joseph R. Levenson Memorial Award for "the most outstanding instructionu by a senior faculty member at Harvard University.
2. The GSS data have been used in 226 textbooks (106 in sociology, 49 in statistics/research methods, 44 in political science, 14 in psychology, and 23 in other fields (health, economics, communications, etc.).
3. Over 60 special teaching sub-sets with GSS data for analysis are distributed with textbooks.
4. As of February 15, 2000 224 Web sites contained course material related to the GSS (e.g. Chico, et al., 1998).
5. Many professors and universities have also developed special social science courses and teaching packages built around the GSS (Anderson, 1990; Arber, 1994; Babbie and Halley, 1994; Beveridge and Seiler, 1988; Bruner, 1995; Bruner and Frederick, 1994; Carter, 1995a; 1995b; Ellison, 1986; Fox, 1995; Healey, 1996; Lusch and Lusch, 1987; Kain, 1987; Kennedy, 1986; Pollack, 1991; Riordan and Mazur, 1988; Savage, 1988; Spreitzer, 1992; Stark, 1995; 1999).
6. The cumulative GSS files are used every year in the ICPSR Summer Program which annually is attended by 150 scholars representing over 100 colleges in the United States and Canada. It is also used as part of a similar European Summer School program at Essex University in England.
7. Annually 80,000 students use GSS data products from Microcase.

8. Examples of on-line, GSS teaching uses include: Schoolcraft College and Madonna University utilizes the GSS in their OMNIBUS (On-line Multi-degrees in National and International Business) program, Kaplan College employ the GSS in an on-line professional development course, and the Digital Learning Group has on-line social science textbooks and courses using the GSS.
Also, at the request of the GSS NORC established a GSS Student Paper Competition in 1995 to stimulate and acknowledge student research with the GSS. NORC paid for the advertising of the competition and supplied a cash prize and plaque. The Microcase Corporation and SPSS have also supplied software packages to the winners. Response has been strong (over 300 entries) and the quality of submissions has been high. Awards were given in undergraduate and graduate divisions. Judging has been done by GSS PIS and members of the Board of Overseers.
vi. Other Uses
The GSS has also been used outside the academic community by government, the media, non-profits, and the business community.
Government : The GSS is regularly used by 1) the Congressional Reference
Service of the Library of Congress where it is annually entered in the Services's database of survey results, 2) the Science and Engineerins Indicators series of NSF, 3) the Sourcebook of Criminal Justice Statistics of the Bureau of Justice Statistics, and 4) Statistical Abstract of the United States of the Bureau of the Census. It is referenced by and GSSDIRS is linked to FedStats (www.fedstats.gov/programs/ index.htm1). GSS data have been cited in 20 briefs to the US Supreme Court.
It has also been used by many other government agencies at the local, state, national, and international levels. Examples are: 1) local: the Los Angeles Police Department, Santa Clara County Hate Crime Unit, Orange County Human Relations Council; 2) state: Supreme Court of California, Governor's Task Force on Violence and Extremism (Maryland), and Ohio Commission on Racial Fairness; 3) nation: the Census Bureau, the Centers for Disease Control and Prevention, Council of Economic Advisors, the Departments of Defense, Education, Health and Human Services, and State, the Federal Reserve Board, the National Commission on Children, various Congressional committees, and the White House; and 4) international: United Nations, International Labour Organization, European Union, Canadian Department of the Environment, and Dutch Central Statistical Office.
Media :
The GSS is contacted 200-400 times a year by the media. GSS

data are regularly cited in major newspapers such as the New York Times, Washinston Post, Los Angeles Times, and Wall Street Journal, news magazines such as Time, Newsweek, and U.S. News and World Report; and dozens of other journals such as The Nation, American Enterprise, America, Harper's, and New Republic. It is also frequently used by the television news and has been used in news shows such as "Prime Time," "NBC Nightly News," nNightline,u and "60 Minutes." Likewise, many Web media sites use the GSS (e.g. Public Agenda, Nervelink, About.Com).
Non-Profits:
Among non-profit organizations outside of the academic sector the GSS has been used by such groups as the Allan Guttmacher Institute, the American Civil Liberties Union, American Council of Pharmaceutical Education, the American Jewish Committee, the American Red Cross, Aspen Institute, the Committee on AIDS Research and the Behavioral, Social, and Statistical Sciences, National Academy of Sciences, the Committee on the Status of Black Americans, National Academy of Sciences, the Evangelical Lutheran Church of America, Independent Sector, Junior Statesmen, the Panel on Poverty and Family Assistance: Concepts, Information Needs, and Measurement Methods, National Academy of Sciences, National Coalition of American Nuns, National Conference for Community and Justice, National Council of LaRaza, National League of Cities, Southern Regional Council, the United Presbyterian Church, the United Way, and the Violence Policy Center.
For-Profits:
In the business sector, the GSS was named each year during the 1990s as one of "The Best 100 Sources for Marketing Informationrr by American Demosraphics and described as "of immense value to practitionersu by PR Reporter (Vol 42., March 1, 1999). Corporate users of the data include such firms as BellSouth, Bluecross and Blueshield, General Motors, J. Walter Thompson, Price Waterhouse, Proctor and Gamble, Salomon Brothers, SmithKline Beecham, and Young and Rubicam.
Organization
The National Data Program for the Social Sciences is directed by James A. Davis, Tom W. Smith, and Peter V. Marsden. From 1972 to 1982 the GSS was advised by a Board of Advisors and starting in 1978 a Board of Methodological Advisors. In 1983 at the behest of NSF these groups were combined to form a new Board of Overseers. The Board provides guidance to the GSS, forms linkages to the various research communities, spearheads the development of topical modules, approves the content of each survey, and evaluates the work of the project. The GSS has been fortunate to have had an outstanding group of scholars volunteer

to serve on its Boards.
2. Contributions to Knowledge
Because of the wide usage of the GSS it is effectively impossible to describe all of the results from the thousands of publications covering dozens of fields. We will instead cover three aspects of usage that describe in part the GSS1s contributions to basic knowledge: 1) how key design features of the GSS have promoted social science research, 2) what research has been carried out in several representative areas, and 3) the methodological research that has been conducted by the GSS.
a. Design Features of the GSS and Research
Several key aspects of the GSS study design greatly facilitate research opportunities. These include: 1) replication, 2) breadth of substantive content, 3) extensive and detailed demographics, 4) providing a standard of comparison for other surveys, and 5) depth and innovation in the topical modules.
Replication is the most important design feature of the GSS. Replication is necessary for two crucial research goals of the GSS: 1) the study of social change and 2) the study of sub- groups. A sample of GSS research publications since 1995 shows that 60% of all GSS usages make use of the replication feature by utilizing two or more years of the GSS.
The core of the GSS is based on the simple principles that 1) the way to measure change is not to change the measure and 2) the optimal design for aggregating cases is a replicating cross section. Besides replication within the core to study social change and sub-groups, the GSS employs replication in several other ways.
First, many of the variables used on the GSS were adopted from baseline surveys with observations going back as far as the 1930s and 1940s. As a result, hundreds of GSS trends extend back before the inception of the GSS in 1972 (Smith, 1990~).
Second, several of our topical modules have been designed to replicate seminal studies. The 1987 module on socio-political participation replicated key segments of the 1967 Verba-Nie study of political participation (Verba and Nie, 1972); the 1989 occupational prestige module updated the NORC prestige studies of 1963-1965 (Nakao, Hodge, and Treas, 1990; Nakao and Treas, 1994); and the 1996 Mental Health module drew on Starr's seminal study from the early 1950s (Phelan, et al., 2000). Even when not primarily a replication, other modules, such as the modules in 1990 on inter-group relations, in 1991 on work organizations, in 1994 on multi-culturalism, in 1996 on gender, and in 2000 on health functioning, have adopted key scales from earlier studies.
Third, there is a social trends component in ISSP. Cross- national modules have been periodically repeated to measure social change in a comparative perspective. The first example of this was the replication of the 1985 role of government module in
1990 and again in 1996. Similarly, the 1987 social inequality module was replicated in 1992 and in 1999; the 1988 ISSP module on gender, work, and the family was repeated in 1994 and will again be the topic in 2002; the 1989 ISSP module on work orientations was repeated in 1997; the 1991 module on religion was replicated in 1998, and the 1993 environmental module in 2000.
Replication is first and foremost used to study social change. An analysis of recent publications (1995+) shows that 39% of all research examines trends. Examples of this body of research are presented in the section on research findings below.
Replication is also essential for the pooling of cases to study cultural sub-groups and understand the great complexity and diversity of American society. About 13% of all recent (1995+) GSS usages have primarily pooled years to examine particular sub- groups. The GSS has been used not only to study all of the major social groups (e.g. men and women, Blacks and Whites, the employed, etc.), but also to study much smaller groups and combinations of groups. For example, the GSS has been used to focus on and examine an incredibly wide range of groups including: American Indians (Hoffman, 1995); art museum attendees (DiMaggio, 1996) , the divorced (Stack and Gundlach, 1992) , engineers and scientists (Smith, 2000a; Weaver, 1996; Weaver and Trankina, 1996) , farmers (Drury and Tweeten, 1997) , Jews (Chiswick, 1993; Davidson, Pyle, and Reyes, 1995; Waxman, 1994), nurses (Schwartz-Barcott, 1990), part-time workers (Kalleberg, 1995), professors (Hamilton and Hargens, 1993; Matthews, Weaver, and Franz, 1992), school teachers (Lindsey, 1997; Matthews, et al., 1992; Walker, 1997), the self-employed and business owners (Blachflower and Oswald, 1992; Bok, 1993; Kingston and Fries, 1994), the unemployed (Punkett, 1994), and veterans (Feigelman, 1994, Lawrence and Kane, 1995; Matthews, Harger, and Weaver, 1994). And among the combination of groups investigated are Black Catholics (Feigelman, Gorman, and Varacalli, 1991), the divorced elderly (Hammond, 1991), older Blacks (Peterson and Somit, 1992; 1994), older rural residents (Peterson and Maiden, 1993), and self-employed women (Greene, 1993; McCrary, 1994).
Moreover, in a number of instances sub-groups were pooled into several time periods so that both trend and sub-group analysis was possible. For example, among Hispanics, (Hunt, 1999), Jews (Greeley and Hout, 1999; Walters and Wilder, 1997), and schoolteachers (Walker, 1997).
A second key design feature of the GSS is its wide ranging content. The cumulative 1972-2000 GSS data set has 3,836 variables and typically 850-1000 variable appear on each recent GSS. As a result, the GSS covers a wide range of topics and as the Office of Inspector General of NSF has noted, attracts use from "scientists in almost every sub-field of sociology and in numerous other social science disciplines . . . ( Office of Inspector General, 1994) . "
This allows investigators to test hypotheses across a large number of variables rather than being restricted to a handful of

items. For example, Eckberg and Blocker tapped 74 items to look at the connection between religion and the environment, Davis (2000) looked at trends on 81 items, Peterson and Somit (1994) considered political differences by age with 84 questions, Ladd (1999) used 93 items to study changes in social capital, Freese, Powell, and Steelman (1999) examined birth order differences with 106 variables, and Greeley (1995) utilized 230 variables to study religion.
A third key design feature is the GSSf rich and detailed set of demographics. The GSS covers much more than the standard background variables for respondents. These include data on one's family of origin such as mother's and father's education, occupation, and industry and region, community type, and religion raised in. It also has many variables about one's spouse such as his/her education, occupation, industry, religion, church attendance, and ethnicity.
The demographics also tend to contain considerable detail. For example, both the 1970 and 1980 three-digit occupation and industry codes were coded in 1988-90 and both the 1980 Census and International Standard Classification of Occupations are presently available. From the occupational codes both GSS/NORC prestige scores and Duncan SEI scores are assigned. Likewise, the four education variables (respondent's, spouse's, father's, and mother's) include both number of years in school and highest degree obtained. Similarly, three theoretically distinct size of place/community type variables are provided.
Fourth, the GSS serves as a standard for many other surveys. It is widely used as a national norm for comparison with student, local, state, international, and special samples. Examples include :
1. Student surveys have used the GSS at North Carolina Central University, St, Mary's of Minnesota, the University of Chicago, and Washburn University.
2. GSS items are regular items in the Chicago area surveys of the Metropolitan Chicago Information Center (1994+) and the Houston Area Survey (1982+). Other city-level surveys include the Multi-center Study of Cultural Norms and Attitudes on Violence in Selected Cities in the Americas (1996) and a work survey in Silicon Valley (1999).
3. State surveys organized in the National Network of State Polls has used GSS items at least 255 times.
4. GSS items have regularly been adopted by major commercial firms such as Gallup, Harris, the Los Angeles Times, and Yankelovich. Other national surveys using the GSS includes the Work Trends survey by the Center for Survey Research, University of Connecticut.
5. Special samples include the National Panel Study of U.S.

Business Start-ups by the Entrepreneurial Research Consortium (1997) and a survey on organizational citizenship behavior on Maxwell Air Force Base, Alabama (2000).
6. Beyond the ISSP collaboration GSS items have been used in surveys in China, Costa Rica, Germany, Korea, Peru, and Poland.
7. The GSS ethnic images measures have been adopted by surveys in Los Angeles, New Orleans, and Wisconsin, by a national survey of elites, and by the American National Election Studies.
In addition, the adoption of GSS items on social networks, verbal ability, occupational prestige, and health are discussed below under research findings.
b. Major Research Findings from the GSS
The GSS has contributed to the research literatures in dozens of different areas in the social sciences. We have selected some recent examples of GSS contributions in just five areas to briefly illustrate the range of research that has been conducted with the GSS.
i. Stratification and Intergenerational Mobility
The GSS has engaged in several important innovations in the study of social stratification and social mobility. First, in 1989 the GSS conducted the third national study of occupational status and created new measures of both occupational prestige and socio-economic index (SEI) (Nakao and Treas, 1994 and Hauser and Warren, 1997). These new scales have been used in 59 studies of mobility and/or stratification based on the GSS (e.g. Davis and Robinson, 1998; Gilderbloom and Markham, 1995; Kalleberg, 1995; Pellerin, 1998; Wolfinger, 1998). In addition, a large number of other studies have adopted the GSS occupational prestige and/or SEI scales for their surveys (e.g. Bumpus, Crouter, and McHale, 1999; Crouter, McHale, and Tucker, 1999; Han and Moen, 1999; Wrzesniewski, McCauley, Rozin, and Schwartz, 1997).
Second, by adding 1968 and later 1988 International Standard Classification of Occupations codes to the GSS, international comparisons were greatly enhanced and the GSS is extensively used in cross-national studies of stratification and mobility (e.g. Ganzeboom and Treiman, 1996; "International Stratification and Mobility File," n.d.; Kelley and Evans, 1995).
Third, since the beginning the GSS has collected information on mother's labor force participation and since 1994 has included items on mother's occupation parallel the traditional item on father's occupation. This has allowed the examination of inter- generational occupation mobility for single-parent, mother-headed households and the relative contribution of maternal and paternal

occupational status on children in general and gender-linked patterns of occupational status transmission in particular.
Fourth, in 1994 the GSS carried out an in-depth study of family mobility including a follow-up study of siblings known as the Study of American Families (1998). Research on this has shown how family mobility and transmissions operate across sibsets and how families adopt different strategies to advance family members individually and collectively across generations (Freese, Powell, and Steelman, 1999; Goldstein and Warren, 2000; Hauser, 1998; Hauser and Warren, 1998; Mare and Chang, 1998; Warren, Huang, and Carter, 2000; Warren, Sheridan, and Hauser, 1998). The research demonstrates that to a notable degree social mobility is not an individual process, but a familial process in which individual mobility.may, in different ways, be both limited and assisted by the mobility of others in the family.
Fifth, the GSS has also been used to refine the conceptualization and measurement of a second key stratification measure, education. Smith (1995b) and Braun and Mueller (1997) have shown that education is a multi-dimensional concept that is an even stronger predictor of attitudes and behaviors when measured fully and precisely.
Finally, the GSS occupational status and mobility variables have been used in a wide range of other ways. For example, in terms of status influencing attitudes Strickler and Danidelis (1998) showed that over time abortion attitudes have become less related to family background and Kozimor-King and Leicht (1999) found that over time women in nontraditional occupations had been more likely to develop feminist points of view than women in traditional occupations have. In terms of mobility several studies document how mobility is moderated by demographic differences. Logan (1996) showed substantial variation by education, race, and age, Hout (1997) noted important gender differences in occupational mobility paths, Davis (1994) revealed differences for Black males, and Gu (1998) indicated that labor union membership and the unionization of industries played an important role in career mobility. (For studies of changes in inter-generational mobility, see the Social Change section below. )
ii. Verbal Ability
Since the 1970s the GSS has been measuring the verbal ability of Americans with a 10-item vocabulary scale. This scale has been adopted by many other surveys including the 1992 Citizen Participation Study (Verba, Brady, and Schlozman, 1995), the 1999 Work, Poverty, and Evaluation Project by Legal Services of New Jersey, and the 2000 Longitudinal Study of Adult Literacy of the National Center for Adult Learning and Literacy. First, recent analysis of the GSS data on this scale has focused on changes in verbal ability across cohorts. Work by Alwin (1991) and Glenn (1994) found systematic declines in verbal ability within educational levels going back to cohorts early in the century,

but accelerating with the post-World War I1 cohorts. Wilson and Gove (1999a and 1999b) questioned this finding arguing that aging, rather than cohort, was the main factor. In rebuttal Glenn (1999) and Alwin and McCammon (1999) offer additional tests to support the idea that the decline in verbal ability was a function of cohorts rather than aging. Second, the verbal ability scale has been used to challenge the contentions of Herrnstein and Murray in the Bell Curve about intelligence and achievement (Fischer, et al., 1996; Hauser and Huang, 1997; Huang and Hauser, 1998). Finally, the scale has been used in other ways. For example, Weakliem, McQullan, and Schauer (1995) looked at the association between social class and verbal ability and argued that America is moving away from a meritocracy and Zhou (1999) found that verbal ability helps to explain acquiescence bias.
iii. Social Networks
The study of social networks and interpersonal interactions has been facilitated by the inclusion of network grids on four GSSs (1985, 1987, 1990, 1998) as well as items on social support, the social embeddedness of economic transactions, interpersonal socializing, group memberships, and involvement in work organizations. As Wilson (1993) notes, "NORC indicators afford a particularly inclusive and detailed operationalization of kinship bonds." In addition, these items have served as model for many other surveys (e.g. Beggs, Haines, and Herbert, 1996; Blau, Ruan, and Ardelt, 1991; McPherson, Popielarz, and Drobnic, 1992; Ruan, 1998; Ruan, et al., 1997; Schweizer, Schnegg, and Berzborn, 1998; Tigges, Brwone, and Green, 1998; Voelner and Flap, 1995).
Numerous studies have shown that the size, density, and functioning of networks varies appreciably across social groups. Beggs, Haines, and Herbert (1996) found that compared to urban networks, rural personal networks are more kin centered, smaller, denser, and more homogenous on race, education, and religion. Wright (1995) and Moore (1990) showed that social ties in general and friendship ties in particular are heavily gendered and Straits (1996) indicated that this is also true among co-workers. Also looking at work, Carroll and Teo (1996) showed that the networks of managers differ from those of non-managers, being larger and including more co-workers and non-intimates. Goldstein (1999), Reagans (1998), and Schweizer, Schnegg, and Berzborn (1998) demonstrated that race is probably the single, biggest delimiter of social networks and Smith (forthcomingc) presented evidence that the name-generator approach may be the only valid way to measure the level and presence of inter-racial friendships. Also, considerable attention has been devoted to how networks differ across societies (e.g. Bruckner and Knaup, 1993; Fischer and Savit, 1995; Hoellinger and Haller, 1990; Immerfall, 1993; Ruan, 1998; Ruan, et al., 1997; Voelker and Flap, 1995).
Other research shows how social networks are used by people for instrumental and affective purposes. DiMaggio and Louch (1996) compared economic and social theories of economic
transactions. Both economic and sociological theory predict that people will use their social networks to gather information and reduce uncertainty in economic exchanges. But neoclassical economic theory predicts that people would not actually transact disproportionately with people in their own social networks, due to the opportunity costs of thus restricting their range of potential exchange partners. Consistent with sociologyls emphasis on the social embeddedness of economic transactions, analysis indicates that people do tend to purchase homes, cars, and services from people to whom they are connected by friendship or kinship at relatively high levels and that they report greater satisfaction with such purchases than from unconnected people. Conducting risk-bearing transactions within personal networks is a governance structure for consumer markets analogous to contract or internalization in the business-to business markets. Also, Wade, Howell, and Wells (1994) showed how social networks are used during stressful events. While friends make up a large share of most networks, people disproportionately turn to family in times of crisis.
iv. Social Change
The GSS is the single best source of data on trends in social attitudes available. The 1972-2000 GSSs have time trends on 1216 variables. If one looks at each interval between adjoining time points as one observation of change, the GSS has a total of 9747 measurements of change. As Nie, Junn, and Stehlik (1996) have noted the GSS "is the only continuous monitoring of a comprehensive set of noneconomic attitudes, orientations, and behaviors in the United States today." Similarly, as Ladd (1997) has written, "My colleagues and I are partial to surveys that look broadly at a society, examine the social and political values of its people, help us understand where important change is occurring - and, conversely where the persistence of long- standing norms and behavior is the story. Like many researchers, we have admired and made extensive use of the National Opinion Research Center's General Social Surveys - comprehensive social trackings that were begun 25 years ago . . ." Or as Morin (1998) characterized it, the GSS is "the nation's single most important barometer of social trends."
Several general studies of the nature of social change have been carried out. DiMaggio, Evans, and Bryson (1996) looked at whether attitudes had become more polarized over the last generation and found little support the simple, polarization hypothesis. Most scales and items did not become more polarized under several different definitions, although some important, but isolated, examples did emerge. Likewise, most groups believed to differ on social issues actually converged in their attitudes from the 1970s to the 1990s (DiMaggio, Evans, and Byson, 1996; DiMaggio and Bryson, forthcoming). Likewise, Hochschild (1995) found convergence regarding the "American Dreamn across race and class lines between the outlook of the top and bottom thirds of
society. Smith (1994d, 1997f) and Davis (1995) found that most social change in attitudes is 1) slow, steady, and cumulative, and 2) that most social change is explained (in decreasing order of importance) by a) cohort-education turnover models, b) episodic shocks (e.g. wars and political scandals), and c) structural changes in background variables (Davis, 2000).
Many studies of change within particular topics have also been conducted. One of the top areas concerns changes in social capital. Putnam (1995a; 1995b; 1995c; 1996; 2000; Crawford and Levitt, 1998) has argued that social capital (e.g. trust in people, membership in groups, civic ties) is eroding and this is seriously undermining the smooth operation of the political system and society in general. Ladd (1996, 1999) argues that the change is both exaggerated and that what has occurred is not so much a decline, but a reconfiguration of civil society. Along these lines Paxton (1999) finds a mixed pattern of change with a decline in individual trust, no general decline in trust in institutions, and no decline in voluntary associations.
Race relations have been a second major area of focus. Research clearly indicates that intergroup relations are multi- dimensional and multiple indicators are needed to track attitudes towards many different aspects (e.g. target groups, principles, policies, role of government, etc.) Schuman and colleagues (Schuman and Krysan 1999 and Schuman, Steeh, Bobo, and Krysan, 1997) have demonstrated that trends have proceeded at very different rates with quick and large-scale shifts towards the principle of racial equality at one extreme to little or no gain in support for concrete measure to insure equal treatment at the other end. Bobo and Kluegel (Bobo, 1997; Bobo and Kluegel, 1997) concur that positive changes in racial attitudes have stopped short of removing racial disparities and see "stagnationu in the most recent years. Ladd (1995) finds that support for affirmative action fell after the 1970s, but argues that this trend in more anti-government than anti-minority.
Social changes in family values have also been a frequently examined and show a massive shift from traditional to modern attitudes and practices. Smith (1999a) showed that many family values have become less traditional and that the changes in family values were both assisted by changes in family structure and in turn facilitated the shift in the composition of households. Popenoe and Whitehead (1999) focused on the declining centrality of marriage over the last generation. Alwin (1996) showed how the coresidence preferences of families changed both across time and across cohorts. Straus and Mathur (1996) found that support for both spanking and obedience in children declined. Hopkins (1997) indicated that Reiss' autonomy theory helps to explain an increase in both sexually permissive attitudes and behaviors. Brewster and Padavic (1998), Misra and Panigrahi (1995), and Rindfuss, Brewster, and Kavee (1996) isolated gender interaction and cohort effects as the top causes of shifts in gender role attitudes.
Of course the GSS also covers trends in scores of other

areas. For example, Davis and Robinson (1998) showed a notable shift in the class identities of married couples with both husbands and wives increasingly using the wives' characteristics in assessing their own class identity. Hunt (1999) indicated that the Hispanics have become less Catholic both across time and across immigrant generations. Firebaugh and Harley (1995) found that the class difference in job satisfaction have attenuated over time .
A final example, outside the attitudinal area, deals with occupational mobility. Since Occupational Change in a Generation I1 in 1973, the GSS has been the main source of data on changes in intergenerational mobility. As Mare (1992) noted "Except for the NORC General Social Survey (GSS), we have no standard vehicle for monitoring the process of social stratification . . . " Recent examinations of the trends in mobility include Davis (1994), Hauser (1998), and Hout (1997).
v. Cross-National
With 16 completed and released modules and 1208 usages ISSP has produced a body of research has been almost as wide ranging and difficult to summarize as the GSS in general. To illustrate the cross-national research, examples have been selected from the work on 1) social inequality, 2) religion, 3) family, 4) work orientation, and 5) national identity.
First, cross national differences in perceptions of class conflict and the degree of social inequality and support for governmental policies to deal with same have been studied (e.g. De Graaf, Nieuwbeerta, and Heath, 1995; Evans, 1995; Evans, Kelley, and Kolosi, 1992; Kelley and Evans, 1993, 1995; Matheson and Wearing, 1999; Svallfors, 1995, 1997; Taylor-Gooby, 1995). One result showing up across a range of different analyses of social inequality is that a major cross-national divide prevails between the political cultures of Europe and her overseas off- shoots. In the Welfare Democracies of Europe (e.g. Britain, Italy, Germany) and former Socialist nations, support for both government benefit programs and programs to reduce inequality is high. In Capitalist Democracies such as America, Australia, and Canada support for entitlements is moderately lower and support for levelling programs is markedly reduced. In the immigrant/pioneer societies in North America and Oceania there is more concern with opportunity and less with equality. In the welfare and ex-Socialist states of Europe security and equality of outcome are the main concerns (Evans, 1995; Matheson and Wearing, 1999; Svallfors, 1997). For example, this is shown by differences in the acceptable magnitude of wage differences (Kelley and Evans, 1993). ISSP asked people to indicate what wages various, specific low, middle, and high status occupations should earn. Americans favored the highest income differential between the top and bottom, while the ex-Socialist states of Poland and Hungary approved of less than half the differential endorsed in the US. The Western European, welfare states fell

between these extremes. Other studies explain why the connection between class
position and class voting is weaker than one would otherwise expect. De Graaf, Nieubeerta, and Heath (1995) found that class of origin as well as current class must be considered and there is a "process of acculturation to the class of destination." Kelley and Evans (1995) showed that objective status measures must be augment by measures of self-identification and images of class structure to understand why people vote for working- or middle-class parties.
Second, both religious beliefs and behaviors and the impact of religion on values and attitudes have been examined (e.g. Davis and Robinson, 1999; Dekker, Ester, and Nas, 1997; Dogan, 1995; Feldkircher, 1998; Gautier, 1997; Greeley, 1994; Greeley, 2000;Greeley and Hout, 1999; Harley, 1996; Hayes, 1995; Hayes and Hornsby-Smith, 1994; Kelley and de Graaf, 1997; Pammett, 1997; Roof and Aagedal, 1996; Smith, Sawkins, and Seaman, 1998). For example, Greeley (1994, 2000) and others (Gautier, 1997) have documented a major religious revival in Eastern Europe after the fall of Communism and others have studied secularization outside of this region (Dogan, 1995; Feldkircher, 1998; Harley, 1996) . Kelley and de Graaf (1997) showed that the religious climate of a country affects the religious beliefs and behaviors of individuals and specifically that people living in religious nations acquire more traditional religious beliefs in proportion to the religiosity of other citizens, 2) in more secular nations family religiousness strongly shapes children's religious beliefs, while the national religious context is less important, and 3) in more religious nations family religiousness has less impact on children and the pro-religious, national context plays a bigger role. Roof and Aagedal (1996) also found similar cohort and life cycle effects for the baby boom generations across countries.
Also, religious background exerts a major influence in shaping non-religious attitudes. Davis and Robinson (1999) showed that, counter to common expectations, on economic concerns secularists are more likely to be against state assistance, while orthodox religionists are more supportive of economic justice. Pammett (1997) and Dekker, Ester, and Nas (1997) found that religious beliefs in the sacredness of nature can be an important general source of support for pro-environmental policies and outlooks. Large impacts were also found on family and political attitudes; even in countries generally secular in profile (Hayes, 1995; Hayes and Hornsby-Smith, 1994).
Third, cross-national differences in family values have been examined (e.g. Haller and Hoellinger, 1994; Hayes, 1994; Jones and Brayfield, 1997; Scott, Alwin, and Braun, 1996; Scott, Braun, and Alwin, 1998; Haller, Hoellinger, and Gomilshack, 1999; Sundstroem, 1999). Jones and Brayfield (1997) showed that the centrality of children varies notably across countries. Having modern views on gender role is associated with seeing children as less central, but many other associations are culture specific.

For example, gender is unrelated to views of children in four counties, but in Great Britain and the Netherlands men see children as more central than women do. Other researchers found that the close link between family structure and family values discussed above holds across societies (Haller, Hoellinger, and Gomilschak, 1999). For example, among women involvement in work outside the home is one of the strongest predictors of favoring modern, gender roles across countries (Crompton and Harris, 1997; Panayotova and Brayfield, 1997; Scott, Alwin, and Braun, 1996; Scott, Braun, and Alwin, 1998).
Fourth, cross-national differences in work orientation and organization have been examined (e.g. Blanchflower and Freeman, 1992; Haller, 1998; Kalleberg and Stark, 1993; Roberts and Baugher, 1995, forthcoming; Russell, 1998; Tarnai, et al., 1995; Western, 1994). Kalleberg and Stark (1993) found that market structures influence work values and career strategies. Americans are more interested in promotion and advancement, while Hungarians place more emphasis on "leisureH time so they can pursue second-economy jobs. Birdi, War, and Oswald (1995) showed that age has different relationships with various components of occupational well-being. Job boredom declined with age, job stress rose, then fell with age, and job satisfaction fell, then increased with age. Western (1994) showed that the level of unionization is greatest where there is centralized collective bargaining and unions perform quasi-governmental functions. Blanchflower and Freeman (1992) further found that the low unionization level in the United States is furthered by the high union premium that exists there. This both tends to make union workers uncompetitive and encourages companies to resist unionization. Roberts and Baugher, 1995 and forthcoming) examined the relationship between exposure to dangerous work and job strain. Job stress was found to be higher among those with unhealthy and dangerous jobs (which are more common among the working class), but, controlling for these physical factors, job stress was higher among the middle class. Russell (1998) indicated that high welfare benefits do not depress levels of commitment to work, but lack of job security and employer dedication to workers does reduce both organizational loyalty among employees and general commitment to work.
Fifth, the national identity module has been used to examine the shifting role of the national state as its position has been changed both from above by regional and international organizations (e-g. EU, NAFTA, NATO, UN, WTO) and from below by movements for autonomy and local, self-government and to determine the cultural identity and distinctiveness of individual countries (e.g. Grytten, 1998; Haller, 1999; Hernes and Knudsen, 1997; Hjerm, 1998; McCrone and Surridge, 1998; Nedomova and Kostelecky, 1998; Smith and Jarkko, 1998). For example, Smith and Jarkko (1998) showed that national pride in ten domains was determined by a combination of objective conditions and a people's understanding of their history. Smith and Jarkko (1998) also showed that national pride was uniformly lower among ethnic,

racial, religious, linguistic, and regional minorities in all countries and that national pride has declined across birth cohorts in almost all countries.
Finally, examples of other cross-national research include that 1) after the fall of Communism political tolerance in Poland rapidly came to resemble the American pattern in terms of both levels of acceptance and the structure and correlates of support (Karpov, 1999); 2) Scott (1998) examined changes in support for legal abortions and advanced a model that argues that generational succession, secularization, and increased gendering of the issue will augment support for abortion rights in most countries, 3) Lapinski, et al. (1998) looked at attitudes towards welfare and the unemployed and found little support for the microfoundations of the theories of welfare state development of Esping-Andersen and others; and 4) Luo (1998) found that attitudes towards specific welfare policies were not shaped directly by SES, but via SESrs impact on more general attitudes about government responsibilities and the nature of income inequality in the society.
c. Methodological Research
The GSS has always given the highest priority to maintaining data quality and minimizing measurement error. In part this has been carried out by the adoption of rigorous standards in the design and execution of the GSS (e.g. full-probability sampling, pretesting and careful item development, maintaining a high response rate, data validation, data cleaning, etc.). In addition, this has been achieved by carrying out one of the most extensive programs of methodological research in survey research. The project has 93 GSS Methodological Reports that use both experimental and non-experimental designs to study virtually all aspects of survey error. Among the topics covered are: 1) the reliability and validity of behavioral reports (Smith, 1998a; Smith, forthcominga), 2) test/re-test reliability (Smith and Stephenson, 1979) ; 3) sample-frame comparability (Smith, Shin, and Tong, 1996); 4) sensitive topics (Smith, 1998a; Smith, 1999b; Tourangeau and Smith, 1996; Tourangeau and Smith, 1998) ; 5) third-person effects (Smith, 1997~); 6) education/age-cohort interactions (Smith, 1993c; Smith, 1995b; Smith, 1997a); 7) non- response bias (Smith, 1993b; Smith, 1995c; Smith, 1998b; Smith, 2001b), 8) the measurement of race and ethnicity (Smith, 1995a; Smith, 1997e; Smith, 2001); 9) context effects (Smith, 1991b; Smith, 1994c; Smith, 1997b); 10) question wording (Smith, 1987a; Rasinski, 1988; Smith, 1995d); 11) scale construction (Nakao and Treas, 1990; 1992; 1994; Smith, 1993a; 1994b; 1996); 12) item non-response (Smith, 1991a; Smith, 1999b), and 12) cross-national comparisons (Harkness, et al., forthcoming; Smith, 1997d; Smith, f orthcomingb) .
The Case for the GSS
1. Cost Effectiveness
All large-scale, high-quality data collection projects need considerable resources and cost in the millions. For example, the budget for the Panel Survey of Income Dynamics for 2002-2006 is $23,000,000, the first three rounds of the National Educational Longitudinal Study for the National Center for Educational Statistics in 1988-1994 cost $35,000,000, a single round of the 1997 National Longitudinal Survey of Youth for the Bureau of Labor Statistics takes $7,000,000, the 1998 Survey of Consumer Finance for the Federal Reserve cost $5,000,000, and the National Treatment Improvement Evaluation Study in 1992-1997 for the Center for Substance Abuse cost $12,000,000. (See also comparison in Brady, 2000, n. 4.)
At over $2 million per annum the GSS is not cheap, but it is cost effective. When one considers the amount of data collected, the unit costs, the quality of the data, and the level of usage, it is clear that GSS is an extremely efficient and valuable data collection program. As the Office of Inspector General of NSF has noted, "We were impressed by the care and efficiency with which data collection and preparation for the GSS are executedn and the Directorate for Social, Behavioral, and Economic Sciences has noted that "the GSS is a leader within the social sciences in setting high standards for swift and accurate archiving . . . " (Office of Inspector General, 1994).
Each year the GSS collects an enormous amount of data. If we think of one variable times one respondent as a datum, the GSS collects over a million pieces of data per survey. As Table 6 shows, the amount of data collected by the GSS has grown notably over the years. Currently the GSS collects around 2,000,000 pieces of data per survey, 8-9 times more than in 1972. Moreover, the GSS has also expanded in ways not captured by these figures. First, open-ended variables coded expanded from 6 before 1991 to 8 in 1991, 12 in 1993, 22 in 1993, 41 in 1996, and 25 in 1998. Second, these figures do count data collected by other countries as part of ISSP. Third, they iqnore data from reinterviews and follow-up studies. Both of these have also increased over time.
The increase in data collected has been achieved with modest additions to the field costs. As Table 7 shows, the field costs since 1977 have increased at only 4% per annum in constant dollars. Since the amount of data being collected has increased much more rapidly, the cost per datum in constant dollars has fallen from 22-24 cents to 14.5-18.5 cents.
Another way in which the GSS is cost effective is that the data collected both continues to be used and becomes more valuable with time. Most social science data collected 20+ years ago have been long forgotten and are frequently no longer even available. GSS data back to 1972 are as readily available as the latest data and as regularly utilized. Moreover, since longer and historically more important time periods are continually being tapped, the data are actually more useful to social scientists
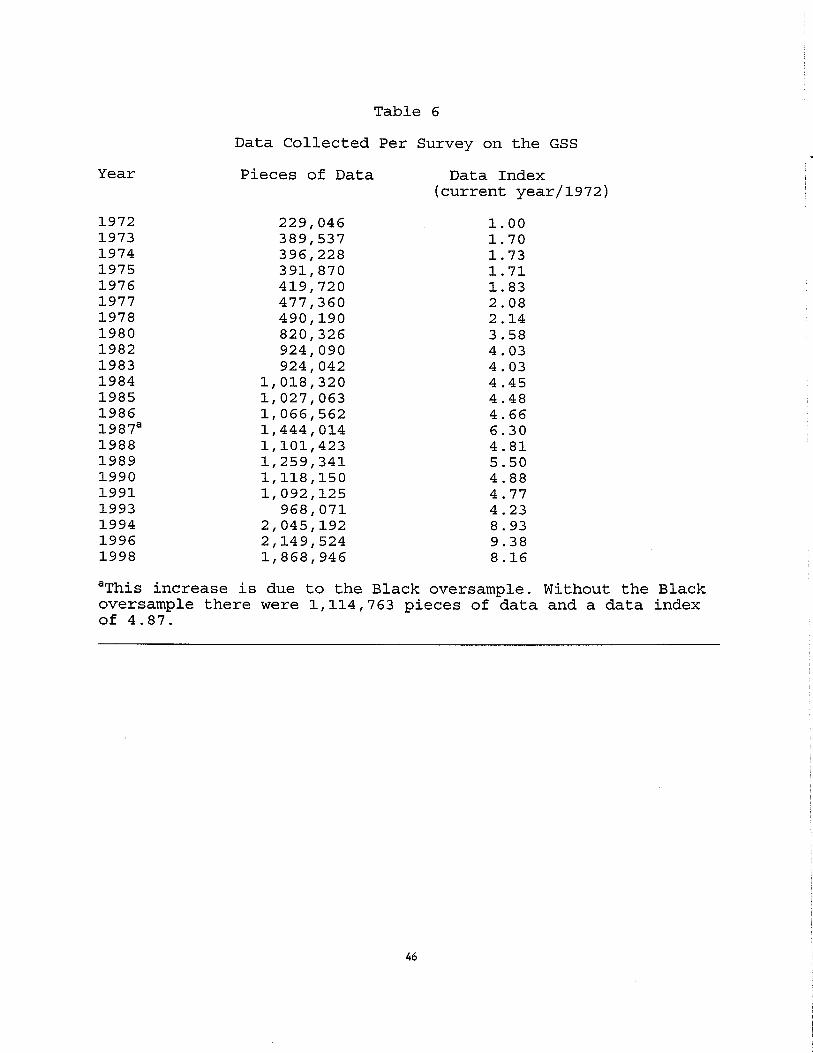
Table 6
Year
Data Collected Per Survey on the GSS
Pieces of Data Data Index (current year/1972)
aThis increase is due to the Black oversample. Without the Black oversample there were 1,114,763 pieces of data and a data index of 4.87.

Table 7
Data Collection Costs on the GSS for Full-Probability Surveys, 1977-1998
Year Cost in Constant Dollars (1967) Cost per Datum
a~ncludes cost of 1982 Black oversample. b~ncludes cost of 1987 Black oversample. Cost per datum for cross-section was $ 0.13. C~xcludes all data collected as part of NOS. d~xcludes all data collected as part of Sibling Survey. Represents costs of double sample.
now than when they were first collected. In addition, the GSS data are of the highest quality. In
terms of sampling procedure, response rate, validation procedures, data cleaning, and quality control the GSS meets the most demanding standards of contemporary survey research. As Gilderbloom and Markham (1995) note the GSS is "one of the most sophisticated, reliable, and valid surveys of U.S. residents." Likewise, Sniderman and Carmines (1997) have observed that the GSSs "have worked assiduously on the training of interviewers and no less importantly on the wording of the questions themselves, in an effort to assure respondents of anonymity, to put respondents at ease, to establish rapport, and to persuade respondents they can say what they really think." Also, as DiMaggio and Pettit (1999) summed it up the GSS is "probably the highest quality ongoing sample survey of social attitudes in the U.S."
Moreover, a significant share of GSS operating costs are no longer supported by NSF1s grants to NORC. While NSF covered 100% of the data collection costs of the GSS before 1986, it provided

only 88% in 1993-96, and around 60% in 1996 onwards. In recent years the GSS has raised funds from a wide variety of private and governmental sources outside of NSF (1994: CDC, Greeley, Office of Naval Research (ONR); 1996: Aspen Institute, CDC, Institute for Social Research -Norway, MacArthur Foundation, Office of Naval Research, Eleanor Singer, University of North Carolina; 1998: Academia Sinica, AARP, Fetzer Institute, Lilly Corporation, Lilly Endowment, NIMH, and 2000: American Jewish Committee, Carneige, Greeley, CDC, Lilly Endowment, Mellon, NIH, Notre Dame, ONR, Rice University). In addition, the GSS has received support from independent NSF grants to Stanley Lieberson (1994), Robert Hauser and Robert Mare (1994), and DiMaggio and Robinson (2000).
Cost sharing is even greater regarding ISSP. NSF supports only the US data collection costs. The cost of all other nations, the archiving costs, and organizational costs are covered by others.
Not only does the GSS collect an enormous amount of high quality data at a low and stable per unit cost, but the data are widely used. When the cost of the GSS is allocated across the hundreds who do research papers annually and the thousands who use the GSS in classrooms, one clearly sees how cost effective it is. For example, if we allocate the total data collection costs (NSF + non-NSF funding) to known research usages (giving no credit to unlocated research usages, research in progress, teaching uses, student papers, and non-research uses), we see that the survey costs per research usage averaged $3,871 for the last two GSSs (1996 and 1998). When the total number of estimated pieces of research are used, the data costs per research uses in 1996-1999 falls to about $2,500 per research use.
2 . V a l u e of G r o w i n g T i m e Series
As the GSS time series lengthens, we place more time under observation and thus extend our understanding of social change. We can increasingly distinguish between short-term fluctuations and long-term trends and apply models to explain the trends. In addition, three very useful analytical approaches are beginning to become feasible and widely used. First, cohort analysis can now be done over a 30-year period. While this is only about half of the average adult life span, it is now possible to follow numerous cohorts through major segments of the adult life cycle (Davis, 1995; Firebaugh, 1997). Second, it is possible to combine together sub-group analysis and trend analysis. One can aggregate across four GSSs and still have observations at seven time points (e.g 1972-1975, 1976-1980, 1982-85, 1986-89, 1990-93, 1994-96, and 1998-00). This strategy has been used both within the GSS (e.g. to study changes in social mobility and the attitudes of Jews on racial equality) and to compare the GSS to earlier benchmark studies (e.g. OCGI and OCGII). Third, with 24 observations, econometric time-series analysis is becoming more practical and reliable (Stimson, 1999; DiPrete and Grusky, 1990; Marshall, 1989) .
The value of the GSS time series is enhanced by the fact the time series are non-reactive. In most media and commercial polls items are included when events make the topic "hotn or newsworthy (Yankelovich, 1996). This creates a very biased sample of time. It is the social science equivalent of meteorologists only measuring rainfall during droughts or torrential downpours (Smith, 1987a). Examples of this in the social sciences are the clustering of items on gender roles during the World War I1 "Rosy-the-Riveteru period and the post-women's rights period since the late 1960s, with almost no observations during the Baby Boom of the 1950s or in the first two-thirds of the 1960s and the clustering of political questions during election campaigns and of economic questions during recessions (Smith, 1987a) . 3. International Comparative Data
Increasingly social scientists are realizing not only the utility, but the necessity of comparative research (Bollen, Entwisle, and Alderson, 1993; Bamyeh, 1993). Genov (1991) has observed that "contemporary sociology stands and falls with its own internationalization ... . The internationalization of sociology is the unfinished agenda of the sociological classics. It is the task of contemporary and future sociologists." As the Working Group on the Outlook for Comparative International Social Science Research has noted, "A range of research previously conceived as 'domestic,' or as concerned with analytical propositions assumed invariant across national boundaries, clearly needs to be reconceptualized in light of recent comparative/international findings." Unless a comparative perspective is adopted, "models and theories will continue to be idomestici while the phenomena being explained are clearly not (Luce, Smelser, and Gerstein, 1989) . "
Cross-national research allows us to compare human and social processes across different nations. It puts each nation's experience into comparative perspective. It allows us to identify both general patterns that prevail across human societies and to measure the variations that occur in patterns. On the one hand, cross-national replication of findings indicates that the examined relationships are generalizable and may apply to industrial societies in general. Similarly, models that work in the same manner across nations can be considered robust and well- specified. On the other hand, differences across nations indicate that the process being studied is contingent on particular aspects of the various societies and that these differences (e.g. in cultures, social structure, political systems, historical development) must be incorporated into any general model of the phenomenon under investigation. Thus, social science knowledge is advanced by cross-national research both when similarities and when differences are found.
Fortunately the social sciences are increasingly recognizing the advantages and necessities of cross-national research. As Roberta Miller has noted, one of the major recent changes in the

social sciences has been that they are "beginning to emphasize the global rather than the national basis of a growing number of social and institutional phenomena (1992)." Prominent in this growing recognition has been the work of ISSP which Alex Inkeles (1995) has lauded as "making a great contribution for everyone working to understand social processes, both in the US and world wide." Likewise, Brady (2000) described ISSP as one of the nine most influential cross-national studies ever conducted.
In accordance with these goals, ISSP has well accomplished its primary goal of establishing and conducting a significant program of cross-national social science research.
First, ISSP has succeeded in constructing a permanent infrastructure for cross-national social science. A collaborative structure and network of relationships have been established that has successfully carried out 16 rounds of international research with an ever increasing number of nations. ISSP advances cross- national research from being ad hoc and intermittent to being routine and continual. It makes cross-national research a basic part of the national research agenda of each participating country.
Its success is further shown by its growth and productivity. From its inception in 1984 it has grown from 4 to 37 nations with continuing expansion assured. ISSP has also been highly productive. Through the first 16 modules (1985-2000) 285 national surveys have been conducted with over 392,000 respondents.
Second, ISSP has been popular with the social science community. From the national archives in Britain, Germany, and the United States alone copies of 3,815 ISSP files have been ordered by social scientists and over 1200 research reports have been documented in the ISSP bibliography.
Third, ISSP is very cost effective. By collaborating with distinguished social science institutions around the world, the GSS obtains comparable cross-national data that greatly enhance its scientific value of the American data at virtually no additional cost. Cross-nationally each country finances only its own data collection costs and the data from all other nations are shared without charge. In effect, one pays for one survey and gets 38+ surveys. By fully following a collaborative design ISSP minimizes research costs while maximizing data collection.
Finally, the continuing relevance and importance of ISSP to the social science community is assured by the established standing of the institutions involved (e.g. research centers such as NORC, NCSR (formerly SCPR), and ZUMA and universities such as Bergen, Warsaw, Tel Aviv, Carleton, Australian National, etc.). In addition, when each module is designed, dozens of social scientists from around the world are consulted by the drafting committee and by individual ISSP countries. In the US case the Board of Overseers selects a specialist in the field to work on the module. Then, after the GSS PIS and those from other countries design the ISSP module, the GSS Board of Overseers reviews the module and approves its inclusion.

4. Putting Data in Context
The GSS has always emphasized integrating social data in broader context rather than collecting, isolated social facts. The GSS has done this by a) replicating items across to compare the present to the past (and eventually the future through the continuing time series), b) collaborating in cross-national research to compare the United States to other societies, and c) covering a wide range of topics so that attitudes and behaviors in different areas (e.g. inter-group relations and religious beliefs and practices; civil liberties and voluntary group membership; attitudes of welfare, government powers, and minorities) can be inter-related and the complicated, inter- locking structure of society more fully investigated. We plan to build on this foundation both by adding a rich array of geographical data to the GSS records and by carrying more auxiliary studies that both study social units beyond the individual and relate individuals to these institutions and organizations.
5. Replication vs. Innovation
The GSS carefully balances the need to replicate, which is essential for both studying social change and the pooling of observations for sub-group analysis, with the urge to innovate, which opens up new research areas and permits measurement improvements. We find the mix utilized in recent years of having about half core items and half items in modules to represent a productive blend of the two. Similarly, in the replication of ISSP modules typically about two-thirds of the previous content is repeated and one-third consists of new items.
The GSS balance has allowed not only the building up of over a thousand times series and the pooling of cases to examine both many small, but important, social groups and complex social models, but many, major new innovations such as the first national networks study, the first national epidemiological study of emotions, the first national sample of congregations, and pioneering measures of negative, ethnic images, mental health prejudice, and gender roles. Moreover, the contextual geographic data and the auxiliary studies will generate further ground breaking research.
Moreover, GSS content is undergoing continual review by the PIS and Board of Overseers. For example, in 1993-94 a comprehensive review of the core was carried out, in 1993-95 race questions in the core were reviewed and revised, and in 1996-99 gender and family questions underwent a similar evaluation. These reviews lead to the continual refreshing of GSS core content.
5. Summary
The GSS has aptly and repeatedly been described as a "national resourceu (Alwin, 1988; Firebaugh, 1997; Working Group

on Large-Scale Data Needs in Luce, Smelser, and Gerstein, 1989), as "one of the country's true national research treasures (Morin, 1996)," as a "public utility for the community at largen (Office of Inspector General/NSF, 1994), as having revolutionized the study of social change (ICPSR, 1997)," "a major source of data on social and political issues and their changes over time (AAPOR Innovators Award, 2000),u and, as the American Sociological Association testified before Congress, GSS "data are both rigorous and exceptionally useful (Levine, 1996)."
In order to serve the social science community the GSS draws heavily upon that community of scholars in the selection and development of modules and items. Between the Board and developmental committees hundreds of researchers have participated in the design of GSS components. Then the GSS provides quick, equal, and easy access to the data which in turn leads to widespread utilization of the data by thousands of social scientists and hundreds of thousands of their students. It is not only widely used in the United States, but especially through ISSP is used by scholars around the world.
The known GSS research usages number over 7,000 including over 3,000 peer-reviewed articles in sociology, political science, and related disciplines. Usage has been especially strong in the top sociology journals where only data collected by the Bureau of the Census are used more frequently than the GSS.
In sum, the GSS produces top-quality, representative data for the United States and through ISSP in many other countries on topics of fundamental importance to the social sciences, is extremely widely used in both teaching and research, and has considerable expanded the knowledge base in the social sciences in a very cost effective manner.

References
Allen, Michael Patrick, "The lQuality' of Journal in Sociology Reconsidered: Objective Measurers of Journal influence,^ ASA Footnotes, (Nov., 1990) , 4-5.
Alwin, Duane F., llCoresidence Beliefs in American Society - 1973 to 19911M Journal of Marriaqe and the Family, 58 (May, 1996), 393-403.
Alwin, Duane F., "Family of Origin and Cohort Differences in Verbal Ability," American Socioloqical - Review, 56 (1991), 625-638.
Alwin, Duane F., "The General Social Survey: A National Data Resource for the Social science^,^ Political Science and Politics, 21 (Winter, 1988), 90-94.
Alwin, Duane F. and Krosnick, Jon A., "The Reliability of Attitudinal Survey Data: the Impact of Questions and Respondent characteristic^,^ GSS Methodological Report No. 61. Chicago: NORC, 1989.
Alwin, Duane F. and McCammon, Ryan J., "Aging Versus Cohort Interpretations of Intercohort Differences in GSS Vocabulary ScoresIs1 American Sociolosical Review, 64 (April, 1999), 272-286.
Anderson, Richard H., llComputers, Statistics, and the Introductory Course," Teaching Sociolos~, 18 (April, 1990), 185-192.
Arber, Sara, "Using Teaching Datasets," ESRC Data Archive Bulletin, No. 55 (January, 1994) , 7.
Babbie, Earl, personal communication, February 20, 1996.
Babbie, Earl and Halley, Fred, Adventures in Social Research: Data Analvsis Usinq SPSS. Thousand Oaks, CA: Pine Forge Press, 1994.
Bamyeh, Mohammed A., llTransnationalism,ll Current Socioloqy, 41 (1993), 1-95.
Beggs, John J.; Haines, Valerie A.; and Berbert, Jeanne S., "Revisiting the Rural-Urban Contrast: Personal Networks in Nonmetropolitan and Metropolitan Settings," Rural Sociolosv, 61 (1996) , 306-325.
Beveridge, Andrew A. and Seiler, Lauren H., "Integrating Social