Embed Size (px)
Citation preview

IEEE RELIABILITY SOCIETY SECTION
Received December 8, 2020, accepted December 21, 2020, date of publication January 11, 2021, date of current version January 21, 2021.
Digital Object Identifier 10.1109/ACCESS.2021.3050877
A Generalised Methodology for the Diagnosisof Aircraft Systems
CORDELIA MATTUVARKUZHALI EZHILARASU , ZAKWAN SKAF, AND IAN K. JENNIONSIntegrated Vehicle Health Management (IVHM) Centre, Cranfield University, Cranfield MK43 0AL, U.K.
Corresponding author: Cordelia Mattuvarkuzhali Ezhilarasu ([email protected])
This work was supported by Boeing Company, as part of their collaboration with Cranfield University IVHM Centre.
ABSTRACT An aircraft is made up of a number of complicated systems which work in harmony to ensure
safe and trouble-free flight. In order to maintain such a platform, many diagnostic and prognostic techniques
have been suggested, mostly aimed at components but some at the system level. Together these form a
patchwork approach to the overall problem of efficiently informing aircraft maintenance to the Original
Equipment Manufacturers, the operators /airlines, and the Maintenance, Repair, and Overhaul organisations.
It involves these organisations having to support several different approaches to aircraft health management,
and is therefore inefficient and costly. In the current work, a streamlined methodology is put forward. This
is based on OSA-CBM (Open System Architecture for Condition Based Maintenance) and can be applied to
any aircraft system. Integral with this is the use of mRMR (minimum redundancy maximum relevance) for
feature selection, the resulting symptom vector being used for fault diagnosis. This approach is demonstrated
on three test cases: the engine, the environmental control system, and the fuel system. In each case, the digital
twin setup, simulation conditions for healthy and faulty scenarios, a methodology based on OSA-CBM up
to diagnostics are detailed. Diagnostics is carried out for each system in turn, using four machine learning
supervised algorithms. The best performing algorithm for each system will then subsequently be used in a
vehicle level reasoner called FAVER (A Framework for Aerospace Vehicle Reasoning), which requires these
system diagnoses as a starting point for vehicle reasoning and fault ambiguity resolution.
INDEX TERMS Aircraft systems, OSA-CBM, diagnosis, digital twin, minimum redundancy maximum
relevance.
I. INTRODUCTION
An aircraft is a complex machine made up of multiple sys-
tems, as detailed by the FAA [1]. These systems are usually
built-in isolation and assembled together on a common plat-
form. Every aircraft system, such as the engine, the environ-
mental control system (ECS), the fuel system, the electrical
power system (EPS), the pneumatic system, or the auxiliary
power unit (APU), has functions of its own and objectives
to satisfy at different levels [2]. These objectives may range
from the component level (e.g., the blade of a compressor
in an engine), the line replaceable unit (LRU) level (e.g.,
gearbox assembly in an engine), the subsystem level (e.g., the
engine compressor), the system level (e.g., the engine) or the
overall vehicle level (the aircraft). One of the most important
objectives of these aircraft systems, at any level, is to perform
The associate editor coordinating the review of this manuscript and
approving it for publication was Yu Liu .
safely at their optimal health and efficiency, contributing
to the best performance of the aircraft, as well as saving
the cost and time involved in maintenance, and unexpected
downtime. In order to achieve this objective, Integrated Vehi-
cle Health Management (IVHM) uses technology across
numerous sources like sensor data, fleet history, maintenance
records, and design documents to monitor and assess the
health of the concerned asset (component/ LRU/ subsystem/
system/ vehicle), to diagnose any fault present in the asset
and then to prognose its remaining useful life. In this way,
IVHM capability enables aircraft Condition-Based Mainte-
nance (CBM), resulting in the achievement of cost and time
saving [3].
Currently, IVHM’s principal focus is on components and
LRUs, with subsystems and systems receiving less attention.
For example, the Model-based Avionics Prognostic Reasoner
provided a solution for non-intrusively monitoring the health
and predicting remaining useful life for Electro Mechanical
VOLUME 9, 2021This work is licensed under a Creative Commons Attribution 4.0 License. For more information, see https://creativecommons.org/licenses/by/4.0/ 11437

C. M. Ezhilarasu et al.: Generalised Methodology for the Diagnosis of Aircraft Systems
FIGURE 1. The schematic of FAVER.
Actuators by using exclusive algorithms and reasoning tech-
niques [4]. Similarly, a high frequency vibration monitoring
system was developed to detect and isolate incipient faults in
critical rotary components in engines, gear trains, and gener-
ators. [5]. On the other hand, a framework based on symbolic
dynamic filtering was developed to isolate faults in engine
subsystems by interpreting and fusing data from multiple
sensors in order to extract maximum information from the
features [6]. These works show the extensive research carried
out to isolate faults in components, LRUs, and subsystems in
the aircraft.
However, none of these developments offers a rigorous
process for the development of aircraft system diagnostics.
A process that can effectively and efficiently inform aircraft
maintenance to the OEM (Original EquipmentManufacturer)
and the MRO (Maintenance, Repair, and Overhaul) organi-
sations is needed. Such a system, based around OSA-CBM,
is proposed here.
The idea for such an approach originated from a wider
project named FAVER (Framework for Aerospace Vehicle
Reasoning). The effect of the health state of one aircraft
system over another due to their interactions, i.e., health
assessment at the vehicle level, is not explored much in the
technical literature, contributing to one of the significant
gaps in the field of IVHM [7]. Aircraft accidents like the
engine rollback incident on a Boeing 777 (2008) caused by
a block in the fuel oil heat exchanger, and the emergency
evacuation incident in a Fokker F28 (2002) caused by smoke
in the cabin as a result of a crack in the APU compressor
blade, are real life examples for multiple aircraft systems
affected due to their interactions [2]. Isolating such cascading
faults involves complex troubleshooting activities resulting in
loss of time and increased cost due to extended downtime
and prolonged maintenance. To address this gap, FAVER
(fig 1) was proposed to isolate root causes and the effects
of cascading faults considering the health of multiple aircraft
systems using the concepts of reasoning and digital twins [2].
In FAVER, there is a need for diagnostics built for each
system under consideration, and hence the idea for generating
such diagnostics in a rigorous manner emerged.
A. FAVER: A FRAMEWORK FOR AEROSPACE VEHICLE
REASONING
While the concept of digital twins has been used across
IVHM in a variety of roles [3], FAVER simulates multiple
aircraft systems interacting with each other to demonstrate
and isolate the effects of cascading faults at the vehicle level.
Fig 1 shows the overall working mechanism of FAVER.
As seen in the bottom row of fig 1, FAVER demonstrates
the interaction between aircraft systems using digital twins
and for the Electrical Power System (EPS), the engine, and
the Environmental Control System (ECS), and hardware in
the loop for the fuel system. The fuel system supplies fuel
to the engine, the engine provides shaft power to the EPS
and bleed air to the ECS, and the EPS provides electricity to
the other three systems. Once the digital twin layer produces
results for healthy conditions, and with certain fault modes,
their health information is processed through diagnostics set
up at the individual system level, as shown in the middle
rows of fig 1. This is the subject of the current paper. Later,
symptom vectors made from the health information from
simulations of these individual digital twins, along with their
diagnostic results, will be used by FAVER’s reasoning as
shown in the top row of fig 1, to identify the root cause and
the effects on the interacting systems at the vehicle level.
B. THE NEED FOR A GENERALISED METHODOLOGY FOR
THE DIAGNOSTIC PROCESS
Across the industry, maintenance of aircraft is mostly done by
the OEMs or MROs. The format of health data acquired from
11438 VOLUME 9, 2021
C. M. Ezhilarasu et al.: Generalised Methodology for the Diagnosis of Aircraft Systems
aircraft systems and the techniques applied by those carrying
out, and troubleshooting, maintenance will vary considerably
from platform to platform due to a lack of standardisation and
development.
The functioning of IVHM systems at the systems level
is not affected by the differences in the way health data is
processed. However, in the case of a platform reasoner such
as FAVER, since the reasoning is done at the overall aircraft
level, processing data and carrying out the diagnosis for all
concerned aircraft systems becomes complicated and tedious,
especially when they are done using different methodologies.
Hence, there is a need to implement a generalised method-
ology to identify and streamline the repetitive steps involved
in the diagnostic process. This will help save time spent in
developing diagnoses for each aircraft system and make the
overall aircraft level health reasoning faster and more practi-
cable; to serve this purpose, the Open Systems Architecture
for Condition-BasedMaintenance (OSA-CBM) framework is
employed.
This article demonstrates the application and usefulness
of OSA-CBM as a generalised methodology for developing
diagnostics for different aircraft systems. Section II focuses
on the OSA-CBMmethodology, and the steps involved in the
process. Section III demonstrates the role of the OSA-CBM
methodology through three different aircraft system use
cases: the engine, the ECS, and the fuel system. Section IV
provides the diagnosis part of these use cases, and Section V
summarises the article and discusses ideas for future work.
II. THE OSA-CBM METHODOLOGY
OSA-CBM was developed in 2001 by an industrial team
partially funded through a Dual Use Science and Technol-
ogy (DUST) program [8]. Its aim was to define and develop
open standards for distributed CBM. OSA-CBM implements
ISO 13374 [9], Condition Monitoring and Diagnostics of
Machines, to define the open standard. This standard breaks
down the data collection, processing, and information flow
into the six layers shown in fig 2. It defines the interfaces
(data structure and interface methods) between each step and
so, indirectly, what can happen in each of the layers [10]. Each
layer is briefly described here.
Data Acquisition: Data is acquired from the target asset
using sensors and other measuring devices, historical data,
maintenance records, design documents, and other relevant
information.
Data Manipulation: The collected data is preprocessed
and made useful for further processing. This step could use
feature extraction and feature selection processes.
State Detection: The processed data is used to monitor the
current condition of the asset. This is done by comparing
features against expected values, or operational limits and
outputs enumerated condition indicators (e.g. low, normal,
and high.
Health Assessment: This stage determines if the health of
a monitored system or subsystem is degraded. Several types
of diagnostic algorithms, such as model-based, data-driven,
FIGURE 2. The Open Standard Architecture - Condition BasedMaintenance (OSA-CBM) framework.
or hybrid algorithms, are used to assess the health of the asset.
This layer generates a diagnostic record that proposes one or
more possible fault conditions with associated confidence.
Prognostic Assessment: The remaining useful life and the
future performance of the asset are then projected based on
its state estimation results. In some cases, uncertainty propa-
gation is also estimated using prognostic algorithms.
Advice Generation: Provide recommended actions and
alternatives. Depending upon the applications, recommenda-
tions may include maintenance action schedules, modifying
the operational configuration, or modifying mission profiles.
BecauseOSA-CBM is a standard and is not an instantiation
of that standard, the above layer descriptions are open to inter-
pretation and are given here for general guidance. OSA-CBM
is defined using unified modelling language (UML), and
is designed to enable multiple types of information to be
processed without involving the technical interfaces. The
OSA-CBMmethodology can be applied at any stage of CBM,
ranging from real-time health monitoring to portable mainte-
nance and cloud services [8].
So far, in IVHM systems, the OSA-CBM framework steps
are applied at the component, subsystem, and at the systems
level. For example, at the LRU level, GE Aviation demon-
strated the benefits of an IVHM system by monitoring the
health state of an electromechanical actuator with parameters
like the Hall effect sensor and supply current [11]. At the
higher subsystem level, Boeing, the Air Force research labo-
ratories, and Smith Aerospace together developed a program
called Aircraft Electrical power systems Prognostics and
Health Management and demonstrated health management
of several subsystems for electrical actuation, fuel pump/
valves, and arc fault protection by monitoring parameters like
torque efficiency, motor performance, and vibration analy-
sis [12]. At the systems level, Safran has developed an Engine
Health Management program by monitoring multiple param-
eters such as oil consumption monitoring, oil and fuel filters
VOLUME 9, 2021 11439

C. M. Ezhilarasu et al.: Generalised Methodology for the Diagnosis of Aircraft Systems
FIGURE 3. OSA-CBM methodology to develop diagnostics for three aircraft systems for a Framework for Aerospace Vehicle Reasoning (FAVER).
monitoring, actuation control loop monitoring, bearings
vibration monitoring, and global performance monitor-
ing [13]. Few more examples of applications of OSA-CBM
can be found in these references ([14]–[16]). It can be seen
from the examples that the aircraft systems have multiple
sensors for multiple fault modes linked to multiple diagnos-
tic algorithms. In this article, instead of following different
processes for each aircraft system, a common methodology
is sought and the series of steps from the OSA-CBM frame-
work, leading up to health assessment (i.e., diagnosis), will
be implemented for all concerned aircraft systems. The last
two steps in the framework, viz, Prognostic Assessment and
Advisory Generation, are not used in this article, as the goal is
mainly to develop diagnostics. However, the results produced
from diagnostics developed in this article for the aircraft
systems, i.e., the symptom vectors, can be used for further
prognostic assessment to provide maintenance solutions in
practice.
A. CONTRIBUTIONS IN THIS PAPER
The work carried out in this article is shown in fig 3, high-
lighted by dotted black lines. In this work, three aircraft
systems shown in the schematic diagram of FAVER (right
side of fig 3) are examined: the engine, the ECS, and the
fuel system. Previously, a simulation model of the EPS
(Electrical Power System) was developed, with an Adaptive
Neuro-Fuzzy Inference System (ANFIS) being implemented
for its diagnosis [17]. It fits into the current framework but
will not be replicated here. Diagnostics developed for these
four aircraft systems are later used for vehicle level reasoning
in the platform level reasoner, FAVER, which is not covered
in this article.
In this article, the following contributions are made with
regard to these three aircraft systems:
i) As seen in fig 3, the engine and the ECS digital twins
are represented by MATLAB simulation models, while
the fuel system is represented by hardware-in-the-loop
(HIL), to show the flexibility of this approach. These
models are run for healthy scenarios, and a certain num-
ber of faults are injected (both local and interacting
faults), and their data recorded. In these digital twins,
the simulation models are to be replaced by real per-
formance data at the later stage, to represent the living
models of the aircraft systems (as shown in the bottom
part of fig 3).
ii) Adhering to the OSA-CBM methodology (left part of
fig 3), data from the digital twins is processed, and a
feature selection algorithm (mRMR) is applied on all
these systems to narrow down the health parameters
necessary for developing the symptom vector as an input
for the diagnosis.
iii) The State Detection and Health Assessment steps of
OSA-CBM are fused into one step by considering the
diagnosis of faults as a classification problem. Here,
the classification will take care of both, detecting if
the symptom vector is healthy or faulty. In the case of
a faulty symptom vector, the classification algorithm
will also diagnose the fault. As mentioned previously,
the developed diagnostics are to be used later in FAVER
for vehicle level reasoning.
11440 VOLUME 9, 2021

C. M. Ezhilarasu et al.: Generalised Methodology for the Diagnosis of Aircraft Systems
FIGURE 4. Turbofan engine block model in T-MATS (adapted from [20]).
The diagnostics for all three aircraft systems follow the
data-driven approach in order tomaintain uniformity and save
time. Only single faults are injected; simultaneous or multiple
faults are not considered [2]. It is to be noted that these aircraft
systems are represented by a combination of digital twins and
HIL and are chosen as a part of the project, FAVER [2]. Diag-
nostics for any other aircraft system represented by different
types of simulation models could also be developed using the
OSA-CBM methodology.
III. USE CASES
This section presents the setup of system level diagnostics for
three aircraft systems: the engine, the environmental control
system (ECS), and the fuel system. These have been chosen
to demonstrate the use of the OSA-CBM methodology and
for their fit into the overall FAVER architecture.
A. THE ENGINE
The engine is a primary safety critical aircraft system. It pro-
duces thrust, powers the EPS, and provides bleed air required
for anti-icing and the ECS of the aircraft. Among the types of
jet engines, the turbofan is the most used by the civil airliners,
as it optimises fuel consumption for the thrust produced.
Fig 4 shows a block diagram of a high bypass turbofan
engine. The turbofan engine is made up of the following
standard components: fan, compressor, combustion chamber,
turbine, and nozzle. The engine sucks air through the fan
(stations 2-21 from fig 4), and a portion of it is ducted into
the core (station 23), while the rest of the air is bypassed
(station 13) through the flow splitter to the bypass nozzle
(station 19). The core flow is then compressed (stations
23-3) before being sent to the combustion chamber (stations
3-4), where the compressed air is mixed with fuel and burnt,
producing hot gases and increasing the temperature. The hot
air then expands across the turbine blades (stations 4-5) and
then passes through the core nozzle (stations 7-9). The cold
bypassed air passes through a similar nozzle (stations 17-19)
and mixes with the core flow to produce the thrust that moves
the aircraft forward [18]. Bleed air is extracted from the
compressor (station 3) based on demand, and supplied to the
ECS and for anti-icing and deicing.
1) DIGITAL TWIN SETUP
The model chosen for the engine digital twin is the Pratt &
Whitney JT9D open source turbofan engine model provided
by T-MATS software inMATLAB Simulink [19]. This model
features a high bypass turbofan engine with a bypass ratio
of 4.8:1, one stage fan, three stage Low Pressure Compressor
(LPC), 11 stage High Pressure Compressor (HPC), annu-
lar combustion chamber, two stage High Pressure Turbine
(HPT), four stage Low Pressure Turbine (LPT), and a con-
vergent divergent nozzle.
The healthy scenario is run with input conditions
of 34000 ft altitude, 0.8 Mach number, and 1.91 pounds per
second (pps) fuel mass flow rate, along with the efficien-
cies set as default in T-MATS [20]. A total of eight fault
modes, including local and interacting faults, are simulated
in T-MATS for this article, by reducing the efficiency of the
subsystems as well as introducing leakages and blockages
in the ducts and valves. The efficiency degradation and the
leak induced in the fault modes are randomly chosen, and
hence the resulting engine performance for each degradation
mode can be viewed for the trend but not cross-compared for
quantitative effect. For brevity in this engine simulation, only
one mode of degradation is simulated for each subsystem.
This single mode of degradation for each fault is sufficient for
demonstrating the approach advocated here; the diagnostics
could always be updated with multiple degradations and dif-
ferent fault modes at a later date. The following are the eight
VOLUME 9, 2021 11441

C. M. Ezhilarasu et al.: Generalised Methodology for the Diagnosis of Aircraft Systems
selected faults injected in this simulation model; the first five
are local faults, and the last three are interacting faults.
Local Faults: These engine faults do not affect other air-
craft systems. However, as a result of these fault modes,
the subsystems function with reduced efficiency, contributing
to overall reduced efficiency for the engine.
i) Fan FOD: Foreign Object Damage in fan blade
reducing the efficiency of the fan by 2.7%
ii) LPC Contamination: Blade corrosion in LPC reduc-
ing the efficiency of LPC by 3%
iii) HPC Fouling: Fouling in HPC reducing the efficiency
of HPC by 1.1%
iv) HPT Blade Broken: Partial loss of blade in HPT
reducing the efficiency of HPT by 1%
v) LPT Blade Broken: Partial loss of blade in LPT
reducing the efficiency of LPT by 3%
Interacting Faults: These faults are either caused by, or affect
aircraft systems other than the engine.
vi) Bleed Valve Stuck: The bleed valve is stuck at
60 degrees. This fault affects the engine indirectly but
directly affects the bleed air supplied to the ECS.
vii) CDP Leakage: This fault is due to a 0.5% leakage in
the duct carrying the bleed air from the engine to the
ECS. Similar to the previous fault, this fault has the
potential to affect the bleed air supplied to the ECS but
does not affect the engine directly.
viii) Reduced Fuel flow: The input fuel flow is reduced by
10%, a fault that could have been caused by a reduction
of fuel pump speed. The reduced fuel input affects the
engine performance directly.
The simulation model is adapted to include a simple Pro-
portional Integrator (PI) controller, which is programmed
to meet the demanded thrust as the overall objective. This
is achieved by calculating Thrust Specific Fuel Consump-
tion (TSFC) as shown in (1):
TFSC =m
f(1)
where, m is the fuel mass flow rate, and f is the gross thrust.
TSFC is provided as feedback to the PI controller, where
the input fuel flow is altered by the controller to achieve
the demanded thrust. As can be seen from fig 5(a), for all
fault modes except Reduced Fuel flow, the demanded thrust
objective (27500 lbf) is met, which is due to the PI controller.
In the case of the Reduced Fuel flow fault mode, the loss of
mass flow rate affects the gross thrust, as they are directly
proportional to each other, as shown in (1). This can also be
seen in fig 5(b), where the mass flow rate of the fuel increases
for all the fault modes in order to achieve the thrust, except for
the Reduced Fuel flow fault mode where the mass flow stays
constant and hence does not achieve the demanded thrust.
Parameters like flow, total temperature, total pressure,
enthalpy, and fuel-air ratio are measured at several stations,
along with other parameters such as fan speed, core speed,
torque, and TFSC. The data collected from the simulations
FIGURE 5. Gross thrust and fuel flow rate in healthy and faulty scenarios.
are then used for developing further diagnostics for the failure
modes mentioned in this section.
2) DATA ACQUISITION AND DATA MANIPULATION
The engine digital twin conFigd in T-MATS is run in MAT-
LAB R2019b for both healthy and faulty scenarios until the
objective of thrust demanded is reached.
The next step is data manipulation, where the raw data
collected from the simulations are formatted in MS EXCEL
for further process in the OSA-CBM methodology. Only
steady state data are used in the process; the rest of the
data are ignored. Further, the number of health parameters
to be monitored are narrowed down only to the essential
features. This is because many parameters extracted from the
simulation would be redundant to each other; hence moni-
toring all parameters from the simulation results would be
time-consuming as well as would require higher processing
power. In order to avoid this issue, feature analysis for each
simulationmodel is carried out, and only themost influencing
features are chosen for condition monitoring and diagnosis of
the system.
Health parameters like flow, enthalpy, temperature, pres-
sure, fuel-air ratio, are measured at several stations along
11442 VOLUME 9, 2021
C. M. Ezhilarasu et al.: Generalised Methodology for the Diagnosis of Aircraft Systems
the gas flow path, with other calculated measures like thrust,
TSFC, core speed, fan speed, and torque. Additional mea-
surements are made near the bleed valve, which does not fall
under the gas flow path. These result in a total of 85 features
from which data is extracted to monitor the performance of
the engine. In order to save time and reduce the complexity
of the monitoring process, only the important features that
influence or represent the engine performance are selected
for the diagnostic process. This is carried out in two steps.
Step 1: Only the ‘measurements’ from the Digital Twin
that would correspond to sensors in a real engine, such as
temperature (Tt), pressure (Pt), mass flow (Wf), speed, TSFC,
and thrust, are chosen. This results in 35 features.
Step 2: From the 35 features, the second stage of selection
is carried out using the Minimum Redundancy Maximum
Relevance (mRMR) algorithm. The mRMR algorithm is a
selection algorithm that finds the optimal set of features with
respect to the response variable by identifying the features
with maximal and mutually dissimilar relevance and with
minimal redundancy. This is done by calculating the mutual
information between features and the response variable and
through pair wise comparison of features itself [21].
In general, mutual information MI between two variables
S,T is given by (2). This helps in finding how the variable S
is helpful in reducing the uncertainty of variable T.
MI (S,T) =∑
ijP(
S = si,T = tj)
× log
(
P(
S = si,T = tj)
P (S = si)P(
T = tj)
)
(2)
The mutual information is calculated for mRMR algorithm
in the following fashion. Consider an empty set G, represent-
ing the optimal set of features (G = {}). Let H be the set
containing the features, x, z (H = {x, z}), and let y be the
response variable. The mRMR algorithm aims to add suitable
features to the set G from set H . It does so by choosing
the feature x (from set H ) with maximum relevance (Px),
with respect to the response variable y, as calculated by (3)
and assigning it to set G. In the next step, the feature z
from set H is compared with x from set G, to minimise the
redundancy by calculating (Qx) between through (4). The
mutual information quotient (MIQ) is then calculated using
(5) and is used to rank all features in set G [22]:
Px = MI (x, y) (3)
Qx =
(
1
|G|
)
∑
zǫGMI (x, z) (4)
MIQ =Px
Qx(5)
|G| is the number of features in set G. Once the ranks are
assigned for all the features in set H, the optimal set G is
filled with features that have maximum MIQ. In MATLAB
R2019b, the importance of the feature is quantified by cal-
culating its score. The score is the ratio of the difference
between the MI of the target and the considered feature to the
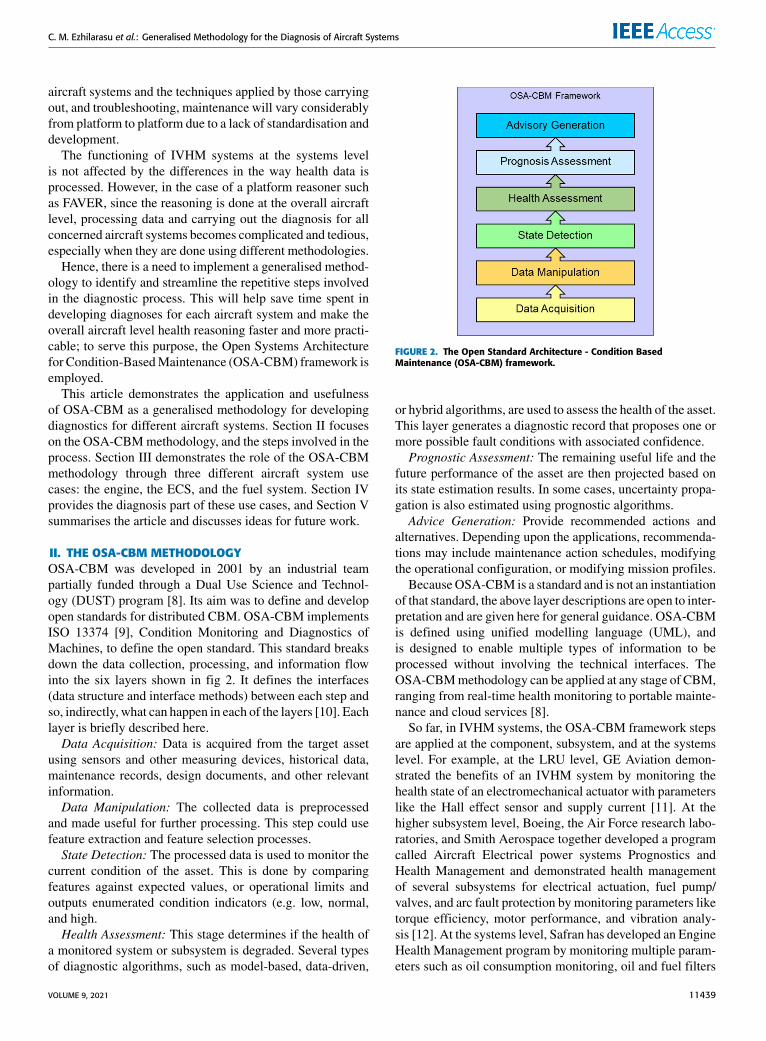
FIGURE 6. Top 15 features selected by mRMR algorithm for statedetection and diagnosis of the engine.
average of MI of target and previously considered features.
In short, the score represents the importance of the target
feature with respect to the previously considered feature.
The higher score for a feature indicates the importance
of the predicting factor with respect to the response vari-
able. The bigger difference in scores between the features
shows the confidence of the algorithm in choosing one feature
over the other [22].
While the ranks of features show exclusivity of the features
using mutual information, the scores show their importance
as predictors with respect to the response variables. In the
case of engine simulation, the set H contains the 35 features,
and set G will be populated with the features having higher
ranks. This is done by calculating MI for all 35 features
with respect to the response variable, i.e., the fault classes.
This step will calculate the relevance of these features for
better representation of the fault classes. Similarly, MI is
calculated for pairwise comparison of these 35 features and
measures the redundancy of these features. MIQ of these
35 features are then calculated and set G is populated with
features having maximumMIQ, i.e., better ranks. In this step,
the features which are least relevant are ranked the lowest.
Finally, the scores of these ranked features are calculated by
comparing the MI of each of these 35 features with respect to
the average of the rest. Fig 6 shows the top 15 scored features
and their ranks as calculated by the mRMR algorithm.
The final list of features required for condition monitoring
and diagnosis of the engine is narrowed down based on the
scores from 35 to only four, viz: i) Core speed (HP shaft
speed), ii) Pressure at LPC exit (station 24): Pt_S24, iii) tem-
perature at LPT exit (station 5): Tt_S5, and iv) pressure at the
exit of bleed air duct: Pt_AfCDP.
Fig 6 shows the core speed and Pt_S24 possess the top-
most scores among the monitored features. This indicates
that these two features are better predictors of the engine
health performance. This can be correlated with fig 7 (a) and
fig 7 (b), where the features, core speed, and Pt_S24 show
clear distinction among different fault modes from the healthy
case of the engine. (Only steady state is considered in this
simulation. Hence, in fig 7, data from t = 230s is chosen for
VOLUME 9, 2021 11443

C. M. Ezhilarasu et al.: Generalised Methodology for the Diagnosis of Aircraft Systems
FIGURE 7. Performance of engine features for healthy and faulty scenarios.
analysis and interpretation. The entire timeline from t = 0 is
shown in fig 7 for clarity).The turbine exit gas temperature
from fig 6, Tt_S5, has a better score, and can understandably
predict the health of the engine (as seen in fig 7(c)), because of
11444 VOLUME 9, 2021

C. M. Ezhilarasu et al.: Generalised Methodology for the Diagnosis of Aircraft Systems
its location in the gas path. As corroborating evidence, across
the literature, these three features are proven predictors of
engine health performance [23]–[25].
The strength of the mRMR algorithm is demonstrated
in choosing the Pt_AfCDP feature in fig 6. Identifying the
importance of Pt_AfCDP would not be normally possible
without the help of the mRMR algorithm, as this feature is
not directly related to any of the stations in the engine model,
not located in the gas path of the engine, and was placed
only to measure the exit pressure in the bleed air system
ducts. However, the pressure sensor placement has resulted
in this feature Pt_AfCDP to function as a predictor of the
engine health. This can be observed from fig 7(d), where the
pressure at the bleed air exit has a distinct profile for each
fault mode and is differentiated clearly from the healthy case.
Thus, the mRMR algorithm has successfully selected the
most important predictors of the engine health performance
as well as aided the selection of optimal sensor placement for
monitoring the engine health. The next step is to use these
four features to detect the current state of the engine and to
diagnose fault modes.
3) STATE DETECTION
In the state detection step of OSA-CBM, the current condition
of the system is monitored to understand if the system is
healthy, and, if not, to proceed for diagnosis. Fig 7 shows the
comparison of the healthy mode with all eight fault modes
for each feature selected to monitor the engine’s current
condition. These features are chosen because their profiles
are distinct for every fault mode, making them easier to
distinguish from the healthy profile and also to isolate the
exact fault mode.
From fig 7, it can be clearly seen that the Reduced Fuel
flow fault mode is far from the healthy profile in all four
features, making it easy to detect. In other words, in this fault
mode, reduction of the fuel flow rate by 10% leads to the
engine running off-design, resulting in reduced core speed,
pressures, and temperatures measured at the stations (fig 7)
and reduced gross thrust (fig 6).
In fig 7(a) it can be observed that the fault modes HPC
Contamination and HPT Blade Broken have lower core
speed when compared to the healthy profile, whereas all the
other fault modes have higher core speeds. This is because
the core speed refers to the high pressure shaft speed, which
connects HPT and HPC (from fig 4). Hence the loss of
efficiency in either HPC or HPT would result in reduced core
speed. However, in case of loss of efficiency in any other
subsystem like the fan, LPC, or LPT, the high pressure shaft
will run faster to obtain the demanded thrust, resulting in
higher core speed when compared to the healthy profile.
In fig 7(b), which shows the profiles of LPC exit pressure,
Fan FOD, LPC fouling, and LPT Blade Broken fault modes
have pressures lower than the healthy pressure profile. The
reason behind the difference is the low pressure shaft that
connects fan, LPC, and LPT. Loss of efficiency in these sub-
systems, because of fouling, or the loss of material, leads to
lower intake of air resulting in lower compression developed
by the LPC.
The opposite is true for HPC contamination and HPT
Blade Broken fault modes. Here, the loss of efficiency in the
HPC results in lower compression by the HPC, and loss of
efficiency in the HPT results in the HPC being driven with
a lower speed. Hence, there is slight pressure build up at the
entrance of theHPC, as the HPC cannot compress to its fullest
in both cases.
In fig 7(c), it can be observed that loss of efficiency of any
subsystem in the engine results in higher turbine exhaust gas
temperature because of the extra workload on the engine to
achieve the demanded thrust. While fig 7(a),7(b), and 7(c)
showed a clear distinction between fault modes affecting the
main subsystems of the engine, the fault modes Bleed Valve
Stuck, andCustomer Discharge Pressure (CDP) leakage are
not seen clearly, as they have profiles similar to the healthy
one. These two fault modes are distinguished only with the
help of pressure measured at the exit of the bleed air duct,
which in this instance shows a distinguishing profile for all
the fault modes, as seen in 7(d).
Thus, with the help of these four features chosen by the
mRMR algorithm, the current health state of the engine is
monitored, and degradation in any of the subsystems can be
easily detected by comparing their performance profile with
that of the healthy profile. Therefore, the four features of the
engine, viz, the core speed, Pt_S24, Tt_S5, and Pt_AfCDP
together form the symptom vector for the engine diagnosis.
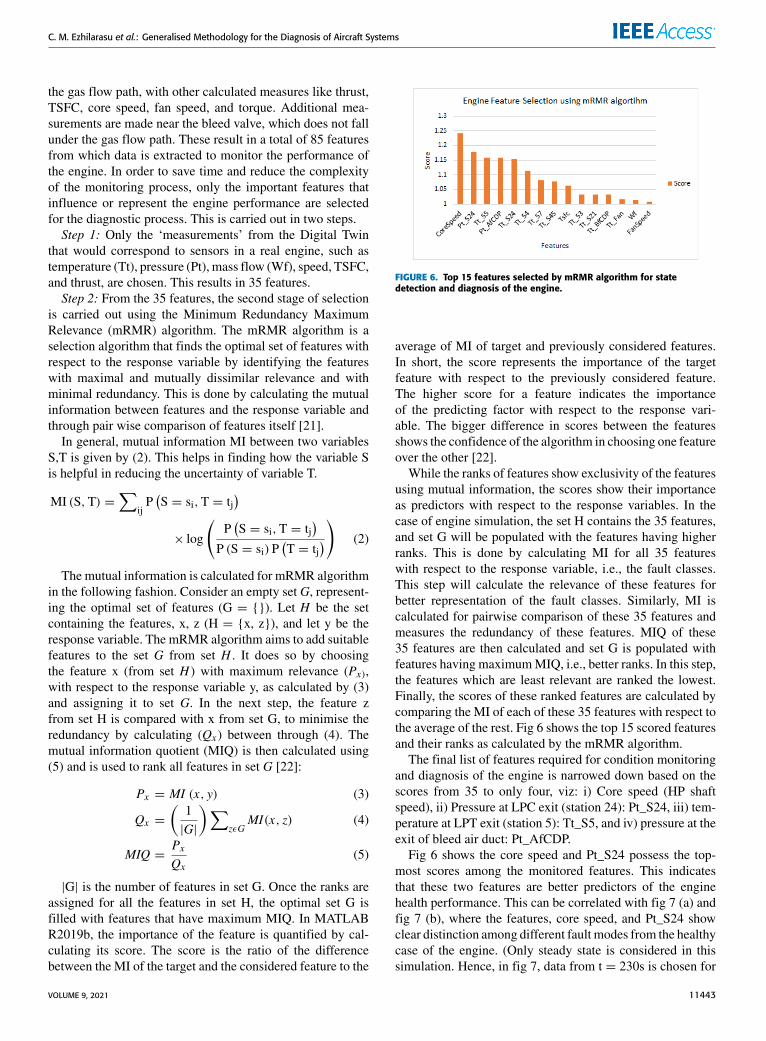
B. THE ENVIRONMENTAL CONTROL SYSTEM (ECS)
The Environmental Control System (ECS) of an aircraft
maintains the in-flight conditions suitable for the passengers
as well as for the effective functioning of the onboard equip-
ment. The bleed air system (BAS) in the ECS receives bleed
air extracted from the APU (on the ground) and the engine
(during flight) and passes it to the anti-icing system and the
PACK (passenger air conditioner). The PACK is the subsys-
tem in the ECS responsible for conditioning the bleed air to be
supplied to the cabin. The PACK consists of a series of com-
ponents such as the primary heat exchanger (PHX), the sec-
ondary heat exchanger (SHX), air cycle machine (ACM),
high pressure water separator (HPWS), temperature control
valve (TCV), and a flow control valve called the Pack Valve
(PV). The PACK conditions the pressure (P), temperature (T),
and specific humidity (SH) of the bleed air to match the flight
deck requirements. The conditioned air then passes through
a mixed manifold system and air distribution system to the
cabin, and the cabin pressure control system regulates the air
pressure inside the cabin as required by the flight deck [26].
1) DIGITAL TWIN SETUP
In order to simulate the operation of the ECS, a simula-
tion package called SESAC (Simscape Environmental control
system Simulation under All Conditions) is chosen [26].
SESAC provides a library of components to perform simu-
lation of the ECS under a wide range of operating conditions
VOLUME 9, 2021 11445
C. M. Ezhilarasu et al.: Generalised Methodology for the Diagnosis of Aircraft Systems
FIGURE 8. B737-800 ECS PACK model emulated in SESAC [26].
for both healthy and faulty scenarios. The SESAC component
library has been configured to produce a detailed model of
the B737-800 PACK. This model has been validated against
actual data from the aircraft [26]. Fig 8 shows a schematic of
the PACK model in SESAC. The bleed air from the engine
or the APU is received at high temperature and pressure by
the ECS. The PACK uses the PV to control the flow of this
air, a portion of which is passed through the PHX for heat to
be removed. This air is then cooled further by the compressor
(as part of the ACM) and the SHX. Ram air is used by both
heat exchangers (PHX and SHX) as a heat sink. The HPWS
consists of a Reheater (RHX), condenser (CHX), and water
separator (WS), which together remove any condensation
from the air before it enters the turbine (the other ACM
component). The cooled air is then merged with the bypassed
hot air, the TCV regulating the flow as demanded. Further
details on the PACK model in SESAC can be found in this
reference [26].
For the work here, the digital twin is fed with input condi-
tions of 28000 ft altitude and 0.761 Mach number to meet
the target cabin pressure of 79.1kPa, cabin temperature of
291.24K, andmass flow rate of 0.445 kg/s. In order to develop
diagnostics for the ECS, the simulation of a 100% healthy
scenario is run in SESAC, followed by injection of six faults
which are listed below, combining local and interacting faults
as for the engine case.
Local Faults:
i) ACM 0.6: only 60% mechanical efficiency of the ACM
is simulated.
ii) PHX Fouling: Fouling in the PHX, leading to its effi-
ciency reduced by 50%.
iii) SHX Fouling: Fouling in SHX, leading to 50% reduc-
tion in efficiency.
Interacting Faults:
iv) CDP Leak: this fault is due to 0.5% leakage in Cus-
tomer Discharge Pressure (CDP) from the engine.
v) Low Bleed air Pressure: this fault could be due to the
HPSOV being stuck in the bleed air system, reducing
the input bleed air to 75% of the original demand.
vi) TCVStuck:TCV is stuck at 10 degrees. This fault could
be due to an intermittent supply from the EPS to the
TCV.As in the case of the engine, the percentage loss of efficiency
and leakage are chosen randomly, and hence these faults can
be compared for trend, but cannot be quantitatively compared
with each other. Temperature (T) and pressure (P) are mea-
sured at the inlet and outlet of every subsystem along the path
of the bleed air.
Fig 9 (a) shows the temperature profile for the healthy
and faulty simulation scenarios. The monitored parameters
are laid out in the way that represents the path followed by
bleed airflow in the PACK. In the healthy scenario (sky blue
colour), the temperature of the bleed air is first reduced by
passing it through PHX. It then increases slightly when com-
pressed by the ACM compressor, after which the temperature
decreases as the compressed air passes through the SHX.
The air is reheated within the RHX and condensed in the
CHX; hence the temperature increases in the hot sides of both
RHX and CHX.
The air is sent through the water separator and again
through the cold side of RHX, where the temperature remains
constant. The air is expanded by the turbine, with the tem-
perature reducing dramatically. This expansion work directly
powers the compressor (on the same spool as the turbine).
After this, the temperature of the expanded air increases when
mixed with the hot airflow, to meet the cabin target temper-
ature, before leaving the PACK outlet. Fig 9(b) shows the
pressure profile, where, in the healthy scenario, the pressure
of the bleed air decreases towards the PHX exit, followed
by an increase in pressure when the air is compressed in the
ACM. When the compressed air passes through the HPWS
components (RHX andCHX), the pressure reduces gradually,
followed by a dramatic reduction when the air is expanded
11446 VOLUME 9, 2021
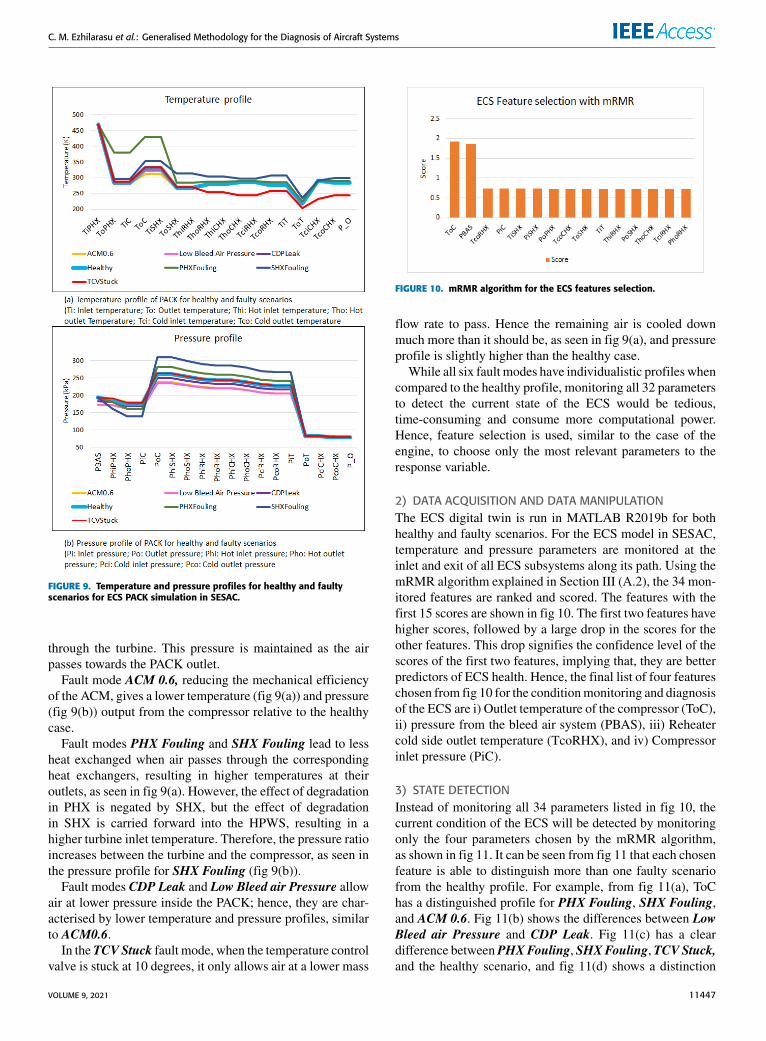
C. M. Ezhilarasu et al.: Generalised Methodology for the Diagnosis of Aircraft Systems
FIGURE 9. Temperature and pressure profiles for healthy and faultyscenarios for ECS PACK simulation in SESAC.
through the turbine. This pressure is maintained as the air
passes towards the PACK outlet.
Fault mode ACM 0.6, reducing the mechanical efficiency
of the ACM, gives a lower temperature (fig 9(a)) and pressure
(fig 9(b)) output from the compressor relative to the healthy
case.
Fault modes PHX Fouling and SHX Fouling lead to less
heat exchanged when air passes through the corresponding
heat exchangers, resulting in higher temperatures at their
outlets, as seen in fig 9(a). However, the effect of degradation
in PHX is negated by SHX, but the effect of degradation
in SHX is carried forward into the HPWS, resulting in a
higher turbine inlet temperature. Therefore, the pressure ratio
increases between the turbine and the compressor, as seen in
the pressure profile for SHX Fouling (fig 9(b)).
Fault modes CDP Leak and Low Bleed air Pressure allow
air at lower pressure inside the PACK; hence, they are char-
acterised by lower temperature and pressure profiles, similar
to ACM0.6.
In theTCVStuck fault mode, when the temperature control
valve is stuck at 10 degrees, it only allows air at a lower mass
FIGURE 10. mRMR algorithm for the ECS features selection.
flow rate to pass. Hence the remaining air is cooled down
much more than it should be, as seen in fig 9(a), and pressure
profile is slightly higher than the healthy case.
While all six fault modes have individualistic profiles when
compared to the healthy profile, monitoring all 32 parameters
to detect the current state of the ECS would be tedious,
time-consuming and consume more computational power.
Hence, feature selection is used, similar to the case of the
engine, to choose only the most relevant parameters to the
response variable.
2) DATA ACQUISITION AND DATA MANIPULATION
The ECS digital twin is run in MATLAB R2019b for both
healthy and faulty scenarios. For the ECS model in SESAC,
temperature and pressure parameters are monitored at the
inlet and exit of all ECS subsystems along its path. Using the
mRMR algorithm explained in Section III (A.2), the 34 mon-
itored features are ranked and scored. The features with the
first 15 scores are shown in fig 10. The first two features have
higher scores, followed by a large drop in the scores for the
other features. This drop signifies the confidence level of the
scores of the first two features, implying that, they are better
predictors of ECS health. Hence, the final list of four features
chosen fromfig 10 for the conditionmonitoring and diagnosis
of the ECS are i) Outlet temperature of the compressor (ToC),
ii) pressure from the bleed air system (PBAS), iii) Reheater
cold side outlet temperature (TcoRHX), and iv) Compressor
inlet pressure (PiC).
3) STATE DETECTION
Instead of monitoring all 34 parameters listed in fig 10, the
current condition of the ECS will be detected by monitoring
only the four parameters chosen by the mRMR algorithm,
as shown in fig 11. It can be seen from fig 11 that each chosen
feature is able to distinguish more than one faulty scenario
from the healthy profile. For example, from fig 11(a), ToC
has a distinguished profile for PHX Fouling, SHX Fouling,
and ACM 0.6. Fig 11(b) shows the differences between Low
Bleed air Pressure and CDP Leak. Fig 11(c) has a clear
difference betweenPHXFouling, SHXFouling,TCVStuck,
and the healthy scenario, and fig 11(d) shows a distinction
VOLUME 9, 2021 11447
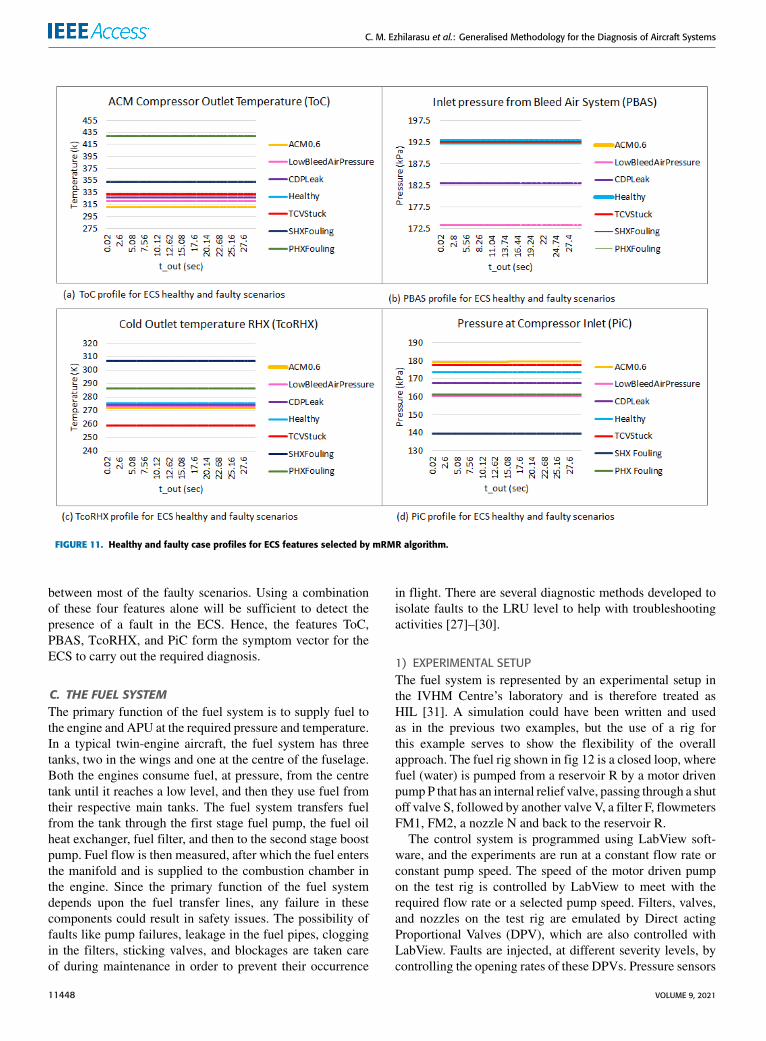
C. M. Ezhilarasu et al.: Generalised Methodology for the Diagnosis of Aircraft Systems
FIGURE 11. Healthy and faulty case profiles for ECS features selected by mRMR algorithm.
between most of the faulty scenarios. Using a combination
of these four features alone will be sufficient to detect the
presence of a fault in the ECS. Hence, the features ToC,
PBAS, TcoRHX, and PiC form the symptom vector for the
ECS to carry out the required diagnosis.
C. THE FUEL SYSTEM
The primary function of the fuel system is to supply fuel to
the engine and APU at the required pressure and temperature.
In a typical twin-engine aircraft, the fuel system has three
tanks, two in the wings and one at the centre of the fuselage.
Both the engines consume fuel, at pressure, from the centre
tank until it reaches a low level, and then they use fuel from
their respective main tanks. The fuel system transfers fuel
from the tank through the first stage fuel pump, the fuel oil
heat exchanger, fuel filter, and then to the second stage boost
pump. Fuel flow is then measured, after which the fuel enters
the manifold and is supplied to the combustion chamber in
the engine. Since the primary function of the fuel system
depends upon the fuel transfer lines, any failure in these
components could result in safety issues. The possibility of
faults like pump failures, leakage in the fuel pipes, clogging
in the filters, sticking valves, and blockages are taken care
of during maintenance in order to prevent their occurrence
in flight. There are several diagnostic methods developed to
isolate faults to the LRU level to help with troubleshooting
activities [27]–[30].
1) EXPERIMENTAL SETUP
The fuel system is represented by an experimental setup in
the IVHM Centre’s laboratory and is therefore treated as
HIL [31]. A simulation could have been written and used
as in the previous two examples, but the use of a rig for
this example serves to show the flexibility of the overall
approach. The fuel rig shown in fig 12 is a closed loop, where
fuel (water) is pumped from a reservoir R by a motor driven
pumpP that has an internal relief valve, passing through a shut
off valve S, followed by another valve V, a filter F, flowmeters
FM1, FM2, a nozzle N and back to the reservoir R.
The control system is programmed using LabView soft-
ware, and the experiments are run at a constant flow rate or
constant pump speed. The speed of the motor driven pump
on the test rig is controlled by LabView to meet with the
required flow rate or a selected pump speed. Filters, valves,
and nozzles on the test rig are emulated by Direct acting
Proportional Valves (DPV), which are also controlled with
LabView. Faults are injected, at different severity levels, by
controlling the opening rates of these DPVs. Pressure sensors
11448 VOLUME 9, 2021

C. M. Ezhilarasu et al.: Generalised Methodology for the Diagnosis of Aircraft Systems
FIGURE 12. Layout of the fuel rig setup in IVHM centre.
P1, P2 . . . ,P6, are installed to monitor the pressure along the
line, and they are powered by 12.8 VDC power supply. The
laser sensor L, which is used for measuring the pump speed,
is powered by 10-30VDC. The pump motor is powered by
three phase 230/400 VAC at 50 Hz [31].
With the above-mentioned arrangement, the following five
faults are injected into the fuel rig.
Local Faults:
i) Sticking Valve: Fault injected bymanipulating the valve
V by changing the opening rate of DPV from 100% to
90%, 80%, 70%, and 60%, emulating 0% severity of
degradation to 10%, 20%, 30%, and 40% respectively.
ii) Clogged Filter: Fault injected by manipulating the filter
F by introducing severity in increments of 10%, up to
40% degradation.
iii) Clogged Nozzle: Fault injected by manipulating the
Nozzle N by introducing severity in increments of 10%
up to 40% degradation.
iv) Blocked Flow Meter: Fault injected by blocking the
flow meter FM1 by introducing severity in increments
of 10% up to 40% degradation.
Interacting Fault:
v) Reduced flow: Fault simulated by reducing the pump
speed, because of low voltage supplied to the pump
motor M. This is considered as an interacting fault, due
to the involvement of the EPS in supplying reduced
voltage to the pump motor.
With the pressure sensors, along with pump speeds, being
monitored, the fuel rig is first run at the 100% healthy condi-
tion at a constant flow rate of 0.5 litre per minute (lpm), at the
beginning of every experiment. The results from running at
this condition are, as might be expected, highly repeatable.
The health of components is reduced gradually from 100%
to 90%, 80%, 70%, and 60% subsequently by manipulating
the DPVs, giving a block of experiments for each failure
mode.
2) DATA ACQUISITION AND DATA MANIPULATION
For the fuel system, all experiments are initially run at
the healthy condition, followed by fault injection. Readings
from the sensors in the fuel rig are collected at a frequency
of 1 kHz. [31]. The data is collected from the LABVIEW
environment as.lvm files, which are then converted to.csv
files and processed into MS EXCEL for further analysis.
In the fuel rig experiment, there are only six pressure
sensors and a laser sensor for measuring pump motor speed.
Hence, due to the low number of possible features, themRMR
algorithm is not applied here, and all seven parameters are
chosen for state detection and diagnosis.
3) STATE DETECTION
Fig 13 shows the pressure profiles and pump speed variation
during each fault mode while trying to maintain the constant
fuel flow objective.
Fig 13(a) shows the pressure profile for fault mode Stick-
ing Valve, the pressure values at P2 and P3 decrease with
increase in the fault severity. This is consistent with the fault
being injected in the valve (V) that lies between pressure
sensors P1 and P2. The fault results in an increased pressure
drop across the valve, and since the fuel rig is controlled
to run for constant flow, the pressure drop continues to be
observed up to P3. Since the motor pump is controlled to
meet the constant flow of 0.5 lpm, the pump speed increases
with the increase in severity of the fault, as seen in fig 13(b).
The values of P4, P5, and P6 do not change since the pump,
delivering a constant mass flow, shields them.
Fig 13(c) shows the pressure profile and fig 13(d) the pump
speed profile, for a constant flow rate during Clogged Filter.
There is an increase in pressure drop between P2 and P3 as
the filter is located between these two sensors. The pressure
values at other locations remain the same. The pump speed
increase with the severity of degradation to meet with the
constant flow demand, as observed in fig 13(d).
Fig 13(e) shows the pressure profile and pump speeds for
Clogged Nozzle. The nozzle N is located after the pump
between P4 and P5, as shown in fig 12. When this fault
is injected pressure increases at P4, just before the nozzle
location. The rest of the pressure sensor readings remain the
same. It can be seen from fig 13(f) that the pump speed
increases rapidly to meet the constant flow rate demand.
When the Blocked flowmeter fault is injected (fig 13(g)),
it generates a back pressure to the motor pump, and the pump
speed increases to maintain the flow at 0.5 lpm as observed
in fig 13(h). There is no pressure sensor between the pump
and the flowmeter, and hence the pressure profile does not
indicate any change when this fault is injected.
In the case of theReduced Flow fault mode the pump speed
was reduced by 50 rpm per experiment, starting from 400 rpm
to 250 rpm, to emulate the reduced flow in the line. The
response of all pressure sensors is seen through the gradual
change, as observed in fig 13(i), with respect to change in the
VOLUME 9, 2021 11449

C. M. Ezhilarasu et al.: Generalised Methodology for the Diagnosis of Aircraft Systems
FIGURE 13. Pressure profiles, pump speeds and flows for various faulty scenarios from fuel rig experiment.
11450 VOLUME 9, 2021

C. M. Ezhilarasu et al.: Generalised Methodology for the Diagnosis of Aircraft Systems
pump speed. The change in flow rate with respect to the pump
speed, as shown in fig 13(j).
Thus, the seven parameters (P1, P2, . . . , P6, Pump Speed)
from the fuel rig experiment form the features for the symp-
tom vector for the diagnosis of faults in the fuel rig.
IV. DIAGNOSIS
Once the features have been shortlisted for being candidates
for the symptom vector for each system, the next step in the
OSA-CBM methodology is diagnosis.
In this article, diagnosis is treated as a multi-class classi-
fication problem, in which, the symptom vector is classified
as belonging to any of the fault class or labelled as healthy.
In order to devise the diagnostics for all three aircraft sys-
tems, the data collected from the experiments are trained
with machine learning classification algorithms and tested
for their accuracy of classification. It is to be noted that the
model-based diagnosis can also be implemented using the
OSA-CBMmethodology. However, they are not tested in this
article, and only data-driven diagnosis is implemented for cre-
ating uniformity in developing similar diagnostic functions
for different aircraft systems.
Data from the chosen features from each use case is
collected and split into training and testing datasets by
Monte-Carlo simulation at 60%-40%, respectively. The
datasets for training are uploaded into the MATLAB Clas-
sification Learner application and trained using various clas-
sification algorithms.
The training uses various supervised machine learning
algorithms in this multi-class classification problem, and
the best performer is chosen for the next stage. The algo-
rithms chosen for comparison are Decision trees, k-Nearest
Neighbor (kNN), Linear Discriminant Analysis (LDA), and
Support Vector Machines (SVM). While the decision tree
algorithm classifies the symptom vector based on rules and
conditions developed using the training sets, the kNN algo-
rithm assigns value to the symptom vector and classifies
based on how its points are when compared to the training
set. The LDA algorithm calculates the means and covariance
matrix for different classes from the training set and classifies
the symptom vector based on its computed values. In the
SVM method, hyperplanes are created based on the classes
from the training set. The symptom vectors are assigned
co-ordinates and are classified based on their distances from
the hyperplanes. The mathematics behind these algorithms
can be found in these references [32], [33], and are not
discussed in this article. Datasets from each aircraft system
are trained using all four algorithms and are tested for their
accuracy of classification.
Table 1 shows the accuracy in classification, i.e., in diag-
nosing fault modes, using the machine learning algorithms,
for each of the aircraft system use cases outlined in this arti-
cle. It appears from the table, and judicious choice of features,
that any of these algorithms could be used to diagnose faults
to quite high levels.
TABLE 1. Accuracy of Classification by Machine Learning Algorithms forthe Diagnosis of Faults in Three Aircraft Systems.
FIGURE 14. Confusion matrices for best classification method for threeaircraft systems.
The LDA algorithm is chosen for the engine diagnostics,
as it shows 99.9% classification accuracy. For the ECS,
all four algorithms show 100% classification accuracy, and
the kNN algorithm is chosen for the ECS diagnostics for
its ease of computation compared to the other algorithms.
The decision tree algorithm is chosen for the fuel system
VOLUME 9, 2021 11451

C. M. Ezhilarasu et al.: Generalised Methodology for the Diagnosis of Aircraft Systems
TABLE 2. Summary of the Use Cases Demonstrated Using OSA-CBM Methodology.
diagnostics for having 99% accuracy from table 1.
Fig 14 shows the confusion matrix for the best methods for
each of these aircraft systems.
The better performer in each use case is chosen for the next
stage, depending upon the application in which the diagnostic
results are used. For example, if the diagnostic results are
used in aircraft maintenance directly, they can be helpful in
troubleshooting and fault isolation. On the other hand, these
diagnostic results could also be used for remaining useful life
calculations in the prognostic step of OSA-CBM methodol-
ogy, followed by the advisory generation step, which is to
develop suitable maintenance plans for the particular aircraft
system. In FAVER, these diagnostic results will be used in the
next stage of this research work for further reasoning at the
vehicle level to identify cascading faults and root causes.
V. SUMMARY AND FUTURE WORK
In this article, the OSA-CBM methodology has been used
to demonstrate the process of developing system level diag-
nostics for multiple aircraft systems. Table 2 presents a sum-
mary of the use cases demonstrated in this article. In order
to emulate a typical industrial scenario, the digital twin of
each aircraft system has been developed separately and is
isolated from the others. They have various faults injected,
some affecting the local system, and some interacting with
other systems. They have a different number of features
monitored for assessing the health of the systems. Developing
diagnostics for such independent aircraft systems is generally
time-consuming. However, the application of the OSA-CBM
methodology has helped in establishing uniformity in build-
ing the system level diagnostics into the framework. The
developed diagnostic functions in MATLAB can isolate a
certain number of faults, with just a few chosen monitored
features. These features form a symptom vector for each of
the targeted aircraft systems.
While this article demonstrated how the bottom three lay-
ers from FAVER’s schematic in fig 1 (starting from the dig-
ital twin layer to the diagnosis layer) are brought together,
the future work will present how FAVER uses the symptom
vectors generated from these aircraft systems to isolate faults
and their root causes. These papers will also discuss the
architecture of FAVER, the reasoning mechanism involved,
and demonstration of isolation of faults and identification
of the root causes and their cascading effects on interacting
aircraft systems.
LIST OF ABBREVIATIONS
ACM Air Cycle Machine
APU Auxiliary Power Unit
CDP Customer Discharge Pressure
CHX Condensor
DPV Direct acting Proportional Valves
ECS Environmental Control System
EPS Electrical Power System
FAA Federal Aviation Administration
FAVER A Framework for Aerospace Vehicle
Reasoning
FOD Foreign Object Damage
HIL Hardware-in-the-loop
HPC High Pressure Compressor
HPT High Pressure Turbine
HPWS High Pressure Water Separator
IVHM Integrated Vehicle Health Management
kNN k-Nearest Neighbour
LDA Linear Discriminant Analysis
LPC Low Pressure Compressor
LPT Low Pressure Turbine
LRU Line Replaceable Unit
MI Mutual Information
MIQ Mutual Information Quotient
mRMR minimum Redundancy Maximum Relevancy
MRO Maintenance, Repair, and Overhaul
OEM Original Equipment Manufacturer
OSA-CBM Open Standard Architecture for Condition
Based Maintenance
PACK Passenger air conditioner
PBAS pressure from the bleed air system
PHX Primary Heat Exchanger
PiC Compressor inlet pressure
Pt_AfCDP Pressure at the exit of bleed air duct
Pt_S24 Pressure at LPC exit (station 24)
11452 VOLUME 9, 2021

C. M. Ezhilarasu et al.: Generalised Methodology for the Diagnosis of Aircraft Systems
RHX Reheater
SESAC Simscape Environmental control system
Simulation under All Conditions
SHX Secondary Heat Exchanger
SVM Support Vector Machine
TcoRHX Reheater cold side outlet temperature
TCV Temperature Control Valve
TFSC Thrust Specific Fuel Consumption
T-MATS Toolbox for Modeling and Analysis of
Thermodynamic Systems
ToC Outlet temperature of the compressor
Tt_S5 Temperature at LPT exit (station 5)
ACKNOWLEDGMENT
The authors would like to thank Dr. Fakhre Ali and Dr. Chris-
tos Skliros for their help in setting up the digital twins for the
ECS and the engine. The authors would like to thank Boeing
for their support of this project.
REFERENCES
[1] Mike Monroney Aeronautical Center, Federal Aviation Administration.
(2008). Federal Aviation Administration Joint Aircraft System/Component
Code and Table Definitions. Accessed: Sep. 12, 2020. [Online]. Available:
https://av-info.faa.gov/sdrx/documents/JASC_Code.pdf[2] C. M. Ezhilarasu, Z. Skaf, and I. K. Jennions, ‘‘Progress towards a frame-
work for aerospace vehicle reasoning (FAVER),’’ in Proc. Annu. Conf.
PHM Soc., 2019, vol. 11, no. 1, pp. 1–9.[3] C. M. Ezhilarasu, Z. Skaf, and I. K. Jennions, ‘‘Understanding the role of
a digital twin in integrated vehicle health management (IVHM),’’ in Proc.
IEEE Int. Conf. Syst., Man Cybern. (SMC), Oct. 2019, pp. 1484–1491.[4] S. Vohnout, B. Kim, N. Kunst, B. Gleeson, R. Wagoner, E. Balaban,
and K. Goebel, ‘‘A model-based avionic prognostic reasoner (MAPR),’’
in Proc. Infotech@Aerospace, 2012, pp. 1–17.[5] M. Watson, J. Sheldon, S. Amin, H. Lee, C. Byington, and M. Begin,
‘‘A comprehensive high frequency vibration monitoring system for incip-
ient fault detection and isolation of gears, bearings and shafts/couplings
in turbine engines and accessories,’’ in Proc. Turbo Expo, vol. 5, 2007,
pp. 885–894.[6] S. Sarkar, D. S. Singh, A. Srivastav, and A. Ray, ‘‘Semantic sensor fusion
for fault diagnosis in aircraft gas turbine engines,’’ in Proc. Amer. Control
Conf., Jun. 2011, pp. 220–225.[7] C. M. Ezhilarasu, Z. Skaf, and I. K. Jennions, ‘‘The application of
reasoning to aerospace integrated vehicle health management (IVHM):
Challenges and opportunities,’’ Prog. Aerosp. Sci., vol. 105, pp. 60–73,
Feb. 2019.[8] Mimosa. (2010). OSA-CBM UML Specification 3.3.1 Release,
Machine Information Management Open Systems Alliance. Accessed:
Sep. 12, 2020. [Online]. Available: https://www.mimosa.org/
specifications/osa-cbm-3-3-1/[9] ConditionMonitoring andDiagnostics of Machines, document ISO 13374,
International Organization for Standardization, 2015.[10] T. Sreenuch, A. Tsourdos, and I. K. Jennions, ‘‘Software framework
for prototyping embedded integrated vehicle health management applica-
tions,’’ J. Aerosp. Inf. Syst., vol. 11, no. 2, pp. 82–97, Feb. 2014.[11] J. Dunsdon and M. Harrington, ‘‘The application of open system architec-
ture for condition based maintenance to complete IVHM,’’ in Proc. IEEE
Aerosp. Conf., vol. 4, Mar. 2008, pp. 1–9.[12] K. Keller, A. Del Amo, and B. Jordan, ‘‘Aircraft electrical power systems
prognostics and health management (AEPHM),’’ SAE Tech. Paper 2004-
01-3162, 2004.[13] G. Bastard, J. Lacaille, J. Coupard, and Y. Stouky, ‘‘Engine health manage-
ment in safran aircraft engines,’’ in Proc. Annu. Conf. Prognostics Health
Manage. Soc. (PHM), Oct. 2016, pp. 101–108.[14] V. N. Divakaran, R. M. Subrahmanya, and G. V. V. Ravikumar.
(2018). White Paper Integrated Vehicle Health Management of a
Transport. Infosys. Accessed:Jan. 1, 2021.[Online].Available: https://
www.infosys.com/engineering-services/white-papers/Documents/air-
craft-landing-gear-system.pdf[15] W. Bense, ‘‘Prognosis and health monitoring systems for aircraft engines,’’
in Proc. SAE Int., SAE AeroTech Congr. Exhib., 2013, p. 8, doi:
10.4271/2013-01-2146.
[16] J. Du, S. Wang, L. Han, S. Zhao, and C. Guo, ‘‘Prognostic management
verification system of aircraft hydraulic power supply system,’’ in Proc.
IEEE 10th Int. Conf. Ind. Informat., Jul. 2012, pp. 693–699.[17] C. M. Ezhilarasu and I. K. Jennions, ‘‘A system-level failure propagation
detectability using ANFIS for an aircraft electrical power system,’’ Appl.
Sci., vol. 10, no. 8, p. 2854, Apr. 2020.[18] NASA Glenn Research Center. How Does a Jet Engine Work?
Accessed: Jan. 16, 2018. [Online]. Available: https://www.grc.nasa.gov
/www/k-12/UEET/StudentSite/engines.html[19] J. W. Chapman, T. M. Lavelle, R. D. May, J. S. Litt, and T. Guo,
‘‘T-MATS: Toolbox for the modeling and analysis of thermodynamic
systems user’s guide,’’ Glenn Res. Centre, Cleveland, OH, USA, Tech.
Rep. NASA/TM—2014-216638, 2014, p. 50. [Online]. Available: https://
ntrs.nasa.gov/api/citations/20140012486/downloads/20140012486.pdf[20] J. W. Chapman, T. M. Lavelle, J. S. Litt, and T. Guo, ‘‘A process for the
creation of T-MATS propulsion system models from NPSS data,’’ in Proc.
50th AIAA/ASME/SAE/ASEE Joint Propuls. Conf., 2014, p. 3931.[21] H. Peng, F. Long, and C. Ding, ‘‘Feature selection based on mutual infor-
mation criteria of max-dependency, max-relevance, and min-redundancy,’’
IEEE Trans. Pattern Anal. Mach. Intell., vol. 27, no. 8, pp. 1226–1238,
Aug. 2005.[22] Mathworks. Fscmrmr. Accessed: Jul. 8, 2020. [Online]. Available:
https://www.mathworks.com/help/stats/fscmrmr.html#mw_bacedbf4-
b0ee-4a43-97ee-5de3f6696e6a[23] S. Garg, ‘‘Fundamentals of aircraft turbine engine control,’’ Glenn
Res. Centre (NASA), Lewis Field, Cleveland, OH, USA, 2015.
[Online]. Available: https://www.grc.nasa.gov/WWW/cdtb/aboutus/
Fundamentals_of_Engine_Control.pdf[24] İ. Yılmaz, ‘‘Evaluation of the relationship between exhaust gas temperature
and operational parameters in CFM56-7B engines,’’ Proc. Inst. Mech.
Eng., G, J. Aerosp. Eng., vol. 223, no. 4, pp. 433–440, Apr. 2009.[25] M. T. Yildirim and B. Kurt, ‘‘Aircraft gas turbine engine health monitoring
system by real flight data,’’ Int. J. Aerosp. Eng., vol. 2018, no. 1, p. 12,
2018.[26] I. Jennions, F. Ali, M. E. Miguez, and I. C. Escobar, ‘‘Simulation of an
aircraft environmental control system,’’ Appl. Thermal Eng., vol. 172,
Nov. 2019, Art. no. 114925.[27] E. M. Kelly and L. M. Bartlett, ‘‘Aircraft fuel rig system fault diagnostics
based on the application of digraphs,’’ Proc. Inst. Mech. Eng., O, J. Risk
Rel., vol. 221, no. 4, pp. 275–284, Dec. 2007.[28] S. C. Ofsthun and S. Abdelwahed, ‘‘Practical applications of timed failure
propagation graphs for vehicle diagnosis,’’ in Proc. IEEE Autotestcon,
Sep. 2007, pp. 250–259.[29] N. A. Snooke and M. H. Lee, ‘‘Qualitative order of magnitude energy-
flow-based failure modes and effects analysis,’’ J. Artif. Intell. Res., vol. 46,
pp. 413–447, Mar. 2013.[30] B. Lamoureux, J. Massé, and N. Mechbal, ‘‘An approach to the health
monitoring of a pumping unit in an aircraft engine fuel system,’’ in Proc.
Eur. Conf. Prognostics Health Manage. Soc., 2012, pp. 1–7.[31] Y. Lin, ‘‘System diagnosis using a Bayesian method,’’ Ph.D. dissertation,
Cranfield Univ., Cranfield, U.K., 2017.[32] M. Jung, O. Niculita, and Z. Skaf, ‘‘Comparison of different classification
algorithms for fault detection and fault isolation in complex systems,’’
Procedia Manuf., vol. 19, pp. 111–118, Jan. 2018.[33] MathWorks. (2020). Discriminant Analysis Classification.
Accessed: Aug. 1, 2020. [Online]. Available: https://www.mathworks.
com/help/stats/discriminant-analysis.html
CORDELIA MATTUVARKUZHALIEZHILARASU received the bachelor’s degree in
aeronautical engineering and the master’s degree
in industrial engineering from Anna University,
Chennai, India, in 2011 and 2013, respectively.
She is currently pursuing the Ph.D. degree with
Cranfield University. She was a Data Analysis
Engineer with Bloom Energy and also a Senior
Industrial Engineer with Lam Research for a
period of 4 years. She has been with the IVHM
Centre, since 2017. In her role as an Industrial engineer, she has worked on
various process improvement projects and developed several semi-automated
tools that contributed to time and cost savings for the organisation. Cordelia
is a recognized ASQ Certified Six Sigma Black Belt. Her current research
interests include IVHM technologies, digital twin, and machine learning
related to aerospace applications.
VOLUME 9, 2021 11453

C. M. Ezhilarasu et al.: Generalised Methodology for the Diagnosis of Aircraft Systems
ZAKWAN SKAF received the B.S. degree from
the Faculty of Mechanical Engineering, in 2001,
and the M.Sc. and Ph.D. degrees from the Con-
trol Systems Centre, University of Manchester,
Manchester. He held several positions with Lough-
boroughUniversity, SheffieldUniversity,Warwick
University, and the University ofManchester. He is
currently a Lecturer in diagnostics and prognos-
tics with the Integrated Vehicle Health Manage-
ment (IVHM), Cranfield University. He is an
active researcher with more than 35 publications in many world-class
peer-reviewed journals and conferences. His research interests include con-
trol engineering, data analytics, machine learning, condition monitoring,
diagnostics, and prognostics related to aerospace, railway, marine, energy,
and automotive applications.
IAN K. JENNIONS received the degree in
mechanical engineering and the Ph.D. degree in
CFD from Imperial College London, London.
In July 2008, he was moved to Cranfield Univer-
sity as a Professor and the Director of the newly
formed IVHM Centre. He career spans more than
40 years, working mostly for a variety of gas tur-
bine companies. He has worked for Rolls-Royce
(twice), General Electric and Alstom in a number
of technical roles, gaining experience in aerody-
namics, heat transfer, fluid systems, mechanical design, combustion, ser-
vices, and IVHM. He is on the Editorial Board for the International Journal
of Condition Monitoring, the Director of the PHM Society, the Chairman
of SAE’s IVHM Steering Group, a Contributing Member of the SAE
HM-1 IVHM Committee, a Chartered Engineer, and a Fellow of IMechE,
RAeS, and ASME. He is the editor of five SAE books and coauthored of
another one.
11454 VOLUME 9, 2021