Embed Size (px)
Citation preview
A gaze-directed lens for touchless analytics
Abhishek ChanderComputer Laboratory
University of [email protected]
Advait SarkarComputer Laboratory
University of [email protected]
AbstractWe present the design and implementation of a gaze-directed lens tool for the interactive explorationof quantitative chart visualisations. In view of visual analytics as end-user programming, we presentlenses which enable the selective display of labels, as well as interaction with parameterised uncertainty.We describe an algorithm for smoothing the movement of the lens. We report a controlled, within-subjects experiment on 11 participants demonstrating that participants were as adept at moving the lenswith their gaze as they were using a mouse, and furthermore, that the gaze-directed interface promotedgreater inspection of the key regions of the graphs.
1. IntroductionVisual analytics can be viewed as an instance of end-user programming. Here, the “programs” beingwritten are not represented as textual source code, but rather the instances of charts, graphs, and othervisualisations which arise as (often transient) results of exploring a dataset using a visualisation tool.The process of interacting with the tool is analogous to the act of programming, in the sense that eachtransient visualisation embodies a procedure for transforming data.
Traditional mouse-and-keyboard interfaces, or even touchscreen interfaces, are problematic in a numberof situations. For instance, shared public display walls, where each individual user cannot be givenmice and keyboards, and touchscreens cannot be implemented for reasons of cost and robustness; oroperating theatres, where sterility is a primary concern (O’Hara et al., 2014; O’hara, Harper, Mentis,Sellen, & Taylor, 2013; Perry, Beckett, O’Hara, & Subramanian, 2010); or where the target end-userhas impaired motor skills which prevents them from using conventional input mechanisms. In the era ofubiquitous analytics, similar situations demand tools for the visual exploration of data. In the touchlessscenarios previously described, eye movement-based interaction provides a promising solution (Jacob,1990). Lenses are interactive overlays which serve a variety of functions for data analytics, includingzooming, filtering, manipulation of representation, and changing the level of detail (Tominski, Gladisch,Kister, Dachselt, & Schumann, 2014). Consequently, it seems appropriate to apply eye-tracking to themovement of lenses for visual analytics.
Eye-tracking is an important approach to investigating the psychology of programming. For instance,it has been used to assess program comprehension (Bednarik & Tukiainen, 2006), syntax highlighting(Sarkar, 2015), and visual attention (Bednarik & Tukiainen, 2004) amongst other things. With respect tothe view of visual analytics as end-user programming, and that eye-tracking is an important methodologyfor program comprehension understanding, this work makes the following contributions:
1. We present a purely gaze-directed lens tool, designed such that eye movements can be multiplexedfor use either to inspect the graph or to move the lens.
2. We describe an algorithm for dynamically smoothing raw eye-tracking coordinates which providesresults superior to simple exponential averaging or PID control.
3. We report the evaluation of our tool through a controlled study of 11 participants, showing that itis as easy to manipulate as a mouse-based lens and promotes inspection of key regions.
2. Related workMuch previous work has applied eye-tracking to the movement of lenses, albeit not specifically for visualanalytics. A central problem from which gaze-directed analytical tools suffer is the gaze multiplexingproblem, sometimes known as the Midas touch problem: eye tracking applications have to guess whetherthe user is reading, intends for a lens to move, or engage a selection, etc., and act accordingly. It is trickyto infer intent from eye movements alone; for instance, when trying to read a label placed along the edgeof a gaze-driven lens, the user might inadvertently move the lens itself because the centre of their gazehas shifted.
To address the problem of gaze multiplexing, state-of-the-art solutions often rely on temporal multi-plexing (i.e., changing modes based on dwell time) to infer intent, at the cost of interactional fluidity(Ashmore, Duchowski, & Shoemaker, 2005; Lankford, 2000). Others still use multimodal input (e.g.,through head position, touch, and keyboard) to improve the experience and reliability of lens tools(Stellmach, Stober, Nürnberger, & Dachselt, 2011; Stellmach & Dachselt, 2013; Spindler, Büschel, &Dachselt, 2012; Lehmann, Schumann, Staadt, & Tominski, 2011; Kumar, Paepcke, & Winograd, 2007),at the cost of touchless interaction.
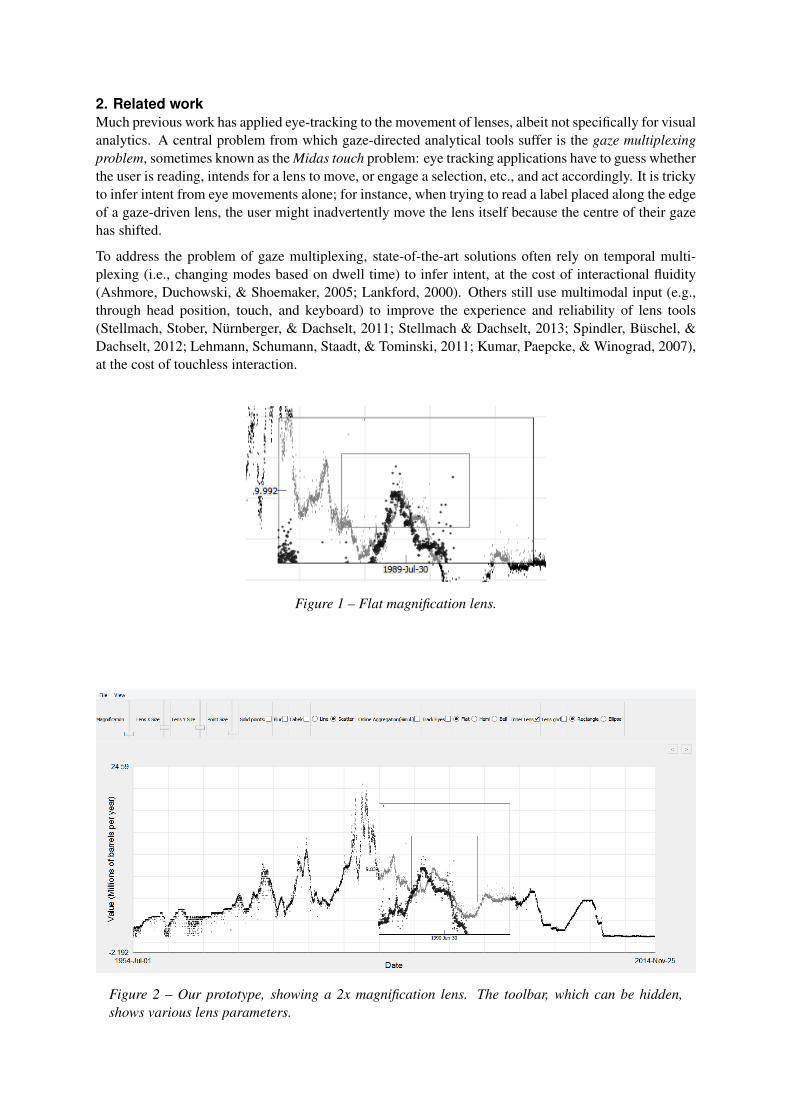
Figure 1 – Flat magnification lens.
Figure 2 – Our prototype, showing a 2x magnification lens. The toolbar, which can be hidden,shows various lens parameters.
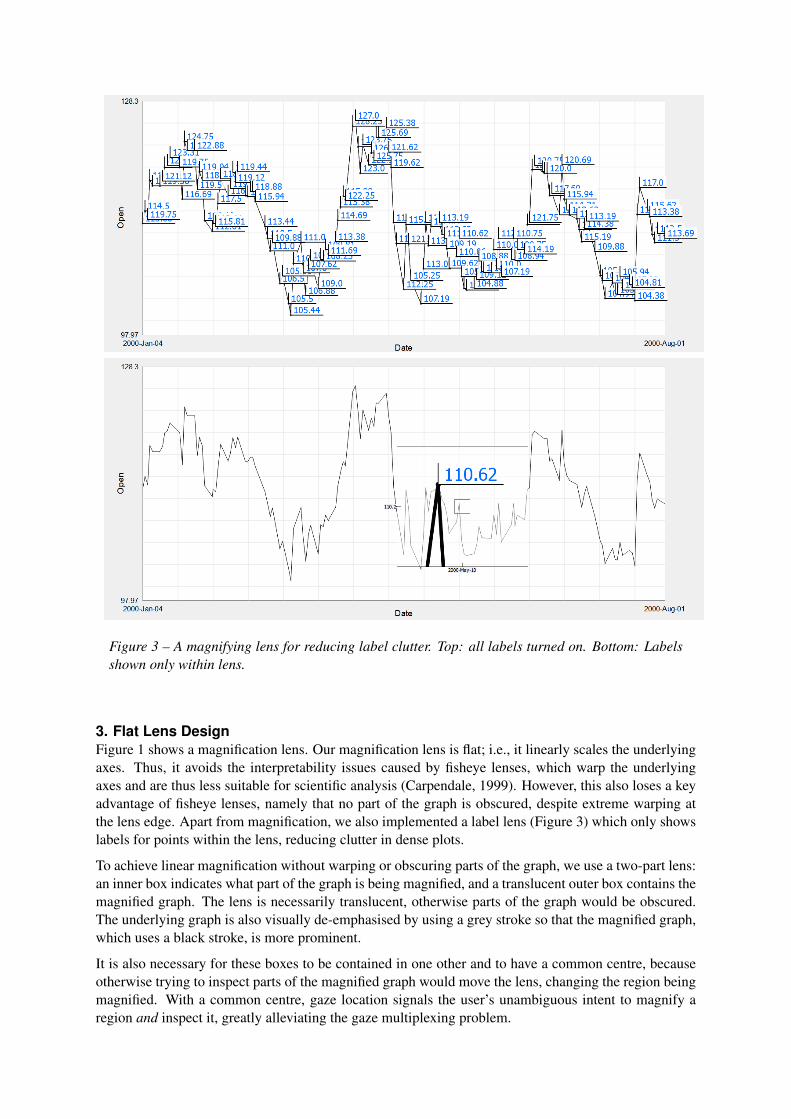
Figure 3 – A magnifying lens for reducing label clutter. Top: all labels turned on. Bottom: Labelsshown only within lens.
3. Flat Lens DesignFigure 1 shows a magnification lens. Our magnification lens is flat; i.e., it linearly scales the underlyingaxes. Thus, it avoids the interpretability issues caused by fisheye lenses, which warp the underlyingaxes and are thus less suitable for scientific analysis (Carpendale, 1999). However, this also loses a keyadvantage of fisheye lenses, namely that no part of the graph is obscured, despite extreme warping atthe lens edge. Apart from magnification, we also implemented a label lens (Figure 3) which only showslabels for points within the lens, reducing clutter in dense plots.
To achieve linear magnification without warping or obscuring parts of the graph, we use a two-part lens:an inner box indicates what part of the graph is being magnified, and a translucent outer box contains themagnified graph. The lens is necessarily translucent, otherwise parts of the graph would be obscured.The underlying graph is also visually de-emphasised by using a grey stroke so that the magnified graph,which uses a black stroke, is more prominent.
It is also necessary for these boxes to be contained in one other and to have a common centre, becauseotherwise trying to inspect parts of the magnified graph would move the lens, changing the region beingmagnified. With a common centre, gaze location signals the user’s unambiguous intent to magnify aregion and inspect it, greatly alleviating the gaze multiplexing problem.
4. Gaze data smoothingThe eye tracking data is extremely jittery and unusable in its raw form, even if the calibration is good.When the user is staring at a fixed point on the screen, deviations in the received gaze coordinates canhave an amplitude of up to 50 pixels. A lens configured to be centred around the raw coordinates in realtime would be unusable.
Exponential averaging is a well-known technique for smoothing jittery eye-trackingdata (Wojciechowski & Fornalczyk, 2014). However, basic exponential smoothing was unable tomeet our requirements as low values of α , the memory coefficient, produced smooth outputs, butincurred a large latency when moving the lens across the graph. Higher values of α caused jittery outputwhen attempting to focus within the lens. Our implementation of a Proportional-Integral-Derivativecontroller with Ziegler-Nichols tuning (Ziegler & Nichols, 1942) also produced unsatisfactory results.
4.1. Dynamic Exponential Smoothing (DES)We modified our approach to use a dynamic value for α , scaled by the difference between consecutivevalues of the gaze location. In the following, xt denotes the x-coordinate received from the eye-trackerat timepoint t, and st denotes the output of our smoothing algorithm, on which the lens is centred:
βt =|xt − st−1|
chart width(1)
αt =
{βt if βt < 0.05min(1.0, f ·βt) otherwise.
(2)
s0 = x0 (3)
st = αxt +(1−α)st−1, t > 0 (4)
A similar set of equations (with β dependent on chart height instead of width) determines the smoothedy-coordinate. The variable f is an “expansion factor,” which controls how quickly α grows as thegaze location moves further from the current smoothed location. This technique results in smoothingbehaviour which is much better than basic exponential averaging or PID control in terms of maintainingsmoothness, as well as quickly acquiring distant targets.
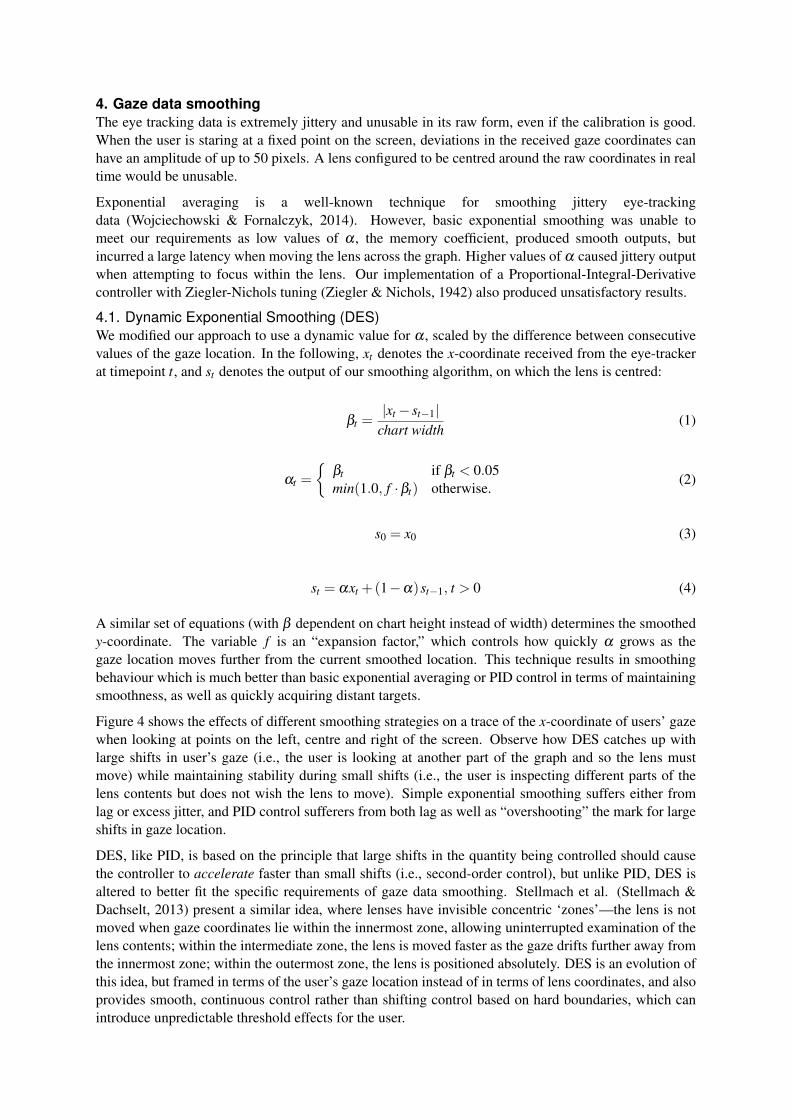
Figure 4 shows the effects of different smoothing strategies on a trace of the x-coordinate of users’ gazewhen looking at points on the left, centre and right of the screen. Observe how DES catches up withlarge shifts in user’s gaze (i.e., the user is looking at another part of the graph and so the lens mustmove) while maintaining stability during small shifts (i.e., the user is inspecting different parts of thelens contents but does not wish the lens to move). Simple exponential smoothing suffers either fromlag or excess jitter, and PID control sufferers from both lag as well as “overshooting” the mark for largeshifts in gaze location.
DES, like PID, is based on the principle that large shifts in the quantity being controlled should causethe controller to accelerate faster than small shifts (i.e., second-order control), but unlike PID, DES isaltered to better fit the specific requirements of gaze data smoothing. Stellmach et al. (Stellmach &Dachselt, 2013) present a similar idea, where lenses have invisible concentric ‘zones’—the lens is notmoved when gaze coordinates lie within the innermost zone, allowing uninterrupted examination of thelens contents; within the intermediate zone, the lens is moved faster as the gaze drifts further away fromthe innermost zone; within the outermost zone, the lens is positioned absolutely. DES is an evolution ofthis idea, but framed in terms of the user’s gaze location instead of in terms of lens coordinates, and alsoprovides smooth, continuous control rather than shifting control based on hard boundaries, which canintroduce unpredictable threshold effects for the user.
Figure 4 – Comparison of DES against basic exponential smoothing (top) and PID control (bottom).
5. A lens for interacting with approximate computationsIn previous work, we have shown how it is possible to enable users to interact with and control uncer-tainty associated with individual data points, where that uncertainty has arisen out of an approximatecomputation process, such as sampling (Sarkar, Blackwell, Jamnik, & Spott, 2014). The motivation isthat it can be much faster, and consequently more interactive, to rapidly render a graph based on approx-imate values. However, it is an open question as to how these approximate values may be interactivelyrefined. For instance, we have previously proposed that data points may be displayed with error bars,which can themselves be dragged to adjust the level of uncertainty associated with a point; reducing thesize of an error bar triggers recomputation to a higher degree of accuracy (Sarkar, Blackwell, Jamnik, &Spott, 2015).
This section describes a lens built as a tool for interaction with simulated uncertainty. The simulationcan be used on any data set, because the inaccurate initial values are generated randomly from the truedata. The core idea here is that the position of the lens directly indicates user attention; points on whichthe user’s gaze dwells are recomputed with lower errors.

Figure 5 – A graph of 20,000 data points (L). Gaussian error applied to the y-values (R).
(a) 0 iterations. (b) 5 iterations. (c) 20 iterations. (d) 100 iterations.
Figure 6 – Error is reduced over time (left to right).
5.1. Error modelWe add Gaussian noise to create errors in the true y-values.
ei ∼ Gaussian(0, δ (ymax− ymin)) (5)
v̂i = vi + ei (6)
where ymin and ymax are the minimum and maximum y-values in the dataset respectively, which scale δ
to the current dataset; v̂i is the approximation to vi, the true ith value. The value δ , which defaults to 0.1,can be varied to increase/decrease the maximum error throughout the dataset. This produces a “noisy”version of the dataset as shown in figure 5.
Points within the lens are recomputed iteratively. Error is reduced exponentially; in each iteration we set
v̂i := θ v̂i +(1−θ)vi (7)
where θ is set to some fraction between 0.9 and 0.99, with higher values corresponding to slower conver-gence. We stop iterating and set our approximate value to be equal to the true value after 100 iterations,or after the onscreen distance between approximate and true positions of the data point becomes smallerthan half a pixel. The visual effect of this procedure can be seen in Figure 6.
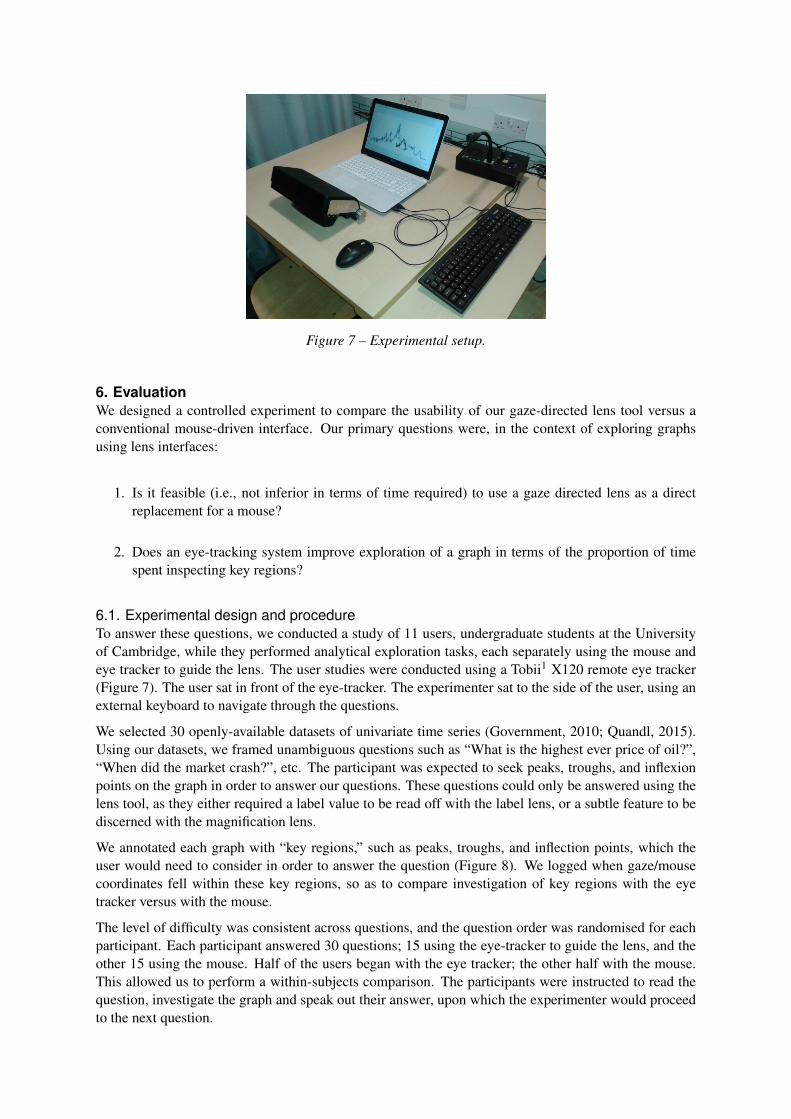
Figure 7 – Experimental setup.
6. EvaluationWe designed a controlled experiment to compare the usability of our gaze-directed lens tool versus aconventional mouse-driven interface. Our primary questions were, in the context of exploring graphsusing lens interfaces:
1. Is it feasible (i.e., not inferior in terms of time required) to use a gaze directed lens as a directreplacement for a mouse?
2. Does an eye-tracking system improve exploration of a graph in terms of the proportion of timespent inspecting key regions?
6.1. Experimental design and procedureTo answer these questions, we conducted a study of 11 users, undergraduate students at the Universityof Cambridge, while they performed analytical exploration tasks, each separately using the mouse andeye tracker to guide the lens. The user studies were conducted using a Tobii1 X120 remote eye tracker(Figure 7). The user sat in front of the eye-tracker. The experimenter sat to the side of the user, using anexternal keyboard to navigate through the questions.
We selected 30 openly-available datasets of univariate time series (Government, 2010; Quandl, 2015).Using our datasets, we framed unambiguous questions such as “What is the highest ever price of oil?”,“When did the market crash?”, etc. The participant was expected to seek peaks, troughs, and inflexionpoints on the graph in order to answer our questions. These questions could only be answered using thelens tool, as they either required a label value to be read off with the label lens, or a subtle feature to bediscerned with the magnification lens.
We annotated each graph with “key regions,” such as peaks, troughs, and inflection points, which theuser would need to consider in order to answer the question (Figure 8). We logged when gaze/mousecoordinates fell within these key regions, so as to compare investigation of key regions with the eyetracker versus with the mouse.
The level of difficulty was consistent across questions, and the question order was randomised for eachparticipant. Each participant answered 30 questions; 15 using the eye-tracker to guide the lens, and theother 15 using the mouse. Half of the users began with the eye tracker; the other half with the mouse.This allowed us to perform a within-subjects comparison. The participants were instructed to read thequestion, investigate the graph and speak out their answer, upon which the experimenter would proceedto the next question.
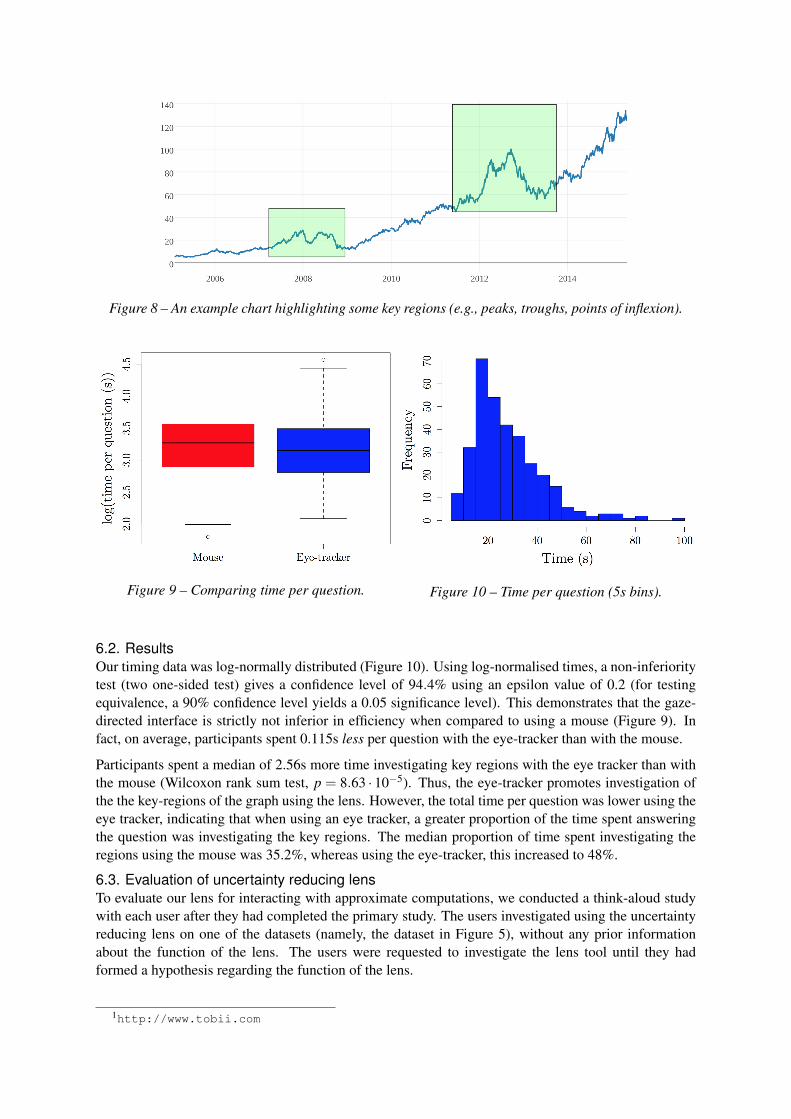
Figure 8 – An example chart highlighting some key regions (e.g., peaks, troughs, points of inflexion).
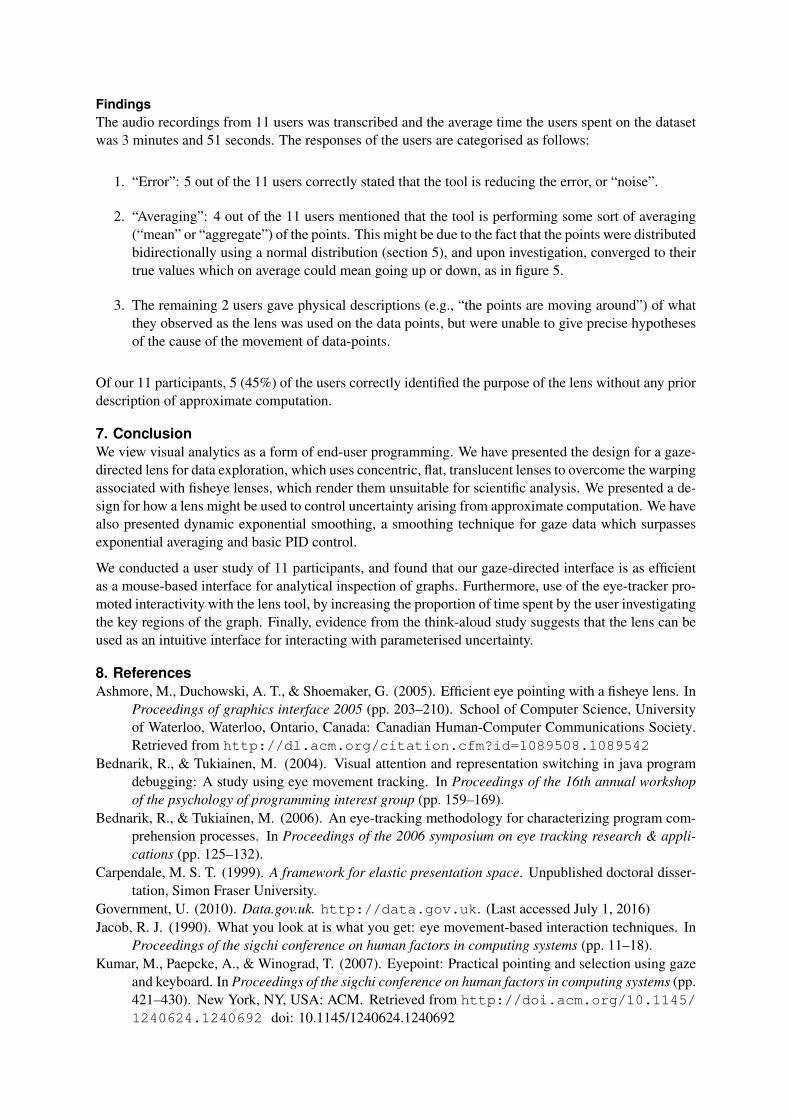
Figure 9 – Comparing time per question. Figure 10 – Time per question (5s bins).
6.2. ResultsOur timing data was log-normally distributed (Figure 10). Using log-normalised times, a non-inferioritytest (two one-sided test) gives a confidence level of 94.4% using an epsilon value of 0.2 (for testingequivalence, a 90% confidence level yields a 0.05 significance level). This demonstrates that the gaze-directed interface is strictly not inferior in efficiency when compared to using a mouse (Figure 9). Infact, on average, participants spent 0.115s less per question with the eye-tracker than with the mouse.
Participants spent a median of 2.56s more time investigating key regions with the eye tracker than withthe mouse (Wilcoxon rank sum test, p = 8.63 · 10−5). Thus, the eye-tracker promotes investigation ofthe the key-regions of the graph using the lens. However, the total time per question was lower using theeye tracker, indicating that when using an eye tracker, a greater proportion of the time spent answeringthe question was investigating the key regions. The median proportion of time spent investigating theregions using the mouse was 35.2%, whereas using the eye-tracker, this increased to 48%.
6.3. Evaluation of uncertainty reducing lensTo evaluate our lens for interacting with approximate computations, we conducted a think-aloud studywith each user after they had completed the primary study. The users investigated using the uncertaintyreducing lens on one of the datasets (namely, the dataset in Figure 5), without any prior informationabout the function of the lens. The users were requested to investigate the lens tool until they hadformed a hypothesis regarding the function of the lens.
1http://www.tobii.com
FindingsThe audio recordings from 11 users was transcribed and the average time the users spent on the datasetwas 3 minutes and 51 seconds. The responses of the users are categorised as follows:
1. “Error”: 5 out of the 11 users correctly stated that the tool is reducing the error, or “noise”.
2. “Averaging”: 4 out of the 11 users mentioned that the tool is performing some sort of averaging(“mean” or “aggregate”) of the points. This might be due to the fact that the points were distributedbidirectionally using a normal distribution (section 5), and upon investigation, converged to theirtrue values which on average could mean going up or down, as in figure 5.
3. The remaining 2 users gave physical descriptions (e.g., “the points are moving around”) of whatthey observed as the lens was used on the data points, but were unable to give precise hypothesesof the cause of the movement of data-points.
Of our 11 participants, 5 (45%) of the users correctly identified the purpose of the lens without any priordescription of approximate computation.
7. ConclusionWe view visual analytics as a form of end-user programming. We have presented the design for a gaze-directed lens for data exploration, which uses concentric, flat, translucent lenses to overcome the warpingassociated with fisheye lenses, which render them unsuitable for scientific analysis. We presented a de-sign for how a lens might be used to control uncertainty arising from approximate computation. We havealso presented dynamic exponential smoothing, a smoothing technique for gaze data which surpassesexponential averaging and basic PID control.
We conducted a user study of 11 participants, and found that our gaze-directed interface is as efficientas a mouse-based interface for analytical inspection of graphs. Furthermore, use of the eye-tracker pro-moted interactivity with the lens tool, by increasing the proportion of time spent by the user investigatingthe key regions of the graph. Finally, evidence from the think-aloud study suggests that the lens can beused as an intuitive interface for interacting with parameterised uncertainty.
8. ReferencesAshmore, M., Duchowski, A. T., & Shoemaker, G. (2005). Efficient eye pointing with a fisheye lens. In
Proceedings of graphics interface 2005 (pp. 203–210). School of Computer Science, Universityof Waterloo, Waterloo, Ontario, Canada: Canadian Human-Computer Communications Society.Retrieved from http://dl.acm.org/citation.cfm?id=1089508.1089542
Bednarik, R., & Tukiainen, M. (2004). Visual attention and representation switching in java programdebugging: A study using eye movement tracking. In Proceedings of the 16th annual workshopof the psychology of programming interest group (pp. 159–169).
Bednarik, R., & Tukiainen, M. (2006). An eye-tracking methodology for characterizing program com-prehension processes. In Proceedings of the 2006 symposium on eye tracking research & appli-cations (pp. 125–132).
Carpendale, M. S. T. (1999). A framework for elastic presentation space. Unpublished doctoral disser-tation, Simon Fraser University.
Government, U. (2010). Data.gov.uk. http://data.gov.uk. (Last accessed July 1, 2016)Jacob, R. J. (1990). What you look at is what you get: eye movement-based interaction techniques. In
Proceedings of the sigchi conference on human factors in computing systems (pp. 11–18).Kumar, M., Paepcke, A., & Winograd, T. (2007). Eyepoint: Practical pointing and selection using gaze
and keyboard. In Proceedings of the sigchi conference on human factors in computing systems (pp.421–430). New York, NY, USA: ACM. Retrieved from http://doi.acm.org/10.1145/1240624.1240692 doi: 10.1145/1240624.1240692
Lankford, C. (2000). Effective eye-gaze input into windows. In Proceedings of the 2000 symposium oneye tracking research & applications (pp. 23–27).
Lehmann, A., Schumann, H., Staadt, O., & Tominski, C. (2011). Physical navigation to support graphexploration on a large high-resolution display. In Advances in visual computing (pp. 496–507).Springer.
O’Hara, K., Gonzalez, G., Sellen, A., Penney, G., Varnavas, A., Mentis, H., . . . others (2014). Touchlessinteraction in surgery. Communications of the ACM, 57(1), 70–77.
O’hara, K., Harper, R., Mentis, H., Sellen, A., & Taylor, A. (2013). On the naturalness of touch-less: putting the “interaction” back into nui. ACM Transactions on Computer-Human Interaction(TOCHI), 20(1), 5.
Perry, M., Beckett, S., O’Hara, K., & Subramanian, S. (2010). Wavewindow: public, performativegestural interaction. In Acm international conference on interactive tabletops and surfaces (pp.109–112).
Quandl. (2015). Quandl financial and economic data. https://www.quandl.com/. (Last ac-cessed July 1, 2016)
Sarkar, A. (2015). The impact of syntax colouring on program comprehension. In Proceedings of the26th annual conference of the psychology of programming interest group (ppig 2015) (pp. 49–58).
Sarkar, A., Blackwell, A. F., Jamnik, M., & Spott, M. (2014). Hunches and sketches: rapid interactiveexploration of large datasets through approximate visualisations. In The 8th international confer-ence on the theory and application of diagrams, graduate symposium (diagrams 2014) (Vol. 1).
Sarkar, A., Blackwell, A. F., Jamnik, M., & Spott, M. (2015). Interaction with uncertainty in visualisa-tions. In E. Bertini, J. Kennedy, & E. Puppo (Eds.), Eurographics/IEEE VGTC Conference on Vi-sualization (EuroVis 2015). The Eurographics Association. doi: 10.2312/eurovisshort.20151138
Spindler, M., Büschel, W., & Dachselt, R. (2012). Use your head: Tangible windows for 3d informationspaces in a tabletop environment. In Proceedings of the 2012 acm international conference oninteractive tabletops and surfaces (pp. 245–254). New York, NY, USA: ACM. Retrieved fromhttp://doi.acm.org/10.1145/2396636.2396674 doi: 10.1145/2396636.2396674
Stellmach, S., & Dachselt, R. (2013). Still looking: Investigating seamless gaze-supported selection,positioning, and manipulation of distant targets. In Proceedings of the sigchi conference on hu-man factors in computing systems (pp. 285–294). New York, NY, USA: ACM. Retrieved fromhttp://doi.acm.org/10.1145/2470654.2470695 doi: 10.1145/2470654.2470695
Stellmach, S., Stober, S., Nürnberger, A., & Dachselt, R. (2011). Designing gaze-supported multimodalinteractions for the exploration of large image collections. In Proceedings of the 1st conferenceon novel gaze-controlled applications (p. 1).
Tominski, C., Gladisch, S., Kister, U., Dachselt, R., & Schumann, H. (2014). A survey on interactivelenses in visualization. EuroVis State-of-the-Art Reports, 43–62.
Wojciechowski, A., & Fornalczyk, K. (2014). Exponentially smoothed interactive gaze tracking method.In Computer vision and graphics (pp. 645–652). Springer.
Ziegler, J. G., & Nichols, N. B. (1942). Optimum settings for automatic controllers. trans. ASME,64(11).