Embed Size (px)
Citation preview

Hydrol. Earth Syst. Sci., 21, 2531–2544, 2017www.hydrol-earth-syst-sci.net/21/2531/2017/doi:10.5194/hess-21-2531-2017© Author(s) 2017. CC Attribution 3.0 License.
A gain–loss framework based on ensemble flow forecasts to switchthe urban drainage–wastewater system management towardsenergy optimization during dry periodsVianney Courdent1,2, Morten Grum1,a, Thomas Munk-Nielsen1, and Peter S. Mikkelsen2
1Krüger Veolia, Søborg, 2860, Denmark2Department of Environmental Engineering, Technical University of Denmark, Kgs. Lyngby, 2800, Denmarkapresent address: WaterZerv, Environmental Services, Denmark
Correspondence to: Vianney Courdent ([email protected])
Received: 1 October 2016 – Discussion started: 17 October 2016Revised: 11 March 2017 – Accepted: 7 April 2017 – Published: 22 May 2017
Abstract. Precipitation is the cause of major perturbation tothe flow in urban drainage and wastewater systems. Flowforecasts, generated by coupling rainfall predictions with ahydrologic runoff model, can potentially be used to opti-mize the operation of integrated urban drainage–wastewatersystems (IUDWSs) during both wet and dry weather peri-ods. Numerical weather prediction (NWP) models have sig-nificantly improved in recent years, having increased theirspatial and temporal resolution. Finer resolution NWP aresuitable for urban-catchment-scale applications, providinglonger lead time than radar extrapolation. However, fore-casts are inevitably uncertain, and fine resolution is espe-cially challenging for NWP. This uncertainty is commonlyaddressed in meteorology with ensemble prediction systems(EPSs). Handling uncertainty is challenging for decisionmakers and hence tools are necessary to provide insight onensemble forecast usage and to support the rationality of de-cisions (i.e. forecasts are uncertain and therefore errors willbe made; decision makers need tools to justify their choices,demonstrating that these choices are beneficial in the longrun).
This study presents an economic framework to support thedecision-making process by providing information on whenacting on the forecast is beneficial and how to handle theEPS. The relative economic value (REV) approach associateseconomic values with the potential outcomes and determinesthe preferential use of the EPS forecast. The envelope curveof the REV diagram combines the results from each probabil-ity forecast to provide the highest relative economic value for
a given gain–loss ratio. This approach is traditionally used atlarger scales to assess mitigation measures for adverse events(i.e. the actions are taken when events are forecast). Thespecificity of this study is to optimize the energy consump-tion in IUDWS during low-flow periods by exploiting theelectrical smart grid market (i.e. the actions are taken whenno events are forecast). Furthermore, the results demonstratethe benefit of NWP neighbourhood post-processing methodsto enhance the forecast skill and increase the range of bene-ficial uses.
1 Introduction
The primary objective of combined urban drainage systems(UDSs) and wastewater treatment plants (WWTPs) is to con-vey and treat waste water and to prevent flooding and com-bined sewer overflows (CSOs). In order to achieve these ob-jectives, pipes and detention basins in combined UDSs aredimensioned to cope with relatively large rain events. Typi-cally, surcharge of manholes and flooding is only allowed tooccur on average every 10 years (as per the Danish regula-tions; Harremoës et al., 2005) whereas overflow occurs morefrequently depending on the local environmental regulations,from 10 times per year to once in 10 years, for example. Thismeans that during dry weather the flow is relatively low com-pared with the conveyance capacity of the UDS and that thestorage capacity is left unused. Rainfall only occurs rarely,e.g. on the study case catchment (more details in Sect. 2.3.)
Published by Copernicus Publications on behalf of the European Geosciences Union.
2532 V. Courdent et al.: A gain–loss framework based on ensemble flow forecasts
the raining period represents 7.2 % of the time. Hence, in-tegrated urban drainage–wastewater systems (IUDWSs) aremostly under low-flow conditions. During these periods theIUDWS management objective can be switched from its pri-ority operational focus on CSO and flood prevention towardsother goals such as energy consumption and CO2 emissions.
Denmark has the political ambitions to have a fossil fuelfree energy system by 2050 which requires the developmentof renewable energy sources (Ministry of Foreign Affairsof Denmark, 2016). One of the main critiques towards re-newable sources such as wind and solar energy is their in-termittent nature. Therefore a key parameter for the transi-tion to a green energy system is the implementation of anelectric smart grid with flexible, proactive consumers to bal-ance the fluctuating power production (Hadjsaïd and Sabonn-odiere, 2012). The European Technology Platform for smartgrids defines the concept of smart grids as an “electricity net-work that can intelligently integrate the actions of all usersconnected to it – generators, consumers and those that doboth – in order to efficiently deliver sustainable, economicand secure electricity supplies” (www.smartgrids.eu/). En-ergy markets are developed, as part of the smart grid, toalign electricity production and consumption through bidsand offers. Hence the electricity price is based on supplyand demand, creating an economic incentive to distribute theenergy consumption in time (e.g. shifting non-essential en-ergy consumption out of the consumption peaks). For fur-ther detailed history and description of electricity markets,see Weron (2006).
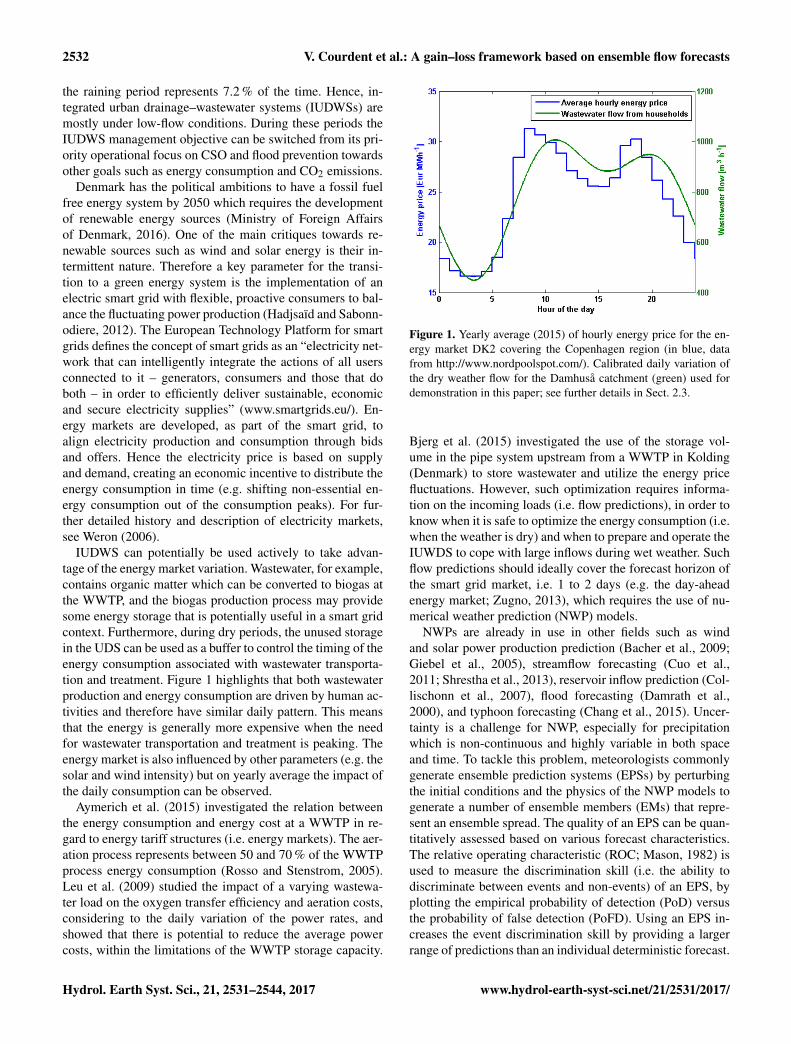
IUDWS can potentially be used actively to take advan-tage of the energy market variation. Wastewater, for example,contains organic matter which can be converted to biogas atthe WWTP, and the biogas production process may providesome energy storage that is potentially useful in a smart gridcontext. Furthermore, during dry periods, the unused storagein the UDS can be used as a buffer to control the timing of theenergy consumption associated with wastewater transporta-tion and treatment. Figure 1 highlights that both wastewaterproduction and energy consumption are driven by human ac-tivities and therefore have similar daily pattern. This meansthat the energy is generally more expensive when the needfor wastewater transportation and treatment is peaking. Theenergy market is also influenced by other parameters (e.g. thesolar and wind intensity) but on yearly average the impact ofthe daily consumption can be observed.
Aymerich et al. (2015) investigated the relation betweenthe energy consumption and energy cost at a WWTP in re-gard to energy tariff structures (i.e. energy markets). The aer-ation process represents between 50 and 70 % of the WWTPprocess energy consumption (Rosso and Stenstrom, 2005).Leu et al. (2009) studied the impact of a varying wastewa-ter load on the oxygen transfer efficiency and aeration costs,considering to the daily variation of the power rates, andshowed that there is potential to reduce the average powercosts, within the limitations of the WWTP storage capacity.
Figure 1. Yearly average (2015) of hourly energy price for the en-ergy market DK2 covering the Copenhagen region (in blue, datafrom http://www.nordpoolspot.com/). Calibrated daily variation ofthe dry weather flow for the Damhuså catchment (green) used fordemonstration in this paper; see further details in Sect. 2.3.
Bjerg et al. (2015) investigated the use of the storage vol-ume in the pipe system upstream from a WWTP in Kolding(Denmark) to store wastewater and utilize the energy pricefluctuations. However, such optimization requires informa-tion on the incoming loads (i.e. flow predictions), in order toknow when it is safe to optimize the energy consumption (i.e.when the weather is dry) and when to prepare and operate theIUWDS to cope with large inflows during wet weather. Suchflow predictions should ideally cover the forecast horizon ofthe smart grid market, i.e. 1 to 2 days (e.g. the day-aheadenergy market; Zugno, 2013), which requires the use of nu-merical weather prediction (NWP) models.
NWPs are already in use in other fields such as windand solar power production prediction (Bacher et al., 2009;Giebel et al., 2005), streamflow forecasting (Cuo et al.,2011; Shrestha et al., 2013), reservoir inflow prediction (Col-lischonn et al., 2007), flood forecasting (Damrath et al.,2000), and typhoon forecasting (Chang et al., 2015). Uncer-tainty is a challenge for NWP, especially for precipitationwhich is non-continuous and highly variable in both spaceand time. To tackle this problem, meteorologists commonlygenerate ensemble prediction systems (EPSs) by perturbingthe initial conditions and the physics of the NWP models togenerate a number of ensemble members (EMs) that repre-sent an ensemble spread. The quality of an EPS can be quan-titatively assessed based on various forecast characteristics.The relative operating characteristic (ROC; Mason, 1982) isused to measure the discrimination skill (i.e. the ability todiscriminate between events and non-events) of an EPS, byplotting the empirical probability of detection (PoD) versusthe probability of false detection (PoFD). Using an EPS in-creases the event discrimination skill by providing a largerrange of predictions than an individual deterministic forecast.
Hydrol. Earth Syst. Sci., 21, 2531–2544, 2017 www.hydrol-earth-syst-sci.net/21/2531/2017/

V. Courdent et al.: A gain–loss framework based on ensemble flow forecasts 2533
The development of high-resolution limited-area NWPmodels has led to more realistic-appearing forecasts. Con-vective precipitations are described in an explicit and moredetailed way using mesoscale atmospheric processes (Sunet al., 2014). These developments foster the opportunity ofUDS applications which require fine temporal and spatialresolution. However, precipitation is one of the most difficultvariables to forecast on an urban scale due to its large vari-ability in space, time and intensity (Du, 2007). Precipitationforecast uncertainties increase rapidly with decreasing spa-tial grid size, as inevitable errors in the position and timing ofrain cells are amplified with the increase in resolution. EPSsaim to describe this uncertainty, but are generally under-dispersive and unable to capture all sources of uncertainty.NWP post-processing methods (also called pre-processingfrom a hydrological modelling point of view) are thus nec-essary to obtain reliable probabilistic forecast as explainedin WWRP/WGNE (2009). Courdent et al. (2017) describedNWP post-processing methods for urban drainage flow fore-casting and compared their event discrimination skills. Theneighbourhood methods (Theis et al., 2005) can, for ex-ample, be used to enhance the forecast skill by accountingfor potentially misplaced rain events. The “maximal threat”method NWP post-processing, used in this study, consideredthe highest rainfall prediction within a given area surround-ing the catchment. The radius of the neighbouring area in-cluded is used as a parameter during the decision making, inaddition to the fraction of EM fEM.
This article presents a framework for objectively optimiz-ing EPS forecast-based decision making in the managementof IUDWSs by selecting the decision threshold fEM and post-processing neighbourhood method, given the specific prob-lem at hand. The relative economic value (REV) approach as-sociates economic values to the outcomes of the decision sys-tem and assesses the forecast value relative to potential bene-fit resulting from a perfect forecast. The preferential manage-ment for a given EPS forecast is characterized by the high-est REV. For example, we considered the decision-makingproblem of switching from normal operation focussing onflow management to dry weather operation focussing on en-ergy optimization linking with the smart grid. To measurethe usefulness of weather forecasts, the forecast skills haveto be converted to potential economic benefits for the userdecision making process. Richardson (2000) used the REVto assess the economic benefit of road gritting to prevent theformation of ice using weather models in comparison to us-ing purely climatological information (i.e. the statistical be-haviour of the weather, such as the return period of an event).Economic values were assigned to the different predictionoutcomes described in a contingency table: (a) hits, (b) falsealarms, (c) misses and (d) correct negatives. These economicvalues represent the benefit of taking actions (or non-action)when the forecast is revealed to be correct against the draw-backs of those actions (or non-action) in case of forecast er-ror.
EPS provides a range of prediction skills characterized bythe combined choice of post-processing method and decisionthreshold (fEM) used to predict an event. The REV of eachcombination is quantified considering the occasions when theforecast proves to be beneficial, detrimental or neutral to theuser, as well as the economic value associated with these sit-uations. The higher the cost of inappropriate action relative tothe potential gain, the more certainty the user requires aboutthe forecast before he or she takes action.
Previous studies on REV analysis typically assessed thebenefit of prevention measures mitigating severe weatherevents, such as frost (Richardson, 2000), intense precipita-tion (Atger, 2001), river floods (Roulin, 2007) and typhoons(Chang et al., 2015), expressed as a cost–loss ratio. Thisstudy develops a different perspective, assessing the poten-tial benefit of optimizing IUDWS when the forecast predictsperiods with low flow (i.e. dry weather when no events areforecast). Therefore, our decision model is not based on acost–loss ratio but a gain–loss ratio. Furthermore, the stud-ies mentioned consider a fixed ratio, whereas in our case(i) the gain depends on smart grid variations and (ii) the lossis related to the risk of CSO and the negative impact on theWWTP operation. Hence, the gain–loss ratio and the opti-mum combination of post-processing method and decisionthreshold need to be reassessed for each time step.
This paper is organized as follows: Sect. 2 introduces theDMI-HIRLAM-S05 weather model, which provides the rain-fall forecast used in our study, the NWP post-processingmethod applied and the hydrological rainfall–runoff model.Section 3 describes the prediction performance evaluationmethods used, including the ROC and the REV diagrams.Results and prediction examples are presented and discussedin Sect. 4. Finally, Sect. 5 provides the conclusions.
2 Material: NWP data, study case and hydrologicalmodel
As emphasized by Shrestha et al. (2013), the evaluation ofNWP model precipitation forecasts for streamflow forecast-ing should be done with a hydrological perspective. There-fore, as recommended by Pappenberger et al. (2008), theevaluation of urban drainage flow forecasts is in this paperbased on a coupled meteorological and hydrological model.Hence, the forecast skills are assessed based on dischargepredictions and discharge observations rather than precipita-tion forecasts and precipitation observations. This methodol-ogy considers the importance of the dominant hydrologicalprocesses and the nonlinear error transformation by the hy-drological model.
This section describes the NWP model and data used inthe study. Then the post-processing neighbourhood methodsare presented, the urban catchment study case is presented,the hydrological model is described, and finally the energymarket data that was used is presented.
www.hydrol-earth-syst-sci.net/21/2531/2017/ Hydrol. Earth Syst. Sci., 21, 2531–2544, 2017

2534 V. Courdent et al.: A gain–loss framework based on ensemble flow forecasts
2.1 The EPS HIRLAM-DMI-S05 numerical weatherprediction (NWP) model
The rainfall forecasts used in this study were generated bythe DMI-HIRLAM-S05 model and were provided by theDanish Meteorological Institute (DMI). This NWP modelhas a horizontal resolution of 0.05◦ (approx. 5.6 km) and aforecast horizon of 54 h with hourly time-step predictions.New forecast are generated every 6 h, at 00:00, 06:00, 12:00and 18:00 UTC. The DMI-HIRLAM-S05 ensemble is a 2-dimensional EPS comprising 25 members based on 5 differ-ent initial conditions and 5 different model structures. Forfurther description of the processes and parameters men-tioned above, see the HIRLAM technical documentation(Unden et al., 2002), the DMI technical report (Feddersen,2009) and the HIRLAM website (http://www.hirlam.org/).This study uses 2 years of archived EPS NWP data (fromJune 2014 to May 2016).
2.2 Enhancing forecast by post-processing NWP EPSdata
Two NWP post-processing methods developed in Courdentet al. (2017) were used in this study: (i) the realistic catch-ment “weighted areal overlap” method which only consid-ers the grid cells overlapping the hydrologic catchment andweighs them based on the percentage of overlap and (ii) themaximal threat in the surroundings method, which consid-ers cells within a defined radius around the catchment. Themaximal threat method combines the worst-case-scenario ap-proach and the neighbourhood method developed by Theis etal. (2005), and accounts for neighbourhood cells in the pre-diction as illustrated by Fig. 2. Hence, the maximal threat ap-proach considers as input, for each EM, the highest rainfallintensity in the surroundings. This method keeps the sameensemble size as the weighted areal overlap method and re-duces the number of missed events but increases the numberof incorrectly predicted or over-predicted events.
2.3 Study case
The economic framework developed in this study was ap-plied on the Damhuså urban drainage catchment (Copen-hagen, Denmark). This 67 km2 highly urbanized area com-posed of compact residential housing is equipped with acombined sewer system which conveys wastewater, rainfallrunoff from paved surfaces and infiltration inflow, especiallyin the winter months. This catchment was chosen for theabsence of major flow-control infrastructures affecting itshydraulic response in order to simplify the modelling ap-proach needed for our demonstration. The Damhuså WWTPhas a capacity of 350 000 PE (population equivalent). Itsbiological treatment has a maximal hydraulic capacity of10 000 m3 h−1. In 2015, the WWTP treated 33 390 000 m3
and consumed 8735 MWh of electricity, which correspond to
Figure 2. Illustration of the 6-grid-cell radius used by the maximalthreat neighbourhood approach, for the Damhuså catchment usedfor demonstration in this paper (Courdent et al., 2017).
a ratio of 0.261 kWh m−3. In parallel, the WWTP produced8735 MWh of heat and 211 MWh of electricity from its bio-gas engine (BIOFOS, 2015).
Rainfall observation data were obtained from the nationalDanish SVK rain gauge network (blue circles in Fig. 3)which is operated by the Danish Meteorological Institute(DMI) and the Water Pollution Committee of the DanishSociety of Engineers (SVK – Spildevandskomiteen, in Dan-ish). The rainfall measurements were recorded with a 1 mintemporal and a 0.2 mm volumetric resolution; for more in-formation see Jørgensen et al. (1998). The catchment outlet(red hexagon in Fig. 3) is a combined sewer pipe intercep-tor with a maximum capacity of 10 000 m3 h−1. Once thisthreshold is reached, CSOs occur. The overflowing water isdischarged, untreated, into a nearby small river (Damhuså)while the remaining flow is discharged through the intercep-tor pipe, which is monitored using an electromagnetic flowmeter with a 2 min temporal resolution and operated by theutility company HOFOR.
This study is based on event prediction by characterizingthe flow status in the IUDWS and distinguishing two do-mains: (i) periods with high flows during which the man-agement objective is to maximize the hydraulic capacity ofthe WWTP to limit the impact of CSO, etc., and (ii) periodswith low flows during which the management objectives canbe switched to WWTP operational efficiency, minimizing en-ergy consumption, etc. The event definition should be evalu-ated relatively to the specific IUDWS and low-flow optimiza-tion scheme in focus. In this study the occurrence of an eventis defined by a flow exceedance of 4000 m3 h−1 over a 1 hperiod. For each NWP the occurrence (or non-occurrence) of
Hydrol. Earth Syst. Sci., 21, 2531–2544, 2017 www.hydrol-earth-syst-sci.net/21/2531/2017/

V. Courdent et al.: A gain–loss framework based on ensemble flow forecasts 2535
Figure 3. The Damhuså urban drainage catchment, Copenhagen, Denmark (contributing area: green area on the map).
a high-flow event is assessed for each hourly time step fore-cast.
2.4 Hydrological model description
The hydrological model is composed of three main concep-tual parts: (i) the wastewater flow from households is mod-elled using second-order Fourier series (see, for example,Langergraber et al, 2008), (ii) the fast rainfall runoff from im-pervious areas is represented by a lumped conceptual modelusing the Nash linear reservoir cascade concept (Nash, 1957)and (iii) the slow runoff (caused e.g. by infiltration-inflow)is also modelled based on the Nash linear reservoir cascadeconcept using a wetness index characterized by the monthlypotential evaporation and previous rainfall events. This hy-drological model is further detailed in Courdent et al. (2017).The wastewater flow parameters were estimated first, us-ing flow observations from summer periods without rainfallevents to avoid influence from the two other processes. Then,using fixed wastewater parameters, the parameters of the fastrainfall runoff were estimated based on rain and flow datafor rain events during summer months, to avoid influencefrom the slow runoff process, which was calibrated last forthe full period (from November 2012 to November 2014). Inall cases, the calibration was conducted using the differen-tial evolution adaptive metropolis (DREAM) method (Laloyand Vrugt, 2012), considering the root mean square error asobjective function.
2.5 Energy market data
This study used historical data from the day-ahead energymarket provider Nord Pool. The day-ahead market has 24 hlead time. Buyers and suppliers submit bids and offers foreach hour of the next day and each hourly market clear-ing price is set such that it balances supply and demand.The intra-day market, which only has 1 h lead time, is act-ing as a balancing market to support the day-ahead mar-ket. The hourly energy prices are defined over a geograph-ical area. The geographical area corresponding to our casestudy is DK2 which covers the entire Zealand (http://www.nordpoolspot.com/).
3 Methodology
3.1 Contingency table
The probability that the flow will exceed a given threshold isestimated as the fraction of EMs predicting an event. Theensemble (probability) forecast can be converted to a sin-gle binary forecast by selecting a decision threshold (fEM,threshold probability). If the fraction of EMs, predicting anevent is higher or equal to the decision threshold (fEM), thenan event is forecast.
The empirical performance over a period of time of a bi-nary forecast can be summarized in a 2× 2 contingency ta-ble showing the number of correctly and incorrectly forecastevents occurring or not occurring (Table 1). Hits (a) repre-sent the correct positives, false alarms (b) represent the falsepositives, misses (c) represent the false negatives and the cor-
www.hydrol-earth-syst-sci.net/21/2531/2017/ Hydrol. Earth Syst. Sci., 21, 2531–2544, 2017

2536 V. Courdent et al.: A gain–loss framework based on ensemble flow forecasts
Table 1. Contingency table (with n the sample size).
Event forecast Event observed
Yes No
Yes hits (a) false alarms (b) a+ b
No misses (c) correct negatives (d) c+ d
a+ c b+ d a+ b+ c+ d = n
Table 2. Verification measures based on the contingency table.
Score Formula Range Perfect
Probability of detection, PoD a/(a+ c) [0,1] 1Probability of false detection, PoFD b/(b+ d) [0,1] 0Occurrence frequency of events, µ (a+ c)/n [0,1] n/a
n/a: not applicable.
rect negatives (d) represent the correct forecasts of no eventsoccurring. Measures of performance of a sequence of binaryforecasts can be formulated as a function of these four out-comes (a, b, c and d). Those four possible outcomes sumup to n, which corresponds to the total number of events as-sessed. Each event corresponds to the flow status of a givenhourly time step forecast from a given NWP. The differentlead times of the NWP are aggregated in the results.
Table 2 displays the verification measures used in this pa-per; a comprehensive review and further description of veri-fication measures can be found in the meteorological litera-ture, e.g. WWRP/WGNE (2009) and Wilks (2011).
The PoD is defined as the fraction of occurrences of eventsthat were correctly forecast (i.e. hits), while the PoFD is thefraction of non-occurrences of events that were incorrectlyforecast (i.e. false alarms). The empirical occurrence fre-quency (µ) expresses climatological information about theoccurrence of events.
3.2 Brier skill score
The Brier score (Brier, 1950) assesses forecast quality of dis-crete probability forecasts predicting binary outcomes (i.e.“events” and “non-events”) and is comparable to the meansquare error. For a given t th hourly forecast time step, theforecast probability of an event (0≤ fEM, t ≤ 1) is comparedto the observation (yt ). If the t th observation is an event (ornon-event) then yt = 1 (or yt = 0).
BS=1n
n∑t=1(fEM, t − yt )
2 (1)
The Brier skill score (BSS) is formulated as a skill score re-lated to a reference forecast, e.g. climatology in meteorology.In our case the reference forecast is based on the frequencyof occurrence of events during the recorded forecast period(µ). A positive value of the BSS indicates that forecast is
Figure 4. Example of a relative operating characteristic (ROC) dia-gram.
beneficial compared to the reference forecast.
BSS= 1−BS
BSrefwith BSref =
1n
n∑t=1(µ− yt )
2 (2)
3.3 Relative operating characteristic (ROC)
The relative operating characteristic (ROC), which originatesfrom signal detection theory (Mason, 1982), measures thediscrimination ability (i.e. the ability to discriminate betweenevents and non-events) of an EPS. The ROC plots the PoDversus the PoFD using a set of decreasing probability deci-sion thresholds (Fig. 4). The selection of a lower decisionthreshold fEM to convert the ensemble forecast to a singleforecast is more conservative towards correctly predictingevents. Therefore the PoD will be higher but the PoFD willincrease as well.
The ROC diagram of the flow domain distinction usingthe weighted areal overlap NWP post-processing method isdisplayed in Fig. 4. The blue dots represent the discrimi-nation skill of each individual EM. Figure 4 shows that allEMs have comparable discrimination skill. The red dots cor-respond to the discrimination skills from all decision thresh-olds, from fEM = 1 at the bottom left (i.e. all EMs should
Hydrol. Earth Syst. Sci., 21, 2531–2544, 2017 www.hydrol-earth-syst-sci.net/21/2531/2017/

V. Courdent et al.: A gain–loss framework based on ensemble flow forecasts 2537
agree on the event occurrence) to fEM =1N
on the top right(i.e. the prediction of an event from a single EM is enoughto consider an occurrence). Figure 4 underlines that EPSsand decision thresholds provide a larger range of availableprediction skills than an EM individually. The choice of adecision threshold represents a trade-off between predictingevents correctly and generating false alarms.
The skill score of a ROC diagram is calculated based onthe area under the curve (ROCA). The ROCA ranges from 0to 1, with a score of 1 corresponding to a perfect forecast anda score of 0.5 corresponding to the skill of a random forecastbased on the probability of occurrence (µ).
3.4 Relative economic value (REV)
A proper evaluation of the benefits of a forecast systemshould not only consider the forecasts skill, e.g. using PoDand PoFD, or BSS. A detailed knowledge of the decision-making process is needed to answer the question: “how doesthis skill translate to an economic value of a forecast?”.Furthermore, when using ensemble forecasts, the followingquestion should be answered as well: “which decision thresh-old and NWP post-processing method for the EPS is the mostbeneficial for my purpose?”.
The economic benefit from a forecast depends on the alter-native courses of action and their consequences. Each courseof action is associated with a cost and leads to economic ben-efit or loss depending on the observed outcome. The task isthus to choose the appropriate actions that will maximize theexpected gain or minimize the expected loss. The usefulnessof the forecast can thus be quantified by considering the occa-sions when the forecast was beneficial, detrimental or neutralwith respect to the process of decision making.
The relative economic value of our urban hydrological pre-diction system is here inspired by the relatively simple cost–loss ratio decision model introduced by Richardson (2000).Richardson developed this approach to assess the economicvalue of taking costly actions to mitigate the consequencesof forecast adverse weather events in order to reduce the po-tential loss associated with them. The decision threshold thatcan empirically be shown to lead to the lowest expense in thelong term should be adopted. Richardson illustrated his ap-proach for the problem of road gritting to prevent the forma-tion of ice. Subsequently Roulin (2007) used this approach toinvestigate the benefit of river-flow mitigation measures fortwo catchments in Belgium, and Chang et al. (2015) appliedit to assess the relevance of typhoon mitigation measures inTaiwan.
All these studies consider adverse events which can bemitigated at a cost, reducing the loss associated with theseevents, and their decision models are therefore based on acost–loss ratio. This study investigates a different perspec-tive. Instead of taking mitigating measures when adverseevents are predicted, the system is optimized when no eventsare predicted in order to achieve a positive gain, and left un-
Table 3. Economical value assigned to the different outcomes of thecontingency table (L: loss; G: gain).
Event observed
Event forecast Yes No
Yes 0 0No L G
der its traditional management when events are predicted.Therefore, our decision model is based on a gain–loss ra-tio. During low-flow periods, when no events are forecast,the management objective is switched to energy consump-tion by utilizing the smart grid energy market, leading to again (G). As a consequence, mis-predicted high-flow eventswill jeopardize the IUDWS, e.g. the detention basins may notbe empty in time. These negative outcomes are representedby a loss (L). In the case of forecast events (hits and falsealarms), the management objectives of the IUDWS remainunchanged. The economic outcome of these two situationsremains the same and therefore a null value is assigned tothem; see Table 3.
Furthermore Richardson (2000) used a static ratio, thecost of mitigation measures and reduction of loss associatedwere fixed. This study encompasses the possibility of a time-dependent gain–loss ratio. Indeed, the gain (G) from switch-ing the management objectives to energy optimization de-pends on the state of the energy market at the given time.Similarly, the loss (L) resulting from mis-predicted events isrelated to the current status of the IUWDS, e.g. the volumeof water stored.
Based on Tables 2 and 3 the expected economic value ofusing the forecast for decision making over one time step (nrepresents the total number of time steps) can be expressedempirically as follows:
Eforecast =d ·G− c ·L
n. (3)
In case of a perfect forecast (b = c = 0) the economic valuewould be as follows:
Eperfect = d ·G
n= (1−µ) ·G. (4)
If no forecasts are available, the optimal course of action canbe determined based on the empirical frequency of occur-rence of an event, µ (climatological information in case ofweather event as for Richardson, 2000). The two possiblecourses of action are either to always optimize the system de-spite the losses or to never optimize the system. Estatistic con-siders the highest economic value between these two coursesof action (Eq. 5); never optimizing (i.e. the IUDWS man-agement is unchanged) would lead to an null economic valuewhereas always optimizing would lead to a gainG associated
www.hydrol-earth-syst-sci.net/21/2531/2017/ Hydrol. Earth Syst. Sci., 21, 2531–2544, 2017

2538 V. Courdent et al.: A gain–loss framework based on ensemble flow forecasts
to a loss L when events do occur.
Estatistic =max(G−µ ·L, 0) (5)
The relative economic value (REV), as defined by Richard-son (2000), compares the benefit of acting on a given forecastto the benefit which would be achieved by acting on a perfectforecast as a ratio (Eq. 6).
REV=Eforecast−Estatistic
Eperfect−Estatisic(6)
The REV expressed by Eq. (6) can be reformulated usingEqs. (3), (4) and (5) and expressed as a function of the PoD,the PoFD, the frequency of occurrence (µ) and the gain–lossratio (α = G
L) as shown by Eq. (7) and displayed in Fig. 5.
REV= (7)α · (1−µ) · (1−PoFD)− (1−PoD) ·µ−max(α−µ,0)
α · (1−µ)−max(α−µ,0)
The possible value of the REV ranges from 1, correspond-ing to a perfect forecast, to minus infinity. In case of positiveREV the use of the forecast is beneficial, whereas a negativeREV indicates that using statistical information and eitheralways or never optimizing the IUDWS yields a better eco-nomic value than using the weather forecast. Hence the REVcan be divided in 3 domains: (i) the interval on the right of thecurve in which it is preferable to always optimize (dotted do-main on the right side of Fig. 5), (ii) the interval with positiveREV covered by the curve in which using the forecast is ben-eficial (middle domain in Fig. 5) and (iii) the interval on theleft in which it is preferable to never optimize (crosshatcheddomain on the left side of Fig. 5). Assuming that a per-fect knowledge of the future yields a benefit β (compared topurely statistical information), then using the actual forecastprovides a benefit to the user of (100 ·REV)% of β.
Figure 6 displays the ROC diagram and the REV-α rela-tionship for flow forecast based on the catchment weightedareal overlap post-processing method. As explained inSect. 3.3. the ROC diagram describes the EPS forecast dis-crimination skill for the different decision thresholds, fEM.To support decision making the ROC diagram is convertedto the REV-α relationship. Each point of the ROC diagram(Fig. 6a) represents a discrimination skill (PoD, PoFD) for agiven decision threshold based on the fraction of EMs pre-dicting an event (fEM). For each of these points the REV canbe determined as a function of the gain–loss ratio α (Eq. 7and Fig. 5).
4 Results and discussion
4.1 ROC, REV and NWP post-processing methods.
The REV is closely related to the ROC diagram as indicatedby Richardson (2000); Zhu et al. (2002) and illustrated in
Figure 5. The 3 domains of operation of the REV curve as a func-tion of the gain–loss ratio α.
Fig. 6. The curves in Fig. 6b show the REV-α relationshipfor the decision thresholds (fEM) highlighted in Fig. 6a. Thegreen dot (number 5) in Fig. 6a corresponds to a decisionthreshold fEM = 1/25 and provides the highest PoD for thisEPS; the REV associated with it, i.e. the green line (num-ber 5) in Fig. 6b, leads to the highest REV for low α values(below 0.105) which corresponds to a high negative impactof missed events. Other decision thresholds yield better REVfor higher α, e.g. the decision threshold fEM = 5/25 corre-sponding to the red dot (legend 4) in Fig. 6a provides thehighest REV (legend 4) for α within the range [0.16; 0.18].Hence as demonstrated by Richardson (2000) the ensemblehas better discrimination and can provide higher REV to awider range of users (i.e. larger interval with positive REV)than any individual deterministic forecast (colour line) as il-lustrated by the envelope curve.
The implementation of the IUDWS energy consumptionoptimization scheme is challenged by potentially missedhigh-flow events. Indeed, these situations would lead to inap-propriate management, jeopardizing the performance of theIUDWS. As explained in Sect. 2.2, post-processing methodscan be applied to enhance the NWP, e.g. by accounting forpotentially misplaced events which can have significant im-pact at an urban hydrology scale. Figure 7 displays the re-sult considering the NWP maximal threat post-processingEPS method with a 6-grid-cell radius around the catch-ment. This approach is more conservative towards avoidingmissed events and yields higher PoD at the cost of higherPoFD, which extends the ROC diagram. The ROC curves inFig. 7a show that the two approaches are complementary; theareal overlap method provides better discrimination skill forlow PoFD whereas the maximal threat EPS post-processingmethod provides better discrimination skill for higher PoFD.
Hydrol. Earth Syst. Sci., 21, 2531–2544, 2017 www.hydrol-earth-syst-sci.net/21/2531/2017/

V. Courdent et al.: A gain–loss framework based on ensemble flow forecasts 2539
Figure 6. ROC and REV diagram for flow domain forecast based on catchment weighted areal overlap.
Figure 7. ROC and REV diagram for flow forecasts considering the two NWP post-processing methods: the maximal threat EPS methodwith a neighbourhood radius of 6 grid cells in colour and the catchment weighted areal overlap method in grey colour as background.
The ROCA of each approach is respectively 0.86 and 0.91and the ROCA merging both approaches is 0.92.
This new ROC curve results in the extension of the α-interval with positive REV which characterizes the range ofbeneficial forecast use (Fig. 7b). To ease the comparison thearea under the envelope curve of the areal overlap approachis displayed in grey colour as background in Fig. 7b, and Ta-ble 4 gives intervals of positive α for both approaches. Theweighted areal overlap provides a slightly better upper boundwhereas the maximal threat approach significantly expandsthe interval of positive REV for low α values. Therefore, us-ing this NWP post-processing approach increases the rangeof beneficial forecast usages.
The comparison between these two NWP-post processingapproaches using the Brier Skill Score (BSS) shows a dete-rioration of the forecast skill when using the maximal threat
approach, which has a negative BSS indicating that the fore-cast performs worse than the reference forecast based on thefrequency of occurrence of an event (µ). This decrease inperformance can be explained by an increase in false alarmsdue to the precautions towards not missing a major rain eventof this approach. This result underlines the need for an eco-nomical assessment rather than purely forecast skills to drawconclusions of the usefulness of a forecast for a given deci-sion making situation.
4.2 Examples of EPS flow domain prediction
In order to illustrate the different situations of decision mak-ing taken as a starting point for this paper (i.e. when toswitch from flow management to energy management andvice versa) a range of 4 theoretical α-values were consid-
www.hydrol-earth-syst-sci.net/21/2531/2017/ Hydrol. Earth Syst. Sci., 21, 2531–2544, 2017

2540 V. Courdent et al.: A gain–loss framework based on ensemble flow forecasts
Table 4. BSS and REV characteristics for the two different NWP post-processing methods.
ROCA α-interval BBS
Lower bound Upper bound
Weighted areal overlap 0.86 0.0208 0.3955 0.14Maximal threat 6-cell radius 0.91 0.0049 0.3940 −1.52
Figure 8. REV curves for the EPS NWP post-processing maximal threat in a radius of 6 grid cells from the catchment (a, left plot) andbest decision threshold according to the α-value (b, right plot), in blue for the maximal threshold approach and in grey for the areal overlapapproach.
Table 5. Decision threshold and REV for the theoretical 4 α-valuesconsidered, using the maximal threat post-processing method.
α REV Prediction criteria
Decision Threshold NWP post-processing
1/2 Negative Always energy objective
1/20 0.59 fEM = 11/25 Maximal Treat EPS1/100 0.30 fEM = 1/25 Maximal Treat EPS
1/500 Negative Never energy objective
ered, Table 5. The two outer α-values yield negative REV in-dicating that using the forecast data is not beneficial in thesecases. The two other α-values yield positive REV indicatingthat using the forecast is beneficial in these cases. The de-cision threshold (fEM) generating the highest relative benefitbased on empirical data are displayed in Fig. 8 and in Table 5.
The coupled hydro-meteorological model provides an en-semble prediction of the flow at the catchment outlet for theincoming 2 days. Figure 9 provides an example of predic-tion. The first panel, Fig. 9a, displays the energy market dur-ing those two days, providing insight in the variation of theenergy price and the CO2 footprint through the proportionof wind energy. The shown data are based on historical val-
ues but similar information are available in real time on theelectric smart grid. The fluctuation of the energy market forboth parameters (Fig. 9a) illustrates the variation of the α-value in relation to the potential gain during a given period.During the first day (29 April 2015) the energy price rangesfrom 24 to 32 C MWh−1 and the proportion of wind energyvaries from 15 to 49 %, whereas during the second day (30April 2015) the energy price range from 23 to 41 C MWh−1
and the proportion of wind energy varies from 1 % to above53 %. Hence the switch of consumption of 1 MWh can yieldup to EUR 8 during the first day and up to EUR 18 duringthe second day. For comparison, the energy consumption perm3 treated at Damhuså WWTP in 2015 was 0.261 kWh m−3
and in average 20 000 m3 are treated during a dry day. Pump-ing and aeration of the biological treatment are the dominat-ing energy users. The aeration of the bioreactor representsbetween 50 and 70 % of process energy consumption andlargely depends on the inflow/load to the WWTP (Aymerichet al., 2015). The potential for energy switch highly depen-dents to the storage volume available upstream.
The North Pool Energy Market DK2, covering the Copen-hagen area, has a Pearson correlation coefficient of −0.52between energy price and proportion of wind energy in 2015,indicating a moderate negative linear relationship. Hence en-ergy consumption optimizations based on economic objec-tives could also yield environmental benefits and vice versa.
Hydrol. Earth Syst. Sci., 21, 2531–2544, 2017 www.hydrol-earth-syst-sci.net/21/2531/2017/

V. Courdent et al.: A gain–loss framework based on ensemble flow forecasts 2541
Figure 9. Example illustration of the EPS flow prediction system for 2 selected days, 29–30 April 2015. Energy market parameters, energyprice and proportion of wind power (1, a), ensemble flow predictions using the areal average (b) and maximal threat (c) post-processingmethods, and (d) flow domain predictions for the two post-processing methods and for each two decisions thresholds; cf. Table 5 (colouredareas imply that an event is predicted, otherwise not).
However it should be noticed that the control of the energyconsumption based on the energy market can results in a de-crease of the expenses together with an increase of the overallenergy consumption as observed in Aymerich et al. (2015).
Figure 9b represents the flow forecast based on the catch-ment weighted areal overlap approach and Fig. 9c representsthe flow forecast based on the maximal threat EPS approachwith a 6-grid-cell radius. The measured flow during this pe-riod shows two minor rain events without significant flow im-pact the first day and a major rain event leading to high flowsexceeding the 4000 m3 h−1? in the IUDWS the second day.Figure 9b illustrates the difficulty of the prediction to havea correct timing, most EMs predict the high-flow event butoften too early. It can be noticed that due to the conservative-ness of this second approach the EPS plume of flow forecastsoverestimates the observed flow (in red), which explains theworsening of the BSS when using this approach.
The best flow domain predictions, considering a givenα, is provided by the decision threshold defined using theREV method presented in Sect. 3.4. As displayed in Table 5,the highest REV for α = 1/20 (respectively α = 1/100) isachieved using the NWP post-processing approach “Max-imal Threat EPS” with fEM =
1125 (respectively fEM =
125 ).
The flow domain predictions based on these criteria and on
the EPS flow forecast displayed in Fig. 9b and c are shown bythe blue hatched (respectively plain blue) colour in Fig. 9d.
4.3 Outlooks
As mentioned in Sect. 4.2, the potential benefit from the en-ergy consumption optimization management is largely con-ditioned by the storage volume available upstream. A ma-jor project is currently under implementation to comply withnew regulations on CSO. Two large pipes will be constructedjust before the inlet of the WWTP with a volume equivalentto the daily dry weather flow to the WWTP. This large storagevolume, soon available upstream from the WWTP, providesan opportunity for real world implementation of the conceptdeveloped in this paper. Halvgaard et al. (2017) present amodel predictive control (MPC) to control the power con-sumption of pumps in a sewer system and the treatmentpower consumption according to electricity prices and efflu-ent quality (nitrogen) based on a case study at Kolding. Thecontroller is able to balance electricity costs and treatmentquality during predicted dry weather flow periods.
The predictions and therefore the skills of the EPS arebased on a coupled meteorological and hydraulic model.This study used a lumped conceptual hydraulic model; a
www.hydrol-earth-syst-sci.net/21/2531/2017/ Hydrol. Earth Syst. Sci., 21, 2531–2544, 2017

2542 V. Courdent et al.: A gain–loss framework based on ensemble flow forecasts
more detailed hydrological model, including stochastic pro-cesses and on-line assimilation of flow measurements, mightimprove the prediction and thereby improve the REV fur-ther. Similarly, NWP models are continuously improving andbenefit from the constant increase of computational calcula-tion power to enhance their resolution and ensemble size.The techniques of data assimilation from radar measure-ment into NWP models are also consistently improving (Ko-rsholm et al., 2015). Weather services are collaborating tocontinuously improve their meteorological models. For ex-ample, the HIRLAM consortium which developed the modelstructure of the DMI-HIRLAM-S05 NWP used in this studyis currently developing and launching the non-hydrostaticconvection-permitting HARMONIE model in cooperationwith Météo-France and ALADIN, and EPSs with forecasthorizons of up to 2 weeks are also available at the Euro-pean level (http://www.ecmwf.int/). Therefore the accuracyand lead time of the prediction, and hence the potential bene-fit from the framework developed in this article, are expectedto increase in the future.
Additionally, other characteristics of NWP can be utilized.The DMI-HIRLAM-S05 model, for example, generates anew 54 h EPS forecast every 6 h, and thereby the successiveforecasts are overlapping each other. The forecast consis-tency, or in reverse the “forecast jump”, provides valuable in-formation on forecast uncertainty which could be utilized inthe decision-making process. For example, the time-laggedmethod (Mittermaier, 2007) uses consecutive forecast over-lapping to extend the EPS and enhance the predictions (i.e.the horizon of the forecast is reduced but its ensemble sizeis increased). This may increase the range of positive REVand allow use of the concept for decisions related to otherproblems than the energy optimization problem studied here.
Control systems can be decomposed into different layersin a hierarchy. Mollerup et al. (2016) presents a methodologi-cal approach to the design of optimized control strategies forsewer systems. The framework presented in this paper tar-gets the upper layer of the hierarchy presented by Mollerupet al. (2016): the management of objectives where switch-ing between different operational modes may take place.Completely different optimizing control strategies, includ-ing model predictive control techniques, may then run underdifferent operation conditions – such as the “flow control”and “energy optimization” operational modes considered inthis paper. Implementing such a switching system in prac-tice requires that the gain–loss ratio expressing the economicconsequences associated with the outcomes of the differentcourses of action used for the REV is quantified, which re-quires further research on monetization of non-market goods(e.g. CO2 footprint or the environmental impact of CSOs)and may depend on local circumstances.
5 Conclusions
An ensemble flow prediction system for an IUDWS was de-veloped using the DMI-HIRLAM-S05 EPS as input to a hy-drological model. This system was tested on an urban catch-ment in the Copenhagen area based on recorded rainfall fore-casts and flow data for the period from June 2014 to May2016. Ensemble forecasting requires adaptation of the man-agement rules in order to use probability forecasts insteadof a deterministic forecast. The usefulness of the forecastshould be evaluated not only based on its quality in termsof traditional skill scores but also based on its economicvalue for the daily decision-making process of the forecastuser considered. The decision problem considered here is theswitch from normal flow management during high-flow pe-riods (wet weather) to smart grid energy optimization duringlow-flow periods (dry weather).
This article presents a framework to support decision mak-ing based on the prediction of the occurrence or lack ofoccurrence of an event using an EPS. The outcomes (gainfor positives and loss for negatives) of the different possi-ble courses of action are valued to determine the REV ofusing the forecast. The REV is closely related to the ROCdiagram, which assesses the range of discrimination skillsof an ensemble forecast. Hence, a REV curve, as a functionof the gain / loss ratio α, can be generated for each proba-bility threshold (fEM) of the EPS. This method was devel-oped in order to switch the IUDWS management objectivefrom flow management to energy optimization, utilizing theelectric smart grid when low-flow periods are predicted. Thisapproach is based on daily optimization when non-events(dry weather) are forecast and differs from previous stud-ies based on the REV concept, which investigated mitigationmeasures taking place when adverse events are forecast (e.g.flood, tornado) using a cost–loss ratio. In our approach for agiven gain–loss ratio α, the probability threshold (fEM) cor-responding to the highest REV, symbolized by the envelopecurve, should be applied to maximize the benefit of the op-timization scheme. If the gain–loss ratio is outside the rangeof positive REV, then using the forecast is not beneficial. Thegain–loss ratio α is a function of the potential gain from uti-lizing the variation of the smart grid energy market, whichvaries in time.
Two NWP post-processing methods were tested: (i) a real-istic approach based on the weighted areal overlap betweenthe NWP grid cells and the hydrological catchment, and (ii) amore conservative approach considering the maximal rain-fall threat in the catchment vicinity. The second approachleads to a deterioration of classic forecast validation scoressuch as BSS due to a significant increase in the number offalse alarms. However, this approach proves to be beneficialin regard to the decision-making process, especially whenconsidering a low gain–loss ratio α for which missed fore-cast events are highly detrimental. Indeed, the maximal threatNWP neighbourhood post-processing method improves the
Hydrol. Earth Syst. Sci., 21, 2531–2544, 2017 www.hydrol-earth-syst-sci.net/21/2531/2017/

V. Courdent et al.: A gain–loss framework based on ensemble flow forecasts 2543
range of discrimination skill of the predictions shown onthe ROC diagram and therefore provides a larger range ofpositive REV, increasing the range of beneficial forecast us-age. This underlines the importance of assessing the forecastusefulness based on its potential economic value rather thansolely on the usual forecast skills.
Data availability. The data used in this paper are not publicly avail-able.
Competing interests. The authors declare that they have no conflictof interest.
Acknowledgements. This research was financially supported bythe industrial PhD programme of the Innovation Fund Denmark.The catchment and flow data were kindly provided by CopenhagenUtility Company (HOFOR). We would like to thank the Dan-ish Meteorological Institute (DMI), especially Henrik Feddersen,for providing EPS data from their NWP model DMI-HIRLAM-S05.
Edited by: P. WillemsReviewed by: three anonymous referees
References
Atger, F.: Verification of intense precipitation forecasts from sin-gle models and ensemble prediction systems, Nonlin. ProcessesGeophys., 8, 401–417, doi:10.5194/npg-8-401-2001, 2001.
Aymerich, I., Rieger, L., Sobhani, R., Rosso, D., and Coromi-nas, L.: The difference between energy consumption andenergy cost: Modelling energy tariff structures for wa-ter resource recovery facilities, Water Res., 81, 113–123,doi:10.1016/j.watres.2015.04.033, 2015.
Bacher, P., Madsen, H., and Nielsen, H. A.: Online short-term solar power forecasting, Sol. Energy, 83, 1772–1783,doi:10.1016/j.solener.2009.05.016, 2009.
BIOFOS: Miljøberetning, Copenhagen, available at: http://www.biofos.dk/wp-content/uploads/2014/11/Miljoeberetning-2015.pdf (last access: 1 April 2017), 2015.
Bjerg, J. E., Grum, M., Courdent, V., Halvgaard, R., Vezzaro, L.,and Mikkelsen, P. S.: Coupling of Weather Forecasts and SmartGrid-Control of Wastewater inlet to Kolding WWTP (Denmark),in: 10th International Urban Drainage Modelling Conference,47–59, Mont Sainte-Anne, Québec, Canada, 2015.
Brier, G. W.: Verification of forecasts expressed in terms ofprobability, Mon. Weather Rev., 78, 1–3, doi:10.1175/1520-0493(1950)078<0001:VOFEIT>2.0.CO;2, 1950.
Chang, H.-L., Yang, S.-C. and Yuan, H.: Analysis of the RelativeOperating Characteristic and Economic Value Using the LAPSEnsemble Prediction System in Taiwan, Mon. Weather Rev., 143,1833–1848, doi:10.1175/MWR-D-14-00189.1, 2015.
Collischonn, W., Morelli Tucci, C. E., Clarke, R. T., Chou,S. C., Guilhon, L. G., Cataldi, M., and Allasia, D.:Medium-range reservoir inflow predictions based on quan-
titative precipitation forecasts, J. Hydrol., 344, 112–122,doi:10.1016/j.jhydrol.2007.06.025, 2007.
Courdent, V., Grum, M., and Mikkelsen, P. S.: Distinguishinghigh and low flow domains in urban drainage systems 2 daysahead using numerical weather prediction ensembles, J. Hydrol.,doi:10.1016/j.jhydrol.2016.08.015, in press, 2017.
Cuo, L., Pagano, T. C., and Wang, Q. J.: A Review of Quantita-tive Precipitation Forecasts and Their Use in Short- to Medium-Range Streamflow Forecasting, J. Hydrometeorol., 12, 713–728,doi:10.1175/2011JHM1347.1, 2011.
Damrath, U., Doms, G., Frühwald, D., Heise, E., Richter, B.,and Steppeler, J.: Operational quantitative precipitation forecast-ing at the German Weather Service, J. Hydrol., 239, 260–285,doi:10.1016/S0022-1694(00)00353-X, 2000.
Du, J.: Uncertainty and Ensemble Forecast, National Weather Ser-vice, available at: http://www.nws.noaa.gov/ost/climate/STIP/STILecture1.pdf (last access: 1 April 2017), 2007.
Feddersen, H.: A Short-Range Limited Area Ensemble PredictionSystem, Danish Meteorological Institute, Copenhagen, availableat: http://www.dmi.dk/fileadmin/Rapporter/TR/tr09-14.pdf (lastaccess: 1 April 2017), 2009.
Giebel, G., Badger, J., Landberg, L., Nielsen, H. A., Nielsen, T.S., Madsen, H., Sattler, K., Feddersen, H., Vedel, H., Tøfting, J.,Kruse, L. and Voulund, L.: Wind power prediction using ensem-bles, Roskilde, available at: http://orbit.dtu.dk/files/57134275/ris_r_1527.pdf (last access: 1 April 2017), 2005.
Hadjsaïd, N. and Sabonnodiere, J.-C.: Smart Grids, First, ISTE Ltd,London UK, 2012.
Halvgaard, R., Vezzaro, L., Mikkelsen, P. S., Grum, M., Munk-Nielsen, T., Tychsen, P., and Madsen, H.: Integrated Model Pre-dictive Control of Wastewater Treatment Plants and Sewer Sys-tems in a Smart Grid, 1–16, Control Eng. Pract., submitted, 2017.
Harremoës, P., Pedersen, C. M., Laustsen, A., Sørensen, S., Laden,B., Friis, K., Andersen, H. K., Linde, J. J., Mikkelsen, P. S., andJakobsen, C.: Funktionspraksis for afløbssystemer under regn.,IDA Spildevandskomiteen, 2005.
Jørgensen, H. K., Rosenorn, S., Madsen, H., and Mikkelsen, P. S.:Quality control of rain data used for urban runoff systems, WaterSci. Technol., 37, 113–120, 1998.
Korsholm, U. S., Petersen, C., Sass, B. H., Nielsen, N. W., Jensen,D. G., Olsen, B. T., Gill, R., and Vedel, H.: A new approach forassimilation of 2D radar precipitation in a high-resolution NWPmodel, Meteorol. Appl., 22, 48–59, doi:10.1002/met.1466, 2015.
Laloy, E. and Vrugt, J. A.: High-dimensional posterior explo-ration of hydrologic models using multiple-try DREAM (ZS)and high-performance computing, Water Resour. Res., 48, 1–18,doi:10.1029/2011WR010608, 2012.
Langergraber, G., Alex, J., Weissenbacher, N., Woerner, D., Ahn-ert, M., Frehmann, T., Halft, N., Hobus, L., Plattes, M., Sper-ing, V., and Winkler, S.: Generation of diurnal variation for influ-ent data for dynamic simulation, Water Sci. Technol., 57, 1483–1486, doi:10.2166/wst.2008.228, 2008.
Leu, S.-Y., Rosso, D., Larson, L. E., and Stenstrom, M.K.: Real-time aeration efficiency monitoring in the activatedsludge process and methods to reduce energy consumptionand operating costs, Water Environ. Res., 81, 2471–2481,doi:10.2175/106143009X425906, 2009.
Mason, I.: A model for assessment of weather forecasts, Aust. Met.Mag., 30, 291–303, 1982.
www.hydrol-earth-syst-sci.net/21/2531/2017/ Hydrol. Earth Syst. Sci., 21, 2531–2544, 2017

2544 V. Courdent et al.: A gain–loss framework based on ensemble flow forecasts
Ministry of Foreign Affairs of Denmark: Independent from fossilfuels by 2050, available at: http://denmark.dk/en/green-living/strategies-and-policies/independent-from-fossil-fuels-by-2050,last access: 1 April 2017.
Mittermaier, M. P.: Improving short-range high-resolution modelprecipitation forecast skill using time-lagged ensembles, Q. J.Roy. Meteor. Soc., 133, 1487–1500, doi:10.1002/qj.135 , 2007.
Mollerup, A. L., Mikkelsen, P. S., and Sin, G.: A method-ological approach to the design of optimising control strate-gies for sewer systems, Environ. Model. Softw., 83, 103–115,doi:10.1016/j.envsoft.2016.05.004, 2016.
Nash, S. E.: The Form of the Instantaneous Unit Hydrograph, IASHPubl., 114–121, 1957.
Pappenberger, F., Scipal, K., and Buizza, R.: Hydrological as-pect of meteorological verification, Atmos. Sci. Lett., 9, 43–52,doi:10.1002/asl.171, 2008.
Richardson, D. S.: Skill and relative economic value of the ECMWFensemble prediction system, Q. J. Roy. Meteor. Soc., 126, 649–667, 2000.
Rosso, D. and Stenstrom, M. K.: Comparative economic anal-ysis of the impacts of mean cell retention time and deni-trification on aeration systems, Water Res., 39, 3773–3780,doi:10.1016/j.watres.2005.07.002, 2005.
Roulin, E.: Skill and relative economic value of medium-range hy-drological ensemble predictions, Hydrol. Earth Syst. Sci., 11,725–737, doi:10.5194/hess-11-725-2007, 2007.
Shrestha, D. L., Robertson, D. E., Wang, Q. J., Pagano, T. C., andHapuarachchi, H. A. P.: Evaluation of numerical weather pre-diction model precipitation forecasts for short-term streamflowforecasting purpose, Hydrol. Earth Syst. Sci., 17, 1913–1931,doi:10.5194/hess-17-1913-2013, 2013.
Sun, J., Xue, M., Wilson, J. W., Zawadzki, I., Ballard, S. P., Onvlee-Hooimeyer, J., Joe, P., Barker, D. M., Li, P. W., Golding, B., Xu,M. and Pinto, J.: Use of nwp for nowcasting convective precip-itation: Recent progress and challenges, B. Am. Meteorol. Soc.,95, 409–426, doi:10.1175/BAMS-D-11-00263.1, 2014.
Theis, S. E., Hense, A., and Damrath, U.: Probabilistic precipitationforecasts from a deterministic model: a pragmatic approach, Me-teorol. Appl., 12, 257, doi:10.1017/S1350482705001763, 2005.
Unden, P., Rontu, L., Jarvinen, H., Lynch, P., Calvo, J., Cats, G.,Cuxart, J., Eerola, K., Fortelius, C., Garcia-moya, J. A., Jones,C., Lenderlink, G., Mcdonald, A., Mcgrath, R., and Navascues,B.: HIRLAM-5 Scientific Documentation, Norrkoping, availableat: http://hirlam.org/index.php/component/docman/doc_view/270-hirlam-scientific-documentation-december-2002?Itemid=70 (last access: 1 April 2017), 2002.
Weron, R.: Modeling and forecasting electricity loads and prices: Astatistical approach, First Edn., John Wiley & Sons Ltd., 2006.
Wilks, D. S.: Statistical Methods in the Atmospheric Sciences, El-sevier, 2011.
WWRP/WGNE: Recommendations for the Verification and Inter-comparison of QPFs and PQPFs from Operational NWP Models,Geneva, Switzerland, available at: http://www.wmo.int/pages/prog/arep/wwrp/new/documents/WWRP2009-1_web_CD.pdf(last access: 1 April 2017), 2009.
Zhu, Y., Toth, Z., Wobus, R., Richardson, D., and Mylne, K.: Theeconomic value of ensemble–based weather forecasts, B. Am.Meteorol. Soc., 83, 73–83, 2002.
Zugno, M.: Optimization under uncertainty for management ofrenewables in electricity markets, University of Denmark,available at: http://orbit.dtu.dk/en/publications/optimization-under-uncertainty-for-management-of-renewables-in-electricity-markets(d314a0c4-185f-4983-95ff-21133defd41d).html (lastaccess: 1 April 2017), 2013.
Hydrol. Earth Syst. Sci., 21, 2531–2544, 2017 www.hydrol-earth-syst-sci.net/21/2531/2017/