Embed Size (px)
Citation preview
A fuzzy logic based approach to reliability improvement estimation
during product development
Om Prakash Yadava, Nanua Singha,*, Ratna Babu Chinnama, Parveen S. Goelb
aDepartment of Industrial and Manufacturing Engineering, Wayne State University, Detroit, MI 48202, USAbTRW Automotive, Chassis System, EAS, Sterling Heights, MI, USA
Received 17 August 2002; accepted 15 November 2002
Abstract
During early stages of product development process, a vast amount of knowledge and information is generated. However, most of it is
subjective (imprecise) in nature and remains unutilized. This paper presents a formal structure for capturing this information and knowledge
and utilizing it in reliability improvement estimation. The information is extracted as improvement indices from various design tools,
experiments, and design review records and treated as fuzzy numbers or linguistic variables. Fuzzy reasoning method is used to combine and
quantify the subjective information to map their impact on product reliability. The crisp output of the fuzzy reasoning process is treated as
new evidence and incorporated into a Bayesian framework to update the reliability estimates. A case example is presented to demonstrate the
proposed approach.
q 2003 Elsevier Science Ltd. All rights reserved.
Keywords: Reliability estimation; Reliability improvement; Product development; Fuzzy logic; Bayesian estimation
1. Introduction
Mastery of the product development (PD) process has
become an increasingly important prerequisite competency
to ensure corporate success in today’s global market
environment. Companies are under severe pressure to
deliver high quality and reliable products under shorter
development lead-times and at lower costs. Over the years,
product durability has become one of the primary
differentiators that dictate the degree of product success in
the market place. While there exists a lot of good literature
that outlines key engineering principles involved in
designing good product [1,2], there is not any literature
that addresses reliability estimation and improvement issues
during the PD process itself. To be able to build reliable
products in the current day competitive environment, it is
not only necessary that companies effectively track and
manage reliability improvement during PD, but also they
should do so beginning at the earliest stages of the PD. This
requires continuous reliability estimation and updating as
PD moves form one stage to another.
During early stages of PD, a vast amount of qualitative
information is available from different sources, such as
physics-of-failure models, results from robust design
experiments, computer aided engineering analysis, failure
modes and effect analysis, and pure expert opinions among
many others. Prior information from existing similar
products and reliability demonstration test results also
provide additional evidence about performance of a new
product under development. However, there is no well-
established methodology or systematic approach to gather
this information and use it for tracking reliability.
Furthermore, the existing reliability prediction methods
are not flexible enough to integrate all these different kinds
of the information, especially the subjective (imprecise)
information. What is really needed is a formal structure for
capturing this available information and knowledge for
timely and accurate assessment of reliability throughout the
PD process.
A lot of efforts have been made to incorporate qualitative
information in reliability estimation. Morris [3], Apostola-
kis and Mosleh [4] and Walls and Quigley [5] have
attempted to capture this information as experts’ opinion
and proposed to treat uncertainty in experts’ opinion as a
probabilistic process to be incorporated into Bayesian
0951-8320/03/$ - see front matter q 2003 Elsevier Science Ltd. All rights reserved.
doi:10 . 10 1 6 /S0 9 51 -8 32 0 (0 2) 00 2 68 -5
Reliability Engineering and System Safety 80 (2003) 63–74
www.elsevier.com/locate/ress
* Corresponding author. Tel.: þ1-313-577-7586; fax: þ1-313-577-8833.
E-mail address: [email protected] (N. Singh).
analysis. Much of the work related to uncertainty modeling,
especially in risk analysis, is based on the theory of
subjective probability developed by Savage [6], de Finetti
[7], Lindley [8] and others. However, a more prevalent
belief in the scientific community is that uncertainty in
engineering judgment represents a lack of knowledge due to
imprecise (vague) information available at early stages of
the PD process and not due to randomness [9–14]. Several
suggested the application of fuzzy logic to reliability
engineering and risk analysis to deal with subjective
judgments and vague information. Elsayed [15] has also
emphasized the need for new and efficient methods for
reliability estimation and prediction to improve effective-
ness of the design process. It is, however, not obvious how
one should proceed to capture and quantify the subjective
information generated from various sources during
implementation of design changes and/or corrective actions.
To our knowledge, there exists no integrated framework or
methodology that helps reliability engineers capture and
track the subjective information from different sources at
different stages of the PD process in the form of recursive
reliability estimates.
This paper proposes a comprehensive framework, which
provides a structured way of gathering the qualitative
information from all available sources, processing it, and
integrating it with existing statistical methods to facilitate
continuous updating of reliability estimation in a multistage
PD process. The subjective information is captured as
engineering judgment or improvement indices, which
represent improvement in a particular failure mode or
mechanism. These improvement indices are treated as fuzzy
numbers or linguistic variables, combined and processed
through a fuzzy reasoning method to map their impact on
product reliability. The crisp output of the fuzzy reasoning
method is treated as new evidence. The Bayesian frame-
work is used to integrate the new evidence with other types
of evidence such as quantitative data and qualitative
information having probabilistic uncertainty. Probabilistic
uncertainty is captured in the form of a prior distribution.
The framework allows continuous updating of system
reliability as new evidence is available at any stage of the
PD process. The Weibull distribution is considered as
failure/survival time distribution with the assumption of a
known shape factor value. It is proposed that initial
parameters of the Weibull distribution be estimated from
warranty data of similar prior designs.
The paper is organized as follows. Section 2 introduces,
in brief, the basic components of fuzzy logic system. Section
3 describes a comprehensive methodology of capturing
subjective information, building a rule base, information
processing, quantification and reliability estimation. Section
4 presents a case example to demonstrate the proposed
approach. Section 5 presents some concluding remarks.
2. Fuzzy logic system
Fuzzy logic was originally introduced by Zadeh [16] as a
mathematical way to represent vagueness in everyday life.
Fuzzy logic systems approximate functions rather than
exact reasoning. They are shown to be universal approx-
imators in that fuzzy logic systems can model any
continuous function. The importance of fuzzy logic derives
from the fact that most modes of human reasoning,
especially common sense reasoning, are approximate in
nature. It is for all these reasons that we believe that fuzzy
logic inference systems are ideal for capturing subjective
information during the earliest stages of the PD. The
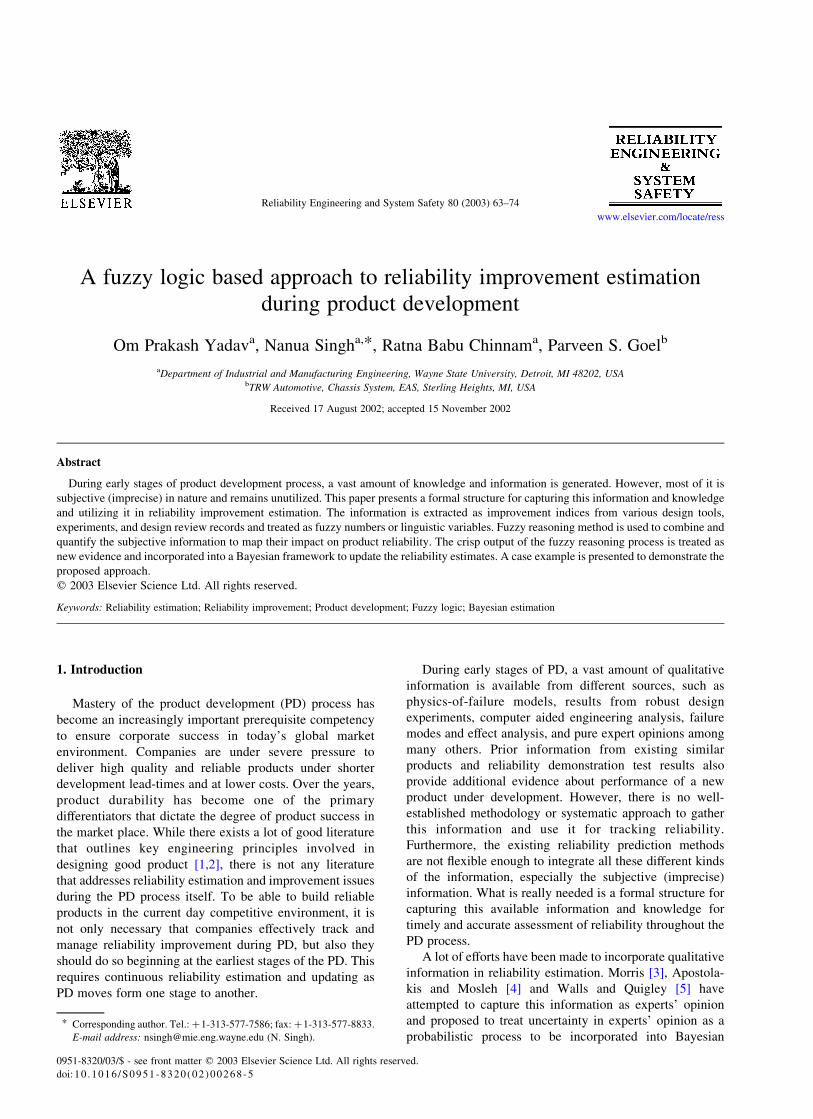
proposed overall procedure for approximating the impact of
corrective actions on product/system reliability is shown in
Fig. 1, which consists of four components, namely, fuzzy
rule base, fuzzy inference process, fuzzification process, and
defuzzification process.
The basic unit of any fuzzy system is the fuzzy rule base.
All other components of the fuzzy logic system are used to
implement these rules in a reasonable and efficient manner.
The fuzzy inference process combines the rules in the fuzzy
rule base and then carries out a mapping from fuzzy set A in
Fig. 1. An overview of fuzzy logic system for reliability modeling.
O.P. Yadav et al. / Reliability Engineering and System Safety 80 (2003) 63–7464
universe of discourse U to fuzzy set B in universe of
discourse V. Owing to the fact that in most applications the
input and output of the fuzzy system are real-valued
numbers, one must construct interfaces between the fuzzy
inference process and the environment. These interfaces are
the fuzzification and defuzzification processes shown in
Fig. 1.
The fuzzification process can be defined as a process of
mapping a real-valued point x [ U , Rn to a fuzzy set A in
U. The defuzzification process can be defined as a process of
mapping from fuzzy set B in V [ R (which is the output of
the fuzzy inference process) to a crisp value y [ V : For
further readings on fuzzy logic approach, readers are
advised to refer Refs. [17,18].
3. Methodology
The proposed reliability improvement estimation model
based on fuzzy logic includes: (1) the identification of
various input–output attributes, (2) the development of
fuzzy sets or linguistic values to model uncertainty in
improvement indices for different failure modes and
mechanisms, and (3) the development of fuzzy IF-THEN
rules to define the fuzzy relation between inputs and output
variables. The fuzzy inference model then uses these fuzzy
‘IF-THEN’ rules and linguistic input variables to generate a
crisp value representing improvement in product/system
reliability. The basic steps of the methodology can be
grouped into three phases as follows: (1) Knowledge
acquisition phase, (2) Information processing phase, and
(3) Reliability estimation phase.
3.1. Knowledge acquisition phase
In any fuzzy logic system, the quality of the fuzzy
approximation depends predominantly on the quality of
engineering judgment (subjective knowledge) and human
expertise used to build the fuzzy inference database (fuzzy
rules). It is for this reason that the knowledge acquisition
phase is often considered the most important step in
developing a fuzzy logic system. Therefore, the develop-
ment of fuzzy sets for identified input–output variables and
fuzzy IF-THEN rules are assumed as building blocks of the
fuzzy inference system. The knowledge acquisition phase
includes three steps as discussed below.
3.1.1. Identify the input and output variables
Engineering judgments are made throughout the PD
process, right from the concept selection to product launch
and even during field use, to evaluate the effect of design
changes and modifications, improvement in manufacturing
process and management, and environmental and operating
conditions. We consider these engineering judgments as
input variables in the proposed fuzzy model and derive them
by using analytical/computational models, physics-of-fail-
ure models, and/or with help from professional experts.
The output of various tools—such as design of
experiments (DOE), robust design methods, failure modes
and effect analysis (FMEA), statistical process control, and
computer aided engineering (CAE) analysis—can be used
to obtain engineering judgment representing improvements
in the system performance against different failure modes
and mechanisms. In our model, these engineering judg-
ments are defined as improvement indices ðIXXÞ :
IXX ¼ðgainÞ
ðpreviousÞ£ 100 ð1Þ
where the subscript XX represents the source of information
or particular failure mode or mechanism, (gain) represents
net improvement in failure mode or functional characteristic
and (previous) denotes the level of functional characteristic
before corrective action or design change. For example, IFF
represents improvement in fatigue failure (fatigue life)
derived from CAE analysis results and IDOE represents
improvement in a particular failure mode or functional
characteristic obtained from DOE results. These improve-
ment indices are considered as input attributes in the
proposed model. Yadav [19] gives detailed discussion on
various types of improvement indices and their equations to
derive crisp values from available experimental results and
design review records.
The change or improvement in system reliability
parameter due to corrective actions or design changes is
considered as an output variable and termed as reliability
improvement index (RII). In the present study, the RII is
defined as
RII ¼ðlb 2 laÞ
lb
£ 100 ð2Þ
where la is the system failure rate after considering the
impact of corrective actions and design changes and lb is
the system failure rate before any changes or actions were
taken.
3.1.2. Define fuzzy subsets or linguistic variables for each of
the input–output variables
To capture the uncertainty associated with both input and
output attributes and imprecise knowledge about the
relationship between input–output variables, fuzzy set
theory provides a fundamental basis to map the approximate
relationship between fuzzy variables. The input (improve-
ment indices) and output attributes are treated as fuzzy
numbers (sets) and uncertainty is characterized by member-
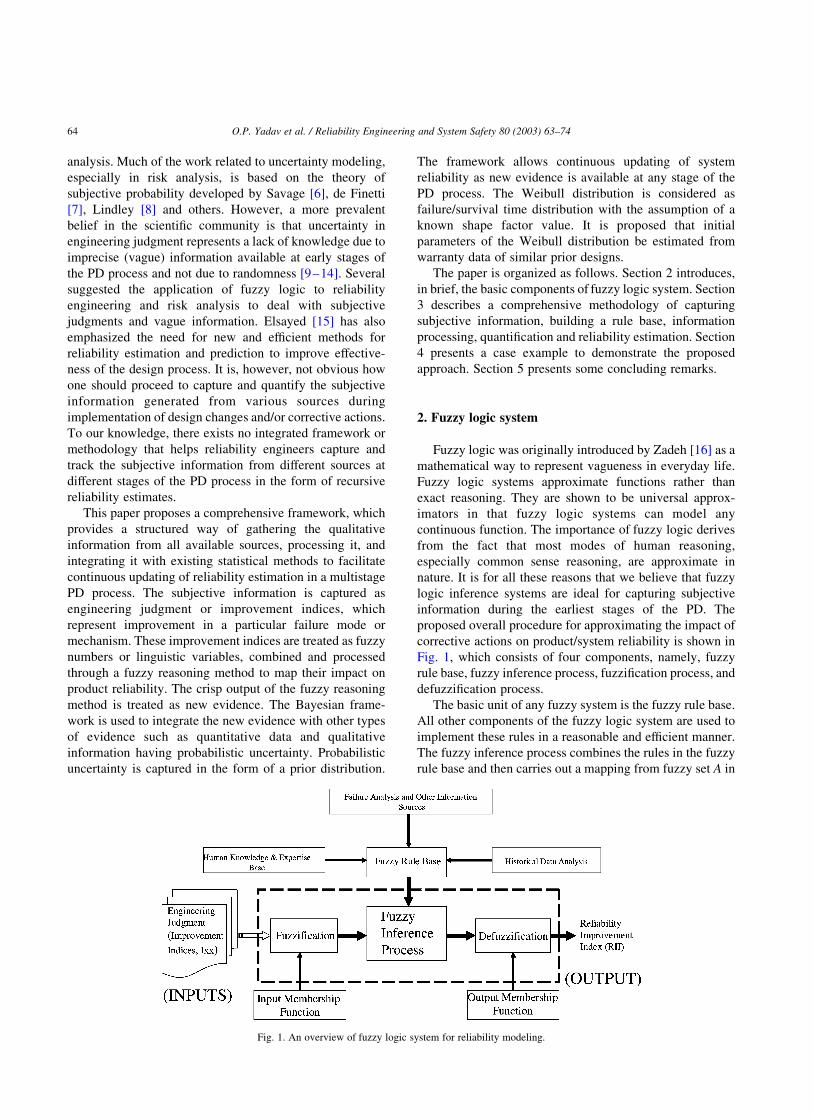
ship function. In this study, the membership function of
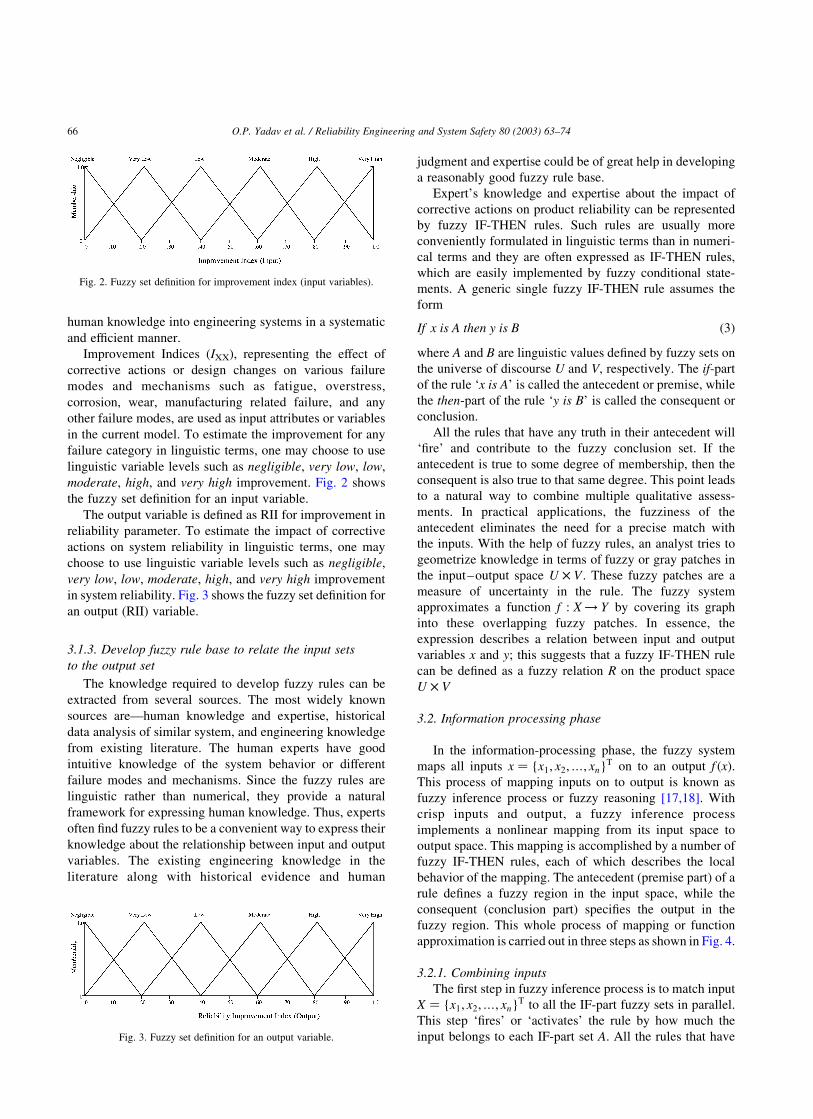
each fuzzy set is assumed to be triangular as shown in Fig. 2.
The triangular membership function has the advantage of
simplicity and is commonly used in reliability analysis [11,
20]. Fuzzy membership functions are generated utilizing the
linguistic categories identified by a human expert to express
his/her assessment. This is the first step in incorporating
O.P. Yadav et al. / Reliability Engineering and System Safety 80 (2003) 63–74 65
human knowledge into engineering systems in a systematic
and efficient manner.
Improvement Indices (IXX), representing the effect of
corrective actions or design changes on various failure
modes and mechanisms such as fatigue, overstress,
corrosion, wear, manufacturing related failure, and any
other failure modes, are used as input attributes or variables
in the current model. To estimate the improvement for any
failure category in linguistic terms, one may choose to use
linguistic variable levels such as negligible, very low, low,
moderate, high, and very high improvement. Fig. 2 shows
the fuzzy set definition for an input variable.
The output variable is defined as RII for improvement in
reliability parameter. To estimate the impact of corrective
actions on system reliability in linguistic terms, one may
choose to use linguistic variable levels such as negligible,
very low, low, moderate, high, and very high improvement
in system reliability. Fig. 3 shows the fuzzy set definition for
an output (RII) variable.
3.1.3. Develop fuzzy rule base to relate the input sets
to the output set
The knowledge required to develop fuzzy rules can be
extracted from several sources. The most widely known
sources are—human knowledge and expertise, historical
data analysis of similar system, and engineering knowledge
from existing literature. The human experts have good
intuitive knowledge of the system behavior or different
failure modes and mechanisms. Since the fuzzy rules are
linguistic rather than numerical, they provide a natural
framework for expressing human knowledge. Thus, experts
often find fuzzy rules to be a convenient way to express their
knowledge about the relationship between input and output
variables. The existing engineering knowledge in the
literature along with historical evidence and human
judgment and expertise could be of great help in developing
a reasonably good fuzzy rule base.
Expert’s knowledge and expertise about the impact of
corrective actions on product reliability can be represented
by fuzzy IF-THEN rules. Such rules are usually more
conveniently formulated in linguistic terms than in numeri-
cal terms and they are often expressed as IF-THEN rules,
which are easily implemented by fuzzy conditional state-
ments. A generic single fuzzy IF-THEN rule assumes the
form
If x is A then y is B ð3Þ
where A and B are linguistic values defined by fuzzy sets on
the universe of discourse U and V, respectively. The if-part
of the rule ‘x is A’ is called the antecedent or premise, while
the then-part of the rule ‘y is B’ is called the consequent or
conclusion.
All the rules that have any truth in their antecedent will
‘fire’ and contribute to the fuzzy conclusion set. If the
antecedent is true to some degree of membership, then the
consequent is also true to that same degree. This point leads
to a natural way to combine multiple qualitative assess-
ments. In practical applications, the fuzziness of the
antecedent eliminates the need for a precise match with
the inputs. With the help of fuzzy rules, an analyst tries to
geometrize knowledge in terms of fuzzy or gray patches in
the input–output space U £ V : These fuzzy patches are a
measure of uncertainty in the rule. The fuzzy system
approximates a function f : X ! Y by covering its graph
into these overlapping fuzzy patches. In essence, the
expression describes a relation between input and output
variables x and y; this suggests that a fuzzy IF-THEN rule
can be defined as a fuzzy relation R on the product space
U £ V
3.2. Information processing phase
In the information-processing phase, the fuzzy system
maps all inputs x ¼ {x1; x2;…; xn}T on to an output f ðxÞ:
This process of mapping inputs on to output is known as
fuzzy inference process or fuzzy reasoning [17,18]. With
crisp inputs and output, a fuzzy inference process
implements a nonlinear mapping from its input space to
output space. This mapping is accomplished by a number of
fuzzy IF-THEN rules, each of which describes the local
behavior of the mapping. The antecedent (premise part) of a
rule defines a fuzzy region in the input space, while the
consequent (conclusion part) specifies the output in the
fuzzy region. This whole process of mapping or function
approximation is carried out in three steps as shown in Fig. 4.
3.2.1. Combining inputs
The first step in fuzzy inference process is to match input
X ¼ {x1; x2;…; xn}T to all the IF-part fuzzy sets in parallel.
This step ‘fires’ or ‘activates’ the rule by how much the
input belongs to each IF-part set A. All the rules that haveFig. 3. Fuzzy set definition for an output variable.
Fig. 2. Fuzzy set definition for improvement index (input variables).
O.P. Yadav et al. / Reliability Engineering and System Safety 80 (2003) 63–7466
any truth in their antecedent will fire and contribute to the
fuzzy conclusion set. This leads to a natural way of
combining multiple qualitative inputs or engineering
assessments. The fuzzy inference system allows us to pick
arbitrary joint IF-part fuzzy sets. Suppose, if there are n
input variables, the most common way to combine IF-part of
each input variable is with a pair wise minimum or min T-
norm operator as:
mBl ¼ min{mAl1ðxÞ;mAl
2ðxÞ;…;mAl
nðxÞ}
¼ mAl1ðxÞ ^ mAl
2ðxÞ ^ · · · ^ mAl
nðxÞ ð4Þ
where n is number of inputs and l represents rule number.
The min combiner or T-norm operator is a conjunctive or
AND operator. Sometimes people prefer to use another T-
norm operator known as ‘product’ in place of min T-norm
operator to combine IF-part of fuzzy rules:
mBl ¼Yn
i¼1
mAiðxÞ ð5Þ
The only advantage of using the product T-norm operator is
that it does not ignore any information, as does the min
combiner or operator.
3.2.2. Aggregation of THEN-part fuzzy sets
The second step of the fuzzy inference process is to add
all THEN-part fuzzy sets into a final output set. The
‘extension principle’ converts or extends a fuzzy function f
(fuzzy IF-THEN rules) that maps points in X to point in Y to
a function that maps input fuzzy sets A , X to output fuzzy
set B , Y—from y ¼ f ðxÞ to B ¼ FðAÞ [18]. The extension
principle has the form of a supremum or maximum of pair
wise minima (or products). The extension principle asserts
that the fuzzy set B induced by the mapping f is defined as:
B ¼[mj¼1
Bj ð6Þ
The membership function of the output fuzzy set is given
by:
mBðyÞ ¼ max{mB1ðyÞ;mB2ðyÞ;…;mBm ðyÞ} ð7Þ
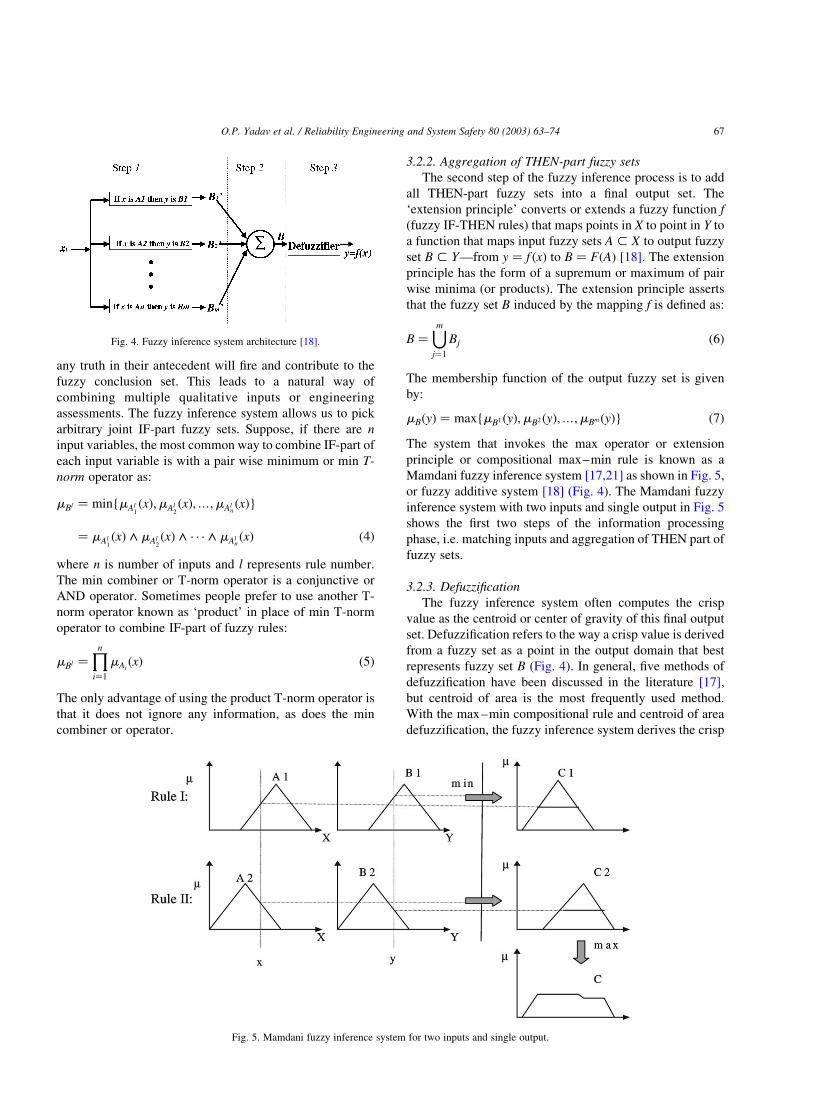
The system that invokes the max operator or extension
principle or compositional max–min rule is known as a
Mamdani fuzzy inference system [17,21] as shown in Fig. 5,
or fuzzy additive system [18] (Fig. 4). The Mamdani fuzzy
inference system with two inputs and single output in Fig. 5
shows the first two steps of the information processing
phase, i.e. matching inputs and aggregation of THEN part of
fuzzy sets.
3.2.3. Defuzzification
The fuzzy inference system often computes the crisp
value as the centroid or center of gravity of this final output
set. Defuzzification refers to the way a crisp value is derived
from a fuzzy set as a point in the output domain that best
represents fuzzy set B (Fig. 4). In general, five methods of
defuzzification have been discussed in the literature [17],
but centroid of area is the most frequently used method.
With the max–min compositional rule and centroid of area
defuzzification, the fuzzy inference system derives the crisp
Fig. 5. Mamdani fuzzy inference system for two inputs and single output.
Fig. 4. Fuzzy inference system architecture [18].
O.P. Yadav et al. / Reliability Engineering and System Safety 80 (2003) 63–74 67
value of output, (ZCOA) when subjected to crisp inputs, such
as two inputs x and y. In this study we proposed to use the
centroid of area (ZCOA) as a defuzzifier, which is given as
ZCOA ¼
ðZmBðZÞZ dZÐmBðZÞdZ
ð8Þ
where mBðZÞ is the aggregated output membership function.
The calculations needed to carry out the centroid of area
defuzzification operation are slightly time consuming unless
special hardware support is available. However, the quality
of the defuzzification process makes this computational
complexity worthwhile.
3.3. Reliability assessment phase
The output of the fuzzy inference model, i.e. crisp
value of RII, is converted into transformed failure rate
ðlpt ¼ 1=TpÞ using Eq. (2) of RII. The quantified point
estimate failure rate ðlpt Þ or mean time to failure rate
(T p) is treated as new evidence and offered to the
Bayesian framework [22] to update reliability parameters
of the design after corrective actions or design changes
as follows:
f ðlt=TpÞ ¼
LðTp=ltÞf ðltÞðl
LðTp=ltÞf ðltÞdlt
ð9Þ
where f ðlt=TpÞ is the posterior probability density
function; LðTp=ltÞ; the likelihood function; f ðltÞ; the
prior probability density function; T p, the new evidence;
lt is the transformed failure rate of the product or
system.
The Weibull distribution is used to construct the
likelihood function, as this distribution has proven to be
particularly effective in characterizing the time-to-failure
tendencies of mechanical systems. In the proposed analysis,
we assume that the shape factor b of the Weibull
distribution is known. The Weibull distribution with an
assumed value of shape factor is usually a better
representation for the life of most of products than
exponential distribution [23]. With this assumption, the
transformed time t b follows an exponential distribution [22,
24] and allows us to select the gamma distribution as the
prior distribution for Bayesian analysis. The posterior
probability density function f ðlt=t; TpÞ is the analyst’s
modified density function after incorporating new evidence,
derived from the fuzzy inference model. The prior
distribution is selected from warranty database of a similar
product. During the later stages of PD process and
production stage, the posterior distribution (the Bayesian
output) from the previous stage can be considered as prior
distribution for successive stages.
4. The case example
A case of an automotive subsystem, i.e. hydraulic
power steering system, is used to demonstrate the
proposed fuzzy logic based reliability estimation method.
Since the new design is based on the existing hydraulic
power steering system, the major decisions regarding
design changes or modifications are made based on the
analysis of failure data. Failure analysis of warranty data,
or test results during later stages of PD process, provides
valuable information about different failure modes and
mechanisms. It also helps to decide the appropriate
design changes or corrective actions to be undertaken to
eliminate any existing problems and improve upon them.
For that purpose, different failure modes and mechanisms
are classified according to their position and frequency of
occurrence. Since the new steering system is an
evolutionary design, warranty data of a similar existing
system were analyzed and following major problems
identified for further actions: (1) noise, (2) fluid leakage,
and (3) fatigue failure. The appropriate design changes/-
modifications are implemented to mitigate these pro-
blems. The example of the PD process for a steering
system represents a real life scenario, but other details
and actual numbers have been somewhat modified due to
the proprietary nature of the information and to
demonstrate the applicability of the framework.
The hydraulic rack and pinion power steering system
is a high bandwidth servo with stringent performance
requirements on accuracy, reliability, and cost. Design of
such a system can best be achieved by continuous
validation and reliability estimation throughout the
development process.
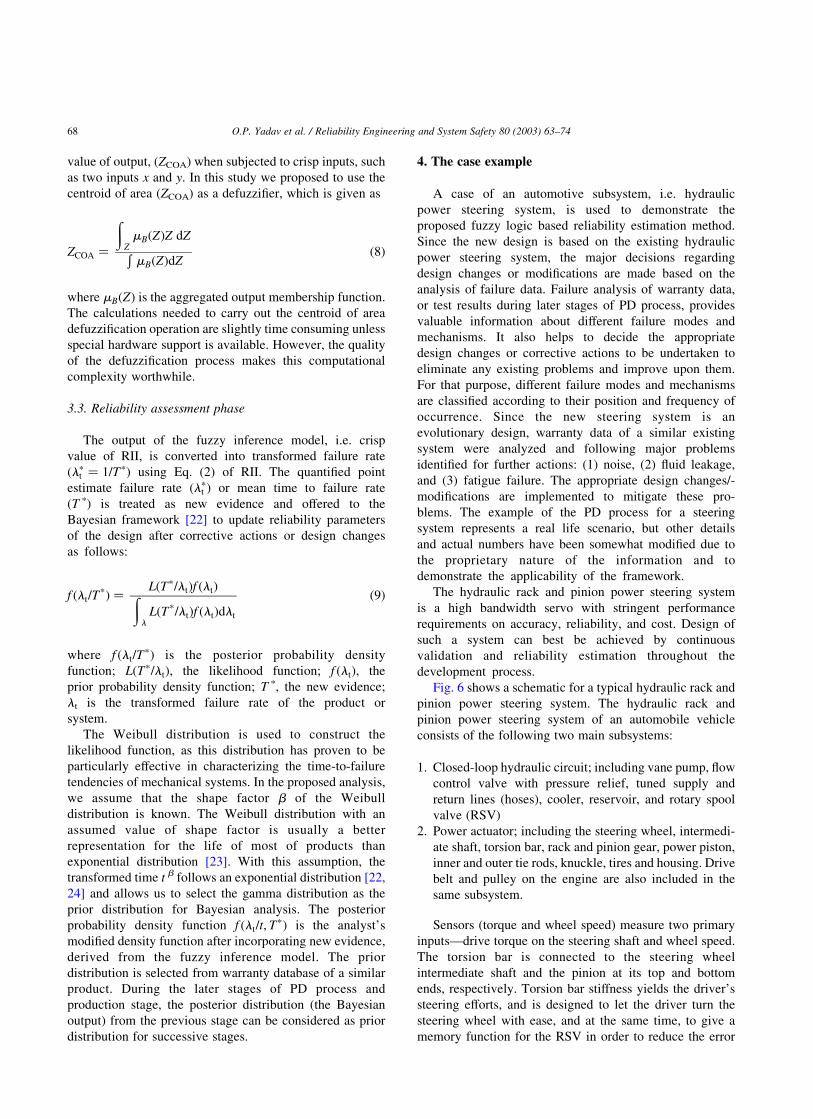
Fig. 6 shows a schematic for a typical hydraulic rack and
pinion power steering system. The hydraulic rack and
pinion power steering system of an automobile vehicle
consists of the following two main subsystems:
1. Closed-loop hydraulic circuit; including vane pump, flow
control valve with pressure relief, tuned supply and
return lines (hoses), cooler, reservoir, and rotary spool
valve (RSV)
2. Power actuator; including the steering wheel, intermedi-
ate shaft, torsion bar, rack and pinion gear, power piston,
inner and outer tie rods, knuckle, tires and housing. Drive
belt and pulley on the engine are also included in the
same subsystem.
Sensors (torque and wheel speed) measure two primary
inputs—drive torque on the steering shaft and wheel speed.
The torsion bar is connected to the steering wheel
intermediate shaft and the pinion at its top and bottom
ends, respectively. Torsion bar stiffness yields the driver’s
steering efforts, and is designed to let the driver turn the
steering wheel with ease, and at the same time, to give a
memory function for the RSV in order to reduce the error
O.P. Yadav et al. / Reliability Engineering and System Safety 80 (2003) 63–7468
angle towards zero, after the end of the driver’s steering
demand.
The steering noise and vibration related problems occur
from dynamic interaction between the steering gear and
suspension systems subjected to disturbances, such as
engine torque pulsation, tire shocks, and vibration loads.
These noise and vibration problems include; steering
shudder, steering wheel nibble, mechanical front-end
noise, and steering wheel dither.
The dynamic interaction between the rack and steering
gear housing or excitation of the fundamental frequency
(or oscillatory motion) of the rack and pinion gear
mechanism by a periodic rack force induced by tire
shocks/rough road conditions and braking disk roughness,
during braking at highway speed can induce fatigue
problem and damage the gear teeth. Inner and outer tie
rods, torsion bar, and intermediate shaft are also
subjected to vibrations and shocks and are potential
candidates for fatigue problem.
The closed loop hydraulic circuit suffers from a fluid
leakage problem mainly due to corrosion, environmental
and operational damage of parts, improper fit, etc.
The analysis that follows closely mirrors the basic steps
as described in the methodology.
4.1. Knowledge acquisition
4.1.1. Identification of input–output variables
The input variables are improvement indices represent-
ing the impact of design changes and corrective actions on
identified failure modes and mechanisms. These variables
are derived as follows:
Noise. A measure of improvement in the noise problem
(INOISE) is obtained using signal-to-noise ratios (SN) from
robust design experiments
INOISE ¼ðSNa 2 SNbÞ
SNb
� �£ 100 ð10Þ
where SNa is SN ratio after corrective action and SNb is
signal-to-noise ratio before corrective action and ðSNa 2
SNbÞ represents gain in SN ratios after taking necessary
corrective actions based on DOE output.
Leakage. There is no experimental output for the
corrective actions taken to eliminate or mitigate the leakage
problem. The only source of appropriate information is the
FMEA document which gives revised RPN based on
expert’s opinion. The appropriate corrective action reduces
the probability of failure occurrences and hence RPN in the
revised FMEA document represents reduction in the failure
Fig. 6. Hydraulic rack and pinion power steering system [25].
O.P. Yadav et al. / Reliability Engineering and System Safety 80 (2003) 63–74 69
occurrences or impact of changes. The improvement in the
oil leakage failure mode is derived from a revised system
level FMEA and is given as
ILEAK ¼ðRPNB 2 RPNAÞ
RPNB
£ 100 ð11Þ
where RPNa is re-evaluated RPN after corrective action
taken and RPNB is RPN before corrective actions are taken
and (RPNB 2 RPNA) represents impact of corrective
actions in terms of decrease in risk priority number or in
frequency of failure occurrence.
Fatigue failure. The output of finite element analysis is
used to derive an improvement index for fatigue failure
problem. The fatigue life of a product can be estimated
using a CAE analysis tool before and after corrective action.
There are various fatigue models available in the literature
for estimating the fatigue life of any product, such as, strain-
life relationship, stress-life relationship, cumulative damage
accumulation, and fracture mechanics [26]. The improve-
ment index for fatigue life can be given as
IFF ¼ðNa 2 NbÞ
Nb
£ 100 ð12Þ
where Na and Nb are mean fatigue lives after and before
corrective action, respectively.
The output variable is defined as RII, which represents
improvement in system failure rate as a result of improve-
ment in different failure modes and is expressed as
RII ¼ðlb 2 laÞ
lb
£ 100
where la is the system failure rate after considering the
impact of corrective actions and design changes and lb is
the system failure rate before any changes or actions were
taken.
4.1.2. Define fuzzy sets or linguistic variables for each
input–output variable
Only three input variables, i.e. improvement indices for
noise (INOISE), leakage (ILEAK), and fatigue failure (IFF), are
considered here. The fuzzy sets or the term sets TIXXfor each
input (improvement index IXX) is defined in Eq. (13) and is
graphically represented in Fig. 2
TIXX¼{negligible; very low; low; moderate; high; very high}
ð13Þ
The fuzzy sets or term sets TRII for output (RII) is defined in
Eq. (14) and is graphically represented in Fig. 3
TRII ¼ {negligible; very low; low; moderate; high; very high}
ð14Þ
4.1.3. Developing fuzzy rule base
The fuzzy IF-THEN rules are developed on the basis of
expert opinion and information available from failure
analysis. The warranty data analysis along with expert
opinion could be of great help in building fuzzy IF-THEN
rules because this analysis represents system behavior in
field use specifying the contribution of each failure mode or
mechanisms in system failure. This information, i.e.
proportion of each failure mode in overall system failure,
along with expert opinion is used for building fuzzy IF-
THEN rules.
For each combination of terms of linguistic variables, a
separate rule should be defined. For the present example,
216 (6 £ 6 £ 6) rules are required to consider each
combination of terms of linguistic variables. Some of the
rules are given below:
#1 IF INOISE is negligible and ILEAK is negligible and IFF
if negligible THEN RII is negligible
#10 IF INOISE is negligible and ILEAK is very low and IFF
if moderate THEN RII is low
#37 IF INOISE is very low and ILEAK is negligible and IFF
if negligible THEN RII is negligible
#80 IF INOISE is low and ILEAK is very low and IFF if very
low THEN RII is very low
#120 IF INOISE is moderate and ILEAK is very low and IFF
if very high THEN RII is moderate
#160 IF INOISE is high and ILEAK is low and IFF if
moderate THEN RII is moderate
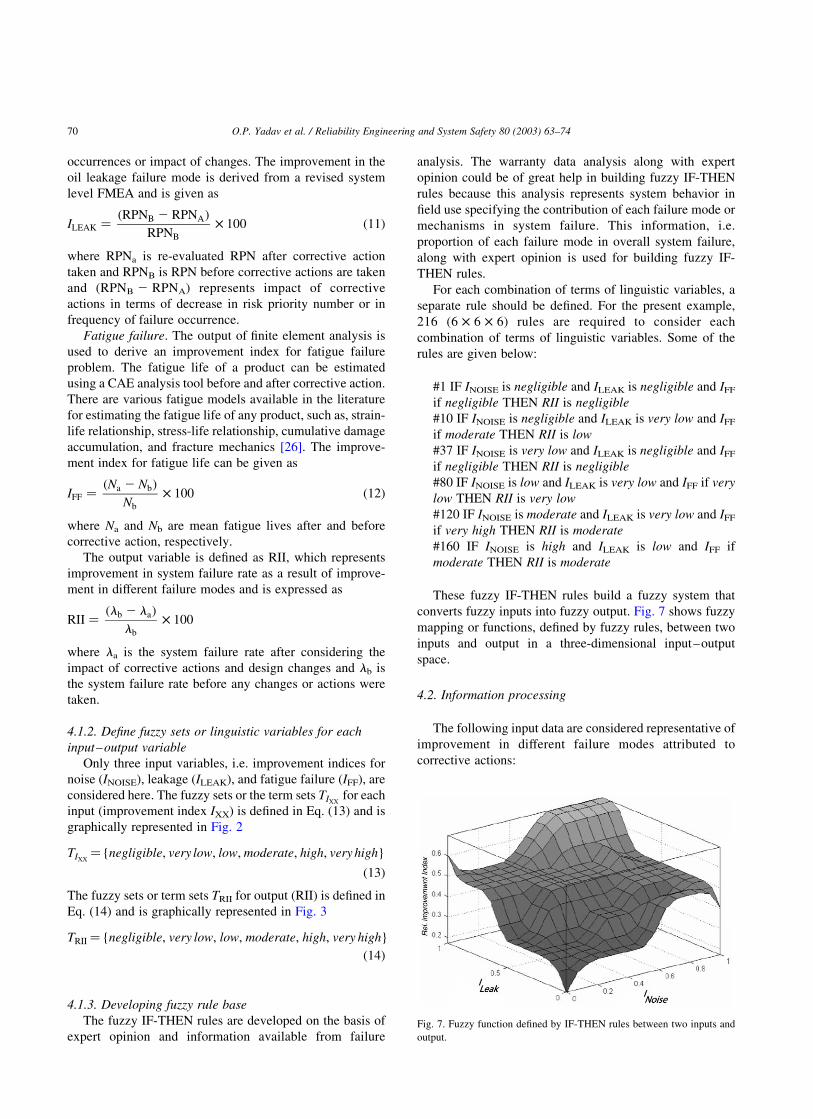
These fuzzy IF-THEN rules build a fuzzy system that
converts fuzzy inputs into fuzzy output. Fig. 7 shows fuzzy
mapping or functions, defined by fuzzy rules, between two
inputs and output in a three-dimensional input–output
space.
4.2. Information processing
The following input data are considered representative of
improvement in different failure modes attributed to
corrective actions:
Fig. 7. Fuzzy function defined by IF-THEN rules between two inputs and
output.
O.P. Yadav et al. / Reliability Engineering and System Safety 80 (2003) 63–7470
Improvement in noise failure INOISE ¼ 0:65
Improvement in leakage problem ILEAK ¼ 0:50
Improvement in fatigue failure IFF ¼ 0:35
Since the input is generally a crisp value, fuzzification of
input is the first step in the fuzzy reasoning process. Once
the inputs have been fuzzified, the degree to which each part
of the premise has been satisfied for each rule is to be
determined. If there is more than one input, matching
(combination) of different values of linguistic variables in
the premise is achieved through fuzzy IF-THEN rules using
AND or min T-norm operator as given in Eq. (4). The given
values of input fire the IF-part of all rules in parallel and to
some degree. The fuzzy reasoning was performed using
MATLAB’s fuzzy logic module for all three inputs. Among
all the rules, the following eight rules are fired contributing
to estimation of the system reliability improvement.
#122 IF INOISE is moderate and ILEAK is low and IFF if
very low THEN RII is low
#123 IF INOISE is moderate and ILEAK is low and IFF if
low THEN RII is low
#128 IF INOISE is moderate and ILEAK is moderate and IFF
if very low THEN RII is low.
#129 IF INOISE is moderate and ILEAK is moderate and IFF
if low THEN RII is moderate
#158 IF INOISE is high and ILEAK is low and IFF if very
low THEN RII is low
#159 IF INOISE is high and ILEAK is low and IFF if low
THEN RII is moderate
#164 IF INOISE is high and ILEAK is moderate and IFF if
very low THEN RII is moderate
#165 IF INOISE is high and ILEAK is moderate and IFF if
low THEN RII is moderate
The output of each fired rule is a fuzzy set representing
the RII with certain membership function given by min T-
norm operator. These fuzzy sets are then aggregated into a
single fuzzy set with the help of max S-norm operator as
given in Eq. (7). The single aggregated fuzzy output of all
eight fuzzy sets is shown in Fig. 8.
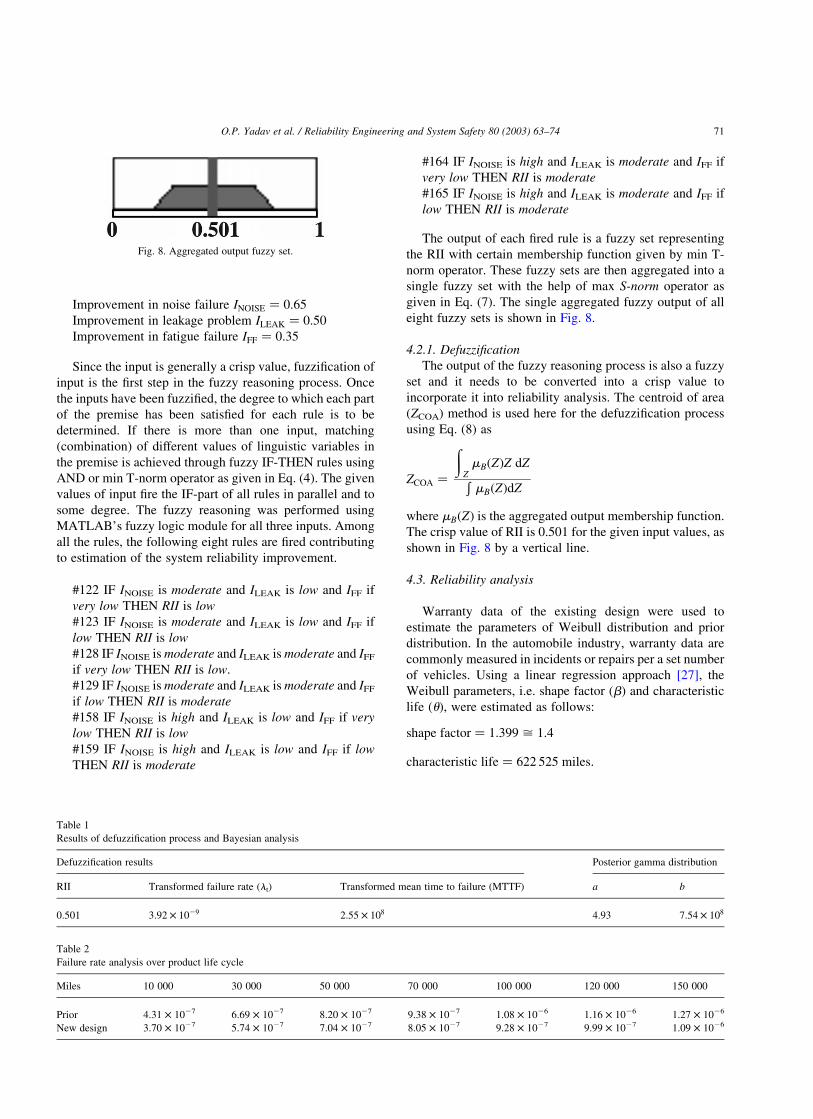
4.2.1. Defuzzification
The output of the fuzzy reasoning process is also a fuzzy
set and it needs to be converted into a crisp value to
incorporate it into reliability analysis. The centroid of area
(ZCOA) method is used here for the defuzzification process
using Eq. (8) as
ZCOA ¼
ðZmBðZÞZ dZÐmBðZÞdZ
where mBðZÞ is the aggregated output membership function.
The crisp value of RII is 0.501 for the given input values, as
shown in Fig. 8 by a vertical line.
4.3. Reliability analysis
Warranty data of the existing design were used to
estimate the parameters of Weibull distribution and prior
distribution. In the automobile industry, warranty data are
commonly measured in incidents or repairs per a set number
of vehicles. Using a linear regression approach [27], the
Weibull parameters, i.e. shape factor (b) and characteristic
life (u), were estimated as follows:
shape factor ¼ 1:399 ø 1:4
characteristic life ¼ 622 525 miles:
Table 1
Results of defuzzification process and Bayesian analysis
Defuzzification results Posterior gamma distribution
RII Transformed failure rate (lt) Transformed mean time to failure (MTTF) a b
0.501 3:92 £ 1029 2:55 £ 108 4.93 7:54 £ 108
Table 2
Failure rate analysis over product life cycle
Miles 10 000 30 000 50 000 70 000 100 000 120 000 150 000
Prior 4.31 £ 1027 6.69 £ 1027 8.20 £ 1027 9.38 £ 1027 1.08 £ 1026 1.16 £ 1026 1.27 £ 1026
New design 3.70 £ 1027 5.74 £ 1027 7.04 £ 1027 8.05 £ 1027 9.28 £ 1027 9.99 £ 1027 1.09 £ 1026
Fig. 8. Aggregated output fuzzy set.
O.P. Yadav et al. / Reliability Engineering and System Safety 80 (2003) 63–74 71
From these two parameters, we derived the transformed
failure rate lt as:
lt ¼ 1=ub ¼ ð1=622 5251:4Þ ¼ 7:86 £ 1029
Hereafter, we assume that the shape factor is known and
equal to 1.4. This transformed failure rate from warranty
data is considered as initial failure rate (lt0) and is given by
the following equation:
lt0 ¼ a0=b0
According to our assumption lt0 ¼ lt; implies:
lt0 ¼ a0=b0 ¼ 7:86 £ 1029
or
a0 ¼ b0lt ¼ b0 ð7:86 £ 1029Þ
Considering the following relation:
Pð:20lt0 # lt0 # 8lt0Þ ¼ :99
or
ð8l0
:20l0
ba0
0 la021 e2b0l dl ¼ :99
One can easily obtain a0 ¼ 3:93 ø 4 and b0 ¼ 4:99 £ 108:
The prior distribution has now been completely defined and
can be used for the Bayesian analysis.
The Weibull distribution is used to construct the
likelihood function, as this distribution has proven to be
particularly effective in characterizing the time-to-failure
tendencies of mechanical systems. The transformed failure
rate (or MTTF) was calculated from the crisp value of RII
by using Eq. (2). Posterior gamma distribution parameters
are updated by incorporating fuzzy model output, i.e.
transformed MTTF, into Bayesian analysis. The results of
the defuzzification process and updated parameters of
gamma distribution (posterior) are given in Table 1.
The characteristic life (u) for Weibull distribution is
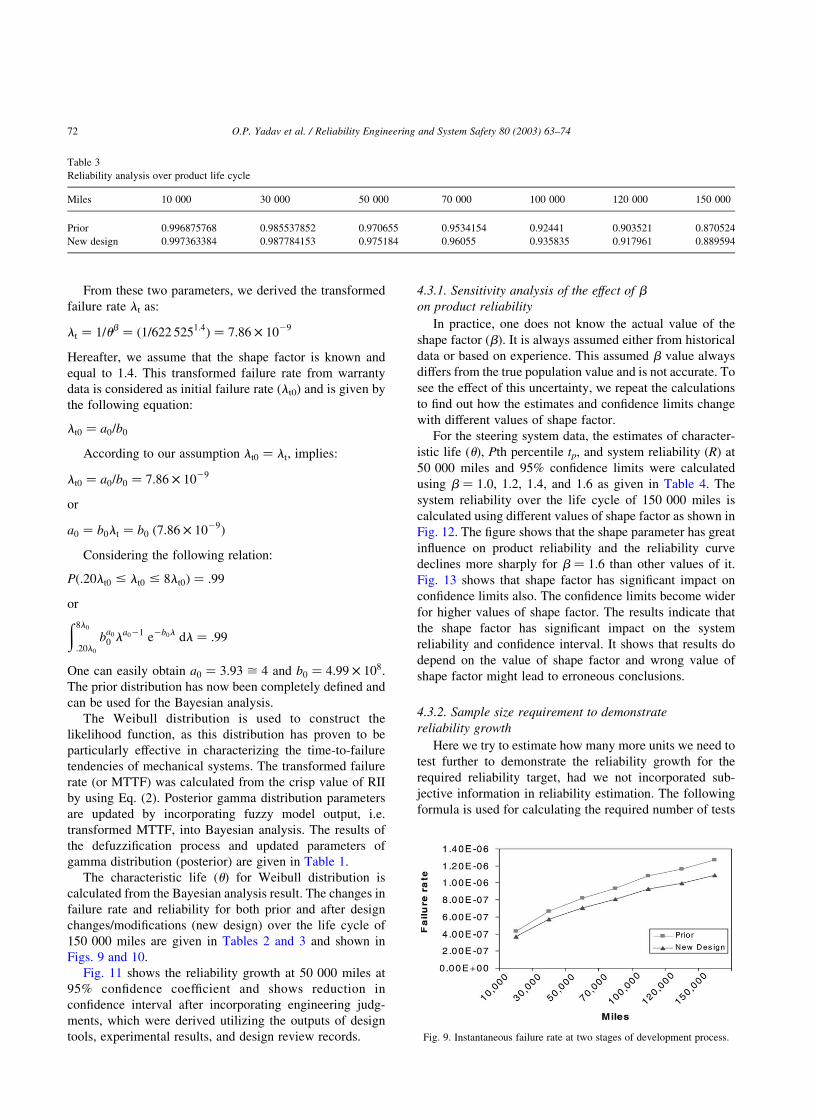
calculated from the Bayesian analysis result. The changes in
failure rate and reliability for both prior and after design
changes/modifications (new design) over the life cycle of
150 000 miles are given in Tables 2 and 3 and shown in
Figs. 9 and 10.
Fig. 11 shows the reliability growth at 50 000 miles at
95% confidence coefficient and shows reduction in
confidence interval after incorporating engineering judg-
ments, which were derived utilizing the outputs of design
tools, experimental results, and design review records.
4.3.1. Sensitivity analysis of the effect of b
on product reliability
In practice, one does not know the actual value of the
shape factor (b). It is always assumed either from historical
data or based on experience. This assumed b value always
differs from the true population value and is not accurate. To
see the effect of this uncertainty, we repeat the calculations
to find out how the estimates and confidence limits change
with different values of shape factor.
For the steering system data, the estimates of character-
istic life (u), Pth percentile tp, and system reliability (R) at
50 000 miles and 95% confidence limits were calculated
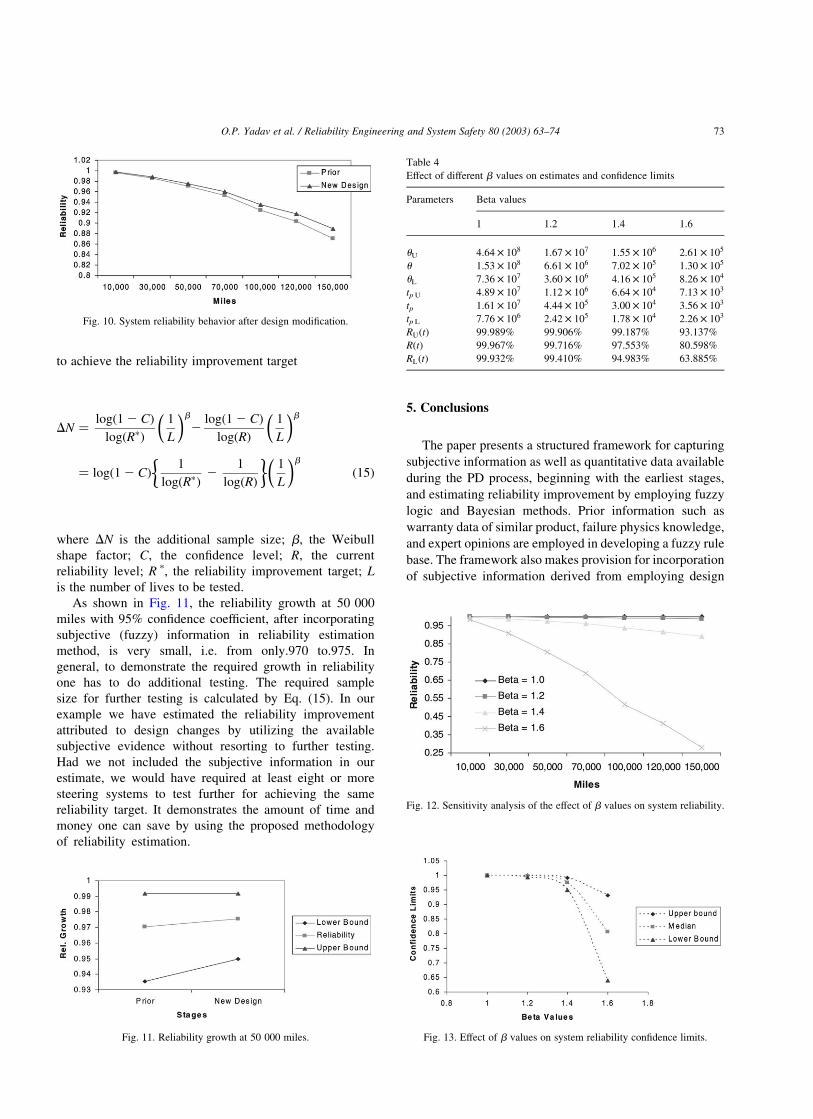
using b ¼ 1:0; 1.2, 1.4, and 1.6 as given in Table 4. The
system reliability over the life cycle of 150 000 miles is
calculated using different values of shape factor as shown in
Fig. 12. The figure shows that the shape parameter has great
influence on product reliability and the reliability curve
declines more sharply for b ¼ 1:6 than other values of it.
Fig. 13 shows that shape factor has significant impact on
confidence limits also. The confidence limits become wider
for higher values of shape factor. The results indicate that
the shape factor has significant impact on the system
reliability and confidence interval. It shows that results do
depend on the value of shape factor and wrong value of
shape factor might lead to erroneous conclusions.
4.3.2. Sample size requirement to demonstrate
reliability growth
Here we try to estimate how many more units we need to
test further to demonstrate the reliability growth for the
required reliability target, had we not incorporated sub-
jective information in reliability estimation. The following
formula is used for calculating the required number of tests
Table 3
Reliability analysis over product life cycle
Miles 10 000 30 000 50 000 70 000 100 000 120 000 150 000
Prior 0.996875768 0.985537852 0.970655 0.9534154 0.92441 0.903521 0.870524
New design 0.997363384 0.987784153 0.975184 0.96055 0.935835 0.917961 0.889594
Fig. 9. Instantaneous failure rate at two stages of development process.
O.P. Yadav et al. / Reliability Engineering and System Safety 80 (2003) 63–7472
to achieve the reliability improvement target
DN ¼logð1 2 CÞ
logðRpÞ
1
L
� �b2
logð1 2 CÞ
logðRÞ
1
L
� �b
¼ logð1 2 CÞ1
logðRpÞ2
1
logðRÞ
� �1
L
� �bð15Þ
where DN is the additional sample size; b, the Weibull
shape factor; C, the confidence level; R, the current
reliability level; R p, the reliability improvement target; L
is the number of lives to be tested.
As shown in Fig. 11, the reliability growth at 50 000
miles with 95% confidence coefficient, after incorporating
subjective (fuzzy) information in reliability estimation
method, is very small, i.e. from only.970 to.975. In
general, to demonstrate the required growth in reliability
one has to do additional testing. The required sample
size for further testing is calculated by Eq. (15). In our
example we have estimated the reliability improvement
attributed to design changes by utilizing the available
subjective evidence without resorting to further testing.
Had we not included the subjective information in our
estimate, we would have required at least eight or more
steering systems to test further for achieving the same
reliability target. It demonstrates the amount of time and
money one can save by using the proposed methodology
of reliability estimation.
5. Conclusions
The paper presents a structured framework for capturing
subjective information as well as quantitative data available
during the PD process, beginning with the earliest stages,
and estimating reliability improvement by employing fuzzy
logic and Bayesian methods. Prior information such as
warranty data of similar product, failure physics knowledge,
and expert opinions are employed in developing a fuzzy rule
base. The framework also makes provision for incorporation
of subjective information derived from employing design
Fig. 10. System reliability behavior after design modification.
Fig. 11. Reliability growth at 50 000 miles.
Table 4
Effect of different b values on estimates and confidence limits
Parameters Beta values
1 1.2 1.4 1.6
uU 4:64 £ 108 1:67 £ 107 1:55 £ 106 2:61 £ 105
u 1:53 £ 108 6:61 £ 106 7:02 £ 105 1:30 £ 105
uL 7:36 £ 107 3:60 £ 106 4:16 £ 105 8:26 £ 104
tp U 4:89 £ 107 1:12 £ 106 6:64 £ 104 7:13 £ 103
tp 1:61 £ 107 4:44 £ 105 3:00 £ 104 3:56 £ 103
tp L 7:76 £ 106 2:42 £ 105 1:78 £ 104 2:26 £ 103
RUðtÞ 99.989% 99.906% 99.187% 93.137%
RðtÞ 99.967% 99.716% 97.553% 80.598%
RLðtÞ 99.932% 99.410% 94.983% 63.885%
Fig. 12. Sensitivity analysis of the effect of b values on system reliability.
Fig. 13. Effect of b values on system reliability confidence limits.
O.P. Yadav et al. / Reliability Engineering and System Safety 80 (2003) 63–74 73
tools and experiments. The Bayesian methods facilitate
recursive estimation of reliability improvements throughout
PD process.
The proposed methodology is a step towards application
of a systems approach to reliability estimation by integrat-
ing physics-of-failure models with classical statistical
methods. The integration of imprecise subjective infor-
mation into the reliability estimation process generally
reduces the requirements of extensive testing. The results
still depend on the quality of information derived from
different sources and expert’s judgments in building the rule
base. As with any modeling framework, one has to exercise
great care to ensure that the data and inputs presented to the
method are of good quality without which the results could
be biased. The proposed method is particularly sensitive to
the fuzzy rule base that maps the impact of corrective
actions on reliability improvement.
While one could perform validation tests to confirm the
model reliability predictions, in general, experience in using
the proposed methods over time tends to address issues of
bias and variance in the model’s predictions. Our experience
has shown that the proposed methods are particularly
appropriate for tracking reliability improvements in the
design and development of electromechanical systems. This
method is most beneficial during the earliest stages of the
PD, where one is generally constrained from collecting
adequate quantitative data to accurately estimate product
reliability parameters.
Acknowledgements
The authors would like to express their sincere
appreciation for the many constructive and helpful com-
ments and suggestions offered by the reviewers.
References
[1] Ulrich KT, Eppinger SD. Product design and development. 2nd ed.
New York: McGraw-Hill; 2000.
[2] Otto K, Wood K. Product design: techniques in product development
and reverse engineering. Englewood Cliffs, NJ: Prentice Hall; 2000.
[3] Morris PA. Combining expert judgment: a Bayesian approach. Mgmt
Sci 1977;23(7):679–93.
[4] Apostolakis G, Mosleh A. Expert opinion and statistical evidence: an
application to reactor core melt frequency. Nucl Sci Engng 1979;70:
135–49.
[5] Walls L, Quigley J. Building prior distribution to support Bayesian
reliability growth modeling using expert judgment. Reliab Engng Syst
Safety 2001;74:117–28.
[6] Savage LJ. Subjective probability and statistical practice. The
foundation of statistical inference. New York: Wiley; 1962.
[7] De Finetti B. Probability, induction and statistics. New York: Wiley;
1972.
[8] Lindley DV. The philosophy of statistics. The Statisticians 2000;49:
293–337.
[9] Bowles JB, Pelaez CE. Application of fuzzy logic to reliability
engineering. Proc IEEE 1995;83(3).
[10] Bowles JB, Pelaez CE. Fuzzy logic prioritization of failures in a
system failure mode, effects and criticality analysis. Reliab Engng
Syst Safety 1995;50:203–13.
[11] Cizelj RJ, Mavko B, Kljenak I. Component reliability assessment
using quantitative and qualitative data. Reliab Engng Syst Safety
2001;71:81–95.
[12] Franceschini F, Galetto M. A new approach for evaluation of risk
priorities of failure modes in FMEA. Int J Production Res 2001;
39(13):2991–3002.
[13] Sii HS, Ruxton T, Wang J. A fuzzy-logic-based approach to
qualitative safety modeling of marine systems. Reliab Engng Syst
Safety 2001;73:19–34.
[14] Yadav OP, Singh N, Goel PS, Itabashi-Campbell R. A framework for
reliability prediction during product development process incorporat-
ing engineering judgment. Qlty Engng 2003;15(4).
[15] Elsayed EA. Perspectives and challenges for research in quality and
reliability engineering. Int J Production Res 2000;38(9):1953–76.
[16] Zadeh LA. Fuzzy sets. Inform Control 1965;8:338–52.
[17] Jang J-SR, Sun C-T, Mizutani E. Neuro-fuzzy and soft computing: a
computational approach to learning and machine intelligence. Engle-
wood Cliffs, NJ: Prentice Hall; 1997.
[18] Kosko B. Fuzzy engineering. Englewood Cliffs, NJ: Prentice Hall;
1997.
[19] Yadav OP. An integrated framework for reliability prediction during
product development process. Unpublished PhD Thesis. Industrial
and manufacturing Engineering Department, Wayne State University;
December 2002.
[20] Bazu M. A combined fuzzy logic and physics-of-failure approach to
reliability prediction. IEEE Trans Reliab 1995;44(2):237–42.
[21] Jang J-SR. ANFIS: adaptive-network-based fuzzy inference system.
IEEE Trans Syst Man Cybern 1993;23(4):665–85.
[22] Martz HF, Waller RA. Bayesian reliability analysis. New York:
Wiley; 1982.
[23] Nelson W. Weibull analysis of reliability data with few or no failures.
J Qlty Technol 1985;17(3):140–6.
[24] Soland RM. Bayesian analysis of the Weibull process with unknown
scale parameter and its application to acceptance sampling. IEEE
Trans Reliab 1968;R-17:84–90.
[25] Wong T. Hydraulic power steering system design and optimization
simulation. SAE 2001 World Congress, Detroit, MI; March 5–8, 2001.
[26] Shigley JE, Mischke CR. Mechanical engineering design. New York:
McGraw-Hill; 2001.
[27] Lu MW. Automotive reliability prediction based on early field failure
warranty data. Qlty Reliab Engng Int 1998;14:103–8.
O.P. Yadav et al. / Reliability Engineering and System Safety 80 (2003) 63–7474


![Power Network Reliability Estimation Using Fuzzy Set Theoryrcvt.tu-sofia.bg/ICEST2019_62.pdf · quantifies the grade of membership of the element in Uto the fuzzy set A[3]. If U is](https://img.pdfslide.us/doc/110x75/5f3b17142a5e7c3922354944/power-network-reliability-estimation-using-fuzzy-set-quantifies-the-grade-of-membership.jpg)


![[246]Fuzzy Model Identification Based on Cluster Estimation](https://img.pdfslide.us/doc/110x75/563dbbad550346aa9aaf4b15/246fuzzy-model-identification-based-on-cluster-estimation.jpg)