Embed Size (px)
Citation preview

www.elsevier.com/locate/dsw
Decision Support Systems 38 (2004) 383–398
A fuzzy decision support system for strategic portfolio management
Chinho Lina,b,*, Ping-Jung Hsiehc
a Department of Information Management, National Chung Cheng University, Chia-Yi, Taiwan, ROCb Department of Industrial Management Science and Institute of Information Management, National Cheng Kung University,
Tainan, Taiwan, ROCc Department of Information Management, Kung Shan University of Technology, Tainan, Taiwan, ROC
Received 1 January 2002; accepted 21 July 2003
Available online 28 September 2003
Abstract
Portfolio selection for strategic management is a crucial activity in many organizations, and it is concerned with a complex
process that involves many decision-making situations. In order to decide which of the proposed projects should be retained in
the final project portfolio, numerous conflicting criteria must be considered. They include economic, personnel development,
and corporate image. Although there are many studies available to assist decision-makers in doing the process of portfolio
selection, there are no integrated frameworks that one can use to systematically do the portfolio selection. In addition, in most
decision-making situations, decision-makers have to make decisions with incomplete information and under uncertain
circumstances. These situations have been recognized by many researchers as a suitable field to use fuzzy set theory. Therefore,
based on the concepts of decision support system (DSS), we developed an integrated framework that incorporates fuzzy theory
into strategic portfolio selection. This framework provides managers with a flexible, expandable and interactive DSS to select
projects for portfolio management. We used a real-world case to demonstrate the proposed approach.
D 2003 Elsevier B.V. All rights reserved.
Keywords: Strategic portfolio; Fuzzy weighted average; Fuzzy integer linear programming; Decision support system
1. Introduction choices must be made in creating a suitable project
The selection of a strategic portfolio, which
requires the consideration of corporation goals,
resources, and constraints, is an important and
challenging task. Usually, there are more projects
available for selection than can be undertaken within
the physical and financial constraints of a firm, so
0167-9236/$ - see front matter D 2003 Elsevier B.V. All rights reserved.
doi:10.1016/S0167-9236(03)00118-0
* Corresponding author. Department of Information Manage-
ment, National Chung Cheng University, Chia-Yi, Taiwan, ROC.
Tel.: +886-5-2720411x24000; fax: +886-5-2720979.
E-mail address: [email protected] (C. Lin).
portfolio [13]. In order to decide which of the
proposed projects should be retained in the final
project portfolio, a number of conflicting criteria
must be taken into account. They include environ-
mental advantages and disadvantages, tangible and
intangible benefits, and risk level of the project
portfolio. Several studies have been proposed to
help organizations make good project selection
decisions. Most of these studies have focused on
the fields of R&D [3,6,23,28,33,34], information
technology [21,22,24,27] and marketing [8,35]. In
these studies, the methods of Analytic Hierarchy
Procedure (AHP), scoring model, and portfolio
C. Lin, P.-J. Hsieh / Decision Support Systems 38 (2004) 383–398384
matrices used in conjunction with optimization
models are popular among decision makers to
consider a broad range of quantitative and qualita-
tive characteristics, as well as multiple objectives.
The evaluation models found in present portfolio
selection methods are mainly numerical, e.g.,
expressed with numbers between 0 to 100. The draw-
back of these studies is that decision makers generally
have vague perceptions instead of clear knowledge
about the evaluation criteria and are unable to provide
exact numbers. To overcome the problem, some prior
studies employed fuzzy theory to do the evaluation
[7,23,27,31]. Of these, Coffin and Taylor [7] and
Machacha and Bhattacharya [27] applied fuzzy logic
to software product selection and R&D project selec-
tion, respectively; Kuchta [23] used fuzzy numbers to
present the net present value and the resource utiliza-
tion of individual projects; and Rasmy [31] constructed
a fuzzy expert system to solve the multiobjective linear
programming problem. However, in order to sustain a
company’s competitive advantage in today’s increas-
ingly challenging and turbulent environment, a leader
must change his perspective from product-orientation
or market-orientation to strategy-orientation when
making project selection decisions. Existing studies
generally concentrate on evaluating projects for their
functional level, e.g., R&D or information technology,
and neglect the demands of making the evaluation at a
corporate level. Hence, a project selection method
constructed with complete strategy-oriented evaluation
and selection process will meet many firms’ practical
needs.
In diversified, multibusiness organizations, the
evaluation and selection of the appropriate strategic
plans that the firm will pursue involve the business
strength/industry attractiveness analysis of the SBUs
and the feasibility analysis of the strategic plans that
are submitted by the SBUs. The process, from
identifying the competitive position of SBUs and
the feasibility of strategic plans to determining the
suitable strategic plans, is a very complicated task
that requires a structured evaluation procedure and
experienced evaluators. However, in the evaluation
process, evaluators must confirm that all the infor-
mation available or needed is brought to bear on the
problem or issue at hand. As previous cases indicated
[1,5,21], the identification of all relevant information
for a decision does not mean that the decision-makers
have complete information; in most cases, informa-
tion is incomplete. In addition, many decisions that
have far-reaching effects on the organizational activ-
ities and personnel are made in groups. One problem
of group decision-making is that every member has
different amounts of information on the problems.
This means that the situation where different deci-
sion-maker possesses different confidence level for
the problem will occur. Therefore, the field of stra-
tegic management has been recognized as an appro-
priate field for the application of the fuzzy set theory,
because of the fuzziness of the main concepts and
terms, and the contexts of strategic management
belong to the area of uncertainty and vagueness [30].
In this study, we have developed an integrated
framework for strategic formulation to improve the
process of project portfolio selection. The proposed
approach takes advantage of the characteristics of
some existing methods, which include portfolio ma-
trix model, 3Cs model [15], fuzzy weighted average
[10,25,26] and fuzzy integer linear programming
[17,18]. These methods have sound theoretical bases
and are commonly used because of their good
decision support characteristics. In order to increase
the user acceptability, we use a computer-based
group decision support approach to project strategic
formulation. According to Turban [36], ‘‘A decision
support system is an interactive, flexible, and adapt-
able computer-based information system, specially
developed for supporting the solution of a non-
structured management problem in improving deci-
sion making. It utilizes data, provides an easy-to-use
interface, and allows for the decision-maker’s own
insights.’’ Based on Turban’s key concepts of DSS
[36], a Fuzzy Portfolio Selection System (FPSS) is
developed in this paper to help managers systemat-
ically and scientifically make decision for strategic
project portfolio.
2. The conceptual framework
Conceptually, our approach for project portfolio
selection in the group decision support system is a
three phase process: (1) pre-evaluation, (2) prefer-
ence elicitation, and (3) data analysis and reporting.
The pre-evaluation phase encompasses four basic
activities: (1) discussing and selecting the alterna-

Fig. 1. Industry attractiveness vs. business strength matrix.
C. Lin, P.-J. Hsieh / Decision Support Systems 38 (2004) 383–398 385
tives for evaluation; (2) setting strategic focus and
resource constraints; (3) deciding the portfolio ma-
trix and the corresponding evaluation criteria; and
(4) deciding the type of the fuzzy integer linear
programming model and the relative importance of
coefficients. The four activities are common to any
group decision-making process, and are well dis-
cussed in the literature [12,21,22].
The preference elicitation phase is consisted of
two activities: (1) collecting the individual confi-
dence level, and the definition of the linguistic
variables and the corresponding triangular fuzzy
numbers; and (2) deriving the scores of weighing
the criteria and rating the alternatives. The first
activity is the basic preparation step for the utiliza-
tion of the fuzzy set theory to deal with the
uncertainty problem of linguistics and the problem
of the decision-makers’ different confidence levels.
The confidence level that is provided by an indi-
vidual decision-maker implies how confident he/she
is in weighing the criteria and rating the alternatives
(see Appendix A). In practice, the confidence levels
of different managers toward one strategic plan
might vary [20]. Sometimes there are experienced
managers in a decision group, such as a project
manager who is familiar with the field of the
strategic plan, or some managers who have more
experience with evaluation than others, thus the
final evaluation result is influenced by these man-
agers with different confidence levels. The second
activity of the preference elicitation phase is com-
mon in group decision-making situations, which is
generally supported by most DSS environments.
The third phase, which is the calculation pro-
cess, includes data analysis and reporting. This
phase employs two algorithms, one is the fuzzy
weighted average for identifying the competitive
advantage of SBUs and the feasibility of strategic
plans, and the other is the fuzzy integer linear
programming for selecting the optimum strategic
plans.
2.1. The portfolio matrix model
During the 1970s and early 1980s, a number of
leading consulting firms developed the concept of
portfolio matrix to help managers better understand
the competitive position of the overall portfolio of
businesses, suggest strategic alternatives for each of
the businesses, and develop priorities for resource
allocation [16]. One of the most popular portfolio
matrices is the GE Multifactor Portfolio Matrix that
developed jointly by General Electric and McKinsey
and Company (Fig. 1). This tool helps managers
understand the competitive position of SBUs based
primarily on industry attractiveness (IA) and busi-
ness strength (BS). Industry attractiveness is a
subjective assessment based on external factors,
which is uncontrollable by the firm. Business
strength is a subjective assessment based on the
critical success factors, which is largely controllable
by the firm. Each of these two dimensions is a
composite of various factors. For example, industry
attractiveness might be determined by factors such
as the number of competitors in an industry, and the
rate of industry growth; while business strength can
be determined by factors like the solidity of a
company’s financial position, and its advantageous
bargaining position over suppliers.
2.2. The feasibility analysis of strategic plans
Besides considering the competitiveness of the
business portfolio, managers also need to consider
whether the businesses have the capabilities and
resources that are necessary for the implementation
of the strategic plan. In addition, they must be sure
that the plans will not threaten the attainment of
other organizational goals. Therefore, for the pur-
pose of selecting the strategic plans submitted by

C. Lin, P.-J. Hsieh / Decision Support Systems 38 (2004) 383–398386
the same strategic business unit, a set of criteria is
also needed to differentiate the most feasible stra-
tegic plan from the others. The 3Cs model, which
is presented by Hatten and Rosenthal [15], is
concerned with the business’ customer relations,
process capabilities, and functional competencies
that constitute the resource platform for a business’s
future strategies and determine the feasibility of its
plans. Trust, integrity and reciprocity define the
customer relations. Process capabilities are the
physical capabilities to do things and are measures
of the performance of business processes along
dimensions that are defined by customers’ needs
and expectations (time, cost, quality, functionality,
flexibility and acuity). Knowing how to do things
constitutes functional competencies, which are
measures of one organization’s potential to conduct
business that is state-of-the-art in both the firm’s
input markets (labor, capital, information and tech-
nology) and its output markets with customers.
Thus, a business strategy is based on the strengths
of a firm’s customer relationships, the depth of its
competencies, and its capabilities. Under this con-
cept, a selected strategic plan must be congruent
with the requirement for meeting customers’ needs
as well as with the competencies and capabilities of
the business.
2.3. Fuzzy weighted average
The initial publication of fuzzy set theory was by
Zadeh [37]. Fuzzy set theory provides a strict
mathematical framework in which vague conceptual
phenomena can be precisely and rigorously studied
[38]. It can also be considered as a modeling
language that is well suited for situations that
contains fuzzy relations, criteria and phenomena.
The portfolio matrix and 3Cs model have been
proved to be a useful tool to companies for ana-
lyzing strategic business units and projects, and
providing strategic directions [15,32]. However, as
indicated earlier, the fact that evaluators seldom
have the complete information to make the deci-
sions will result in evaluators’ uncertainty during
the decision-making process. Since human judg-
ments and preferences are often vague and difficult
to be estimated with an exact numerical value, the
main problem with the usage of the classical
portfolio matrix is the precise determination of the
numerical value for the criteria [3,30]. To remedy
this shortcoming, the linguistic assessments instead
of numerical indicators can be used, which means
that the ratings and weights of the criteria in the
problem are presented through the means of lin-
guistic variables [2,9,19]. A linguistic variable is a
variable whose values are not numbers but words or
phrases in a natural or synthetic language. Herein,
linguistic variables represent the relative importance
and appropriateness of each evaluation criteria per-
ceived by the decision-makers, and then are replaced
by suitable triangular fuzzy numbers used for arithme-
tic operations. The basic definitions of the fuzzy set
theory, which are necessary for this paper, are pre-
sented in Appendix A.
In order to obtain the weighted sum of those
criteria that was evaluated by fuzzy number in
terms of rating and importance, we use a fuzzy
weighted average for the calculation [10,25,26].
There have been several previous studies on the
fuzzy weighted average. Dong and Wong [10]
addressed the computational aspect of the extension
principle when the principle is applied to the
weighted average operations in risk and decision
analysis. Their computational algorithm is based on
the a-cut representation of fuzzy sets and interval
analysis. Liou and Wang [26] suggested a modifi-
cation of the fuzzy weighted average method that
was developed by Dong and Wong [10]. This
modification provided similar computational results
but required less evaluation and computations. Lee
and Park [25] proposed the efficient fuzzy weighted
average (EFWA) for the computation of a fuzzy
weighted average, which improved on the previous
works by reducing the number of comparisons and
arithmetic operations. We adopt the EFWA algo-
rithm for the calculations in the current work [25].
The definitions relating to the EFWA are mostly
from Lee and Park [25], Dong and Wong [10], and
Liou and Wang [26].
2.4. Fuzzy integer linear programming
Generally, there is a trade-off between investment
cost and financial potential in selecting a strategic
plan; the less expensive projects will have lower
returns. For a manager, finding the optimal decision
C. Lin, P.-J. Hsieh / Decision Support Systems 38 (2004) 383–398 387
is difficult and time-consuming due to the numbers
of permutations involved. Decision-making prob-
lems in areas such as research and development
project selection, resource allocation, capital budget
and scheduling are most often formulated as assign-
ment problems with objective functions in zero–one
variables. A zero–one integer linear programming
model has been proposed as a tool for selecting an
optimal project portfolio, based on the organiza-
tion’s objectives and constraints, such as resource
limitations and interdependence of projects [4,14].
In this study, we use the GE matrix to express the
competitive position of SBUs, the 3Cs model to
evaluate the feasibility of the strategic plans, and a
proper estimation of the potential profit and imple-
mentation cost for strategic plans to present the
financial potential of the strategic plans to earn
fortune. Generally, a strategic plan with a higher
score on the analysis of GE matrix, 3Cs model and
financial potential will have more competitive ad-
vantage for high return and be more likely to be
selected for implementation. Hence, by using the
evaluation results of the GE matrix, 3Cs model and
financial potential as the input data, we can con-
struct and solve a mathematical programming to
obtain an optimal project portfolio. However, the
evaluation process implemented in the proposed
approach and the way used to present the evaluation
results are based on the fuzzy theory. Therefore, we
adopt the fuzzy integer linear programming (FILP)
to do the selection of an optimal project portfolio
[18], see Appendix B. In FILP classification
[17,18], we find that there are either fuzzy numbers
as coefficients in the objective function or fuzzy
numbers defining the set of constraints. In the
current work, we use the FILP with fuzzy numbers
as coefficients in the objective function.
The decision variables of the fuzzy integer linear
programming model used in the paper are defined
by:
rij ¼1 if the jth strategic plan is implemented at the ith SBU
0 otherwise
8<:
for i= 1,. . ., N, where N is the total number of
SBUs submitting strategic plans, and j= 1,. . ., T,
where T is the total number of strategic plans
submitted by the ith SBU.
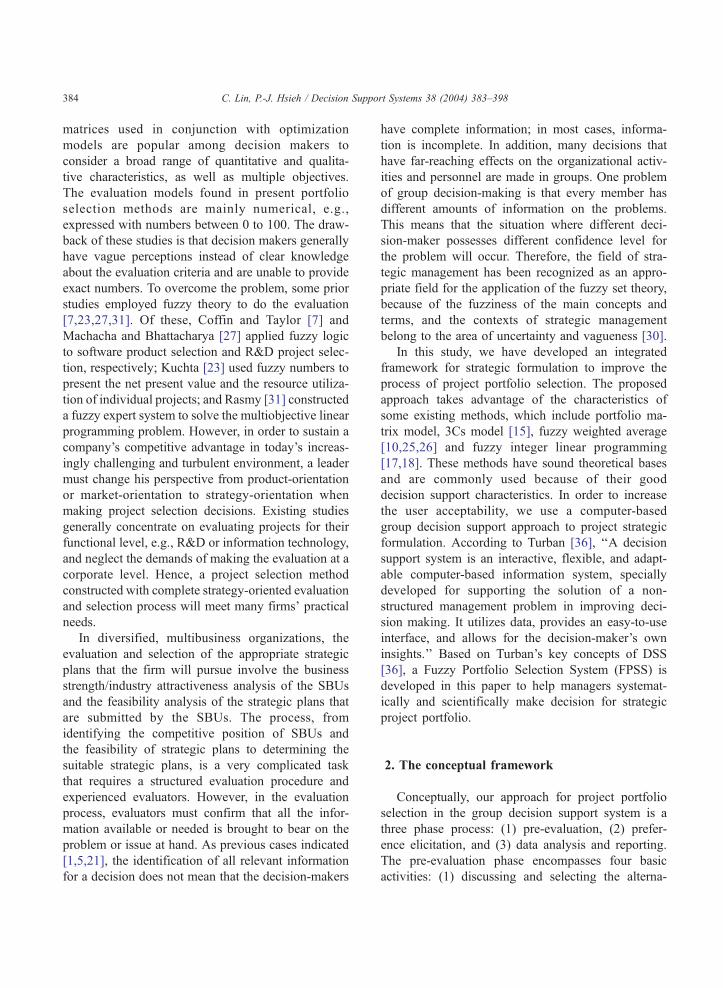
The fuzzy integer linear programming model is
given by:
Maximize z ¼XiaN
XjaN
cijrij ð1Þ
Subject toXiaN
XjaN
aijrijVb; ð2Þ
where z is the value function to be maximized; and aij,
baR are real coefficients. The cij in the objective are
fuzzy numbers, that is, cijaF(R), F(R) being the set of
real fuzzy numbers.
3. The decision support system
The portfolio selection prototype, an application
within the group work environment discussed here,
was developed using Visual Basic 6.0. The functional
architecture of the application can be divided into four
modules, as illustrated in Fig. 2: (1) process manage-
ment module, (2) preference elicitation module, (3)
optimal portfolio selection module, and (4) reporting
module.
One function of the process management module
is to collect the off-line information for the subse-
quent modules. The information includes the alter-
natives for evaluation, the required implementation
time or cost and potential returns of alternatives, the
resources a firm can provide, the portfolio matrix and
the corresponding evaluation criteria, and the fuzzy
integer linear programming model and the relative
importance of coefficient. Several researchers have
previously discussed the role of a facilitator in
computer supported group processes [12,29]. The
major functions of the facilitator include the prepa-
ration and setup of the strategic selection, the man-
agement of the group process, and promotion of
effective task behaviors. Hence, the facilitator can
assist in loading the aforementioned off-line informa-
tion into the data files of the preference elicitation
module through the interaction with the process
management module. The other function of the
process management module is to offer a facilitator
access to make orders to preference elicitation mod-

Fig. 2. System application architecture.
C. Lin, P.-J. Hsieh / Decision Support Systems 38 (2004) 383–398388
ule, optimal portfolio selection module and reporting
module.
In order to provide users with a flexible application
system, the proposed portfolio selection prototype is
designed to be expandable as users wish through the
interaction with an application interface. For example,
in the process management module, the number of
alternatives for evaluation can increase from 2 to 80,
depending on a firm’s demand. In addition, users can
decide the type of portfolio matrix, how many criteria
and the corresponding sub-criteria for evaluating the
alternatives. The next flexibility advantage of our
system is that users can choose the type of fuzzy
integer linear programming model that satisfies their
firms’ needs. The process management module pro-
vides eight types of built-in fuzzy integer linear
programming models (one of them is shown in the
proposed example).
With the information collected by the process
management module, the preference elicitation mod-
ule can offer the decision-makers a set of user-friendly
interfaces. Each decision-maker inputs data by inter-
acting with the preference elicitation module using the
decision-maker’s screens. There are two decision-
maker’s screens. The first one is for collecting the
individual confidence level, and defining the linguistic
variables and the corresponding triangular fuzzy
numbers. The other is for deriving the scores of
weighing the criteria and rating the alternatives. All
of the data are loaded into the data file of the
preference elicitation module. After every decision-
maker completes each round of preference elicitation,
the facilitator, interacting via the process management
module, runs the optimal portfolio selection module to
obtain the results of the group decision.
The optimal portfolio selection module has three
functions: (1) calculating the weighted scores of
criteria for alternatives by using fuzzy weighted aver-
ages, (2) aggregating the weighted scores assessed by
individual decision-maker to obtain an aggregate
group result, (3) deriving the optimal portfolio through
the utilization of the fuzzy integer linear program-
ming. Regarding the first of these three functions, the
results derived from the preference elicitation module,
which includes weights for the criteria and scores on
alternatives’ criteria, are presented in fuzzy numbers.
In order to obtain the weighted scores of criteria for
alternatives, we use the fuzzy weighted average to
deal with the arithmetic problem of fuzzy numbers
times fuzzy numbers [10,25,26]. Until the implemen-
tation of first function, the data files of the preference
elicitation module collect the evaluation data from
individual decision-makers separately. The third func-
tion is used to select the suitable strategic plans by
performing the fuzzy integer linear programming. The
fuzzy integer linear programming utilizes the aggre-
gate group data instead of separately individual data to
conduct the arithmetic process. Therefore, the purpose
of the second function is to apply an averaging method
to aggregate the weighted scores that are from indi-
vidual decision-makers to become an aggregate group
result.

C. Lin, P.-J. Hsieh / Decision Support Systems 38 (2004) 383–398 389
Through the process management module, the
facilitator makes orders to the reporting module for
managing the report generation and distribution pro-
cess. The reporting module provides several types of
results, which include scatter plot and table format.
Due to the difficulties of plotting fuzzy numbers on
graphs, the facilitator needs to select a method [aver-
age, optimistic, pessimistic, median] (see Appendix
A) to transfer fuzzy numbers into crisp numbers
before positioning SBUs and strategic plans on the
graphs. However, the information that decision-mak-
ers obtained from scatter plot is displayed in crisp
numbers that were transferred from fuzzy numbers.
Due to the transfer process, the crisp number may
present less information than fuzzy numbers do.
Therefore, the purpose of scatter plot is only for rapid
understanding the whole structure of the analysis
results. The arithmetic process of the fuzzy integer
linear programming uses the aggregated fuzzy weight-
ed scores as input data to do the selection of an
optimal project portfolio. With the fuzzy numbers
representing the complete information, fuzzy integer
linear programming can be used to determine precise
ranking and selects strategic plans.
4. A case illustration
In order to evaluate the applicability of the pro-
posed approach, we implemented it in a strategic
planning project for a food corporation in Taiwan.
The corporation is not only a leader in Taiwan’s food
industry, but also a global corporation with annual
revenues that is in the billions of dollars. The follow-
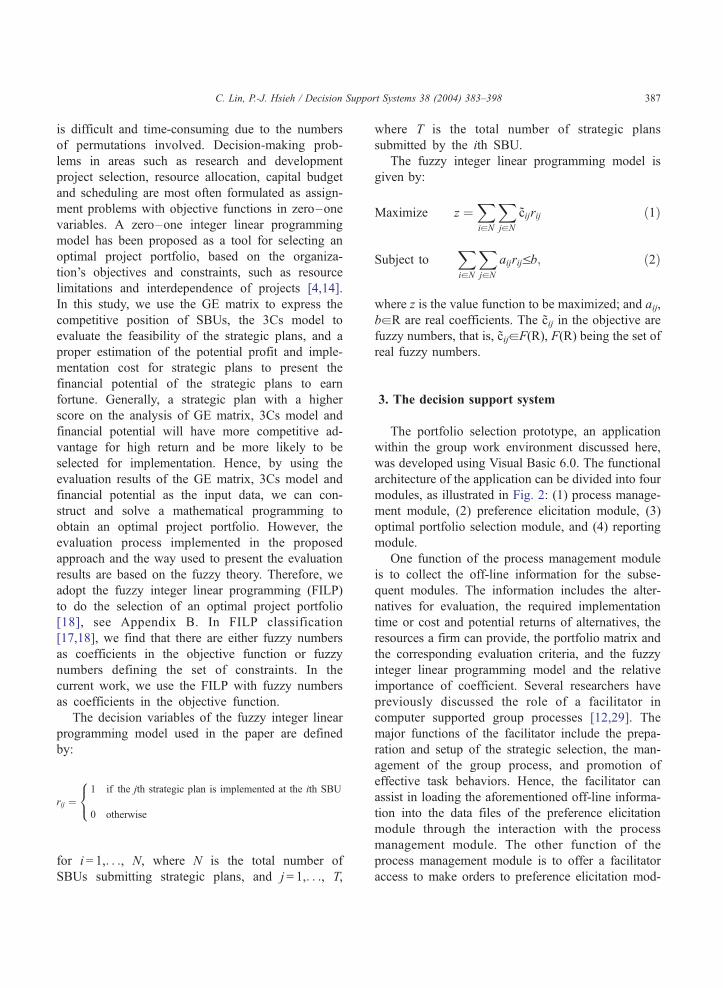
ing are the implementation tasks for each phase (see
Fig. 3).
4.1. Phase I: pre-evaluation
The firm runs four SBUs. The first (SBU 1)
identified four alternative strategic plans, the second
(SBU 2) identified two, the third (SBU 3) prepared
three, and the fourth (SBU 4) submitted two alternative
strategic plans. In order to collect the data that accu-
rately reflected the managers’ strategy evaluation pro-
cess, we had to first explain the purpose of this
research and the concepts of the portfolio matrix,
3Cs model, fuzzy weighted average and fuzzy integer
linear programming to the managers participating in
this study. Furthermore, we collected the important
factors from several strategic planning cases, and
consulted with different departmental managers for
their opinions. This step can help the managers to
identify the relevant internal and external factors of
positioning the SBUs, as well as the feasibility factors
of the strategic plans. We then conducted a focus group
that included 10 top managers and 3 experts in the field
of strategic planning to decide two major things. The
first set of actions is to select the following factors: (1)
the internal factors to assess the business strength of
the SBUs that involves a structure for evaluating the
management, manufacturing, R&D and engineering
and marketing; (2) the external factors to assess the
industry attractiveness of the SBUs, which include the
competitive, economic and government, social and
market factors; (3) the feasibility factors to assess the
feasibility of the strategic plans, which is relative to
customer relation, businesses’ capabilities and compe-
tencies. Tables 1 and 2 display the factors that evaluate
the industry attractiveness/business strength of the
SBU and the feasibility of the strategic plan, respec-
tively. The second set of actions is to choose the type
of the fuzzy integer linear programming model, and
the relative importance of coefficients in the objective
function. The fuzzy integer linear programming model
that was decided by the focus group is as follows.
Three basic assumptions are stated as follows:
1. Two parameters, investment cost and expected
profit, are used to evaluate the financial feasibility
of strategic plans.
2. All strategic plans are independent of one another.
3. Each SBU can only implement one strategic plan
per year.
The fuzzy integer linear programming model pro-
posed includes the following notations:
rij Unity if the jth strategic plan is implemented
at the ith SBU; otherwise it is 0
Pij Anticipated profit resulted from implement-
ing the jth strategic plan at the ith SBU
Cij Required cost of implementing the jth
strategic plan at the ith SBU
Ui Upper limit on the total investment amount
budgeted to the ith SBU of the firm
Fig. 3. Flow chart of the proposed procedure.
C. Lin, P.-J. Hsieh / Decision Support Systems 38 (2004) 383–398390

Table 1
Criteria structure related to GE matrix
GE matrix
Business strength Industry attractiveness
Manufacturing location and
number of
plants, sizes
of plants, ages
of plants,
automation
level
Market
factors
captive
markets,
industry
profitability
Marketing procurement,
brand loyalty,
business image
Competitive
factors
barriers to
exit, barriers
to entry,
availability
of substitutes
R&D and
engineering
human
resource,
patents
Economic and
Governmental
factors
inflation,
wage level,
legislation,
taxation
Management management
competence,
planning and
control systems,
financial strength
Social factors ecological
impacts,
consumer
protection,
degree of
unionization
Table 2
Criteria structure related to 3Cs model
3Cs model
Customer relation customer preference, reciprocity, loyalty
Capabilities time, cost, quality, functionality, flexibility
and acuity
Competencies labor, capital, information and technology
C. Lin, P.-J. Hsieh / Decision Support Systems 38 (2004) 383–398 391
B Overall investment budget of the firm for the
year
Ii Industry attractiveness of the ith SBU
Ai Business strength of the ith SBU
Fij Feasibility of jth strategic plan at the ith SBU
The fuzzy integer linear programming model can
be stated as follows:
MaximizeXi
Xj
wijrijðwAAi þ wI Ii þ wFFijÞ
ð3Þ
Subject to wij ¼PijX
i
Xj
ðPijÞð4Þ
Xj
rijCijVUi; for all i ð5Þ
Xi
Xj
rijCijVB ð6Þ
Xj
rij ¼ 1; for all i ð7Þ
Xi
Xj
wij ¼ 1; for all i; j ð8Þ
rij ¼ 0; 1 for all i; j ð9Þ
The objective function, which is Eq. (3), is used to
maximize the total return on investment. It includes
the scores of industry attractiveness, competitive ad-
vantage, feasibility and financial potential. This
implies that the higher scores the strategic plan has
on industry attractiveness, competitive advantage,
feasibility and financial potential, the greater returns
the strategic plan will yield. The weight wij is a ratio
that is equal to the potential profit of the plan divided
by total potential profit of whole proposed plans. It is
designed to present the level of financial potential of a
specific strategic plan to maximize returns, compared
to the plans proposed overall. A strategic plan with a
higher financial potential will have a higher weight,
which leads to a higher score in the objective function.
These wA, wI, wF (wA+wI+wF= 1) denote, respec-
tively, the importances of A, I, F to the objective and
are determined by the evaluators. Constraint Eqs. (5)
and (6) limit the budget for the ith SBU and the entire
firm, respectively. Meanwhile, constraint Eq. (7)
guarantees that each SBU will only be assigned one
strategic plan for implementation. Finally, constraint
Eq. (9) specifies the integrality restriction on the
values of the decision variables rij.
Then, the facilitator used the information that were
obtained from the pre-evaluation phase and the prof-
itability/implementing cost of the strategic plans that
were provided by the managers of the SBUs to create
the work files through the interaction with the process
management module.

Table 3
Membership functions for linguistic values
Linguistic Fuzzy numbers
valuesManager 1 Manager 2 Manager 3
Very low (0,0,3) (0,0,1) (0,0,2)
Low (0,3,5) (0,1,5) (0,2,5)
Medium (3,5,9) (1,5,9) (2,5,8)
High (5,9,10) (5,9,10) (5,8,10)
Very high (9,10,10) (9,10,10) (8,10,10)
C. Lin, P.-J. Hsieh / Decision Suppo392
4.2. Phase II: preference elicitation
After the information derived from the pre-evalu-
ation phase had been loaded into the data file of the
preference elicitation module, three top managers
were invited to input their preferences by interacting
with the preference elicitation module via decision-
maker’s screens. There are two main activities in this
phase. The first activity is collecting the definition of
the linguistic variables, the corresponding triangular
fuzzy numbers, and the individual confidence level.
Here, the three managers defined the linguistic vari-
ables and triangular fuzzy numbers for ‘internal fac-
tors’, ‘external factors’, ‘feasibility factors’ and
‘weights’ (shown in Table 3). Also, the three manag-
ers decided the individual confidence level for calcu-
lating the weighted scores of those criteria by using
the EFWA (shown in Table 4). The second activity is
to weigh the criteria and rate the alternatives. In this
activity, the three managers evaluated the importance
of each criterion, the internal and external factors of
the SBUs, and the feasibility of the strategic plans in
linguistic term.
Table 4
Individual confidence levels of three managers
SBU1 SBU2 SBU3 SBU4
M1 M2 M3 M1 M2 M3 M1 M2 M3 M1 M2 M3
Strategic
plan 1
0.5 0.8 0.5 0.8 0.6 0.8 0.9 0.8 0.6 0.8 0.8 0.6
Strategic
plan 2
0.8 0.5 0.8 0.8 0.5 0.6 0.5 0.6 0.8 0.6 0.9 0.5
Strategic
plan 3
0.8 0.8 0.6 0.6 0.6 0.6
Strategic
plan 4
0.5 0.6 0.6
M1: Manager 1; M2: Manager 2; M3: Manager 3.
4.3. Phase III: data analysis and reporting
In this phase, the facilitator performed three
actions: (1) checking to make sure that all participat-
ing decision-makers had finished Phase II; (2) run-
ning the optimal portfolio selection module that
encompasses two major algorithm-fuzzy weighted
average and fuzzy integer linear programming; (3)
defining the format of report (graph or table), which
was generated at the end of Phase III. In Figs. 4 and
5, we display the results of fuzzy weighted average in
scatter plot format. Fig. 4 reveals the two-dimension-
al analysis result for business strength/industry at-
tractiveness of the SBUs. Adding the feasibility
analysis, a three-dimensional result for strategic plans
can be depicted in Fig. 5. In Table 5, we take
manager 1 as an example to show the detailed table
results for business strength/industry attractiveness of
the SBUs and feasibility of the strategic plans in
fuzzy numbers.
Table 6 displays the results of the fuzzy integer
linear programming. In the proposed approach, user
can determine the value of the weight vector b. Theweight vector b is utilized in the last calculation
step of fuzzy integer linear programming to transfer
fuzzy integer linear programming into conventional
parametric linear programming (see Appendix B).
The weight vector b is determined by decision-
makers to present their optimism level toward the
internal and external environmental factors that
affect the implementation of the project portfolio.
rt Systems 38 (2004) 383–398
Fig. 4. Scatter plot of business strength/industry attractiveness for
SBUs.

Fig. 5. Scatter plot of business strength/industry attractiveness of the SBUs and feasibility of the strategic plans (r11, r12, r13, r14 represent the
strategic plans that are submitted by SBU1).
C. Lin, P.-J. Hsieh / Decision Support Systems 38 (2004) 383–398 393
According to the values of the weight vector b, weshow two kinds of results in Table 6. For example,
if decision-makers feel pessimistic to the environ-
mental factors, they will decide the optimism level
b=(1,0). Given the value of the weight vector b,the fuzzy integer linear programming will provide
user with different values of the confidence level a.The confidence level a is used to present how
decision-makers think of the possibility that the
optimism level b will happen. For example, in the
result of Table 6, if decision-makers have pessimis-
tic attitude, they will choose the optimism level
Table 5
Calculation results for manager 1
SBU1 SBU2
a i f a i f
Strategic plan 1 (2.9,4.7) (4.1,5.8) (3.7,4.1) (2.7,5.1) (6.7,7.8) (5.6
Strategic plan 2 (2.9,4.7) (4.1,5.8) (3.9,5.2) (2.7,5.1) (6.7,7.8) (3.2
Strategic plan 3 (2.9,4.7) (4.1,5.8) (4.8,6.3)
Strategic plan 4 (2.9,4.7) (4.1,5.8) (5.3,6.9)
a: Business Strength, i: Industry Attractiveness, f: Feasibility.
b=(1,0). Then if they think that there will be a high
possibility that the optimism level b=(1,0) will
happen, they will choose the confidence level
a= 1, then we obtain the optimal solution: r11 =
r21 = r31 = r41 = 1, and all other rij’s = 0. The result
implies that the combination of all SBUs adopting
their first strategic plans, the company can maxi-
mize its returns by spending an acceptable cost
resulting from implementing these strategic plans.
Thus the maximum profit that the company can
earn is $23 million. On the contrary, if the decision-
makers have the optimism level b=(0,1) and think
SBU3 SBU4
a i f a i f
,7.9) (4.3,6.2) (5.3,6.9) (2.5,6.4) (8.7,9.1) (3.5,7.1) (3.5,7.1)
,5.6) (4.3,6.2) (5.3,6.9) (3.8,9.5) (8.7,9.1) (3.5,7.1) (3.7,7.1)
(4.3,6.2) (5.3,6.9) (3.8,8.1)

Table 6
Result of fuzzy integer linear programming model
r(a) = (r11, r12, r13, r14, r21, r22, r31, r32, r33, r41, r42)
b= (1,0)
r(a) = (0,0,0,1,1,0,0,0,1,0,1) r(a) = 31�10a baa[0,0.375] r(0) = 31
r(0.375) = 27.25
r(a) = (0,0,1,0,1,0,1,0,0,0,1) r(a) = 30.25� 8a baa[0.375,0.75] r(0.375) = 27.25
r(0.75) = 24.25
r(a) = (1,0,0,0,1,0,1,0,0,1,0) r(a) = 28� 5a baa[0.75,1] r(0.75) = 24.25
r(1) = 23
b= (0,1)
r(a) = (0,1,0,1,0,1,0,0,0,1,0) r(a) = 31 + 5a baa[0,0.5] r(0) = 31
r(0.5) = 33.5
r(a) = (0,1,0,0,1,0,1,0,0,1,0) r(a) = 32 + 3a baa[0.5,1] r(0.5) = 33.5
r(1) = 35
(b: optimism level; a: confidence level; rij: decision variable.)
C. Lin, P.-J. Hsieh / Decision Support Systems 38 (2004) 383–398394
of medium possibility that the optimism level
b=(0,1) will happen, they will choose the confi-
dence level a = 0.5. Then the maximum profit that
the company can earn is $33.5 million. Therefore,
we can see that different values in terms of the
optimism level b and the confidence level a will
lead to different optimal portfolio results.
5. Discussion
The firm that we cooperated with to demonstrate
the proposed approach is a corporation with four
strategic business units. The process that the firm
previously used for strategic plan selection consists
of the following five steps. (1) CEO conducts a
strategic plan selection committee that includes five
to six top managers. (2) The committeemen spend
2–3 weeks to review the detailed reports of all
proposed strategic plans. The reports include the
content and the expected profit for each of the
proposed strategic plans, and the past performance
of the SBU. The evaluation factors used to evaluate
the strategic plan vary with committeemen. (3) The
committeemen meet for a first vote to screen out
half of the proposed strategic plans. (4) The com-
mitteemen meet two or three times to discuss the
remaining half of the proposed strategic plans. (5)
After two to three meetings, the committeemen
vote again to determine the final list of the strate-
gic plans. This process usually lasts one and half to
two months. The CEO and top managers all
complained that the process is not efficient and
wished to have a useful approach to facilitate the
process.
From interviews with the CEO and top managers,
we found that there are three concepts that they
expected the new strategic plan selection approach
to be able to achieve. The three concepts are accu-
racy, objectivity and justice, and efficiency, which
are consistent with prior research [6,13,22]. The
CEO and top managers thought that the new ap-
proach should be accurate to evaluate the potential of
the strategic plans; and that it should be an objective
and fair decision-making method; and that it should
be efficient in doing the evaluation. The proposed
approach has the following advantages: (1) The
evaluation factors used to evaluate the strategic plan,
including portfolio matrix model and financial data
are determined by the focus group. Through inter-
acting with the system, each evaluator is able to
evaluate the strategic plans using the same evaluation
factors. Therefore, the system provides a complete
and accurate evaluation structure to evaluate the
potential of the strategic plans. (2) The system
employs a fuzzy approach to consider the fuzziness
problem resulted form the uncertainty of linguistic
terms, as well as the diversity of confidence level
C. Lin, P.-J. Hsieh / Decision Support Systems 38 (2004) 383–398 395
and optimism level. Furthermore, a fuzzy integer
linear programming is incorporated to help managers
select the strategic plans. Hence, the proposed ap-
proach, which is based on a mathematical method
with sound theoretical basis, provides an objective
and just decision-making method. (3) The approach
is designed according to the concept of group
decision support system as an expandable and
easy-to-use strategic portfolio selection tool. It pro-
vides a computer-aided evaluation environment to
reduce meeting time and offer the evaluators the
freedom of doing the evaluations in their own offices
at any time.
Through using the proposed approach, the CEO
and the top managers had three meetings, one for the
training program of using the proposed approach,
and another for the focus group. Then, they had two
weeks to do the evaluation. After they had complet-
ed the evaluation, they met again for knowing the
final evaluation result and shared the experience of
using the proposed approach. Hence, the total project
portfolio selection process lasted 2–3 weeks, which
is one month less than the original process. In
addition, the CEO and top managers stated that they
were comfortable with the design and using the
proposed approach, and that felt confident with the
evaluation results. Hence, the CEO and top manag-
ers were pleased and thought that the proposed
approach is able to satisfy, or even exceed their
expectation.
6. Conclusion
In this study, the proposed DSS of FPSS is a
flexible and expandable system that: (a) simultaneous-
ly considers all the different criteria in determining the
most suitable project portfolio, (b) takes advantage of
the best characteristics of the existing methods by
decomposing the process into a flexible and logical
series of activities and applying the most appropriate
technique(s) at each stage, (c) involves the full par-
ticipation of the decision-makers in deciding the
number of decision-makers, alternative projects, eval-
uation criteria and sub-criteria, the type of fuzzy
integer linear programming model, the confidence
level, and the optimism level, and (d) provides that
users can investigate the impact of changes in certain
parameters on the solution and quickly receive feed-
back on the consequences of such changes. In addition
to its flexibility and expandability, the other character-
istics of a sound DSS are its user-friendliness. The
implementation of the proposed DSS of FPSS for a
strategic planning project undertaken by a major food
company in Taiwan confirmed the above considera-
tions. The top managers of the company were pleased
and agreed with our recommendations since the DSS
of FPSS can reduce the decision-making time, and is a
practical tool for dealing with the uncertainty problem
of linguistic terms, the diversity of decision-makers’
confidence levels, and the effect of the optimism level.
Although we adopted the GE matrix as the portfolio
model in evaluating the strategic positions of the
SBUs, and the 3Cs model in assessing the feasibility
of the strategic plans, the approach can also work with
other evaluation measures.
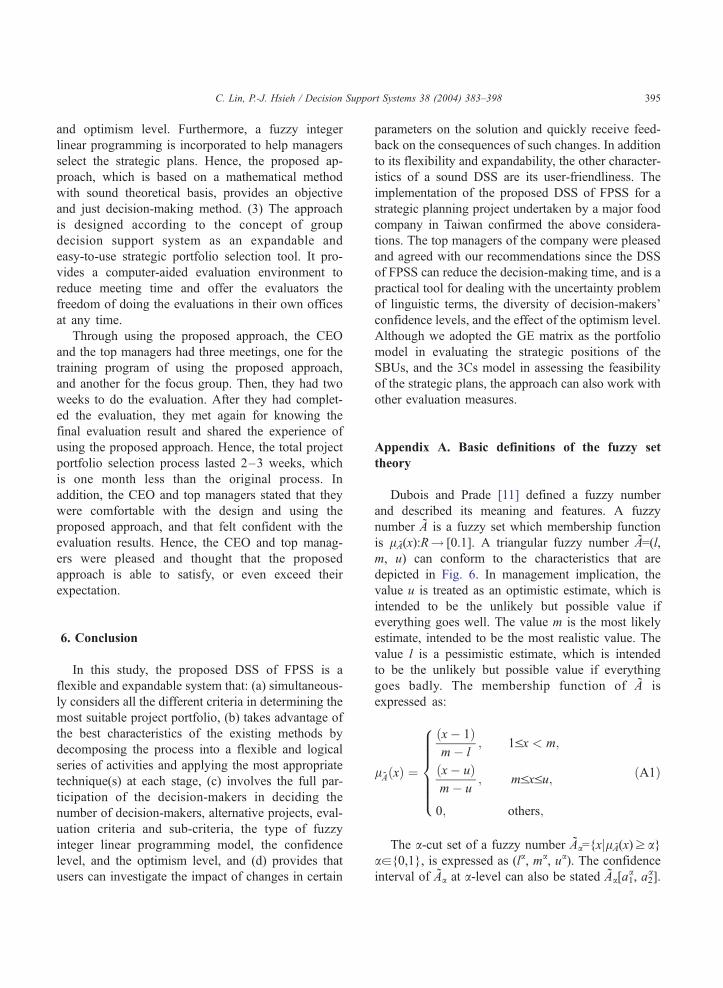
Appendix A. Basic definitions of the fuzzy set
theory
Dubois and Prade [11] defined a fuzzy number
and described its meaning and features. A fuzzy
number A is a fuzzy set which membership function
is lA(x):R! [0.1]. A triangular fuzzy number A=(l,
m, u) can conform to the characteristics that are
depicted in Fig. 6. In management implication, the
value u is treated as an optimistic estimate, which is
intended to be the unlikely but possible value if
everything goes well. The value m is the most likely
estimate, intended to be the most realistic value. The
value l is a pessimistic estimate, which is intended
to be the unlikely but possible value if everything
goes badly. The membership function of A is
expressed as:
lAðxÞ ¼
ðx� 1Þm� l
; 1Vx < m;
ðx� uÞm� u
; mVxVu;
0; others;
8>>>>><>>>>>:
ðA1Þ
The a-cut set of a fuzzy number Aa={xjlA(x)z a}aa{0,1}, is expressed as (la, ma, ua). The confidence
interval of Aa at a-level can also be stated Aa[a1a, a2
a].

Fig. 6. Triangular fuzzy number.
C. Lin, P.-J. Hsieh / Decision Support Systems 38 (2004) 383–398396
a1a and a2
a mean the upper and lower boundaries of
confidence interval.
Appendix B. Fuzzy integer linear programming
problems with imprecise coefficients
Here we study FILP problems with imprecise
coefficients in the objective function, that is, with
coefficients defined by fuzzy numbers [17,18]. The
problem can be written as
max z ¼XjaN
cjxj
s:t:XjaN
aijxjVbi; iaM ;
xjz0; jaN ;
xjaN ; jaN ;
ðA2Þ
where aij, biaR are real coefficients, and the costs in
the objective are fuzzy numbers, that is, cjaF(R),
F(R) being the set of real fuzzy numbers, iaM,
jaN.
First, the fuzzy solution for Eq. (A2) can be
obtained from the solution of the following Multi-
objective Integer Programming problem:
max ðc1x; c2x; . . . ; cnxÞ
s:t: AxVb;
xz0; ckaEð1� aÞ;
aa½0;1; k ¼ 1; 2; . . . ; n
ðA3Þ
where E(1� a)oC(1� a) is the subset constituted by
vectors whose jth component is equal to either the
upper or the lower bound of cj, /j(1� a) or uj(1� a),jaN.
On the other hand, according to some results by
Lee and Park [25], on the use of interval arithmetic for
solving LP problems with interval objective functions,
the fuzzy solution for Eq. (A2) can be found from the
parametric solution of the following biobjective para-
metric problem, P(a):
max zVðaÞ ¼ ðz1ðx; aÞ; zcðx; aÞÞ
s:t: AxVb;
xjaN ; jaN ;
aa½0;1;
ðA4Þ
where z1(x, a) and zc(x, a) in the case of triangular
fuzzy numbers are defined by
z1ðx; aÞ ¼Xnj¼1
½cj � aðcj � rjÞxj;
and zcðx; aÞ ¼ 1
2
Xnj¼1
½2cj þ aðRj þ rj � 2cjÞxj:
which is a fuzzy set giving the fuzzy solution to the
former problem, in which S(1� a) is defined as the setof solutions of the auxiliary problem considered
according to the two approaches Eq. (A3) or Eq.
(A4), for every aa[0,1].
Concretely, a decision-maker may be able to
assign weights bka[0,1] to each of the objectives
taking part in Eq. (A3) or Eq. (A4), such that

C. Lin, P.-J. Hsieh / Decision Support Systems 38 (2004) 383–398 397
Skbk= 1. Then conventional parametric LP problems
are obtained.
References
[1] H.I. Ansoff, E.J. McDonnell, Implanting Strategic Manage-
ment, Prentice-Hall, Englewood Cliffs, NJ 07632, 1990.
[2] R.E. Bellman, L.A. Zadeh, Decision-making in a fuzzy en-
vironment, Management Science 17 (4) (1970) 141–164.
[3] M. Bohanec, et al., Knowledge-based portfolio analysis for
project evaluation, Information and Management 28 (1995)
293–302.
[4] S.A. Burn, L. Liu, C.W. Feng, The LP/IP hybrid method for
construction time–cost trade-off analysis, Construction Man-
agement and Economics; London (1996 May) 14265–14277.
[5] T.W. Chien, C. Lin, B. Tan, W.C. Lee, A neural networks-
based approach for strategic planning, Information and Man-
agement 35 (1999) 357–364.
[6] P.Y.V. Chu, Y.L. Hsu, M. Fehling, A decision support system
for project portfolio selection, Computers in Industry 32
(1996) 141–149.
[7] M.A. Coffin, B.W. Taylor, Multiple criteria R&D project se-
lection and scheduling using fuzzy logic, Computers Opera-
tion Research 23 (3) (1996) 207–220.
[8] E. Danneels, E.J. kleinschmidt, Product innovativeness from
the firm’s perspective: its dimensions and their relation with
project selection and performance, The Journal of Product
Innovation Management 18 (6) (2001) 357–373.
[9] M. Delgado, J.L. Verdegay, M.A. Vila, Linguistic decision
making models, International Journal of Intelligent Systems
(1993) 7479–7492.
[10] W.M. Dong, F.S. Wong, Fuzzy weighted average and imple-
mentation of the extension principle, Fuzzy Sets and System
21 (1987) 183–199.
[11] D. Dubois, H. Prade, Operation on fuzzy numbers, Interna-
tional Journal of Systems Service 9 (1978) 613–626.
[12] S.B. EOM, S.M. Lee, E.B. Kim, C. Somarajan, A survey of
decision support system applications, Journal of the Opera-
tional Research Society 49 (1998) 109–120.
[13] F. Ghasemzadeh, N.P. Archer, Project portfolio selection
through decision support, Decision Support Systems 29
(2000) 73–88.
[14] F. Ghasemzadeh, N. Archer, P. Iyogun, A zero–one model
for project portfolio selection and scheduling, The Journal of
the Operational Research Society; Oxford 50 (1999 July)
745–755.
[15] K.J. Hatten, S.R. Rosenthal, Managing the process-centered
enterprise, Long Range Planning 32 (3) (1999), 293–310.
[16] A.C. Hax, N.S. Majluf, The use of the industry attractive-
ness—business strength matrix in strategic planning, Interfa-
ces 13 (2) (1983) 54–71.
[17] F. Herrera, J.L. Verdegay, Approaching fuzzy integer linear
programming problems, Interactive Fuzzy Optimization,
Springer-Verlag, Berlin, 1991.
[18] F. Herrera, J.L. Verdegay, Three models of fuzzy integer lin-
ear programming, European Journal of Operational Research
(1995) 581–593.
[19] F. Herrera, E. Herrera-Viedma, J.L. Verdegay, A model of
consensus in group decision making under linguistic assess-
ments, Fuzzy Sets and Systems 78 (1996) 73–87.
[20] H.M. Hsu, C.T. Chen, Aggregation of fuzzy opinions under
group decision making, Fuzzy Sets and Systems 79 (1996)
279–285.
[21] J.J. Jiang, G. Klein, Project selection criteria by strategic
orientation, Information and Management 36 (1999) 63–75.
[22] J. Klapka, P. Pinos, Decision support system for multicriterial
R&D and information systems project selection, European
Journal of Operational Research 140 (2002) 434–446.
[23] D. Kuchta, A fuzzy mode for R&D project selection with
benefit, outcome and resource, The Engineering Economist
46 (3) (2001) 164–180.
[24] J.W. Lee, S.H. Kim, Using analytic network process and
goal programming for interdependent information system
project selection, Computers and Operations Research 27
(2000), 367–382.
[25] D.H. Lee, D. Park, An efficient algorithm for fuzzy weighted
average, Fuzzy Sets and Systems 87 (1997) 39–45.
[26] T.S. Liou, M.J.J. Wang, Fuzzy weighted average: an improved
algorithm, Fuzzy Sets and Systems 49 (1992) 307–315.
[27] L.L. Machacha, P. Bhattacharya, A fuzzy logic based ap-
proach to project selection, IEEE Transactions on Engineer-
ing Management 47 (1) (2000) 65–74.
[28] L.M. Meade, A. Presley, R&D project selection using the
analytic network process, IEEE Transactions on Engineering
Management 49 (1) (2002), 59–67.
[29] O.K. Ngwenyama, B. Noel, M. Ayodele, Supporting facilita-
tion in group support systems: techniques for analyzing con-
sensus relevant data, Decision Support System 16 (1996)
155–168.
[30] E. Pap, Z. Bosnjak, S. Bosnjak, Application of fuzzy sets with
different t-norms in the interpretation of portfolio matrices in
strategic management, Fuzzy Sets and Systems 114 (2000)
123–131.
[31] M.H. Rasmy, S.M. Lee, W.F. Abd El-Wahed, A.M. Ragab,
M.M. El-Sherbiny, An expert system for multiobjective de-
cision making: application of fuzzy linguistic preferences and
goal programming, Fuzzy Sets and Systems 127 (2002)
209–220.
[32] A.J. Rowe, R.O. Mason, K.E. Dickel, Strategic Management,
Addison Wesley, 1994.
[33] A. Sivathanu Pillai, A. Joshi, K. Srinivasa Rao, Performance
measurement of R&D projects in a multi-project, concurrent
engineering environment, International Journal of Project
Management 20 (2002) 165–177.
[34] T.J. Stewart, A multi-criteris decision support system for
R&D project selection, Journal of Operational Research So-
ciety 42 (1) (1991) 17–26.
[35] R.J. Thieme, M. Song, Artificial neural network decision
support systems for new product development project selec-
tion, Journal of Marketing Research 37 (4) (2000) 499–507.
[36] E. Turban, Decision Support and Expert Systems, 4th ed.,
Prentice-Hall, Englewood Cliffs, NJ, 1995.

C. Lin, P.-J. Hsieh / Decision Support Systems 38 (2004) 383–398398
[37] L.A. Zadeh, Fuzzy set, Information and Control 8 (3) (1965)
338–353.
[38] H.J. Zimmermann, Fuzzy Set Theory and Its Application,
Kluwer Academic Publishing, Boston, 1991.
Chinho Lin is the Dean of College of
Management, and a professor at the De-
partment of Information Management at
National Chung Cheng University, Tai-
wan (R.O.C.); a senior professor in the
Department of Industrial Management
Science and Institute of Information Man-
agement at National Cheng Kung Univer-
sity, Taiwan (R.O.C.). He received his
PhD in Business Administration from the
City University of New York. His works
were published in the Journal of the Operational Research Society,
International Journal of Production Research, Decision Sciences,
Applied Mathematics Letters, TQM, Computers and Industrial
Engineering, Information and Management, International Journal
of Systems Science, Microelectronics and Reliability, and others.
His current research interests include inventory control, strategic
information management, quality and reliability management, and
technology management.
Ping-Jung Hsieh is an assistant professor
at the Department of Information Manage-
ment, Kun San University of Technology,
Taiwan. She received her PhD in Business
Administration at National Cheng Kung
University in Taiwan, MHA in Health
Service Administration from University
of Southern California and BS in Medical
Technology from National Yang Ming
University in Taiwan. In addition to stra-
tegic information management, her current
research interests focus on artificial intelligence methods for support-
ing decision-making processes.