Embed Size (px)
Citation preview
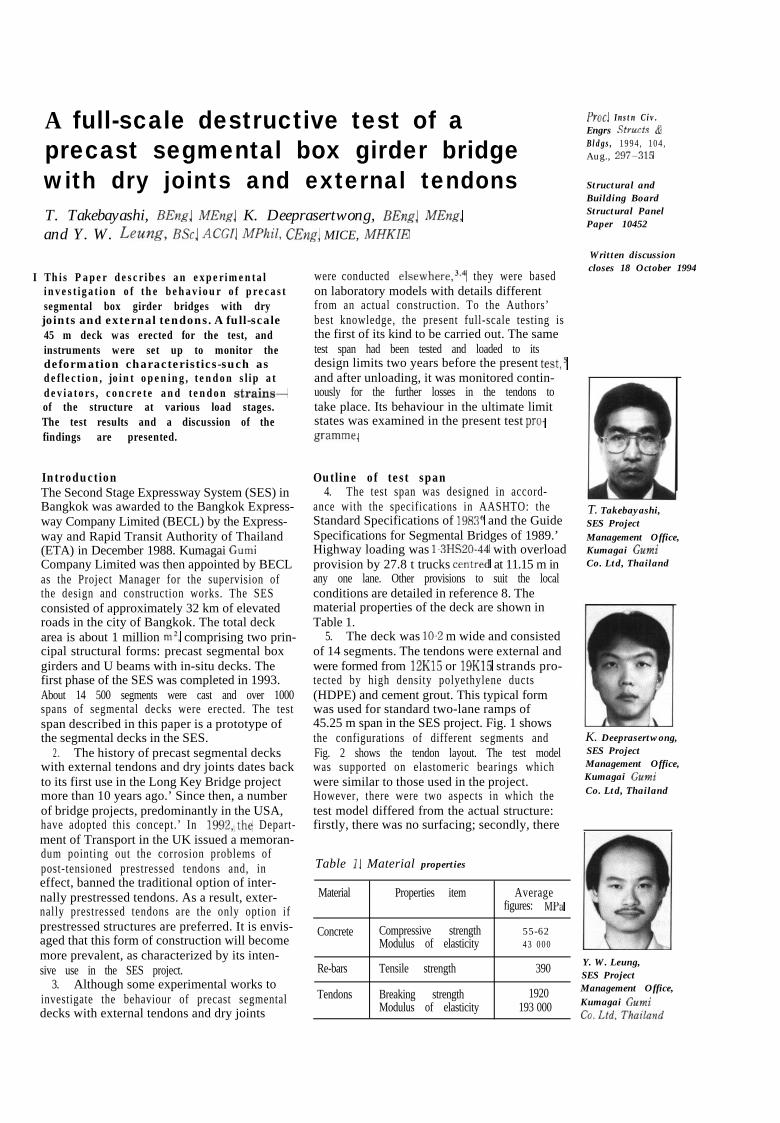
A full-scale destructive test of aprecast segmental box girder bridgewith dry joints and external tendonsT. Takebayashi, BEng, MEng, K. Deeprasertwong, BEng, MEng,
and Y. W. Leung, BSc, ACGI, MPhil, CEng, MICE, MHKIE
I This Paper describes an experimental were conducted elsewhere,3*4 they were basedinvestigation of the behaviour of precast on laboratory models with details differentsegmental box girder bridges with dry from an actual construction. To the Authors’joints and external tendons. A full-scale best knowledge, the present full-scale testing is45 m deck was erected for the test, and the first of its kind to be carried out. The sameinstruments were set up to monitor the test span had been tested and loaded to itsdeformation characteristics-such as design limits two years before the present test,5deflection, joint opening, tendon slip at and after unloading, it was monitored contin-deviators, concrete and tendon strains- uously for the further losses in the tendons toof the structure at various load stages. take place. Its behaviour in the ultimate limitThe test results and a discussion of the states was examined in the present test pro-findings are presented. gramme.
IntroductionThe Second Stage Expressway System (SES) inBangkok was awarded to the Bangkok Express-way Company Limited (BECL) by the Express-way and Rapid Transit Authority of Thailand(ETA) in December 1988. Kumagai GumiCompany Limited was then appointed by BECLas the Project Manager for the supervision ofthe design and construction works. The SESconsisted of approximately 32 km of elevatedroads in the city of Bangkok. The total deckarea is about 1 million m’, comprising two prin-cipal structural forms: precast segmental boxgirders and U beams with in-situ decks. Thefirst phase of the SES was completed in 1993.About 14 500 segments were cast and over 1000spans of segmental decks were erected. The testspan described in this paper is a prototype ofthe segmental decks in the SES.
2 . The history of precast segmental deckswith external tendons and dry joints dates backto its first use in the Long Key Bridge projectmore than 10 years ago.’ Since then, a numberof bridge projects, predominantly in the USA,have adopted this concept.’ In 1992,,the Depart-ment of Transport in the UK issued a memoran-dum pointing out the corrosion problems ofpost-tensioned prestressed tendons and, ineffect, banned the traditional option of inter-nally prestressed tendons. As a result, exter-nally prestressed tendons are the only option ifprestressed structures are preferred. It is envis-aged that this form of construction will becomemore prevalent, as characterized by its inten-sive use in the SES project.
Outline of test span4. The test span was designed in accord-
ance with the specifications in AASHTO: theStandard Specifications of 1983’j and the GuideSpecifications for Segmental Bridges of 1989.’Highway loading was 1.3HS20-44 with overloadprovision by 27.8 t trucks centred at 11.15 m inany one lane. Other provisions to suit the localconditions are detailed in reference 8. Thematerial properties of the deck are shown inTable 1.
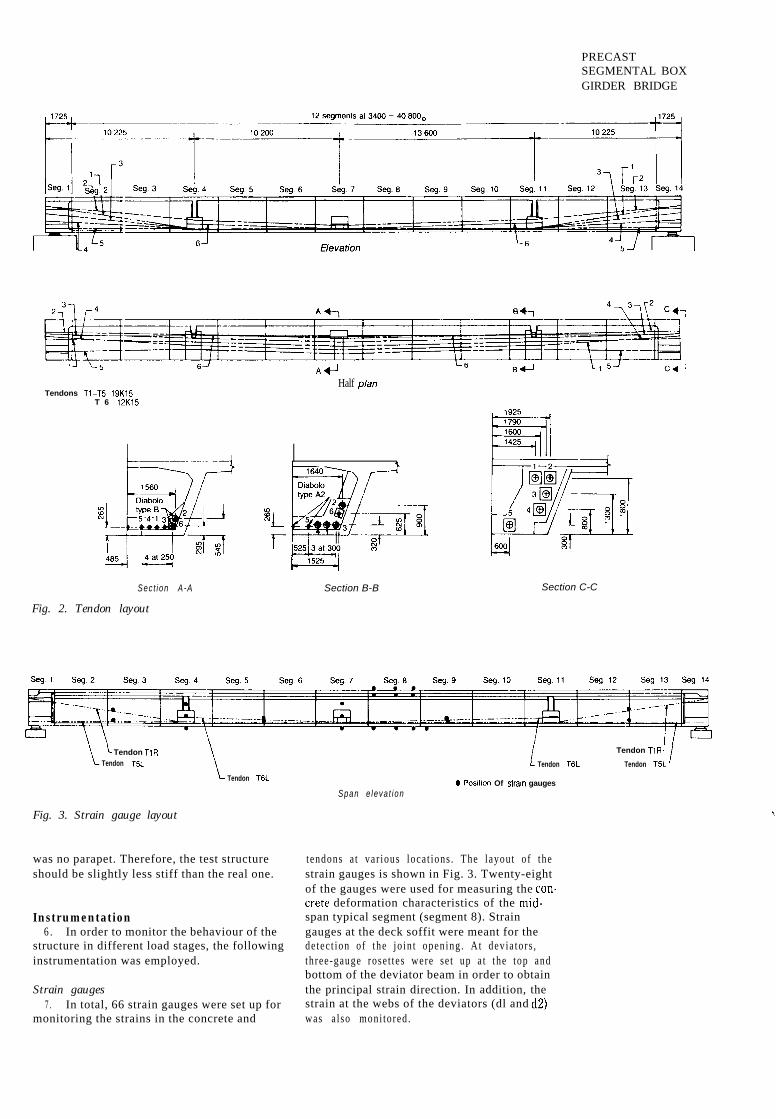
5. The deck was 10.2 m wide and consistedof 14 segments. The tendons were external andwere formed from 12K15 or 19K15 strands pro-tected by high density polyethylene ducts(HDPE) and cement grout. This typical formwas used for standard two-lane ramps of45.25 m span in the SES project. Fig. 1 showsthe configurations of different segments andFig. 2 shows the tendon layout. The test modelwas supported on elastomeric bearings whichwere similar to those used in the project.However, there were two aspects in which thetest model differed from the actual structure:firstly, there was no surfacing; secondly, there
Table 1. Material properties
Material Properties item Averagefigures: MPa
3. Although some experimental works toinvestigate the behaviour of precast segmentaldecks with external tendons and dry joints
Concrete
Re-bars
Tendons
Compressive strength 55-62Modulus of elasticity 43 000
Tensile strength 390
Breaking strength 1920Modulus of elasticity 193 000
Proc. Instn Civ .Engrs Structs &Bldgs , 1994, 104,Aug., 297-315
Structural andBuilding BoardStructural PanelPaper 10452
Written discussioncloses 18 October 1994
T. Takebayashi,SES ProjectManagement Office,Kumagai GumiCo. Ltd, Thailand
K. Deeprasertwong,SES ProjectManagement Office,Kumagai GumiCo. Ltd, Thailand
Y. W. Leung,SES ProjectManagement Office,Kumagai Gumi

TAKEBAYASHI,DEEPRASERTWONG
AND LEUNG
Fig. 1. Generalconfiguration ofsegments (dimensionsfor segments in m;dimensions forsection detail in mm)
298
, 2aOo ,0.750, 3~700_1 I i
Intermediate segmeni
End anchorageview
Diaphragm segment
Deviator segment dl
End anchoragewew + O\rZ
x0.225 o.400-.-.
f2.000
-A
0.475
I I, .500 0.225
I
-0.45 J
w0.050 0 . 4 5 0
Deviator segment d2
Detail A 35
Section A-A Sec t i on B-B Section C-C
PRECASTSEGMENTAL BOXGIRDER BRIDGE
Tendons Tl-T5 19K15T 6 12K15
Sec t ion A-A
Fig. 2. Tendon layout
Afl
Half plan
Section B-B Section C-C
L Tendon Tl RTendon T5L
Tendon T6L
Fig. 3. Strain gauge layout
was no parapet. Therefore, the test structureshould be slightly less stiff than the real one.
Instrumentation6 . In order to monitor the behaviour of the
structure in different load stages, the followinginstrumentation was employed.
Strain gauges7 . In total, 66 strain gauges were set up for
monitoring the strains in the concrete and
Span e leva t ion
Tendon T6L
0 Posltlon Of stram gauges
Tendon Tl R ’
Tendon T5L
t endons a t var ious loca t ions . The layout of thestrain gauges is shown in Fig. 3. Twenty-eightof the gauges were used for measuring the con.Crete deformation characteristics of the mid-span typical segment (segment 8). Straingauges at the deck soffit were meant for thede tec t ion o f the jo in t open ing . At dev ia to rs ,three-gauge rose t tes were se t up a t the top andbottom of the deviator beam in order to obtainthe principal strain direction. In addition, thestrain at the webs of the deviators (dl and d2)was a lso moni tored .

TAKEBAYASHI,DEEPRASERTWONG
AND LEUNG
8 . The tendon strain at a particular locationwas obtained by two strain gauges fixed to thewires of two seven-wire s t rands. These gaugeswere pos i t ioned on the f ree length por t ions ofthe tendon. Three tendons, TlR, T5L and T6L,were monitored. The tendon Tl had the largestdeviation angle, and T5 had the smallest. T6was a shor t t endon anchored be tween devia tors(d2) instead of the diaphragm.
Dial gauges9 . A total of 24 dial gauges was employed.
Two characteristics were monitored using thesegauges: joint opening (20 gauges) and joint slip(four gauges). The gauges meant for jointopening were set horizontally while those forjoint slip were vertical. The layout is shown inFig. 4.
10. The vertical gauges were set at jointl-2 and 4-5 on both sides of the joints. Joint1-2 was monitored because of the high shearlevel . However , i t was not expected to open upeven in the ultimate limit state. The combinedeffects of shear and joint opening together witha lesser vertical component of prestress madejoint 4-5 have a potential to slip. It was moni-tored for this reason.
11. Joint 8-9 which was expected to havethe b igges t opening was moni tored by hor izon-tal dial gauges on both sides of the joint. Theremaining gauges were all set on one side onlyfor ease of operat ion.
12. Theodolites were employed for takingreadings because of access ibi l i ty and safe tyreasons .
Table 2. Loading conditions
Day Load stage
4
No loadTrial loadNo loadOvernight load
Design service loadOvernight load
Observed decompression loadat joint S-9
Observed decompression loadat joint 7-8
Design ultimate load(Overnight load)
Load to 2470 billetsUnload 70 billets for safety
(overnight load)
(Design ultimate load)/(d)Failure load
No. of billets Appliedmid-span moment:
kN-m
0 0120 3 200
0 0360 8600
1080 24 6001320 30 000
1620 36 500
1660 37 250
1980 44 600
2470 54 9002400 53 600
2600 57 7002620 58 200
Vertical scale13. To monitor the deflection of the span,
ver t ica l sca les a t tached to the web of the seg-ments were set up at 56 locations, i.e. four ateach joint (see Fig. 5 for the arrangement).Levels were employed for taking the readings.
Horizontal scale14. The slips of tendons at deviators were
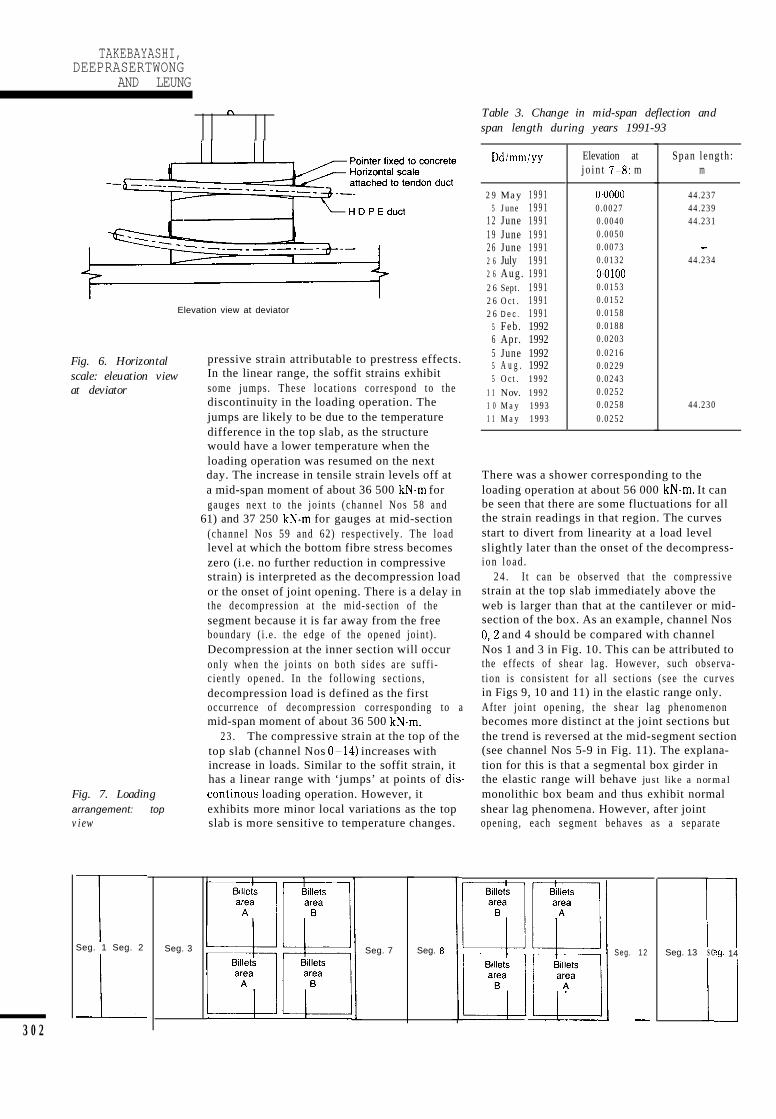
monitored with 64 horizontal scales, with apointer fixed to the face of the deviator beams(see Fig. 6). Since data acquisition had to bedone manually by the personnel entering thebox, only a limited amount of information wascol lected on account of safe ty reasons .
Loading15. Steel billets were used as the imposed
load for the test. They were stacked up in twoload areas (A and B) so that the top slab at themid-span area could be monitored conveniently.Each billet was 347 kg, and five were handledat a time by crane. Two cranes were employedfor the loading operation. In order to preventexcessive drop and total collapse of the struc-ture during failure, temporary supports com-prising steel sections and wooden planks wereprovided underneath the deck. Figs 7 and 8show the general arrangement.
16. Before the actual loading test, the testspan was preloaded initially with 120 billets.On removal of the preload, the initial readingsof all the instrument were set to zero.
17. The loading operations lasted for fivedays. No operation was carried out duringnight-time but strain gauge readings wereobtained at hourly intervals by the data logger.Data were acquired at each 120 billet loadingcycle up to a total load of 1560 billets, corre-sponding to a load s tage s l igh ty before theexpected decompression load. Data were thenobtained at each 20 billet loading cycle untilfailure. However, at the load stage near failure,stability of the structure was checked at every10 billet increment. At the end of the fourthday, 70 billets were removed from a total of2470 to ensure that no stability problemoccurred during the night. The structure failedat a load of 2620 billets in the evening of thefifth day. Table 2 shows important milestonesfor the loading operation.
18. In addition to the load imposed by thebillets, the test span was subject to other load-ings similar to those experienced by the actualstructures, namely temperature, wind, rain, etc.The response of the s t ruc ture to these loadingswas picked up by the instruments which pro-duced local variations in the response charac-teristics. However, they were not monitoredind iv idua l ly and thus cou ld no t be uncoup ledfrom the effects of the billet loads.

PRECASTSEGMENTAL BOXGIRDER BRIDGE
c
Seg. 1 Seg. 2 Seg. 3 Seg. 4 Seg. 5 Seg. 6 Seg. 7 Seg. 0 Seg. 9 Seg. 1 0 Seg. 1 1 Seg. 1 2 Seg. 1 3 Seg. 1 4
-
S e g . 1 Seg. 2 Seg. 3 Seg. 4 Seg. 5 Seg. 6
Left side
Left
Right
Seg. 7 Seg. 0 Seg. 9 Seg. 10 Seg. 11 Seg. 12 Seg. 13 Seg. 14
IX Verkal dial gauge
8 Horizontal dial gauge
Right side I
Initial conditions of the test span19. The tes t span was loaded to i t s des ign
limits two years ago and its deformation char-acteristics were monitored continuously. Thechanges in its span length and deflection areshown in Tab le 3 .
2 0 . Before the present load test, a detailedvisual survey was conducted . I t was found tha tcracks which had been observed and repor tedin reference 5 did not propagate any further.
Test results and interpretations Fig. 4. Dialgaugelayout
Concrete strain2 1 . Curves p lo t t ing the change in concre te
strain for segment 8 against the mid-spanmoment are shown in Figs 9-11.
2 2 . With additional loads, the strain gaugesattached to the box soffit (channel Nos 58-63)show a linear increase in tensile strain whichcorresponds to a reduction in the initial com-
Vertical scalehangmg from web of segment
I Fig. 5. Vertical scale.elevation view of testspan
TAKEBAYASHI,DEEPRASERTWONG
AND LEUNG
Elevation view at deviator
Fig. 6. Horizontal pressive strain attributable to prestress effects.scale: eleuation view In the linear range, the soffit strains exhibitat deviator some jumps. These locat ions correspond to the
discontinuity in the loading operation. Thejumps are likely to be due to the temperaturedifference in the top slab, as the structurewould have a lower temperature when theloading operation was resumed on the nextday. The increase in tensile strain levels off ata mid-span moment of about 36 500 kN-m forgauges nex t to the jo in t s (channe l Nos 58 and
61) and 37 250 kN-m for gauges at mid-section(channel Nos 59 and 62) respect ive ly . The loadlevel at which the bottom fibre stress becomeszero (i.e. no further reduction in compressivestrain) is interpreted as the decompression loador the onset of joint opening. There is a delay inthe decompression at the mid-sect ion of thesegment because it is far away from the freeboundary ( i .e . the edge of the opened jo int ) .Decompression at the inner section will occuronly when the jo in t s on bo th s ides a re su f f i -c ien t ly opened . In the fo l lowing sec t ions ,decompression load is defined as the firstoccurrence of decompression corresponding to amid-span moment of about 36 500 kN-m.
Fig. 7. Loadingarrangement: topv i e w
2 3 . The compressive strain at the top of thetop slab (channel Nos O-14) increases withincrease in loads. Similar to the soffit strain, ithas a linear range with ‘jumps’ at points of dis-continous loading operation. However, itexhibits more minor local variations as the topslab is more sensitive to temperature changes.
I-Seg. 1 Seg. 2
/
Seg. 3 ! Seg. 7 Seg. 0 I
Table 3. Change in mid-span deflection andspan length during years 1991-93
Dd/mm/w Elevation at Span l eng th :j o i n t 7-8: m m
2 9 May 1 9 9 1 0~00005 June 1 9 9 1 0.0027
1 2 June 1 9 9 1 0.00401 9 June 1 9 9 1 0.00502 6 June 1 9 9 1 0.00732 6 July 1 9 9 1 0.01322 6 A u g . 1 9 9 1 0~01002 6 Sept. 1 9 9 1 0.01532 6 Oct . 1 9 9 1 0.01522 6 D e c . 1 9 9 1 0.0158
5 Feb. 1992 0.01886 Apr. 1992 0.02035 June 1992 0.02165 A u g . 1992 0.02295 Oct . 1992 0.0243
1 1 Nov. 1992 0.02521 0 May 1993 0.02581 1 May 1993 0.0252
44.23744.23944.231
-44.234
44.230
There was a shower corresponding to theloading operation at about 56 000 kN-m. It canbe seen that there are some fluctuations for allthe strain readings in that region. The curvesstart to divert from linearity at a load levelslightly later than the onset of the decompress-i o n l o a d .
2 4 . I t can be observed that the compress ivestrain at the top slab immediately above theweb is larger than that at the cantilever or mid-section of the box. As an example, channel Nos0,2 and 4 should be compared with channelNos 1 and 3 in Fig. 10. This can be attributed tothe effects of shear lag. However, such observa-t ion i s cons is ten t for a l l sec t ions ( see the curvesin Figs 9, 10 and 11) in the elastic range only.After jo in t opening, the shear lag phenomenonbecomes more distinct at the joint sections butthe trend is reversed at the mid-segment section(see channel Nos 5-9 in Fig. 11). The explana-tion for this is that a segmental box girder inthe elastic range will behave just like a normalmonolithic box beam and thus exhibit normalshear lag phenomena. However, after jointopening, each segment behaves as a separate
Seg. 1 2
-
Seg. 13i
S C
I
13g. 14
1
3 0 2

Fig. 8. Generalloading arrangement
unit with imposed stress boundary conditions to reduce in the compressive strain at a loadat the unopened joint section. The states of the level slightly later than the top ones after theadjacent segments are different from normal onset of non-linearity. The reverse in strainbending stress states. direction corresponds to the shifting of the
25. Strain gauges fixed near the joint at the neutral axis into the top slab. The strain gaugebottom of the top slab show a similar behaviour (channel 16) fixed at the mid-section of theto those at the top of the top slab but they start segment, however, does not show a reverse in
c0.s; -c0.2
m”
t
0zxc - 0 . 2.-E L 71 R 0
h
t 63 6’0- 1 . 4 c
0 2 0 40 ,
Fig. 9. Change inconcrete strain
) against mid-spanmomentMid-span moment: x 1000 kN-m

TAKEBAYASHI,DEEPRASERTWONG
AND LEUNG
Fig. 10. Change inconcrete strainagainst mid-spanmoment
Fig. 11. Change inconcrete strainagainst mid-spanmoment
f I-0.4
c8
,E l-043$5 -0.80
Ch. O-4
Ch. 17,19, 21
Ch. 58361
2 0 40 6 0
Mid-span moment: x 1000 kN-m
strain direction and it can be explained withsimilar arguments as in the shear lag dis-cussion.
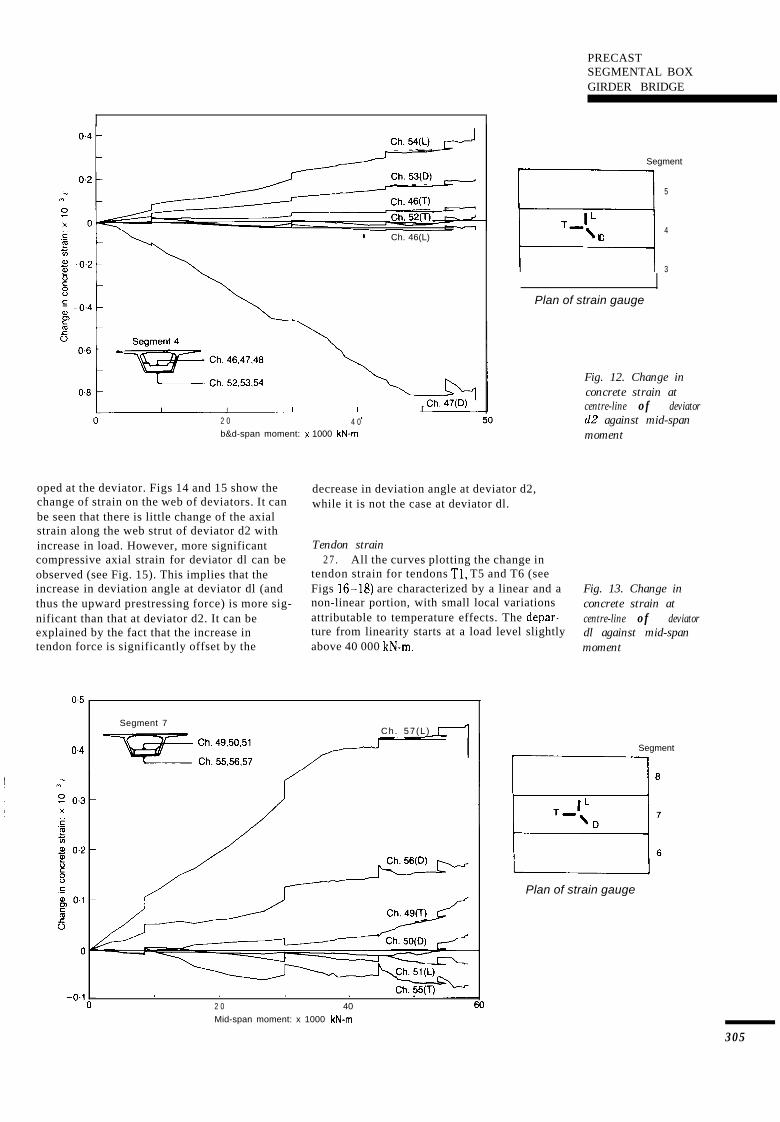
26. The purpose of the strain gauges fixedto the deviators (dl and d2) is not to have adetailed measurement of the complicated stressstates which have been reported in reference 5from a finite-element analysis, but to verifysome simple design assumptions such as thedesign concept of the deviator beam. Figs 12and 13 show the plotting of the strain measuredby the two three-gauge rosettes at the top andbottom of the deviator beams for the d2 and dl
segments respectively. For deviator dl, channel57 shows the typical decompression character-istics (channel 56 shows similar behaviour butnot in the principal direction); channel Nos 50and 51 show little change in strain; channelNos 55 and 49 show tension at the top fibre andcompression at the bottom fibre, and thusverify the beam concept in the design. Similarconclusions can be made for deviator d2 (seeFig. 12). However, channel 47 shows a signifi-cant compression in the non-principal directionwhich cannot be properly explained. It may bethe result of unbalanced frictional force devel-
c
I2 0 40 6 0
Mid-span moment: x 1000 kN-m
304
PRECASTSEGMENTAL BOXGIRDER BRIDGE
-0.6
0.6
. Ch. 46(L)
2 0 4 0b&d-span moment: x 1000 kN-m
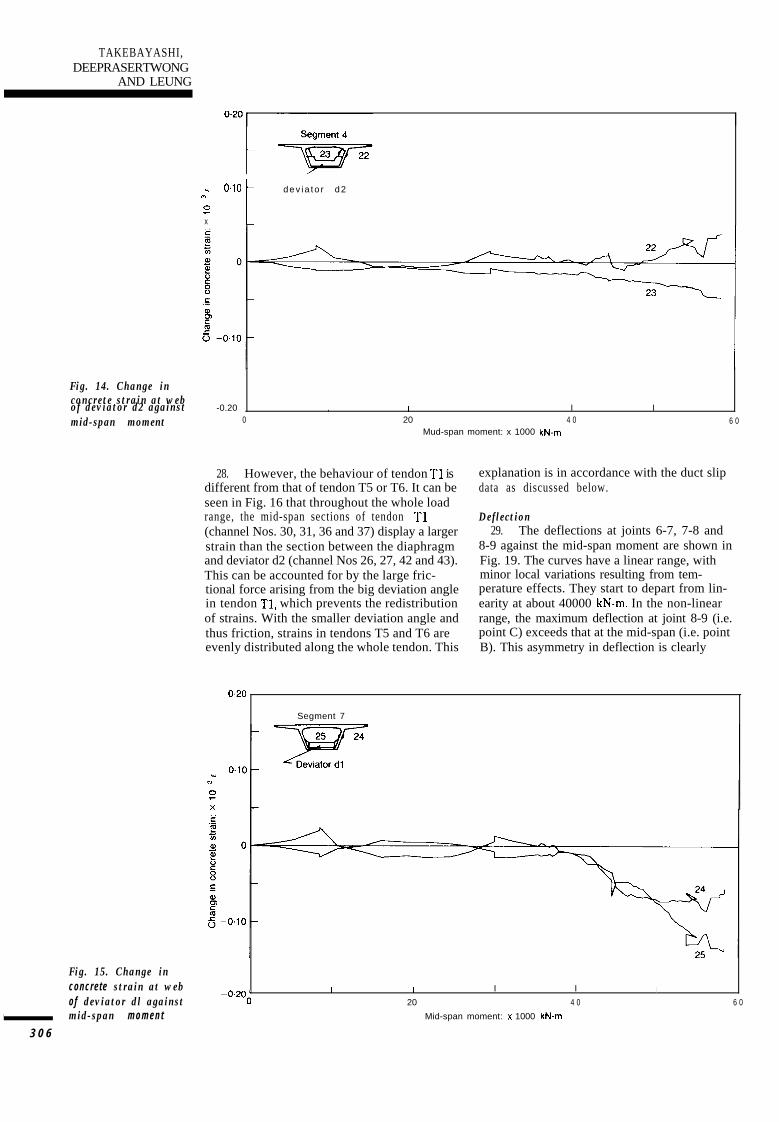
oped at the deviator. Figs 14 and 15 show thechange of strain on the web of deviators. It canbe seen that there is little change of the axialstrain along the web strut of deviator d2 withincrease in load. However, more significantcompressive axial strain for deviator dl can beobserved (see Fig. 15). This implies that theincrease in deviation angle at deviator dl (andthus the upward prestressing force) is more sig-nificant than that at deviator d2. It can beexplained by the fact that the increase intendon force is significantly offset by the
0.5
0.4
Segment
H 5
T-:’ 4D
3
Plan of strain gauge
Fig. 12. Change inconcrete strain atcentre-line of deviatord2 against mid-spanmoment
decrease in deviation angle at deviator d2,while it is not the case at deviator dl.
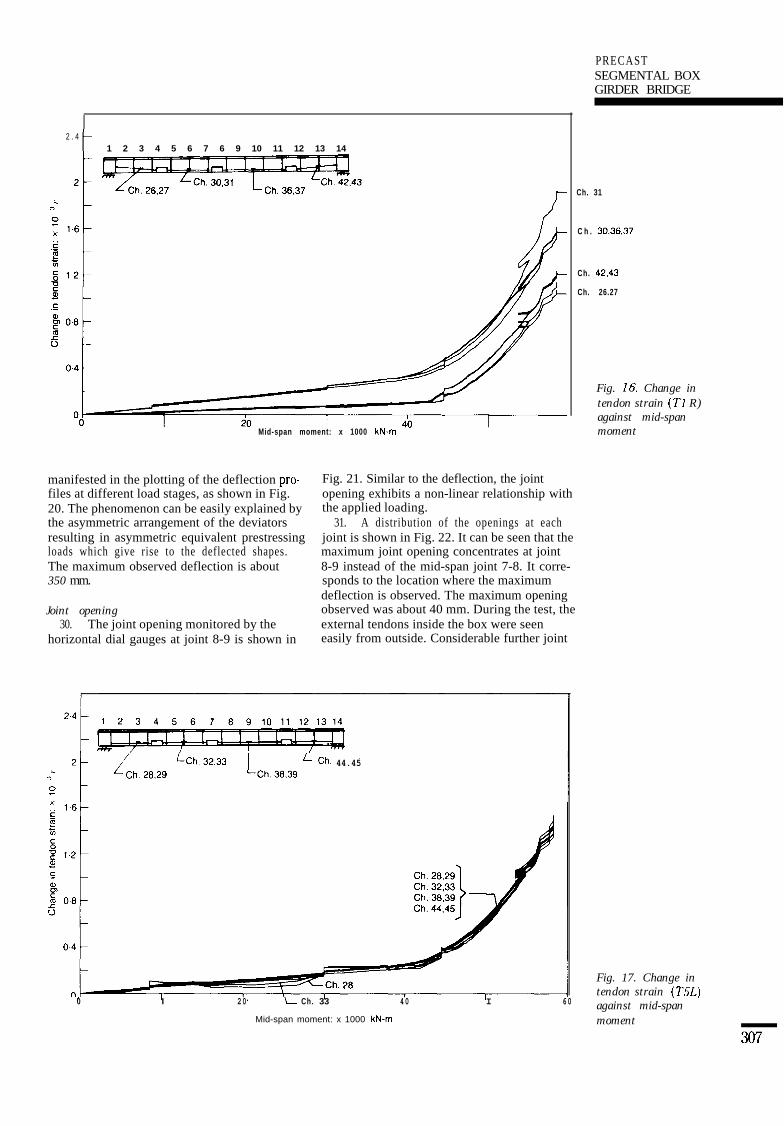
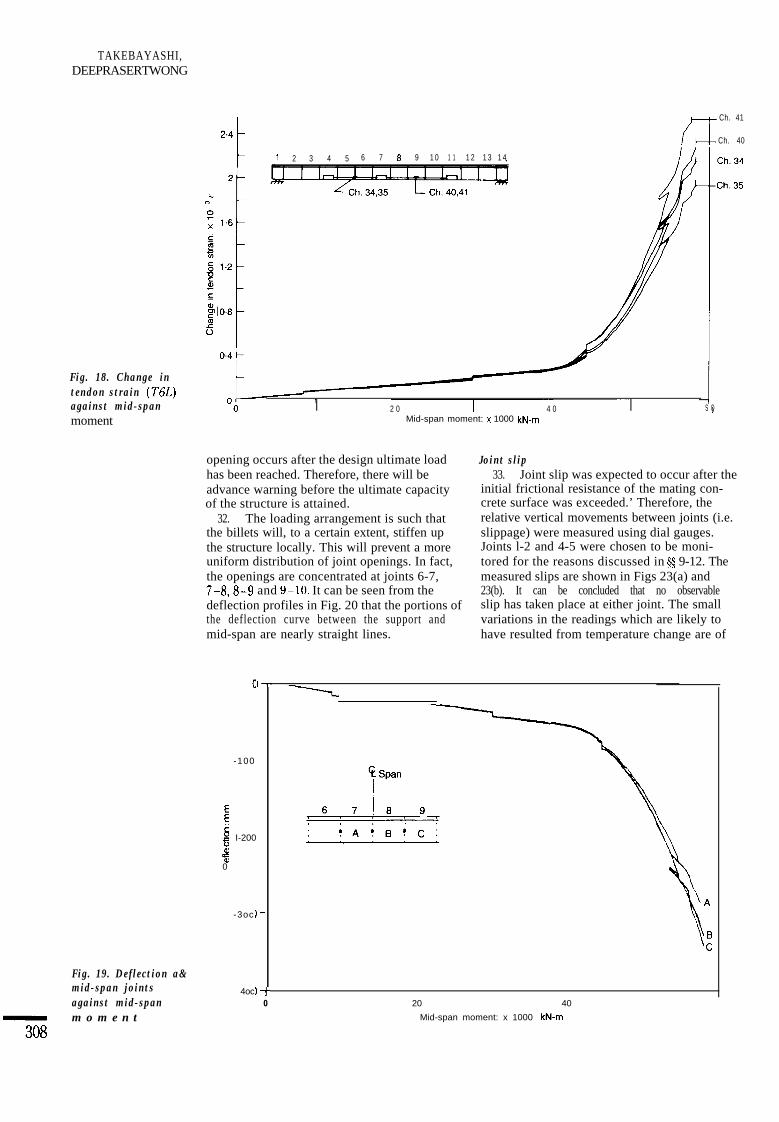
Tendon strain2 7 . All the curves plotting the change in
tendon strain for tendons Tl, T5 and T6 (seeFigs 16618) are characterized by a linear and a Fig. 13. Change innon-linear portion, with small local variations concrete strain atattributable to temperature effects. The depar- centre-line of deviatorture from linearity starts at a load level slightly dl against mid-spanabove 40 000 kN-m. moment
Segment 7Ch. 57(L ) f
2 0 40
Mid-span moment: x 1000 kN-m
Segment
Plan of strain gauge
305
TAKEBAYASHI,DEEPRASERTWONG
AND LEUNG
m”0.10
t
dev ia to r d2
0x
Fig. 14. Change inconcrete strain at webof deviator d2 against -0.20 , I 1 I I
0 20mid-span moment 4 0 6 0Mud-span moment: x 1000 kN-m
28. However, the behaviour of tendon Tl isdifferent from that of tendon T5 or T6. It can beseen in Fig. 16 that throughout the whole loadrange, the mid-span sections of tendon Tl(channel Nos. 30, 31, 36 and 37) display a largerstrain than the section between the diaphragmand deviator d2 (channel Nos 26, 27, 42 and 43).This can be accounted for by the large fric-tional force arising from the big deviation anglein tendon Tl, which prevents the redistributionof strains. With the smaller deviation angle andthus friction, strains in tendons T5 and T6 areevenly distributed along the whole tendon. This
explanation is in accordance with the duct slipdata as discussed below.
Deflection29. The deflections at joints 6-7, 7-8 and
8-9 against the mid-span moment are shown inFig. 19. The curves have a linear range, withminor local variations resulting from tem-perature effects. They start to depart from lin-earity at about 40000 kN-m. In the non-linearrange, the maximum deflection at joint 8-9 (i.e.point C) exceeds that at the mid-span (i.e. pointB). This asymmetry in deflection is clearly
0.20
Segment 7
Fig. 15. Change inconcrete strain at web I I I I 1
of deviator dl against -o.20020 4 0 6 0
I mid-span moment Mid-span moment: x 1000 kN-m
3 0 6
PRECASTSEGMENTAL BOXGIRDER BRIDGE
2 . 41 2 3 4 5 6 7 6 9 10 11 12 13 14
Mid-span moment: x 1000 kN-m
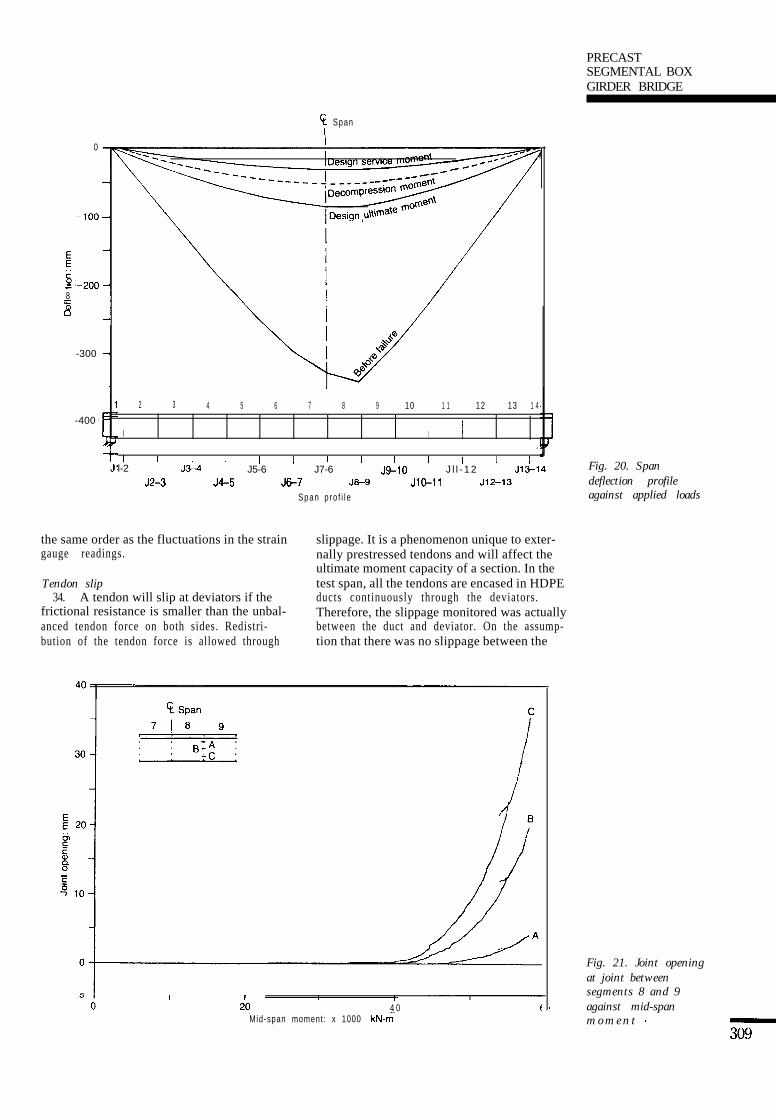
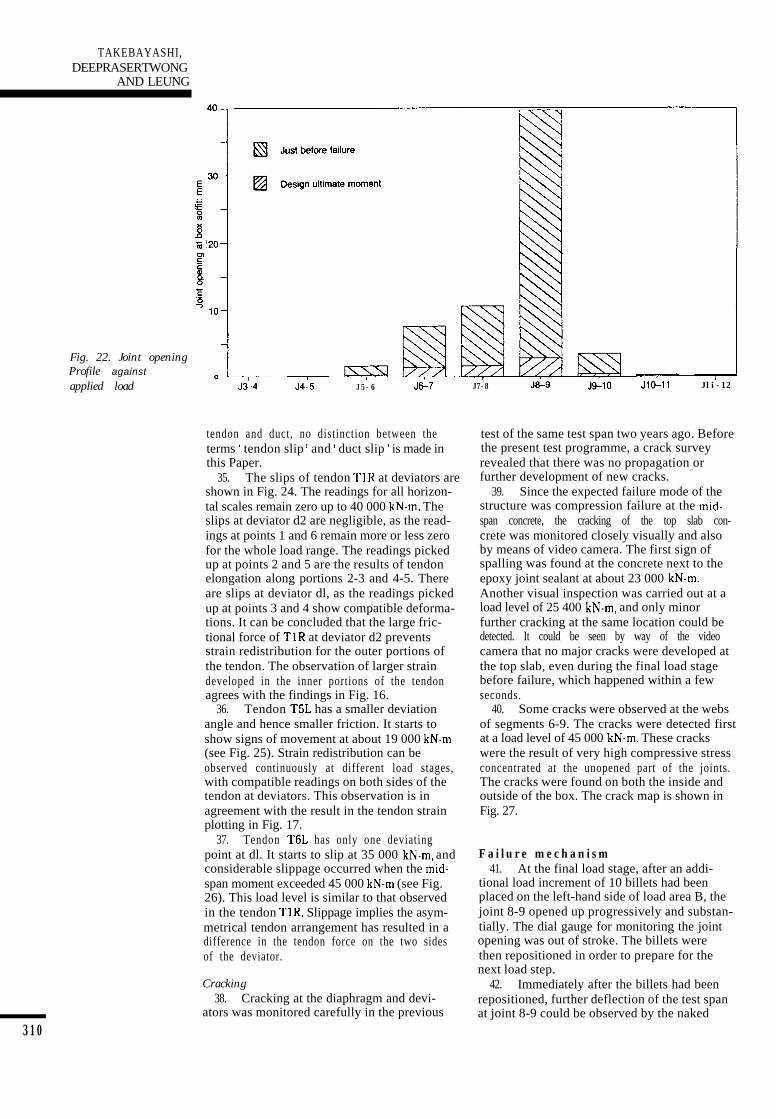
manifested in the plotting of the deflection pro- Fig. 21. Similar to the deflection, the jointfiles at different load stages, as shown in Fig.20. The phenomenon can be easily explained bythe asymmetric arrangement of the deviatorsresulting in asymmetric equivalent prestressingloads which give rise to the deflected shapes.The maximum observed deflection is about350 mm.
Joint opening30. The joint opening monitored by the
horizontal dial gauges at joint 8-9 is shown in
opening exhibits a non-linear relationship withthe applied loading.
31. A distribution of the openings at eachjoint is shown in Fig. 22. It can be seen that themaximum joint opening concentrates at joint8-9 instead of the mid-span joint 7-8. It corre-sponds to the location where the maximumdeflection is observed. The maximum openingobserved was about 40 mm. During the test, theexternal tendons inside the box were seeneasily from outside. Considerable further joint
//Ch,262g LCh.32,33 L,,,,,, ,!- Ch. 44.45
Ch. 31
C h . 30,36.37
Ch. 42,43
Ch. 26.27
Fig. 16. Change intendon strain (Tl R)against mid-spanmoment
Fig. 17. Change intendon strain (T&L)
0 I 20 Ch. 33 40 I 60 against mid-spanMid-span moment: x 1000 kN-m moment
307
I TAKEBAYASHI,DEEPRASERTWONG
Ch. 41
(7’6L)against mid-spanmoment
Fig. 19. Deflection a&mid-span jointsagainst mid-span
308m o m e n t
f-L Ch. 40
t 1 2 3 4 5 6 7 6 9 1 0 1 1 1 2 1 3 1 4
2 0 I 4 0 S OMid-span moment: x 1000 kN-m
opening occurs after the design ultimate loadhas been reached. Therefore, there will beadvance warning before the ultimate capacityof the structure is attained.
32. The loading arrangement is such thatthe billets will, to a certain extent, stiffen upthe structure locally. This will prevent a moreuniform distribution of joint openings. In fact,the openings are concentrated at joints 6-7,7-8,8-g and 9-10. It can be seen from thedeflection profiles in Fig. 20 that the portions ofthe deflection curve between the support andmid-span are nearly straight lines.
I--a
-100
Er
.g I-200a
%0
-3oc
- 4oc
)-
IT
Joint slip33. Joint slip was expected to occur after the
initial frictional resistance of the mating con-crete surface was exceeded.’ Therefore, therelative vertical movements between joints (i.e.slippage) were measured using dial gauges.Joints l-2 and 4-5 were chosen to be moni-tored for the reasons discussed in # 9-12. Themeasured slips are shown in Figs 23(a) and23(b). It can be concluded that no observableslip has taken place at either joint. The smallvariations in the readings which are likely tohave resulted from temperature change are of
0 20 40
Mid-span moment: x 1000 kN-m
t
Fig. 18. Change intendon strain
PRECASTSEGMENTAL BOXGIRDER BRIDGE
C Span
0
-100
Ec0 I-2008%0
-300
-400
1
2 3 4 5 6 7 ! 8 9 10 1 1 12 13 1 4
I I I.
I I I I I I I I I I I I Il-2 J34 J5-6 J7-6 J9-10 J l l - 12 Jl3-14 Fig. 20. Span
J2-3 J4-5 J6-7 J6-9 JlO-11 Jl2-13 deflection profileSpan p ro f i l e against applied loads
1 I4 0
Mid-span moment: x 1000 kN-m
Fig. 21. Joint openingat joint betweensegments 8 and 9
I against mid-spanm o m e n t *
the same order as the fluctuations in the straingauge readings.
Tendon slip34. A tendon will slip at deviators if the
frictional resistance is smaller than the unbal-anced tendon force on both sides. Redistri-bution of the tendon force is allowed through
slippage. It is a phenomenon unique to exter-nally prestressed tendons and will affect theultimate moment capacity of a section. In thetest span, all the tendons are encased in HDPEducts continuously through the deviators.Therefore, the slippage monitored was actuallybetween the duct and deviator. On the assump-tion that there was no slippage between the
TAKEBAYASHI,DEEPRASERTWONG
AND LEUNG
Fig. 22. Joint openingProfile againstapplied load J34 J4-5 J5-6 J6-7 J7-8 J&l0 J&11 Jli-12
tendon and duct, no distinction between theterms ‘ tendon slip ’ and ‘ duct slip ’ is made inthis Paper.
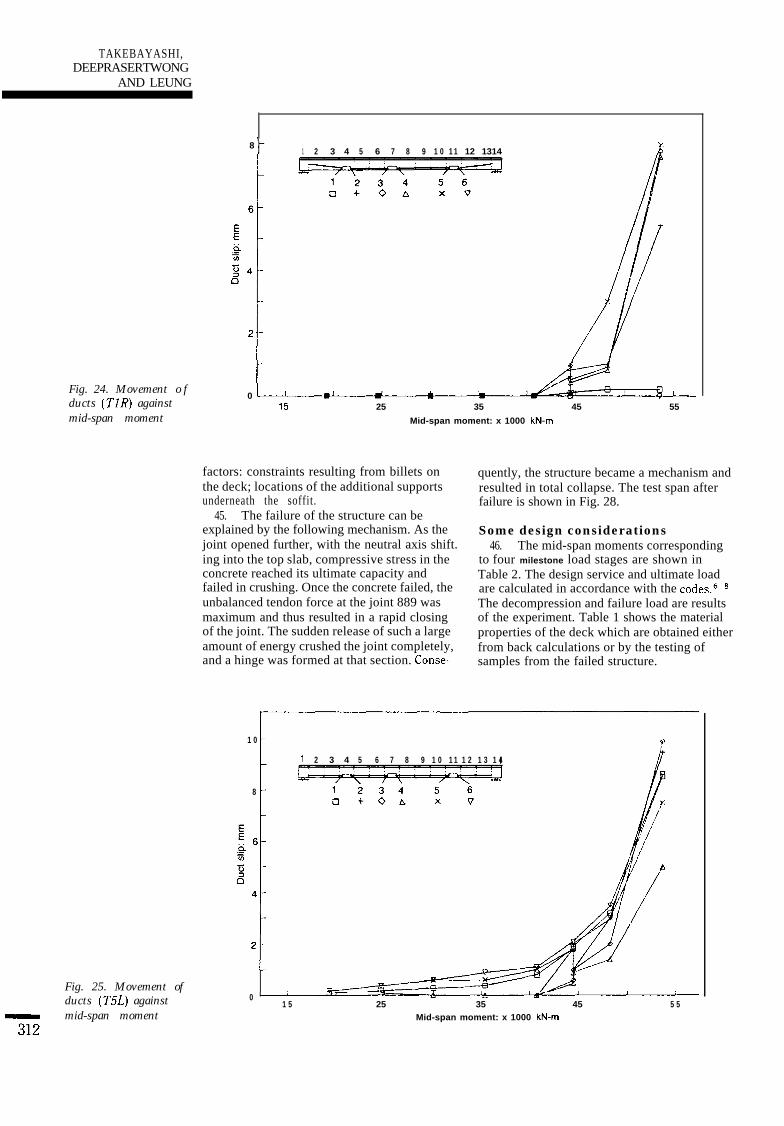
35. The slips of tendon TlR at deviators areshown in Fig. 24. The readings for all horizon-tal scales remain zero up to 40 000 kN-m. Theslips at deviator d2 are negligible, as the read-ings at points 1 and 6 remain more or less zerofor the whole load range. The readings pickedup at points 2 and 5 are the results of tendonelongation along portions 2-3 and 4-5. Thereare slips at deviator dl, as the readings pickedup at points 3 and 4 show compatible deforma-tions. It can be concluded that the large fric-tional force of TlR at deviator d2 preventsstrain redistribution for the outer portions ofthe tendon. The observation of larger straindeveloped in the inner portions of the tendonagrees with the findings in Fig. 16.
test of the same test span two years ago. Beforethe present test programme, a crack surveyrevealed that there was no propagation orfurther development of new cracks.
39. Since the expected failure mode of thestructure was compression failure at the mid-span concrete, the cracking of the top slab con-crete was monitored closely visually and alsoby means of video camera. The first sign ofspalling was found at the concrete next to theepoxy joint sealant at about 23 000 kN-m.Another visual inspection was carried out at aload level of 25 400 kN-m, and only minorfurther cracking at the same location could bedetected. It could be seen by way of the videocamera that no major cracks were developed atthe top slab, even during the final load stagebefore failure, which happened within a fewseconds.
36. Tendon T5L has a smaller deviationangle and hence smaller friction. It starts toshow signs of movement at about 19 000 kN-m(see Fig. 25). Strain redistribution can beobserved continuously at different load stages,with compatible readings on both sides of thetendon at deviators. This observation is inagreement with the result in the tendon strainplotting in Fig. 17.
40. Some cracks were observed at the websof segments 6-9. The cracks were detected firstat a load level of 45 000 kN-m. These crackswere the result of very high compressive stressconcentrated at the unopened part of the joints.The cracks were found on both the inside andoutside of the box. The crack map is shown inFig. 27.
37. Tendon T6L has only one deviatingpoint at dl. It starts to slip at 35 000 kN-m, andconsiderable slippage occurred when the mid-span moment exceeded 45 000 kN-m (see Fig.26). This load level is similar to that observedin the tendon TlR. Slippage implies the asym-metrical tendon arrangement has resulted in adifference in the tendon force on the two sidesof the deviator.
Failure mechanism41. At the final load stage, after an addi-
tional load increment of 10 billets had beenplaced on the left-hand side of load area B, thejoint 8-9 opened up progressively and substan-tially. The dial gauge for monitoring the jointopening was out of stroke. The billets werethen repositioned in order to prepare for thenext load step.
Cracking 42. Immediately after the billets had been38. Cracking at the diaphragm and devi- repositioned, further deflection of the test span
ators was monitored carefully in the previous at joint 8-9 could be observed by the naked310

PRECASTSEGMENTAL BOXGIRDER BRIDGE
0~030
0.020
EL:5E8m 0,010Esr.-*
0.000
-0.010
oa40
0.030
E2 0.020
t
HB5x 0.010s
0.000
-0.010
!
0 1ooa
Shear force: kN
(a)
1
- I I I5 0 0 loo0 1500 2ooo 25bo 3ooo
Shear force: kN
(4
eye. The failure took place nearly at the sametime, with the soffit dropping to rest on thewooden planks.
slab at the joint. Progressive failure of the com-plete structure took place, starting from the col-lapse of the segments on the side of segment 14and then those on the side of segment 1. Acloud of dust was emitted at the joint 8-9immediately after the collapse.
43. The failure took place in stages within afew seconds. Firstly, a loud sound was heardand crushing of the top slab concrete at joint8-9 was observed. Almost at the same time, anexplosive noise was produced as a result of con-Crete crushing at both the web and the bottom configuration may be influenced by two
44. Large joint openings at joints 11-12 and3-4 were observed at the failed structure. This
Fig. 23. Relativevertical displacementat: (a)joint l-2against appliedshear; (6) joint 4-5against applied shear
311 ’
TAKEBAYASHI,DEEPRASERTWONG
AND LEUNG
81 2 3 4 5 6 7 8 9 1 0 1 1 12 1314
(TlR) against0
15 25 35 45 55mid-span moment Mid-span moment: x 1000 kN-m
Fig. 25. Movement ofducts (T5L) against
312mid-span moment
factors: constraints resulting from billets on quently, the structure became a mechanism andthe deck; locations of the additional supports resulted in total collapse. The test span afterunderneath the soffit. failure is shown in Fig. 28.
45. The failure of the structure can beexplained by the following mechanism. As thejoint opened further, with the neutral axis shift.ing into the top slab, compressive stress in theconcrete reached its ultimate capacity andfailed in crushing. Once the concrete failed, theunbalanced tendon force at the joint 889 wasmaximum and thus resulted in a rapid closingof the joint. The sudden release of such a largeamount of energy crushed the joint completely,
Some design considerations46. The mid-span moments corresponding
to four milestone load stages are shown inTable 2. The design service and ultimate loadare calculated in accordance with the codes.6-8The decompression and failure load are resultsof the experiment. Table 1 shows the materialproperties of the deck which are obtained eitherfrom back calculations or by the testing of
and a hinge was formed at that section. Conse- samples from the failed structure.
1 0
1 2 3 4 5 6 7 8 9 1 0 1 1 1 2 1 3 1 4
8
01 5 25 35 45 5 5
Mid-span moment: x 1000 kN-m
;
Fig. 24. Movement o fducts

PRECASTSEGMENTAL BOXGIRDER BRIDGE-
6-
5-
3 44- q +
EEii
74 3-v2
2-
l-
0. I I
15 2 5 3 5 4 5 5 5
Mid-span moment: x 1000 kN-m
Service load behavior eters, such as the deviation angle and thefriction coefficient between duct and deviator.It can be seen that only tendon T5 slips underthe service load. It is considered that checkingfor tendon slip is not necessary in the design.
47. The behaviour of the dry joint segmen-tal deck with external tendons in the serviceload range is elastic. It is, however, differentfrom an internally prestressed structurebecause of strain redistribution along the freelength of the tendon. The normal stress andstrain relationshio between concrete and tendondoes not apply if the tendons slip. However, confirmed by the test results that the bottomslippage is normally neglected in design calcu- fibre stress at the design service load is 6lation. Slippage is a function of many param- N/mm’. Although there may be further losses,
48. The design code’ requires that longitu-dinal stresses in the precompressed tensile zoneshould not be less than 1.4 N/mm’. This can be
Shear keyline
Y Top s lab t h i ckness
Joint opening (24 mm approx. )
Fig. 26. Movement ofducts (T6L) againstmid-span moment
313
.
Fig. 27. Cracks inweb of segments 8and 9 on fifth day(eye view)
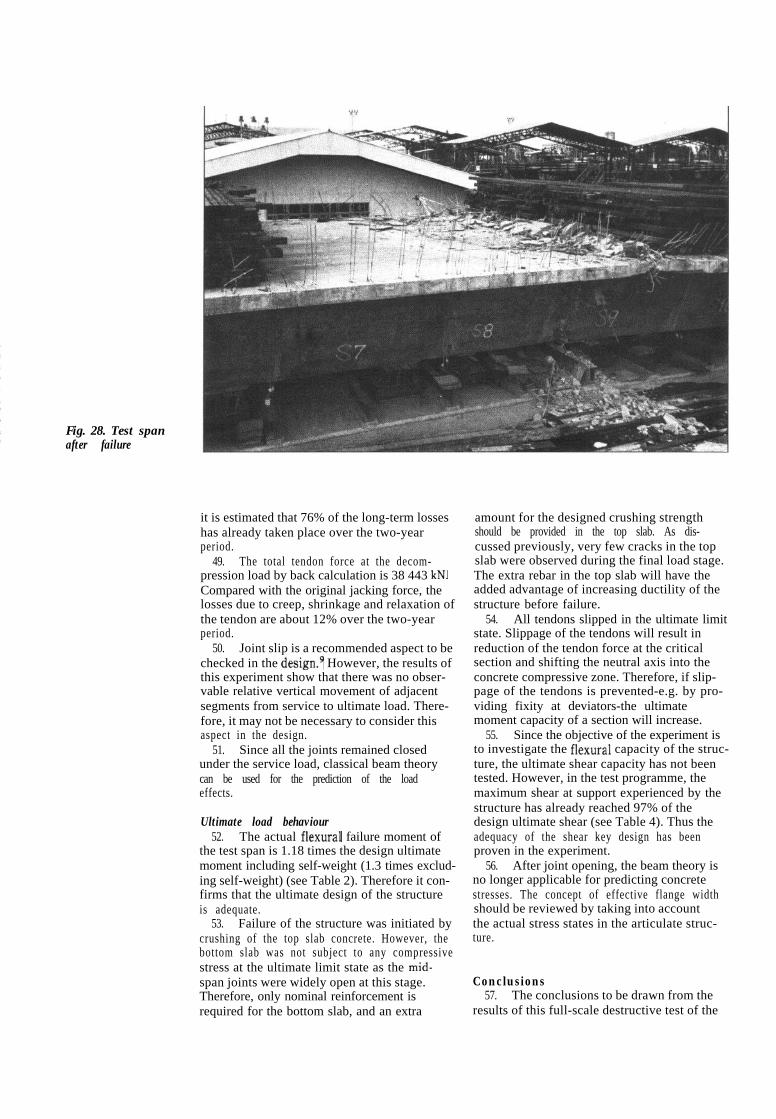
Fig. 28. Test spanafter failure
it is estimated that 76% of the long-term losseshas already taken place over the two-yearperiod.
49. The total tendon force at the decom-pression load by back calculation is 38 443 kN.Compared with the original jacking force, thelosses due to creep, shrinkage and relaxation ofthe tendon are about 12% over the two-yearperiod.
50. Joint slip is a recommended aspect to bechecked in the design.g However, the results ofthis experiment show that there was no obser-vable relative vertical movement of adjacentsegments from service to ultimate load. There-fore, it may not be necessary to consider thisaspect in the design.
51. Since all the joints remained closedunder the service load, classical beam theorycan be used for the prediction of the loadeffects.
Ultimate load behaviour52. The actual flexural failure moment of
the test span is 1.18 times the design ultimatemoment including self-weight (1.3 times exclud-ing self-weight) (see Table 2). Therefore it con-firms that the ultimate design of the structureis adequate.
53. Failure of the structure was initiated bycrushing of the top slab concrete. However, thebottom slab was not subject to any compressivestress at the ultimate limit state as the mid-span joints were widely open at this stage.Therefore, only nominal reinforcement isrequired for the bottom slab, and an extra
amount for the designed crushing strengthshould be provided in the top slab. As dis-cussed previously, very few cracks in the topslab were observed during the final load stage.The extra rebar in the top slab will have theadded advantage of increasing ductility of thestructure before failure.
54. All tendons slipped in the ultimate limitstate. Slippage of the tendons will result inreduction of the tendon force at the criticalsection and shifting the neutral axis into theconcrete compressive zone. Therefore, if slip-page of the tendons is prevented-e.g. by pro-viding fixity at deviators-the ultimatemoment capacity of a section will increase.
55. Since the objective of the experiment isto investigate the flexural capacity of the struc-ture, the ultimate shear capacity has not beentested. However, in the test programme, themaximum shear at support experienced by thestructure has already reached 97% of thedesign ultimate shear (see Table 4). Thus theadequacy of the shear key design has beenproven in the experiment.
56. After joint opening, the beam theory isno longer applicable for predicting concretestresses. The concept of effective flange widthshould be reviewed by taking into accountthe actual stress states in the articulate struc-ture.
Conclusions57. The conclusions to be drawn from the
results of this full-scale destructive test of the
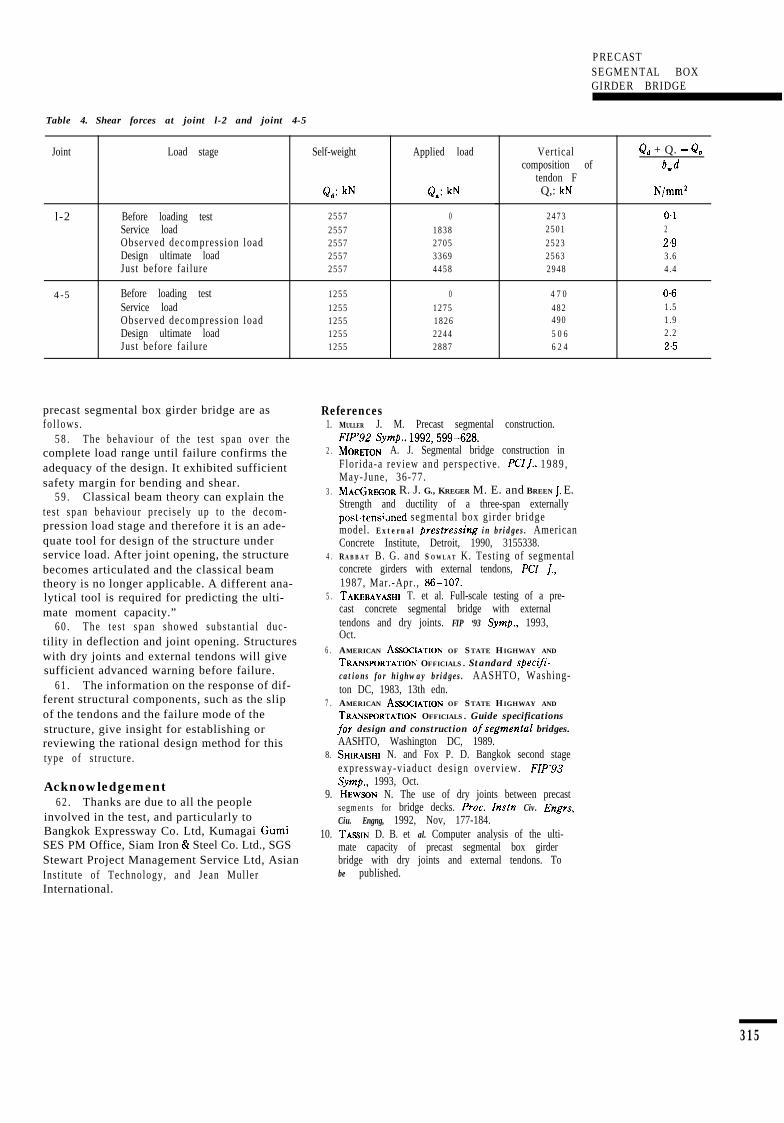
Qd: kN Q.: kN
2557 02557 18382557 27052557 33692557 4458
Verticalcomposition of
tendon FQ,: kN
Q,, + Q. - 9,bwd
N/mm*
2473 0.12501 22523 2.92563 3.62948 4.4
Before loading test 1255 0 4 7 0 0.6Service load 1255 1275 482 1.5Observed decompress ion load 1255 1826 490 1.9Design ultimate load 1255 2244 5 0 6 2.2Just before failure 1255 2887 6 2 4 2.5
precast segmental box girder bridge are asfo l lows .
5 8 . The behaviour of the tes t span over thecomplete load range until failure confirms theadequacy of the design. It exhibited sufficientsafety margin for bending and shear.
5 9 . Classical beam theory can explain thetes t span behaviour precise ly up to the decom-pression load stage and therefore it is an ade-quate tool for design of the structure underservice load. After joint opening, the structurebecomes articulated and the classical beamtheory is no longer applicable. A different ana-lytical tool is required for predicting the ulti-mate moment capacity.”
6 0 . The tes t span showed subs tan t ia l duc-tility in deflection and joint opening. Structureswith dry joints and external tendons will givesufficient advanced warning before failure.
6 1 . The information on the response of dif-ferent structural components, such as the slipof the tendons and the failure mode of thestructure, give insight for establishing orreviewing the rational design method for thistype of s t ructure .
Acknowledgement6 2 . Thanks are due to all the people
involved in the test, and particularly toBangkok Expressway Co. Ltd, Kumagai GumiSES PM Office, Siam Iron & Steel Co. Ltd., SGSStewart Project Management Service Ltd, AsianInst i tu te of Technology, and Jean MullerInternational.
References1.
2 .
3 .
4 .
5 .
6 .
7 .
MULLER J. M. Precast segmental construction.FIP’92 Symp., 1992,599-628.MORETON A. J. Segmental bridge construction inFlor ida-a review and perspect ive . PCIJ., 1 9 8 9 ,May-June, 36-77.MACGREC~R R. J. G., KREGER M. E. and BREEN J. E.Strength and ductility of a three-span externallypost-tensi.med segmental box girder br idgemodel. External prestressing in bridges . AmericanConcrete Institute, Detroit, 1990, 3155338.RA B B A T B. G. and S O W L A T K. Testing of segmentalconcrete girders with external tendons, PCZ J.,1987, Mar.-Apr. , 86-107.TAKEBAYASHI T. et al. Full-scale testing of a pre-cast concrete segmental bridge with externaltendons and dry joints. FIP ‘93 Symp., 1993,Oct.AMERICAN ASVXIATION OF STATE HIGHWAY AND
TRANSFQRTATION OFFICIALS. Standard speciji-cations for highway bridges . AASHTO, Washing-ton DC, 1983, 13th edn.AMERICAN ASWXATION OF STATE HIGHWAY AND
TRANSWRTATION OFFICIALS. Guide specificationsfor design and construction ofsegmental bridges.AASHTO, Washington DC, 1989.
8. SHIRAISHI N. and Fox P. D. Bangkok second stageexpressway-viaduct des ign overview. FIP’93symp., 1993, Oct.
9. HEW~N N. The use of dry joints between precastsegments for bridge decks. P7oc. Instn Civ. Engrs,Ciu. Engng, 1992, Nov, 177-184.
10. TASSIN D. B. et al. Computer analysis of the ulti-mate capacity of precast segmental box girderbridge with dry joints and external tendons. Tobe published.
315
1
PRECASTSEGMENTAL BOXGIRDER BRIDGE
Table 4. Shear forces at joint l-2 and joint 4-5
Joint Load stage
l-2
4-5
Before loading testService loadObserved decompress ion loadDesign ultimate loadJust before failure
Self-weight Applied load