Embed Size (px)
Citation preview

Africa Automotive InsightsAn East African consumer perspective2018

01
Foreword
Due to lesser purchasing power, the absence of suitable vehicle finance options and fierce competition from lesser cost imported second-hand vehicles, the potential African automotive consumer market is yet to be realised. In addition to these well-known market challenges, the lack of dedicated research into consumer trends and insights also restrict the understanding of Africa’s emerging automotive market.
In order to remedy this lack of market information and insight, Deloitte has undertaken in-market research that seeks to gather consumer insights in the East Africa’s emerging automotive consumer market.
On-the-ground research was carried out in Kenya, Tanzania and Uganda, based on which the Deloitte team has produced a dedicated Africa Automotive Insights report, a part of a broader series of global automotive consumer reports.
The report draws insights from surveys conducted among middle-income consumers in leading cities in Kenya, Tanzania and Uganda. These countries were chosen to provide a representative regional overview of East Africa. Our insights shed light on various aspects of the overall costumer journey that includes marketing, financing, purchasing and owning of vehicles in these countries.
The insights provide a starting block for industry players to understand better what factors influence consumers, what their preferences are and what their attitudes are towards the concept of mobility. Ultimately, our Automotive Insights report aims to inform our clients as to the opportunities arising in the realm of mobility in the East African region where roughly 2.3 million vehicles are currently in use.
Dr Martyn DaviesAfrica Automotive LeaderDeloitte Africa
Traffic jams have become a familiar feature of most African cities, yet many emerging consumers in Africa aspire to own and drive their own car.

KenyaA consumer perspective

03
Kenya: Country overview
Key economic data
With a GDP of US$86bn in 2018, Kenya is the fifth largest economy in sub-Saharan Africa (SSA) and the second largest in East Africa (after Ethiopia). Kenya has had an average GDP growth rate of 5.8% since 2010, with economic growth expected to reach 5.5% in 2018, up from 5% in 2017 and higher than the SSA average of 3.4%. Kenya is the highest income economy in East Africa with GDP per capita of US$1,790 in 2018 ($3,657 in PPP).
Key demographic data
Kenya has a total population of approximately 48 million people. In terms of gender, the population is relatively equally split, with 50.3% female and 49.7% male. Almost 70% of Kenyans are under the age of 30. Approximately 5 million people (10.4% of population) are between the ages of 15 and 19, representing a sizable group of potential future vehicle owners.
Key urbanisation data
Approximately a quarter of Kenyans live in urban areas. This is lower than the SSA
urban population average of 38.8%. Nairobi is East Africa’s second largest city and is home to a third of Kenya’s total urban population. The city is expected to attract an average of 170,000 new urban dwellers each year between 2010 and 2020. By 2050, approximately 46% of Kenyans will be living in urban areas.
Motorisation data
Kenya’s motorisation rate of 30 vehicles per 1,000 inhabitants is lower than the SSA average of 42 but is the highest in East Africa. Approximately 10,600 new vehicles were registered in 2016, also the highest in East Africa.
GDP: US$86bn
Population: 48 million
Average GDP growth rate of 5.8% since 2010
GDP per capita: US$1,790
Demographics50.3% female49.7% male
Motorisation rate: 30 vehicles per 1,000 inhabitants
Urban population: 26% of total population
Urban population in 2050: 46% of total population
Youth: 70% of population under the age of 30
Source: International Monetary Fund, 2017; UN Habitat, 2017; UN Habitat, 2014; OICA, 2017; World Bank, 2017; UN DESA, 2017
Africa Automotive Insights | Kenya

04
Africa Automotive Insights | Kenya
Kenya survey sample overview
Gender Age Employment status
Vehicle ownership
Ownership history
Kind of vehicle Type of vehicle Vehicle use Duration of ownership
Fem
ale
Mal
e
Und
er 3
0
Ove
r 30
Sala
ried
empl
oyee
Self
empl
oyed
Vehi
cle
owne
r
Non
-veh
icle
ow
ner
Firs
t-tim
e ow
ner
Non
-firs
t-tim
e ow
ner
New
*
Use
d
Pass
enge
r veh
icle
Mot
orbi
ke
Ligh
t com
mer
cial
veh
icle
Mul
tiple
veh
icle
s
Pers
onal
Busi
ness
Less
than
1 y
ear
2-3
year
s
4-5
year
s
6-8
year
s
Mor
e th
an 8
yea
rs
44% 56% 45% 55% 38% 62% 49% 51% 35% 65% 59% 41% 41% 14% 44% 1% 63% 37% 23% 63% 12% 2% 1%
In the survey, consumers were asked questions to gain insights into the customer journey that includes purchasing and owning a vehicle, marketing, finance & sales, and aftersales & service. Future vehicle ownership was also discussed.
Sample size: 404 respondentsDate of data collection: 28 September – 14 October 2017Place of data collection: Nairobi & Mombasa (middle-income neighbourhoods)Data collected by: Infomineo
Overall sample (n=404) Vehicle owners (n=198)
* The higher-than-expected weighting of new vehicles as a share of overall vehicles is the result of the concentration of middle-class respondents in the sample

Marketing
Vehicle owners in Kenya regard fuel efficiency as the most important purchasing criterion, and vehicle purchasing decisions are most influenced by family and friends…
05

06
What is important to you when deciding which vehicle to buy?
Fuel efficiency is the most important criterion for Kenyan vehicle owners irrespective of gender, age, ownership history and kind of vehicle…
Fuel efficiency followed by safety are key factors influencing the purchasing decision of vehicles in Kenya. In addition, Kenyan consumers are cost-sensitive, as factors such as value for money and vehicle price feature among the top priorities.
The importance of price is reflected in the concentration of vehicles bought at the lower end of the price spectrum(below KSh1m – approx. US$10,000).
In general, non-first time owners are more price-sensitive than first-time owners.
Women, new vehicle owners and ownersof vehicles in higher price brackets (above KSh1m – above approx. US$10,000) are the ones most concerned about the safety of their vehicle.
Re-sale value is the least important factor driving the purchasing decision, indicating
that vehicles are not purchased with the intention of selling them again at a later date. This is most pronounced among women and owners who do not use their vehicles primarily for business.
Safety
17%
1
Fuelefficiency
29%
Value formoney
13%
Consumer preferences
Africa Automotive Insights | Marketing
23

07
Consumer preferences*
* Respondents were asked to rank criteria based on importance when making the purchasing decision.
Rank Overall
Gender Age Ownership history Kind of vehicle
Female Male Under 30 Over 30 First-timeowner
Non-first-timeowner New Used
1Fuel
efficiencyFuel
efficiencyFuel
efficiencyFuel
efficiencyFuel
efficiencyFuel
efficiencyFuel
efficiencyFuel
efficiencyFuel
efficiency
2 Safety Safety Reliability SafetyValue formoney
Safety Price Safety Status
3Price & Value
for moneyPrice
Safety &Value for money
Reliability SafetyValue for
money & Price & Status
Value formoney & Status
Value formoney
Price
4 ReliabilityValue formoney
Price Status Price Reliability Reliability PriceValue formoney &Reliability
5 Status StatusSpace/size &
StatusPrice Reliability Space/size Safety Reliability Space/size
6 Space/size Reliability Re-sale value Space/size Status Re-sale valueRe-sale value& Space/size
Status Re-sale value
7 Re-sale valueSpace/size &Re-sale value
Value formoney & Re-sale
valueSpace/size Space/size Safety
8 Re-sale value Re-sale value
High Moderate LowDegree of importance:
Africa Automotive Insights | Marketing

08
What influences you when deciding which vehicle to buy?
Family and friends have the greatest influence on vehicle buyers…
In Kenya, family and friends have the greatest influence on the purchasing decision.
More than half of Kenyan vehicle owners have turned to family and friends for advice on which vehicle to purchase.
Country brand dominance playsthe second most important role for this decision.
Together family and friends, and brand dominance influence about three-quarters of vehicle owners’ purchasing decision.
Kenyan vehicle owners are little swayed by any form of advertising. This holds true irrespective of age, gender, vehicle price and history of ownership or whether a vehicle is purchased new or used.
Influencers by type of vehicle
Rank Overall Passenger vehicle Motorbikes Light commercial vehicles
1 Family/friendsCountry brand dominance &
Family/friendsFamily/friends Family/friends
2Country brand
dominanceSalespeople
Country brand
dominanceSalespeople
3 Salespeople Advertising Salespeople Advertising
4 Advertising AdvertisingCountry brand
dominance
Country brand dominance
21%
Family andfriends
53%
Salespeople
18%
3
1
2
Africa Automotive Insights | Marketing

Finance & salesThe majority of Kenyan consumers paid less than KSh1m in cash for their vehicles and bought them at a dealership or trader…
09

10
Where did you buy your vehicle?
Dealerships or traders are the most important saleschannel irrespective of consumer characteristics…
The vast majority of vehicles were bought from dealerships or traders - grouped together for this analysis as Kenyan consumers do not always distinguish between certified dealerships and non-certified traders.
New vehicles accounted for close to 60% of overall vehicle sales.
Despite Keyans being regarded as leaders in e-commerce and mobile technology adoption in Africa, only a small sample bought their vehicles online. Light commercial vehicles account for the majority of vehicles bought online.
As expected, almost all new vehicles, which account for 60% of purchases, were bought at a dealership or trader while family and friends are an important channel for purchases of used vehicles.
Dealerships or traders were also the preferred sales channel for more expensive vehicles (more than KSh1m – above approx. US$10,000).
Compared to passenger and light commercial vehicles, a greater share of motorbikes are purchased from family and friends.
Sales channel by category All sales
80%Dealership/
trader
17%
3%Online
Family/friends
Kind of vehicle Type of vehicle Price
New Used Passenger vehicle
Motorbike Lightcommercial
vehicle
Less thanKSh1m
More thanKSh1m
4%3%
93%
2%37%
61%
1%19%
80%
31%
69%
6%12%
83%
3%24%
73%
3%10%
86%
OnlineDealership/Trader Family/Friends
Note: May not sum to 100% due to rounding.
Africa Automotive Insights | Finance & sales
11
How did you pay for your vehicle?
Due to a lack of suitable financial products, the majority of vehicle owners used cash or savings to purchase their vehicles…
Cash and savings were the major source of vehicle finance, accounting for close to two-thirds of all purchases. The second most important source at just below one-third were loans from banks. This reflects the lack of financial products for vehicles in the market.
This pattern was evident irrespective of price, sales channel or whether the owners were first-time or non-first-time buyers.
Interestingly, buyers of used vehicles were more likely to access vehicle finance from banks compared to buyers of new vehicles.
Finance channel by category All sales
Only one-quarter of new vehicles were financed through bank loans.
Unsurprisingly, people in salaried employment were more likely to access vehicle finance options from banks.
63%Cash/savings
29%Loan from
bank
4%N/A
4%Loan from family/friends
5%2%
25%
68%
2%6%
35%
56%
3%3%
26%
68%
5%4%
36%
54%New Used Self employed
Employment statusKind of vehicle
N/ACash/savings Loan from bank Loan from family/friends
Salaried employed
Note: May not sum to 100% due to rounding.N/A refers to vehicles received as gifts or are company-owned.
Africa Automotive Insights | Finance & sales

12
How much did you pay for your vehicle?
Most Kenyan vehicle owners paid less than KSh1m for their vehicle…
About half of all vehicles purchased fell into the lowest price bracket (less than KSh1m – below approx. US$10,000).
Unsurprisingly, the concentration in the lowest price bracket is more pronounced for used vehicles than for new vehicles. In the two highest price brackets (KSh2m-KSh2.5m and over Ksh2.5m) the share of new and used vehicles was equal. First-time buyers were more likely to buy cheaper vehicles compared to consumers that had bought vehicles in the past.
The majority of passenger vehicles were bought for less than KSh1m (approx. US$10,000). This is in particular skewed towards used passenger vehicles, as close to 90% of these fell into this bracket. New passenger vehicles were more likely to fall into higher price brackets.
Light commercial vehicles were more evenly distributed between price brackets.The greatest share of light commercial vehicles were found in the KSh1m-KSh1.5m (approx. US$10,000-US$15,000) bracket of
which the greatest share were new vehicles.
In contrast to passenger vehicles, where higher price brackets were likely to include more new vehicles, used light commercial vehicles are more prevelant at the higher end of the price spectrum.
Vehicles by price range
All vehicles
Note: Three-quarters of Kenyan consumers have owned their vehicles for more than two years. Taking the sharp depreciation of the Kenyan shilling during the last two years into account the dollar value of vehicles has fallen by more than 10%.Note: May not sum to 100% due to rounding.
Less than KSh1m
KSh1m-KSh1.5m
KSh1.5m-KSh2m
KSh2m-KSh2.5m
More than KSh2.5m
50%
37%
67%
25%
36%
11% 13% 15%10% 7% 7% 7% 5% 5% 5%
UsedAll vehicles New
Africa Automotive Insights | Finance & sales

13
Light commercial vehicles
Passenger vehicles
Less than KSh1m
KSh1m-KSh1.5m
KSh1.5m-KSh2m
KSh2m-KSh2.5m
More than KSh2.5m
30%
19%
33%
5%
15%
25%
5% 6%10%
3% 1% 3%
58%
87%
All passenger vehicles UsedNew
30%25%
38% 37%
48%
21%
13% 12%15%
9%6%
15%10% 10%
12%
Less than KSh1m
KSh1m-KSh1.5m
KSh1.5m-KSh2m
KSh2m-KSh2.5m
More than KSh2.5m
All light commercial vehicles UsedNew
0%
Africa Automotive Insights | Finance & sales

A change in income is likely to trigger a switch in brand…
14

15
What would convince you to change your current vehicle brand?
A change in income would be the key reason to switch brands...
A change in income is the key reason to switch vehicle brands irrespective of age, gender, history of ownership, type or kind of vehicle or price. However, vehicle owners tend to be brand loyal within their current affordability range.
A lower cost of maintenance is the second most influential factor which would trigger a change in brand by vehicle owners.
While fuel efficiency was one of the most important factors when choosing which vehicle to buy, only a quarter of current owners would change to adifferent brand because it offersbetter fuel efficiency.
For owners of passenger vehicles or first-time owners, a change in income is not as decisive a factor for changing brands as it
is for light commercial vehicle owners or consumers under the age of 30.
Note Responses do not add up to 100% as multiple answers were allowed
Reasons for changing brand
Change in income
Lower cost of maintenance
Greater availability/affordability of finance
Fuel efficiency of competing brands
Lower cost of competing vehicle
Other
63%
42%
27%
27%
23%
6%
Africa Automotive Insights | Finance & sales

Aftersales & service
Kenyans regularly service their vehicles using jua kali mechanics…
16

17
The majority of vehicle owners service their vehicles regularly. The most preferred service providers are jua kali (informal/open-air) mechanics. Only about one-quarter of vehicle owners take their vehicles to authorised dealerships, which might be the reason why there is an assumption that there is a poor servicing culture in Kenya.
When and where do you service your vehicle?Most vehicles are serviced regularly, but often by jua kali mechanics…
Compared to their male counterparts, women are less likely to opt for jua kali mechanics but rather service their vehicles in the formal sector (authorised dealerships or petrol stations).
First-time as well as used vehicle owners are more likely to have their vehicles serviced by jua kali mechanics. This
preference is most pronounced among vehicle owners that purchased their vehicles from family or friends or own motorbikes.
Unsurprisingly, owners of more expensive vehicles (more than KSh1m, or above US$10,000) are least likely to have their vehicles serviced in the informal sector.
Frequency of service
83%As per
recommended service intervals
6%Once a year
1%I have never serviced my vehicle
1%Every two years
9%When vehicle breaks down
Place of service
47%Jua kali
mechanic
23%Petrol station
26%Authorised dealership
1%N/A
1%Family/friends
2%Service vehicle myself
N/A refers to owners that have not reached their service interval yet
Africa Automotive Insights | Aftersales & service

18
Service channels
29%
31%
41%
25%
17%
58%
33%
25%
45%
18%
22%
61%
25%
19%
56%
34%
36%
32% 92%
8%
18%
24%
58%
36%
23%
41%
31%
24%
45%
6%
16%
77%
Gender Price
Female Male New Used Passenger vehicle
Light commercial
vehicle
Motorbike Less than KSh1m
More than KSh1m
Dealership/trader
Family/friends
Kind of vehicle Type of vehicle Sales Channel
Authorised dealership Petrol stationJua kali mechanic
Africa Automotive Insights | Aftersales & service

Future customer view
Looking ahead, the majority of Kenyans will likely purchase a passenger vehicle, in cash; and become more status-oriented...
19

20
When and where will you buy your next vehicle in the future?
Almost two-thirds of consumers plan to buy a vehicle within the next five years and will likely make the purchase at a dealership or trader…
Nearly half of Kenyan consumers plan to buy a vehicle in the next two years.
Those who do not currently own a vehicle are more confident than current vehicle owners that they will buy a vehicle within the next five years. More than a quarter of non-vehicle owners are planning to purchase a vehicle within the next year.
Close to one-third of consumers do not plan to purchase a vehicle in the future, either as they will likely not be able to afford a vehicle or do not think that they will need a vehicle in the future.
The largest share of consumers will purchase a vehicle from a dealership or trader. This channel will likely account for
more than two-thirds of future purchases and will remain the dominant sales channel going forward.
Sales channel
Online
68%Dealership/
trader
7%
Family/friends
14%
11%
Import directly
Time horizon
In the next year In the next 2 years 3-5 years More than 5 years
21%
15%
27%25%
30%
20%16% 15%
7%5%
9%
16%
31%35%
28%
I won’t need or be able to afford
vehicle
Do not plan topurchase a vehicle
Plan to purchase a vehicle
Current vehicle owners Non-vehicle ownersOverall
Africa Automotive Insights | Future customer view

21
Fuel efficiency is likely to remain the most important criterion for future vehicle purchases…
For future purchases fuel efficiency will likely remain the most important factor when deciding which vehicle to buy.
Status and reliability, which were not regarded as important preferences in the past, will likely rank among the most important factors for vehicles purchases in the future.
Factors are related to affordability will likely decrease in importance. This is especially evident for value for money which dropped from being a criteria of high importance to a criteria of low importance.
Prospective vehicle owners will likely be more concerned about reliability than current owners.
What will be important to you when deciding which vehicle to buy in the future?
Future consumer preferences*
Status20%
Fuelefficiency22% Reliability
19%
* Respondents were asked to rank criteria based on importance when making the purchasing decision.
Rank Overall Current vehicle owners Non-vehicle owners
1 Fuel efficiency Fuel efficiency Reliability
2 Status Status Fuel efficiency & Status
3 Reliability Reliability Safety
4 Safety Safety Value for money
5 Space/size Re-sale value Space/size
6 Re-sale value Space/size Re-sale value
7 Value for money Value for money
High Moderate LowDegree of importance:
12 3
Africa Automotive Insights | Future customer view

22
What will influence you when deciding which vehicle to buy in the future?
While family and friends are likely to remain the main source of advice, trust in the advice from salespeople is likely to increase…
Future purchases are likely to be most strongly influenced by family and friends. This indicates that Kenyan consumers are more likely to trust the advice of those with whom they have a close personal relationship.
Family and friends are likely to play an even more important influencing role for people that currently do not own a vehicle.
Salespeople22%
Family/friends68%
Advertising / online11%
3
Current owners will probably trust the advice from salespeople more for their future vehicle purchases. Hence the trust in the advice from sale people will likely guide a larger share of future vehicle purchases.
Advertising and online platforms are likely to remain limited influencers going forward. This suggests that these media are underleveraged.
Influencers
Africa Automotive Insights | Future customer view
1
23

23
What vehicle will you buy and how will you finance it in the future?
Financing outlook Vehicle type outlook
Kenya’s vehicle market is likely to remain cash-dominated and skewed towards passenger vehicles in the near term…
Cash and savings will likely remain the most important means to pay for vehicles, and current vehicle owners will be less likely to finance vehicles through banks.
In contrast, non-vehicle owners will be more likely to access finance througheither banks or family and friends.
New vehicles will likely remain the preferred choice of Kenyan consumers, especially among current vehicle owners.
Commercial vehicles will likely gain popularity among current vehicle owners. This might indicate that future purchases will be additional vehicles and not
necessarily replacement vehicles and are likely to be used for business purposes.
Non-vehicle owners will be more likely to purchase passenger vehicles for personal use. This indicates that the vehicles are likely to be used to meet personal mobility needs.
Overall Current vehicle owners
Loan from bank
Loan from family/friends
Savings/cash
34%
6%
61%
28%
72%
Overall Current vehicle owners
Non-vehicle owners
Passenger vehicle
Motorbike Commercial vehicle
52%
10%
38%
42%
10%
48%
60%
11%
30%
Non-vehicle owners
39%
11%
51%
Africa Automotive Insights | Future customer view

24
Why do you think you will not buy a vehicle in the future?
Close to one-third of consumers may not need or may not be able to afford a vehicle in the future…
While about 70% of Kenyans intend to purchase a vehicle, 15% say they will not be able to afford a vehicle, while the remaining 15% do not believe that they will need one in the future.
Within this group of “future non-buyers”, 58% of current owners do not think that they will need a vehicle, while 60% of non-
vehicle owners see affordability as the key obstacle to buying a vehicle in the future.
While global trends suggest that younger consumers will be less likely to see the need for owning a vehicle in the future,in Kenya, consumers over 30 are less likely to see the need for owning a vehicle going forward.
Ownership characteristics of those not planning to purchase a vehicle
61%
39%51% 49%
42%
58%
Overall “future non-buyers”
Current vehicle owners
Under 30 Over 30Non-vehicle owners
I will not be able to afford a vehicle I don’t think I will need a vehicle
57%
43% 45%55%
All consumers
70%Plan to purchase a vehicle
I don’t thinkI will need a vehicle
15%
I will not be able to afford a vehicle
15%
Africa Automotive Insights | Future customer view

Mobility
Most Kenyans use multiple modes of transport which are often overcrowded. Kenyans have a love-hate relationship with matatus…
25

26
What modes of transport do you use daily and what do you think about them?
Multi-modal transport is very common in Kenya with matatus being the most common mode of motorised transport…
Kenyans make use of a variety of transport options for their daily commute.
Multi-modal transport is very common in Kenya. Two-thirds of commuters use more than one form of transport on a daily basis.
For multi-modal commuters, it is most common to use three forms of transport.
While two-thirds of commuters use only ride-sharing services for their motorised trips, just under 15% use only motorised individual forms of transport.
Just over 70% of all commuters use matatus (mini-bus taxis) as part of their daily commute.
The attitude towards matatus is very polarised. A large share of commuters see them as highly unsatisfactory while an almost equal share sees them as one of the most satisfactory modes of transport.Although regarded as the most satisfactory mode of transport, only one-third of commuters use private vehicles daily. Nearly half of vehicle owners do not make use of their own vehicles when commuting.
The majority of Kenyan commuters spend less than KSh300 per day (approx. less than US$3) on their commute. Non-vehicle owners are more likely to spend between KSh300-KSh500 per day (approx. US$3-US$5) compared to vehicle owners.
Almost of half of commuters complain about overcrowding of ride-sharing. Lack of safety and cleanliness also ranked high on commuters’ lists of concerns. Commuters are less concerned about access to transport and the lack of route information.
Africa Automotive Insights | Mobility

27
*Responses do not add up to 100% as multiple answers were allowed**Ride-sharing is defined as vehicle-sharing services, through which consumers hail a vehicle via phone/app/side of the road.
Most common mode of transport*
Matatu
Boda boda
Walking
Private vehicle
Taxi
Bus
71%
39%
37%
33%
31%
25%
7%Bicycle
Multi-modal transport
33%
1 mode 2 modes 3 modes More than3 modes
21%
27%
20%
All motorised transport** Motorised transport**
Most satisfactory: Least satisfactory:
Boda bodaPrivate vehicle
67%Ride-sharing
14%Individual transport
19%Both individual transport and ride-sharing
Africa Automotive Insights | Mobility

28
Criticisms of ride-sharing*
Overcrowding
Lack of safety
Lack of cleanliness
Fares are too expensive
Commute takes too long
Unreliable
Too many transfers
Poor access to transport
Lack of information on routes
49%
39%
36%
32%
32%
28%
27%
24%
20%
Commuter spend per day
Less than KSh300 KSh300-KSh500 More than KSh500
66%
Overall Non-vehicle ownersVehicle owners
69%63%
28%23%
33%
6% 8%4%
Africa Automotive Insights | Mobility

Key insights for Kenya
29

30
The customer journey in Kenya
Africa Automotive Insights | Key insights & implications
Customer Journey
Marketing Finance & sales
Aftersales & service
1 in 3 buyers
regard fuel efficiency as the top
priority
1 in 2 buyers turn to
family or friends for
advice
4 in 5 vehicles
are bought from deal-erships or
traders
1 in 3 buyers access
bank loans to pay
for their vehicles
1 in 2 vehicles
are serviced
by jua kali mechanics
2 in 3 owners would switch brand if their income
changed
1 in 2consumers
plan to buy a
vehicle in the next 2 years
Fuelefficiency
may remainthe toppriority
for futurepurchases
2 in 3buyers
will likely turn to family
and friends
for advice
2 in 3vehicles will likely
bebought
fromdealershipsor traders
1 in 3consumers
will likely not
purchasea vehicle inthe futureIn
sigh
ts
1 in 2future
sales will likely be
passengervehicles
Vehicle typePreferencesPreferences Guidance Sales channel Finance Maintenance Brand loyalty Time horizon Guidance Sales channel No purchase
Future customer view

TanzaniaA consumer perspective

32
Tanzania: Country overview
Key economic data
With a GDP of US$57 bn in 2018, Tanzania is the sixth largest economy in SSA and the third largest in East Africa (after Ethiopia and Kenya). Tanzania has seen impressive GDP growth rates of over 5% since 2010, with economic growth expected to reach 6.8% in 2018, up from 6.5% in 2017; and DOUBLE than the SSA average of 3.4%. Tanzania is the second highest income economy in East Africa with GDP per capita of US$1,118 in 2018 ($3,504 in PPP).
Key demographic data
Tanzania has a total population of approximately 51 million people, the second largest population in East Africa after Ethiopia. In terms of gender, the population is relatively equally split, with 50.6% female and 49.4% male. Almost 72% of Tanzanians are under the age of 30. Approximately 6 million people (10.4% of the population) are between the ages of 15 and 19, representing a sizable group of potential future vehicle owners.
Key urbanisation data
A third of Tanzanians live in urban areas. This is lower than the SSA urban population average of 38.8%. Dar es Salaam is East Africa’s largest city and is expected to grow by an average of 226,000 people each year between 2010 and 2020. The city is home to 30% of Tanzania’s urban population. By 2050, approximately half of all Tanzanians will be living in urban areas.
Motorisation data
Tanzania’s motorisation rate of 7 vehicles per 1,000 inhabitants is one of the lowest in the world. Approximately 4,500 new vehicles were registered in 2016.
Source: International Monetary Fund, 2017; UN Habitat 2017; UN Habitat, 2014; OICA, 2017; World Bank, 2017; UN DESA, 2017.
GDP: US$57bn
Population: 51 million
GDP growth rates of over 5% since 2010
GDP per capita: US$1,118
Demographics50.6% female49.4% male
Motorisation rate: 7 vehicles per 1,000 inhabitants
Urban population: 33% of total population
Urban population in 2050: 50% of total population
Youth: 72% of population under the age of 30
Africa Automotive Insights | Tanzania

33
Tanzania survey sample overview
In the survey, consumers were asked questions to gain insights into the customer journey that includes purchasing and owning a vehicle, marketing, finance & sales, and aftersales & service. Future vehicle ownership was also discussed.
Sample size: 405 respondentsDate of data collection: 02 October – 14 October 2017Place of data collection: Dar es Salaam & Mwanza (middle-income neighbourhoods)Data collected by: Infomineo
Gender Age Employment status
Vehicle ownership
Ownership history
Kind of vehicle Type of vehicle Vehicle use Duration of ownership
Fem
ale
Mal
e
Und
er 3
0
Ove
r 30
Sala
ried
empl
oyee
Self
empl
oyed
Oth
er (s
tude
nt, u
nem
ploy
ed,
hous
ewife
, ret
ired)
Vehi
cle
owne
r
Non
-veh
icle
ow
ner
Firs
t-tim
e ow
ner
Non
-firs
t-tim
e ow
ner
New
*
Use
d
Pass
enge
r veh
icle
Mot
orbi
ke
Ligh
t com
mer
cial
veh
icle
Mul
tiple
veh
icle
s
Pers
onal
Busi
ness
Less
than
1 y
ear
2-3
year
s
4-5
year
s
6-8
year
s
Mor
e th
an 8
yea
rs
41% 59% 55% 45% 35% 60% 5% 64% 36% 36% 64% 51% 49% 56% 22% 20% 2% 56% 44% 28% 49% 18% 3% 2%
Africa Automotive Insights | Tanzania
Overall sample (n=405) Vehicle owners (n=259)
* The higher-than-expected weighting of new vehicles as a share of overall vehicles is the result of the concentration of middle-class respondents in the sample
Marketing
Vehicle owners in Tanzania regard fuel efficiency as the most important purchasing criterion, and vehicle purchasing decisions are most influenced by family and friends…
34

35
What is important to you when deciding which vehicle to buy?
Fuel efficiency is the most important criterionfor Tanzanian vehicle owners irrespective of gender,age and kind of vehicle…
Fuel efficiency and price are key factors influencing the purchasing decision of vehicles in Tanzania.
The cost-sensitive nature of Tanzanian consumers is further reflected by the concentration of vehicles bought at the lower end of the price spectrum (below TSh11m - below approx. US$5,000). Owners of vehicles priced at more than TSh11m are only moderately concerned about price.
In general, non-first-time owners are less price-sensitive compared to first-time owners.
Re-sale value is the least important factor driving the purchasing decision. This might indicate that vehicles are not bought with the intention of selling them later.
Africa Automotive Insights | Marketing
Price
24%
Fuelefficiency
31%
Value formoney
16%1
23
Consumer preferences

36
Consumer preferences*
* Respondents were asked to rank criteria based on importance when making the purchasing decision.
High Moderate LowDegree of importance:
Rank Overall
Gender Age Ownership history Kind of vehicle
Female Male Under 30 Over 30 First-timeowner
Non-first-timeowner New Used
1Fuel
efficiencyFuel
efficiencyFuel
efficiencyFuel
efficiencyFuel
efficiencyPrice
Fuelefficiency
Fuelefficiency
Fuelefficiency
2 PriceValue formoney
Price Price PriceFuel
efficiencyValue formoney
Value formoney
Price
3Value
for moneyPrice
Value formoney
Value formoney
Value formoney
Value formoney
Price PriceValue formoney
4 Status Safety Status Status Status Status Status Safety Status
5 Safety Status Safety Safety Safety Space/size Safety Status Safety
6 Space/size Space/size Space/size Space/size Reliability Safety Reliability Space/size Space/size
7 Reliability Reliability Reliability Reliability Space/size Re-sale value Space/size Reliability Reliability
8 Re-sale value Re-sale value Re-sale value Re-sale value Re-sale value Reliability Re-sale value Re-sale value Re-sale value
Africa Automotive Insights | Marketing

37
What influences you when deciding which vehicle to buy?
Family and friends have the greatest influence on vehicle buyers…
In Tanzania, family and friends have the greatest influence on the purchasing decision.
Half of Tanzanian vehicle owners turned to family and friends for advice on which vehicle to purchase. Used vehicle owners are far more influenced by people they have a personal relationship with compared to owners of new vehicles.
Country brand dominance plays the second most important role in this decision.
Together family and friends, and brand dominance influenced close to 80% of vehicle owners.
Tanzanian vehicles owners are little swayed by any form of advertising.
Women and non-first-time owners are the least influenced by advertising.
Despite the fact that dealerships or traders are the most important sales channels, salespeople have the least influence over vehicle buyers.
Influencers by type of vehicle
Rank Overall Passenger vehicles Motorbikes Light commercial vehicles
1 Family/friends Family/friends Family/friends Family/friends
2Country brand
dominance
Country brand
dominance
Country brand
dominance
Country brand
dominance
3 AdvertisingSalespeople &
AdvertisingAdvertising Salespeople
4 Salespeople Salespeople Advertising
Country brand dominance
28%
Family andfriends
50%
Advertising
12%
1
23
Africa Automotive Insights | Marketing

Finance & salesThe majority of Tanzanianconsumers paid less than TSh11m in cash for their vehicles and bought them at a dealership or trader…
38

39
Where did you buy your vehicle?
Dealerships or traders are the most important sales channel…
The majority of vehicles were bought from a dealership or trader. However, more than one-third of vehicles were purchased from family and friends.
New vehicles accounted for just over half of overall vehicle sales.
As expected, most new vehicles were bought at a dealership or trader, whereas, family and friends were the most important channel for purchases of used vehicles.
Despite having a relatively low internet penetration rate compared to regional peers, a sizeable share of Tanzanians bought their vehicles online.
The online sales channel was popular among women, new vehicle owners and owners of passenger or privately-used vehicles.
The preference of the respective sales channels was largely independent of age.
Sales channel by category
All sales
52%Dealership/
trader
14%Online34%
Family/ friends
Kind of vehicle Type of vehicle
New Used First-time owner
Less than TSh11m
More than TSh11m
Passenger vehicle
Motorbike Light commercial
vehicle
Private Business
History of ownership Price Use
Family/friends OnlineDealership/trader
Non-first-time
owner
Female Male
Gender
17%
6%
77%
12%
63%
26%
16%
36%
47%
13%
33%
54%
9%35%
56%
17%
36%
47%
17%
29%
54%
5%38%
56%
12%
44%
44%
20%
33%
47%
7%35%
57%
21%
24%
55%
11%39%
50%
Africa Automotive Insights | Finance & sales

40
How did you pay for your vehicle?
Due to a lack of suitable financial products, the majority of vehicle owners used cash or savings to purchase their vehicle…
Cash and savings were the major source of vehicle finance, accounting for two-thirds of all purchases. The second most important source at about 16% was a bank loan, reflecting the lack of financial products for vehicles in the market.
The dominance of cash as a financing channel was evident irrespective of price,
sales channel, employment status, kind of vehicle or whether the owners were first-time or non-first-time buyers.
Unsurprisingly, more expensive vehicles were financed through a bank loan compared to vehicles of less than TSh11m (less than approx. US$5,000).
Finance channel by category All sales
Compared to consumers who had owned vehicles before, first-time owners were almost twice as likely to use a bank loan to finance their vehicle.
66%Cash/savings
Loan from family/friends
16%Loan from
bank
N/A11%
7%
New Used Salaried Self-employed Less than TSh11m
More than TSh11m
First-timeowner
Kind of vehicle Employment status History of ownershipPrice
6%
63%
14%
17%
11%5%
68%
10%
16%
66%
3%
13%
77%
7%
69%
8%
16% 16%8% 7%
6%
26%
61%
7%13%
22%
57%
7%
11%
13%
71%
6%
Savings/cash Loan from bank Loan from family/friends N/AN/A refers to vehicles received as gifts or are company-ownedNote: May not sum to 100% due to rounding. .
Non-first-time owner
Africa Automotive Insights | Finance & sales

41
How much did you pay for your vehicle?Most Tanzanian vehicle owners paid less than TSh11m for their vehicle…
More than half of all vehicles purchased fell into the lowest price bracket (less than TSh11m - less than approx. US$5,000).
Surprisingly, the concentration in the lowest price bracket was more pronounced for new vehicles. In the highest price bracket the split between new and used vehicles was the same.
The majority of passenger vehicles were bought for less than TSh11m. There is no major difference between new and used vehicles in this bracket. In the highest price bracket one is more likely to find new passenger vehicles.
Light commercial vehicles were most likely to be found within the lowest price
bracket. This was followed by the highest price bracket (more than TSh44m – more than US$20,000). The medium price ranges (TSh11m-TSh44m – approx. US$5,000-US$20,000) accounted for roughly one-quarter of light commercial vehicle purchases.
Vehicles by price range
All vehicles
Less thanTSh11m
TSh11m-TSh22m
TSh22m-TSh33m
TSh33m-TSh44m
More thanTSh44m
UsedAll vehicles New
56%59%
54%
13%11%
16%
4% 4% 5% 6% 7% 6%
19% 20% 20%
Note: May not sum to 100% due to rounding.
Africa Automotive Insights | Finance & sales

42
Passenger vehicles
Light commercial vehicles
Less thanTSh11m
TSh11m-TSh22m
TSh22m-TSh33m
TSh33m-TSh44m
More thanTSh44m
All light commercial vehicles UsedNew
Less thanTSh11m
TSh11m-TSh22m
TSh22m-TSh33m
TSh33m-TSh44m
More thanTSh44m
All passenger vehicles UsedNew
59%57%
60%
11% 11% 11%7%
5%9%
4% 5% 4%
19%22%
15%
54%
62%
51%
17%
8%
20%
2%
8% 8% 8% 9%
19%15%
20%
Africa Automotive Insights | Finance & sales
Note: May not sum to 100% due to rounding.
0%
A change in income is likely to trigger a switch in brand…
43

44
What would convince you to change your current vehicle brand?
A change in income would be the key reason to switch brands. New and light commercial vehicle owners seem to be the least brand loyal consumers...
A change in income is the key reason to switch vehicle brands. This holds true forall owners regardless of age, gender, history of ownership etc.
While fuel efficiency was one of the most important factors when choosing which vehicle to buy, fuel efficiency of a competing brand is only the third most
influential factor which would trigger a change in brand.
Owners of vehicles in the price bracket of more than TSh11m (above US$5,000) and consumers over the age of 30 areless likely to change brand due to achange in income.
Note: Responses do not add up to 100% as multiple answers were allowed
Reasons for changing brand
Change in income
Lower cost of competing vehicle
Fuel efficiency of competing brands
Greater availability/affordability of vehicle finance
Lower cost of maintance
60%
34%
29%
27%
23%
Africa Automotive Insights | Finance & sales

Aftersales & service
Tanzanians regularly service their vehicles by jua kali mechanics…
45

46
The majority of vehicle owners servicetheir vehicles regularly. The most preferred service providers are jua kali (informal/open-air) mechanics.
Less than 10% of owners take their vehicles to authorised dealerships. An almost equal share of owners service their vehicles themselves or have them serviced by family or friends.
When and where do you service your vehicle?Most vehicles are serviced regularly, but often by jua kali mechanics…
Compared to their male counterparts, women are less likely to opt for jua kali mechanics but rather service their vehicles in the formal sector (authorised dealerships or petrol stations).
First-time vehicle owners are more likely tohave their vehicles serviced by jua kalimechanics. There is little difference in the
preferred service channels among new and used vehicle owners.
Unsurprisingly, the more expensive a vehicle, the more likely it is to be serviced at an authorised dealership. Motorbikes are the least likely type of vehicle to be serviced in the formal sector.
Frequency of service Place of service
70%Jua kali
mechanic
Petrol station13%
Service vehicle myself7%
Authorised dealership8%
2%Family/friends
69%As per recommended
service intervals
19%Once a
year
When vehicle breaks down7%
5%Every two years
Africa Automotive Insights | Aftersales & service

47
Service channels
Africa Automotive Insights | Aftersales & service
2%
62%
Gender Sales channel
Female Male First-time owner
Non-first-time
owner
Dealership/trader
Family/friends
Online Passenger vehicle
Motorbike
History of ownership Type of vehicle
Light commercial
vehicle
Less than TSh11m
More than TSh11m
Price
Petrol station Authorised dealershipJua kali mechanic Service it myself Family/friends
2%11%23%
1%
75%
10%7%7%
6%
75%
4%14%
2%
67%
8%10%12%
1%
68%
8%10%13%
2%
73%
11%7%6%
6%
71%
24%2%
67%
6%8%
17%
12%
77%
7%4%
2%
75%
8%4%
12%
2%
70%
11%7%
10%
1%
70%
2%13%14%
Note: May not sum to 100% due to rounding.

Future customer view
Looking ahead, the majority of Tanzanians will likely purchase a passenger vehicle, in cash; with a better re-sale value...
48

49
When and where will you buy your next vehicle in the future?
Less than 40% of consumers plan to buy a vehicle in the next five years, but will likely continue to purchase vehicles from a dealership or trader…
Nearly half of Tanzanian consumers do not plan to buy a vehicle at all going forward, irrespective of whether they currently own a vehicle or not. Affordibility is the greatest constraint to future purchases.
Only a quarter of consumers plan to purchase a vehicle within the next two
years. Current owners are more likely to buy a vehicle in the next five years than non-vehicle owners.
The largest share of consumers will likely purchase a vehicle from a dealership or trader. This channel will likely account for close to two-thirds of future
purchases and may increase its dominance as the most important sales channel going forward.
The online sales channel is expected to increase in popularity, while purchases from family and friends may become less attractive.
Sales channel
16%Online
65%Dealership/
traderImport directly
Family/friends9%
10%
Time horizon
Current vehicle owners Non-vehicle ownersOverall
In the next year In the next 2 years 3-5 years More than 5 years
11% 10% 12% 14% 16%11% 12% 14%
9%14% 12%
18%
49% 48% 50%
I won’t need or be able to
afford vehicle
Do not plan topurchase a vehicle
Plan to purchase a vehicle
Africa Automotive Insights | Future customer view

50
Fuel efficiency is likely to remain the most important criterion for future vehicle purchases…
For future purchases fuel efficiency will likely remain the most important factor when deciding what vehicle to buy.
Re-sale value, which is currently not regarded as an important preference,will likely rank among the most important
factors for vehicles purchasesin the future.
Overall, factors that are related to affordability will likely remain the keycriteria for vehicle buyers.
Consumers who do not currently own a vehicle will likely be more concerned about safety than current owners, but less about space or size of the vehicle.
What will be important to you when deciding which vehicle to buy in the future?
Rank Overall Current vehicle owners Non-vehicle owners
1 Fuel efficiency Fuel efficiency Fuel efficiency
2 Value for money Value for money Value for money
3 Re-sale value Re-sale value Re-sale value
4 Status Status Safety
5 Space/size Space/size Status
6 Reliability Reliability Reliability
7 Safety Safety Space/size
Future consumer preferences*
Value for money27%
Fuelefficiency30%
Re-sale value13%
High Moderate LowDegree of importance:
* Respondents were asked to rank criteria based on importance when making the purchasing decision.
12
3
Africa Automotive Insights | Future customer view

51
What will influence you when deciding which vehicle to buy in the future?
While family and friends are likely to remain the main source of advice, trust in the advice from salespeople and advertising may increase…
Future purchases are likely to be strongly influenced by family and friends. Family and friends will likely play a more important influencing role especially for first-time vehicle buyers.
Women, those older than 30 years and motorbike owners are among the group of
people that will be likely to trust the advice of salespeople the most.
Advertising and online platforms may become more significant influencers going forward.
Advertising/ Online26%
Family/friends49%
Salespeople25%1
2 3
Africa Automotive Insights | Future customer view
Influencers
52
What vehicle will you buy and how will you finance it in the future?
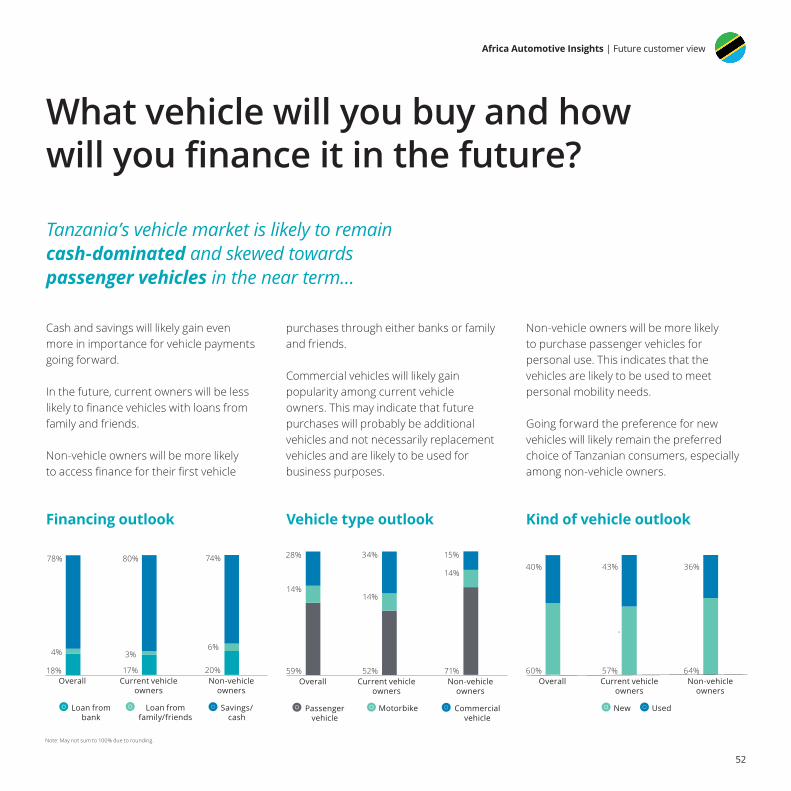
Tanzania’s vehicle market is likely to remain cash-dominated and skewed towards passenger vehicles in the near term…
Cash and savings will likely gain even more in importance for vehicle payments going forward.
In the future, current owners will be less likely to finance vehicles with loans from family and friends.
Non-vehicle owners will be more likely to access finance for their first vehicle
purchases through either banks or family and friends.
Commercial vehicles will likely gain popularity among current vehicle owners. This may indicate that future purchases will probably be additional vehicles and not necessarily replacement vehicles and are likely to be used for business purposes.
Non-vehicle owners will be more likelyto purchase passenger vehicles for personal use. This indicates that the vehicles are likely to be used to meet personal mobility needs.
Going forward the preference for new vehicles will likely remain the preferred choice of Tanzanian consumers, especially among non-vehicle owners.
Financing outlook Vehicle type outlook Kind of vehicle outlook
Overall Current vehicle owners
Loan from bank
Loan from family/friends
Savings/cash
18%
4%
78%
17%
80%
Overall Current vehicle owners
Non-vehicle owners
Passenger vehicle
Motorbike Commercial vehicle
59%
14%
28%
52%
14%
34%
71%
14%
15%
Non-vehicle owners
20%
6%
74%
3%
Overall Current vehicle owners
Non-vehicle owners
New Used
60%
40%
57%
43%
64%
36%
Note: May not sum to 100% due to rounding.
Africa Automotive Insights | Future customer view

53
Why do you think you will not buy a vehicle in the future?
Close to half of consumers may not need or be able to afford a vehicle in the future…
Close to half of consumers in Tanzania do not think they will buy a vehicle in the future.
Within the group that will not buy a vehicle in the future about 60% think they will not be able to afford a vehicle compared to 40% who do not see the need for a vehicle.
The affordability concern is very strong within the group of consumers that currently do not own a vehicle. In contrast, current owners are among those that largely do not see the need to buy a vehicle in the future.
Compared to older consumers, Tanzanians under the age of 30 think that they are less likely to be able to afford a vehiclein the future.
All consumers
Why won’t you buy a vehicle…
51%Plan to purchase a vehicle
30%
19%
Ownership characteristics of those not planning to purchase a vehicle
Overall Current vehicle owners
Under 30 Over 30Non-vehicle owners
I will not be able to afford a vehicle I don’t think I will need a vehicle
66%
34%
55%45%39%
61%
78%
22%
51% 49%
Africa Automotive Insights | Future customer view
I will not be able to afforda vehicle
I don’t think I will need a vehicle

Mobility
Most Tanzanian commuters use overcrowded motorised ride-sharing services while commuting…
54

55
What modes of transport do you use daily and what do you think about them?
Multi-modal transport is common in Tanzania with boda bodas being the most common but also leastsatisfactory mode of transport…
Tanzanians make use of a variety of transport options for their daily commute.
Multi-modal transport is relatively common in Tanzania. Almost half of commuters use more than one form of transport on a daily basis.
For multi-modal commuters, it is most common to use three forms of transport.
While close to 60% of commuters use only ride-sharing services for their motorised trips, just under 30% use only motorised individual forms of transport. Close to 6% of Tanzanian commuters do not use any form of motorised transport.
Just over 40% of all commuters use boda bodas (motorbike taxis) as part of their daily commute. While the most commonly used modes of motorised transport, boda bodas and matatus are regarded as the least satisfactory means of transport.
In contrast to ride sharing, individual motorised transport (private cars) is regarded as the most satisfactory mode of transport.
45% of commuters spend less than TSh7,000 (approx. US$3) per day on commuting. Vehicle owners are more likely to spend more on commuting compared to commuters that do not own a vehicle.
More than of half of commuters complain about overcrowding when using ride-sharing services. Long commute times and the lack of cleanliness also ranked high on commuters’ lists of concerns. Commuters are less concerned about the cost of transport and safety.
Africa Automotive Insights | Mobility

56
42%
34%
31%
30%
22%
13%
4%
2%
Boda boda
Walking
Matatu
Private vehicle
Bus
Taxi
Bicycle
Train
*Responses do not add up to 100% as multiple answers were allowed**Ride-sharing is defined as vehicle-sharing services, through which consumers hail a vehicle via phone/app/side of the road.
Most common mode of transport*Multi-modal transport
All motorised transport** Motorised transport**
1 mode 2 modes 3 modes More than3 modes
52%
19%21%
8%
Most satisfactory: Least satisfactory:
Boda bodaPrivate vehicle
Note: May not sum to 100% due to rounding.
58%Ride-sharing 28%
Individual transport
14%Both individual transport and ride-sharing
Africa Automotive Insights | Mobility

57
60%
44%
32%
30%
18%
17%
15%
14%
8%
Overcrowding
Commute takes too long
Lack of cleanliness
Too many transfers
Poor access to transport
Unreliable
Lack of information on routes
Fares are too expensive
Lack of safety
Less than TSh7,000 TSh7,000-KSh11,000 More than TSh11,000
Overall Non-vehicle ownersVehicle owners
45%
27%
77%
28% 32%
17%26%
41%
6%
Criticisms of ride-sharing*
Commuter spend per day
Note: May not sum to 100% due to rounding.
Africa Automotive Insights | Mobility

Key insights for Tanzania
58

59
The customer journey in Tanzania
Customer Journey
Marketing Finance & sales
Aftersales & service
1 in 3 buyers
regard fuel efficiency as the top
priority
1 in 2 buyers turn to
family or friends for
advice
1 in 2vehicles
are bought from
dealershipsor traders
1 in 6buyersaccess bank
loans to pay for
theirvehicles
2 in 3vehicles
areserviced
by jua kalimechanics
2 in 3ownerswould switch
brand iftheir
incomechanged
1 in 4consumers
plan to buy a
vehicle in the next 2 years
Fuelefficiencywill likely
remain thetop priorityfor futurepurchases
1 in 2buyers
will likely turn to family
and friends
for advice
2 in 3vehicles will likely
be bought from
dealershipsor traders
1 in 2consumers
will likely not
purchase a vehicle
in thefuture
Insi
ghts
3 in 5future
sales will likely be
passengervehicles
Future customer view
Africa Automotive Insights | Key insights & implications
Vehicle typePreferencesPreferences Guidance Sales channel Finance Maintenance Brand loyalty Time horizon Guidance Sales channel No purchase

UgandaA consumer perspective

61
Uganda: Country overview
Key economic data
With a GDP of US$28 bn in 2018, Uganda is the 11th largest economy in SSA and the fourth largest in East Africa. Uganda has experienced an average GDP growth rate of 5% since 2010, with economic growth expected to reach 5.2% in 2018, up from 4.4% in 2017; and above the SSA average of 3.4%. Uganda had a GDP per capita of US$731 in 2018 ($2,449 in PPP).
Key demographic data
Uganda has a total population of approximately 39 million people. In terms of gender, the population is relatively equally split, with 50.3% female and 49.7% male. Almost three quarters of Ugandans are under the age of 30. Approximately 4.6 million people (11.2% of the total population) are between the ages of 15 and 19, representing a sizable group of potential future vehicle owners.
Key urbanisation data
Fewer than one in six Ugandans live in urban areas. This is below the SSA urban population average of 38.8%. Kampala is home to 30% of Uganda’s urban population and has East Africa’s second highest urban population growth rate (after Mogadishu), with 6.8%. This means that the city will likely attract about 107,000 new inhabitants each year between 2010 and 2020. By 2050, approximately 37% of all Ugandans will be living in urban areas.
Motorisation data
Uganda’s motorisation rate of 13 vehicles per 1,000 inhabitants is the second highest in East Africa but lower than the SSA average of 42. Approximately 4,000 new vehicles were registered in 2016.
GDP: US$28bn
Population: 39 million
Average GDP growth rate of 5% since 2010
GDP per capita: US$731
Source: International Monetary Fund, 2017; UN Habitat 2017; UN Habitat, 2014; OICA, 2017; World Bank, 2017; UN DESA, 2017.
Demographics50.3% female49.7% male
Motorisation rate: 13 vehicles per 1,000 inhabitants
Urban population: 16% of total population
Urban population in 2050: 37% of total population
Youth: 74% of population under the age of 30
Africa Automotive Insights | Uganda

62
Uganda survey sample overview
Gender Age Employment status
Vehicle ownership
Ownership history
Kind of vehicle Type of vehicle Vehicle use Duration of ownership
Fem
ale
Mal
e
Und
er 3
0
Ove
r 30
Sala
ried
empl
oyee
Self
empl
oyed
Oth
er (s
tude
nt, u
nem
ploy
ed,
hous
ewife
, ret
ired)
Vehi
cle
owne
r
Non
-veh
icle
ow
ner
Firs
t-tim
e ow
ner
Non
-firs
t-tim
e ow
ner
New
*
Use
d
Pass
enge
r veh
icle
Mot
orbi
ke
Ligh
t com
mer
cial
veh
icle
Mul
tiple
veh
icle
s
Pers
onal
Busi
ness
Both
Less
than
1 y
ear
2-3
year
s
4-5
year
s
6-8
year
s
Mor
e th
an 8
yea
rs
44% 56% 45% 55% 28% 65% 7% 27% 73% 52% 48% 28% 72% 59% 26% 12% 3% 62% 34% 4% 22% 45% 18% 8% 7%
In the survey, consumers were asked questions to gain insights into the customer journey that includes purchasing and owning a vehicle, marketing, finance & sales, and aftersales & service. Future vehicle ownership was also discussed.
Sample size: 359 respondentsDate of data collection: 30 September – 03 October 2017Place of data collection: Kampala & Jinja (middle-income neighbourhoods)Data collected by: Infomineo
Africa Automotive Insights | Uganda
Overall sample (n=359) Vehicle owners (n=97)
* The higher-than-expected weighting of new vehicles as a share of overall vehicles is the result of the concentration of middle-class respondents in the sample

Marketing
Vehicle owners in Uganda regard price as the most important purchasing criterion, and vehicle purchasing decisions are most influenced by family and friends…
63

64
What is important to you when deciding which vehicle to buy?
Overall, Ugandan vehicle owners value price but consumer preferences vary by gender, history of ownership, type and kind of vehicle…
Overall, price is the key factor influencing the purchasing decision of vehicles in Uganda. This is in line with the fact that most vehicles fall into the lowest price bracket (less than USh17.5m – below approx. US$5,000).
There are significant differences among various groups in terms of preferences.
For men, status is the most important criterion, whereas women care little about this when buying a vehicle. Similarly, buyers of new vehicles are much more concerned about status compared to buyers of used vehicles.
First-time owners seem to be far more price-sensitive compared to owners thathave owned vehicles before.
Passenger vehicle owners regard safety as the most important criterion when buying a vehicle; however, motorbike owners are far less concerned about safety.
Overall, re-sale value is the least important factor driving the purchasing decision. This might indicate that vehicles are not bought with the intention of selling them later.
Consumer preferences
Reliability & Safety
16%
Price
20%
Status
15%
12 3
Africa Automotive Insights | Marketing

65
Consumer preferences*
Rank Overall
Gender Ownership history Kind of vehicle Type of vehicle
Female Male First-timeowner
Non-first-timeowner New Used Passenger
vehicle Motorbike
1 Price Price Status Price Safety Status Price Safety Price
2Reliability &
SafetyReliability Safety Status Reliability
Reliability &Safety
Reliability Status Reliability
3 StatusFuel
efficiencyPrice Reliability
Value formoney
Fuelefficiency
Safety Price Status
4Fuel
efficiencySafety
Value formoney
Safety Fuel efficiency PriceValue formoney
Value formoney
Fuelefficiency
5Value formoney
Space/size ReliabilityFuel
efficiencyPrice
Value formoney
StatusFuel
efficiencySafety
6 Space/sizeValue for money
Fuelefficiency
Space/size Status Space/sizeFuel
efficiencyReliability
Value formoney
7 Re-sale value Re-sale value Space/sizeValue formoney
Space/size Re-sale value Space/size Space/size Space/size
8 Status Re-sale value Re-sale value Re-sale value Re-sale value Re-sale value Re-sale value
* Respondents were asked to rank criteria based on importance when making the purchasing decision.
High Moderate LowDegree of importance:
Africa Automotive Insights | Marketing

66
What influences you when deciding which vehicle to buy?
Family and friends have the greatestinfluence on vehicle buyers…
In Uganda, family and friends have the greatest influence on the purchasing decision. About 40% of Ugandan vehicle owners turn to family and friends for advice on which vehicle to purchase.
Motorbike owners are more influenced by people they have a personal relationship with compared to buyers of other vehicle types.
Country brand dominance plays the second most important role in this decision. For owners of passenger vehicles and non-first-time owners country brand dominance is the most important influencer.
Together family and friends, and brand dominance influence more than 70% of vehicle owners’ purchasing decisions.
Ugandan vehicles owners are little swayed by any form of advertising. Women and non-first-time owners are the least influenced by advertising.
Despite the fact that dealerships or traders are by far the most important sales channels, salespeople do not have a strong influence over vehicle buyers.
Influencers by ownership history and type of vehicle
Rank Overall First-time owner Non-first-timeowner Passenger vehicle Motorbikes
1 Family/friends Family/friendsCountry brand
dominanceCountry brand
dominanceFamily/friends
2Country brand
dominanceCountry brand
dominanceFamily/friends Family/friends
Country brand dominance
3 Salespeople Salespeople Salespeople SalespeopleSalespeople and
Advertising
4 Advertising Advertising Advertising Advertising
Country brand dominance
32%
Family and Friends
40%
Salespeople
20%1
23
Africa Automotive Insights | Marketing

Finance & salesThe majority of Ugandan consumers paid less than USh17.5m for their vehicles, bought them cash and at a dealership or trader…
67
68
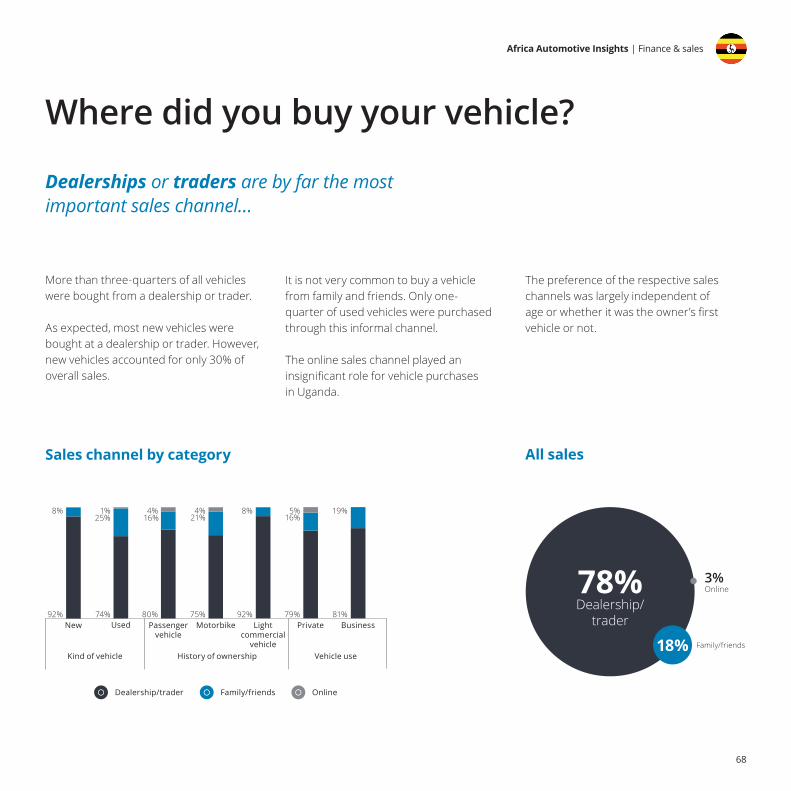
Where did you buy your vehicle?
Dealerships or traders are by far the most important sales channel…
More than three-quarters of all vehicles were bought from a dealership or trader.
As expected, most new vehicles were bought at a dealership or trader. However, new vehicles accounted for only 30% of overall sales.
It is not very common to buy a vehicle from family and friends. Only one-quarter of used vehicles were purchased through this informal channel.
The online sales channel played an insignificant role for vehicle purchases in Uganda.
Sales channel by category All sales
Kind of vehicle
New Used Passenger vehicle
Light commercial
vehicle
Private Business
History of ownership Vehicle use
Family/friends OnlineDealership/trader
Motorbike
78%Dealership/
trader
18%
3%Online
Family/friends
92%
8%
74%
1%
80%
4%
75%
4%
92%
8%
79%
5%
81%
19%25% 16% 21% 16%
The preference of the respective sales channels was largely independent of age or whether it was the owner’s first vehicle or not.
Africa Automotive Insights | Finance & sales
69
Finance channel by category
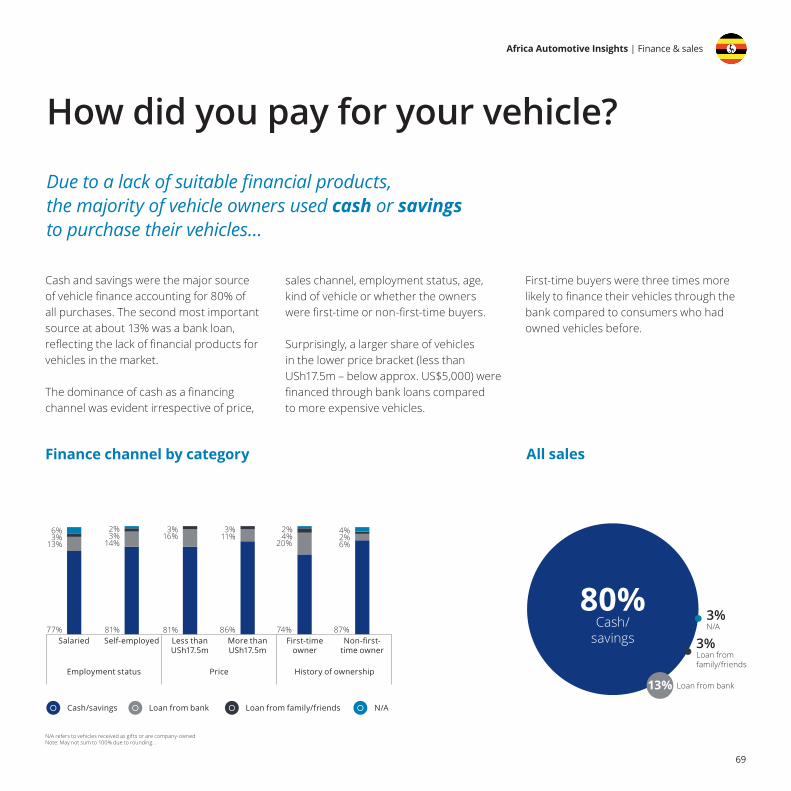
How did you pay for your vehicle?
Due to a lack of suitable financial products, the majority of vehicle owners used cash or savings to purchase their vehicles…
All sales
Cash and savings were the major source of vehicle finance accounting for 80% of all purchases. The second most important source at about 13% was a bank loan, reflecting the lack of financial products for vehicles in the market.
The dominance of cash as a financing channel was evident irrespective of price,
sales channel, employment status, age, kind of vehicle or whether the ownerswere first-time or non-first-time buyers.
Surprisingly, a larger share of vehicles in the lower price bracket (less than USh17.5m – below approx. US$5,000) were financed through bank loans compared to more expensive vehicles.
First-time buyers were three times more likely to finance their vehicles through the bank compared to consumers who had owned vehicles before.
80%Cash/
savings
Loan from bank
3%Loan from family/friends
3%N/A
13%
First-time owner
Non-first-time owner
Employment status Price History of ownership
3%
77%
6%
13%
3%
81%
3%11%
86%
2%
20%
74%
3%
81%
2%
14%16% 4%
4%
6%
87%
2%
Cash/savings Loan from bank Loan from family/friends N/A
Salaried Self-employed Less than USh17.5m
More than USh17.5m
N/A refers to vehicles received as gifts or are company-ownedNote: May not sum to 100% due to rounding. .
Africa Automotive Insights | Finance & sales

70
How much did you pay for your vehicle?
The majority of Ugandan vehicle owners paid less than USh17.5m for their vehicle…
Vehicles by price range
All vehicles Passenger vehicles
Less than USh17.5m
USh17.5m-USh35m
Over USh35m
All vehicles UsedNew
62%60% 62%
32%40%
29%
6% 9%
Less than USh17.5m
USh17.5m-USh35m
Over USh35m
All vehicles UsedNew
51%
33%
58%
45%
67%
38%
4% 5%
Over 60% of all vehicles fell into the lowest price bracket (less than USh17.5m– below approx. US$5,000).
As Uganda’s income level is significantlylower than that of most of its regional peers, it is to be expected that the majority of Ugandans will have a preference for cheaper vehicles.
In the USh17.5m-USh35m (approx. US$5,000-US$10,000) price bracket, the share of new vehicles outweighed the share of used vehicles. No new vehicles in Uganda were boughtfor more than USh35m.
Just over half of passenger vehicles werebought for less than USh17.5m. However,
two-thirds of new passenger vehicles fell into the USh17.5m-USh35m (approx. US$5,000 - US$10,000) price bracket.
Africa Automotive Insights | Finance & sales
0% 0%

A change in income is likely to trigger a switch in brand…
71

72
What would convince you to change your current vehicle brand?
A change in income would be the key reason to switch brand. First-time owners and consumers under 30 seem to be the most brand loyal consumers…
Given the price-sensitivity of Ugandan consumers, a change in income is the most influential factor which would result in a change of brand.
The importance of a change in income is independent of age, gender, type, kindor price of vehicle and whether theowner is a first-time buyer or not.
Current owners would not change to a different brand because it offers better fuel efficiency. This indicates thatconsumers tend to be more concerned about upfront-costs than running-costs.
First-time vehicle owners and owners under the age of 30 are the most brand loyal and
are the least likely to change their preferred vehicle brand for any reason.
In contrast, non-first time vehicle owners, owners of passenger vehicles and consumers who paid more than USh17.5m (above approx. US$5,000) for their vehicle are the most likely to switch brand.
*Responses do not add up to 100% as multiple answers were allowed.
Reasons for changing brand*
Change in income
Greater availability/affordability of vehicle finance
Lower price of competing vehicle
Lower cost of maintenance
Fuel efficiency of competing vehicle brands
62%
Other
34%
26%
26%
21%
4%
Africa Automotive Insights | Finance & sales

Aftersales & service
Ugandans regularly service their vehicles, mostly by jua kali mechanics and at petrol stations…
73

74
Compared to their counterparts, women and new vehicle owners are twice as likely to take their vehicles to authorised dealerships.
New vehicle owners are the most likely toservice their vehicles in the formal sector,followed by owners of vehicles valued at over USh17.5m (above approx. US$5,000).
First-time owners are more likely to use jua kali mechanics to service their vehicles, even though they are more likely to have
When and where do you service your vehicle?
Most vehicles are serviced regularly, either by jua kalimechanics or petrol stations…
Nearly two-thirds of vehicle owners servicetheir vehicles regularly. The most preferredservice providers are jua kali (informal/open-air) mechanics and petrol stations.
Only half of consumers have their vehiclesserviced in the formal sector (authoriseddealerships or petrol stations). Petrol stations dominate the formal servicing sector with less than 15% of consumers taking their vehicles to authorised dealerships. An almost equal share of owners service their vehicles themselves.
bought their vehicles at dealerships or traders. This indicates that dealerships miss the opportunity to create customer loyalty among first-time buyers for aftersales services.
Frequency of service Place of service
65%As per
recommendedservice intervals
28%When my
vehicle breaksdown
1%Every two years
1%I have never serviced my vehicle
35%Jua kali
mechanic
35%Petrol station
Authorised dealership14%
Service vehicle myself13%
3%Family/friends
5%Once a year
Africa Automotive Insights | Aftersales & service

75
Africa Automotive Insights | Aftersales & service
Service channels
Jua kali mechanic Petrol station Service it myselfAuthorised dealership Family/friends
Gender Kind of vehicle History of ownership Price of vehicle
Female Male
29%
3%9%
40%
39%10%
18%
33%
20%
New Used
48%
22%7%
22%
30%10%
4%
41%
14%
First-time owner
Non-first-time owner
33%
14%
12%
41%
13%
13%6%
30%
38%
Less thanUSh17.5m
More thanUSh17.5m
12%14%
2%
36%
17%
11%6%
29%
36%37%

Future customer view
Only a third of Ugandan consumers plan to purchase a vehicle in the next five years. Cash purchases of passenger vehicles are likely to dominate the market…
76

77
When and where will you buy your next vehicle in the future?Only a third of consumers plan to buy a vehicle within the next five years, but those who will buy a vehicle are likely to continue to purchase them from adealership or trader…
More than half of Ugandan consumers do not plan to buy a vehicle going forward irrespective of whether they currently own a vehicle or not. Affordibility is the greatest constraint to future purchases.
Close to half of future purchases will likely be new vehicles. This a sizeable increase from current purchases of which only 30% were new vehicles.
Current owners are more confident than non-vehicle owners about purchasing a vehicle in the next five years. About half of this group plan to buy a vehicle within this period.
Ugandans who do not currently own a vehicle are less confident about future purchase.
The largest share of consumers that plan to purchase a vehicle, are likely to do so from a dealership or trader. This channel will likely account for three-quarters of future purchases and will continue to dominate the market going forward.
Sales channel
75%Dealership/
trader
17%Importing
directly
5%Online
3%Family/friends
Africa Automotive Insights | Future customer view
Time horizon
In the next year In the next 2 years 3-5 years More than 5 years I won’t need or be able to
afford vehicle
Do not plan topurchase a vehicle
Plan to purchase a vehicle
Current vehicle owners Non-vehicle ownersOverall
9%12%
8%12%
22%
8%13% 14% 12%
8%3%
10%
58%
48%
61%

78
Safety and status are likely to be the most importantcriteria for future vehicle purchases…
Overall consumer preferences are expected to remain relatively consistent going forward. Safety and status will likely continue to be important purchasing criteria, and even increase from moderate to high importance for all consumers.
For current owners status will likely overtake safety as a key criterion forfuture purchases.
Prospective owners are more likely to be concerned about safety compared to current owners.
Re-sale value will probably remain a low priority for all future purchases regardless of current ownership status.
What will be important to you when deciding which vehicle to buy in the future?
Future consumer preferences*
* Respondents were asked to rank criteria based on importance when making the purchasing decision
Rank Overall Current vehicle owners Non-vehicle owners
1 Safety & Status Status Safety
2 Fuel efficiency Safety Status
3 ReliabilityFuel efficiency &
Reliability & Space/sizeFuel efficiency
4 Space/size Value for money Reliability
5 Value for money Re-sale value Space/size
6 Re-sale value Value for money
7 Re-sale value
High Moderate LowDegree of importance:
Fuel efficiency15%
Safety & Status27%
Reliability11%
1
23
Africa Automotive Insights | Future customer view

79
What will influence you when deciding which vehicle to buy in the future?
While family and friends are likely to remain the main source of advice, the influence ofadvertising will increase…
Future purchases will likely be strongly influenced by family and friends. This indicates that Ugandan consumers will be more likely to trust the advice of people with whom they have a close personal relationship.
The advice from family and friends will likely be most influential for consumers who do not currently own a car.
Current owners will likely increasingly trust the advice of salespeople for their future vehicle purchases.
Influencers
SalesPeople19%
Family/friends65%
Advertisingonline15%
Advertising and online platforms will probably remain insignificant influencers going forward. This suggests that these media are underleveraged.
1
23
Africa Automotive Insights | Future customer view

80
What vehicle will you buy and how will you finance it in the future?
Uganda’s vehicle market is likely to remain cash-dominated and skewed towards passenger vehicles going forward…
Cash and savings will likely remain themost important way to pay for vehicles.
Compared to non-vehicle owners,current vehicle owners will be less likely to access finance either through banks or family and friends.
Going forward used vehicles will probably remain the preferred choice
of Ugandan consumers. However, current owners are more likely to buy a new vehicle, rather than aused vehicle, in the future.
Passenger vehicles are expected to gain in popularity, especially amongst current owners and are the most likely choice for future vehicle purchases.
Compared to current vehicle owners,non-vehicle owners are more likely topurchase a motorbike in the future.
Financing outlook Vehicle type outlook
7%3%
90%
Overall Current vehicle owners
Loan from bank
Loan from family/friends
Savings/cash
Overall Current vehicle owners
Non-vehicle owners
Passenger vehicle
Motorbike Commercial vehicle
Non-vehicle owners
2%2%
96% 87%
4%9% 73%
13%14%
80%
6%14% 14%
17%
70%
Note: May not sum to 100% due to rounding. .
Africa Automotive Insights | Future customer view

81
Why do you think you will not buy a vehicle in the future?
Close to 60% of consumers may not need orbe able to afford a vehicle in the future…
While 42% of Ugandans intend to purchase a vehicle going forward, 35% say they will not be able to afford a vehicle and 23% do not believe that they will need one in the future.
Two-thirds of current vehicle owners do not think that they will be able to afford another vehicle. This is greater than the share of non-vehicle owners.
While global trends suggest thatyounger consumers will be lesslikely to see the need for owning avehicle in the future, in Uganda,older consumers do not see the need for owning a vehicle in the future.
All consumers Ownership characteristics of those not planning to purchase a vehicle
42%Plan to purchase a vehicle
35%
23%Overall Current vehicle
ownersNon-vehicle
owners
I will not be able to afford a vehicle I don’t think I will need a vehicle
38%
62%
34%
65%
40%
60%
I will not be able to afforda vehicle
I don’t think I will need a vehicle
Under 30 Over 30
68%
32%
58%
42%
Africa Automotive Insights | Future customer view

Mobility
Most Ugandans use expensive and unsafe ride-sharing services as part of their daily commute. Boda bodas are the most common form of transport...
82

83
Africa Automotive Insights | Mobility
What modes of transport do you use daily and what do you think about them?
Boda bodas are the most common mode of motorised transport in Uganda and one of the most satisfactory…
Ugandans make use of a variety of transport options for their daily commute.
Compared to Kenya and Tanzania multi-modal transport is less common in Uganda. Only a third of commuters use more than one form of transport on a daily basis.For multi-modal commuters, it is most common to use two forms of transport.
While over 80% of commuters use only ride-sharing services for their motorised trips, less than a tenth use only motorised individual forms of transport. About 7% of Ugandan commuters do not use any form of motorised transport.
More than half of all commuters use boda bodas (motorbike taxis) as part of their
daily commute. Boda bodas are viewed as the most satisfactory mode of transport after private vehicles.
Although regarded as the most satisfactory mode of transport, less than a sixth of commuters use a private vehicle each day.
The vast majority of Ugandan commuters spend less than USh11,000 (US$3) per day on commuting. Despite this, nearly half of commuters complain that fares aretoo expensive.
The lack of safety concerns the largest share of all commuters using ride-sharing services. This is not surprising considering that about 40% of trauma cases in Ugandan hospitals are the result of boda
boda accidents. Most Ugandans do not wear helmets, irrespective of whether they are drivers or passengers.
Overcrowding and a lack of cleanliness on ride-sharing platforms are also a cause for concern. Few commuters complain about the number of transfers or the lack of clear information on routes.
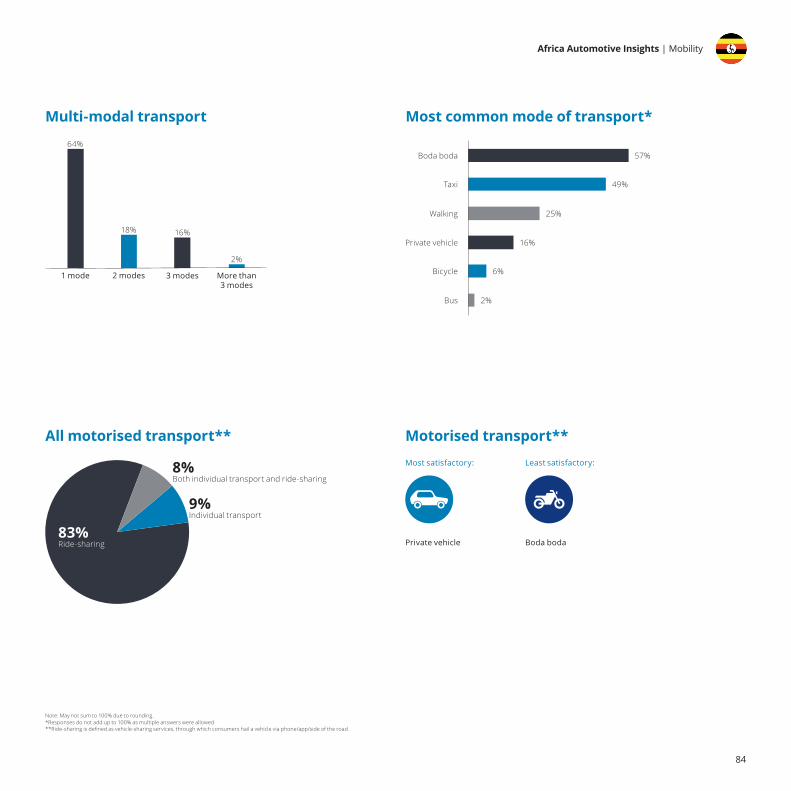
84
64%
18% 16%
2%
1 mode 2 modes 3 modes More than3 modes
Boda boda
Taxi
Walking
Private vehicle
Bicycle
Bus
57%
49%
25%
16%
6%
2%
*Responses do not add up to 100% as multiple answers were allowed**Ride-sharing is defined as vehicle-sharing services, through which consumers hail a vehicle via phone/app/side of the road.
Most common mode of transport*Multi-modal transport
All motorised transport** Motorised transport**Most satisfactory: Least satisfactory:
Boda bodaPrivate vehicle
Note: May not sum to 100% due to rounding.
83%Ride-sharing
9%Individual transport
8%Both individual transport and ride-sharing
Africa Automotive Insights | Mobility

85
78%
52%
88%
13%
27%
2%9%
22%10%
Less than USh11,000 USh11,000-USh18,000 More than USh18,000
Overall Non-vehicle ownersVehicle owners
Lack of safety
Fares are too expensive
Overcrowding
Lack of cleaniliness
Commute takes too long
Unreliable
45%
Poor access to transport
Too many transfers
Lack of information on routes
43%
42%
39%
23%
23%
21%
13%
9%
Africa Automotive Insights | Mobility
Criticisms of ride-sharing*
Commuter spend per day

Key insights for Uganda
86

87
The customer journey in Uganda
Customer Journey
Africa Automotive Insights | Key insights & implications
MarketingFinance & sales
Aftersales & service
1 in 5buyersregard price as the toppriority
2 in 5buyers turn to
family or friends
for advice
3 in 4vehicles
are bought from
dealershipsor traders
1 in 8buyersaccess
bank loans to pay
for theirvehicles
1 in 3vehicles
areserviced
by jua kalimechanics
2 in 3ownerswould switchbrand if their income
changed
1 in 5consumers
plan to buy a
vehicle in the next 2 years
Status &safety will
likely be toppriorities for futurepurchases
1 in 5buyers
will likelyturn tosales-
peoplefor advice
3 in 4vehicles will likely
be bought from
dealershipsor traders
2 in 3consumers
will likely not
purchase avehicle inthe futureIn
sigh
ts
3 in 4future
sales willlikely be
passengervehicles
Vehicle typePreferencesPreferences Guidance Sales channel Finance Maintenance Brand loyalty Time horizon Guidance Sales channel No purchase
Future customer view

Country comparison
88

89
Kenyan consumers • Highest spending power • Highest motorisation rate • Most likely to drive a new vehicle • Most likely to access bank finance • Most likely to purchase their vehicle from a
dealership or trader • Have the most developed servicing culture • Most likely to buy a vehicle in the next five years
Key commonalities between Kenyan, Tanzanian and Ugandan consumers • Family and friends have the greatest influence on purchasing decisions • The majority of consumers purchase their vehicles from a dealership or trader • Most vehicles are purchased in cash • Most vehicles are regularly serviced • Most vehicles are serviced by jua kali mechanics • A change in income is likely to trigger a switch in brand
Tanzanian consumers • Most cost-sensitive • Lowest motorisation rate • Most likely to purchase their vehicle from family
and friends • Least likely to purchase their vehicle from a
dealership or trade • Most likely to purchase their vehicle online • Have the least developed servicing culture • Most likely to service their vehicle in the informal
sector • Most likely to purchase their future
vehicle online
Ugandan consumers • Lowest spending power • Most likely to drive a used vehicle • Least likely to access a bank loan to finance their
vehicle • Most likely to only service their vehicle when it
breaks down • Most likely to service their vehicles at a petrol
station • Most likely to service their vehicles themselves • Least likely to purchase a vehicle in the next five
years
Comparison between Kenya, Tanzania and Uganda
Africa Automotive Insights | Country comparison

90
Unlocking East Africa’s nascent automotive marketDeep customer insights are your key to unlocking Africa’s automotive markets.
The lack of sufficient purchasing power combined with a massive mobility need and many aspiring consumers means that industry players need to re-examine where and how they position themselves within the customer journey. This will enable them to take full advantage of the nascent East Africa automotive market.
Industry players have to reconsider their value and brand propositioning as well as service offering in these markets, ensuring that what is on offer truly appeals to consumers and supports market development strategies. In this regard, one cannot overemphasise the importance of deep customer insights that can be leveraged to shape customer behaviour and attitudes towards formal and certified sales and service channels.
In East Africa, in common with other Africa regions, public policy is all important in shaping the automotive mobility environment. Public-private sector coordination is crucial to fully realising these opportunities.
As in other markets, the success of the industry will depend on how well automotive companies will be aligned to the mobility needs of their customers in future. This might not necessarily mean selling more vehicles, but will depend on partnerships and new business models that also consider offerings such as ride sharing and innovative ownership models. Any market development efforts must be supported by providing access to vehicle finance products that are tailored to the specific local market conditions.
Africa Automotive Insights | Country comparison

91
ContactsDr Martyn DaviesAfrica Automotive LeaderDeloitte [email protected]
Jan-Hendri TrompSnr. Chief of Staff: AutomotiveDeloitte [email protected]
Authors
Hannah EdingerAssociate DirectorDeloitte [email protected]
Simon SchaeferManagerDeloitte [email protected]
Africa Automotive Insights | Contacts
Mike VincentConsulting Leader: AutomotiveDeloitte [email protected]
Adheesh OriRisk Advisory Leader: AutomotiveDeloitte [email protected]
Kira McDonaldConsultantDeloitte [email protected]

Deloitte refers to one or more of Deloitte Touche Tohmatsu Limited, a UK private company limited by guarantee (“DTTL”), its network of member firms, and their related entities. DTTL and each of its member firms are legally separate and independent entities. DTTL (also referred to as “Deloitte Global”) does not provide services to clients. Please see www.deloitte.com/about to learn more about our global network of member firms.
Deloitte provides audit, consulting, financial advisory, risk advisory, tax and related services to public and private clients spanning multiple industries. Deloitte serves four out of five Fortune Global 500® companies through a globally connected network of member firms in more than 150 countries and territories bringing world-class capabilities, insights, and high-quality service to address clients’ most complex business challenges. To learn more about how Deloitte’s approximately 245 000 professionals make an impact that matters, please connect with us on Facebook, LinkedIn, or Twitter.
This communication contains general information only, and none of Deloitte Touche Tohmatsu Limited, its member firms, or their related entities (collectively, the “Deloitte network”) is, by means of this communication, rendering professional advice or services. Before making any decision or taking any action that may affect your finances or your business, you should consult a qualified professional adviser. No entity in the Deloitte network shall be responsible for any loss whatsoever sustained by any person who relies on this communication.
© 2018. For information, contact Deloitte Touche Tohmatsu Limited
Designed and produced by Creative Services at Deloitte, Johannesburg. (814483tha)


![T HE E NGLISH A FRICA. A FRICA L ANGUAGE IN A FRICA There are an estimated 2,000 languages spoken in Africa. [1] The American linguist Joseph Greenberg](https://img.pdfslide.us/doc/110x75/56649d925503460f94a785d0/t-he-e-nglish-a-frica-a-frica-l-anguage-in-a-frica-there-are-an-estimated.jpg)


![Michael Crichton - Frica [Ibuc.info]](https://img.pdfslide.us/doc/110x75/577cc4341a28aba711987e02/michael-crichton-frica-ibucinfo.jpg)