Embed Size (px)
Citation preview
A Framework to Speed Manufacturing’s Digital Business TransformationManufacturers must fully embrace social, mobile, analytics and cloud technologies to achieve the operational excellence, agility, innovation and customer centricity required to remain relevant with customers, business partners and the entire manufacturing ecosystem.
2 KEEP CHALLENGING November 2015
Executive SummaryBusinesses across the globe are changing fast, driven by emerging
digital technologies. Some are leading this revolution and defining
trends, while others are taking a wait-and-watch approach. In either
case, the undoubted winner is the customer. With unprecedented
information availability, product choices and channel options, customers
can call the shots. The race to identify and deliver on ever-changing
customer needs is gaining momentum as new players with novel
business models challenge the establishment.
This white paper highlights the challenges and opportunities that
manufacturers face as a result of this changing business landscape. We
cite several industry examples to illustrate how digital leaders in the
manufacturing space, such as Mercedes-AMG and Dow Chemical, are
defining new boundaries for performance and efficiency.
The paper also elaborates on four interconnected mandates that
manufacturers must embrace through emerging digital technologies:
• Operational excellence: Productivity and efficiency across processes
and functions.
• Agility: Response to internal and external changes.
• Innovation: Initiatives leading to cost reductions and new revenue
opportunities.
• Customer centricity: Meeting customer expectations.
2 KEEP CHALLENGING November 2015
A FRAMEWORK TO SPEED MANUFACTURING’S DIGITAL BUSINESS TRANSFORMATION 3 A FRAMEWORK TO SPEED MANUFACTURING’S DIGITAL BUSINESS TRANSFORMATION 3
Manufacturers can determine their level of maturity for each area by
assessing three critical organizational attributes: leadership support,
execution mechanisms and performance management through
KPI tracking and management accountability. This paper can help
organizations rate their digital capabilities and benchmark themselves
against competitors, using our recommended reference framework and
scoring mechanism.
Finally, we present an approach for developing a transformation
roadmap and implementation approach built on our digital maturity
framework. Throughout the paper, we draw on insights from some of
our large transformational engagements across various manufacturing
organizations and geographies, as well as primary research, such
as our informed manufacturing CxO study (see our white paper
“Informed Manufacturing: Reaching for New Horizons”).
Understanding Global Manufacturing Trends and Digital ImperativesManufacturers today face a changing business paradigm, in which emerging technologies are forever changing how products are made, service is delivered and business is conducted. Embedded technologies are enabling manufactured products to be more “informed;”1 new stakeholders with innovative products and services are entering the ecosystem; traditional supply chains are being disrupted through new channel options; and, above all, customers are demanding an ever-increasing level of customization, not just in products and services, but also across the entire procurement and product usage experience.
These trends have not changed traditional business fundamentals of profitably delivering products and services that meet customer needs. Manufacturers continue to be laser-focused on customer centricity, and are committed to achieving operational excellence to attain cost and quality leadership. They are also pursuing agility and flexibility to adapt to changes in the external and internal environments, as well as delivering innovative products, processes and business models to meet sustainability objectives.
What is new, however, are the technological developments of the last decade. Advance-ments across the so-called SMAC Stack (aka, social, mobile, analytics and cloud) and the Internet of Things (IoT) have enabled a wide range of applications that were previously unimaginable. Today, the objective is to use modern technology to do the same things in a dramatically more efficient and effective way.
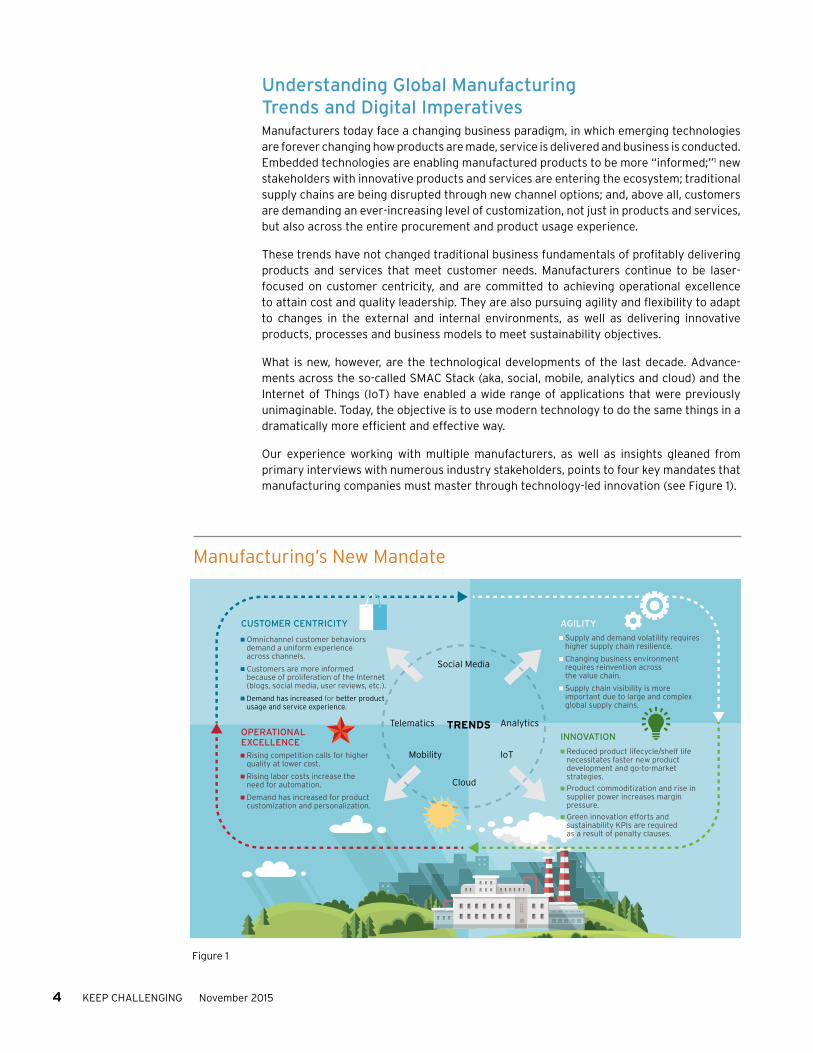
Our experience working with multiple manufacturers, as well as insights gleaned from primary interviews with numerous industry stakeholders, points to four key mandates that manufacturing companies must master through technology-led innovation (see Figure 1).
4 KEEP CHALLENGING November 2015
Manufacturing’s New Mandate
■ Omnichannel customer behaviors demand a uniform experience across channels.
■ Customers are more informed because of proliferation of the Internet (blogs, social media, user reviews, etc.).
■ Demand has increased for better product usage and service experience.
■ Reduced product lifecycle/shelf life necessitates faster new product development and go-to-market strategies.
■ Product commoditization and rise in supplier power increases margin pressure.
■ Green innovation efforts and sustainability KPIs are required as a result of penalty clauses.
■ Rising competition calls for higher quality at lower cost.
■ Rising labor costs increase the need for automation.
■ Demand has increased for product customization and personalization.
■ Supply and demand volatility requires higher supply chain resilience.
■ Changing business environment requires reinvention across the value chain.
■ Supply chain visibility is more important due to large and complex global supply chains.
Social Media
Telematics
Mobility IoT
AnalyticsTRENDS
Cloud
AGILITYCUSTOMER CENTRICITY
OPERATIONAL EXCELLENCE INNOVATION
Figure 1

• Operational excellence: Modern shop floors are highly automated and leverage the industrial Internet (aka, the Internet of Things) to manage day-to-day operations, as well as prevent disruption. Flexibility and efficiency — the traditional manufacturing goals — are becoming increasingly business-critical, partly due to spiraling customer demand for additional product customization and personalization with the least possible price impact.
In light of these trends, operational excellence is acquiring new meaning. It is no longer only about incremental improvements in quality, productivity and waste reduction, but also optimizing plant operations, leveraging technologies such as intelligent products, enabling machine-to-machine collaboration and utilizing prescriptive analytics. A typical example would be an automotive shop floor, in which embedded devices in the chassis (informed products) communicate seamlessly with machines in the assembly line, and direct specific processes and part types to be fitted to build the car according to the bill of materials (BOM).
According to our 2014 global informed manufacturing study, 60% of respondents believe that leveraging data from informed products is vital for product engineering and development; 65% felt this data is critical to improving manufacturing operations.
Digital leaders, such as Mercedes-AMG, are beginning to leverage the huge volumes of data generated from informed products to reduce waste and increase efficiency, especially for high-investment equipment such as dynamometers. The car maker recently piloted a quality assurance platform based on predictive analytics2 to optimize its engine-testing capacity and speed resolution of engine issues. Rather than the traditional process of analyzing results after all tests are conducted, Mercedes now compares historical engine test data with real-time sensor data during test runs to identify quality issues and take immediate action. The result: Significant time savings and less resource waste.
• Agility: Present-day supply chains are diverse, dispersed and complex to manage, as the result of a global supply base with multiple manufacturing plants that address the needs of multiple markets. Boeing, for example, has a supply base of more than 5,000 production facilities for its global operations3 and employs a half-million people worldwide. To ensure smooth and responsive operations of these large and complex supply chains, many manufacturers integrate their supply chain partners through a common platform, facilitating communication and joint risk management. Supply and demand volatility, on the other hand, remains the rule rather than the exception following the 2008-2009 global recession, and it shows no sign of stability in the near term. These trends have forced manufacturers to adopt technologies such as mobility and cloud to enable greater visibility and control.
We estimate that close to 80% of all manufacturers and service providers are using technology such as barcoding and RFID to generate more data from products, and about half use this data for supply chain track-and-trace operations.
Companies such as Dow Chemical are leveraging cloud technology to generate tremendous visibility and flexibility across the value chain. The chemical manufacturer makes more than 6,000 products and operates in more than 36 countries, which results
A FRAMEWORK TO SPEED MANUFACTURING’S DIGITAL BUSINESS TRANSFORMATION 5
By introducing a platform that enables sample requests, shipping and customer follow-up, Dow has achieved campaign response rates of 40% to 50%, in addition to gaining tremendous insights into sample performance.
in an exceptionally high volume of customer requests. By introducing a platform that enables sample requests, shipping and customer follow-up, Dow has achieved campaign response rates of 40% to 50%, in addition to gaining tremendous insights into sample performance through automation of follow-up processes.4
• Innovation: The traditional integrated value chain from the supplier’s supplier to the customer’s customer is now broken into distinct chunks, as new players leverage emerging technologies to provide innovative products and services through newer business models. Companies such as Flipkart5 (the India-based e-commerce giant also known as the Amazon of India) and Paytm6 (the India-based online wallet and payment solutions provider, similar to SQUARE in the U.S.) have become giants in a very short span of time, snatching business from existing players. These companies are succeeding
by developing completely new business models that address consumer pain points, such as stock-outs in physical stores, and providing convenience, such as secure online transac-tions and home delivery.
The challenge for manufacturers is to figure out where and how to innovate, in order to reduce risk and ensure sustained growth. While product engineering and technology remain key targets for innovation, an area of growing importance is the development of holistic strategies that connect the entire product, service and delivery channel. Environmental sustain-ability — ecosystem preservation, waste disposal and carbon emission regulation — is another hotbed of innovation with vast potential for manufacturers. With warnings of global warming and increased customer awareness, manufacturers must find innovative ways to implement green practices.
Another key challenge is nurturing a culture of innovation within the organization. Investments in technology, such as
collaboration platforms for knowledge-sharing, can help with innovation, but they will only yield results when accompanied by change management initiatives that bring about a mindset shift to a new philosophy of working. In our experience, roughly a quarter of all manufacturing organizations have a crowdsourcing/co-innovation platform to fuel managed innovation, which has become a key differentiator for leading players.
Over the years, 3M has cultivated a culture of innovation7 through new processes and platforms, enabling it to consistently maintain an enviable average gross margin of around 50%. Employees are encouraged to use 15% of their time to work on projects outside of their core responsibilities, and failures are gracefully tolerated. The company has broken down silos within the company and between the company and its customers, and makes available various forms of seed-funding to foster innovation.
• Customer centricity: Customers can now access information and conduct transactions anytime/anywhere, whether on the Web, their smartphone or in a traditional store. The number of users accessing the Web from a mobile device is quickly escalating, and is expected to reach 7.6 billion by 2020, exceeding the current world population.8 The adage “the customer is king” is perhaps more true today than ever, as a bad customer experience can spread like wildfire over the Internet if not detected and corrected in near real-time. An increase in competition, coupled with the explosion in Internet con-nectivity and availability of mobile devices, has presented customers with a cornucopia of choices and increased their expectations for product availability and a strong digital experience. As a result, manufacturers today have little choice but to make their products and services available across multiple channels and devices while providing consistency of experience, service and information access.
On the plus side, intelligent data mining and analysis of social media information, among other technologies, now make it possible for manufacturers to obtain an unprecedented 360-degree view of their customers’ behavior and needs. According to our informed
6 KEEP CHALLENGING November 2015
In our experience, roughly a quarter of all manufacturing
organizations have a crowdsourcing/co-innovation
platform to fuel managed innovation, which has
become a key differentiator for leading players.

Strategy■ Top-down approach
■ Defined objectives
■ Budgeting
Execution■ Effective processes
■ Enabling technologies
Performance Management■ Target setting
■ Progress monitoring and accountability
A FRAMEWORK TO SPEED MANUFACTURING’S DIGITAL BUSINESS TRANSFORMATION 7
manufacturing study, roughly 70% of respondents had integrated social media and internal planning system data to inform customer sentiment analysis and enhance product research, development and planning.
Lenovo, for example, leverages advanced analytics9 for enhancing customer satisfac-tion and loyalty. It aggregates customer data from all sources, including social media, to provide a very high level of personalization via one-to-one customer relationships. This also enables the company to run extremely effective targeted marketing campaigns to maintain customer interest, from product announcement to release.
Understanding Manufacturing’s Imperatives Many manufacturers have taken an ad hoc approach to addressing these requirements. Many have implemented point solutions, while others are still grappling with where to start and what is relevant to them and their customers and partners. To assess and build effective digital capabilities, manufacturers need a comprehensive framework that spans these four mandates, as well as a structured method that helps formulate a strategy, lay out an execution process and develop comprehensive performance management for tracking progress (see Figure 2). This framework includes the following:
• Strategy and vision statements. A formal strategy statement is indicative of leader-ship buy-in and involvement and displays the requisite accountability and responsibility to drive success. A top-down approach to digital transformation ensures that funding is allocated for various initiatives, as well as successful adoption. For instance, in order
Pillars of Digital Excellence
Figure 2
Senior managers not only need to fund advanced analytics to generate insights from the vast volumes of operational data available on a modern shop floor, but they also need to guide and motivate the workforce to use these insights to improve productivity and efficiency.
8 KEEP CHALLENGING November 2015
to achieve operational excellence, senior managers not only need to fund advanced analytics to generate insights from the vast volumes of operational data available on a modern shop floor, but they also need to guide and motivate the workforce to use these insights to improve productivity and efficiency.
• Strategy execution. Systems and mechanisms must be in place to enable employees to work more effectively toward the goal. Technology needs to be leveraged for collabora-tion, visibility and efficiency. Take innovation, for example; co-innovation platforms must be utilized by innovation groups to organize activities for idea generation, shortlisting
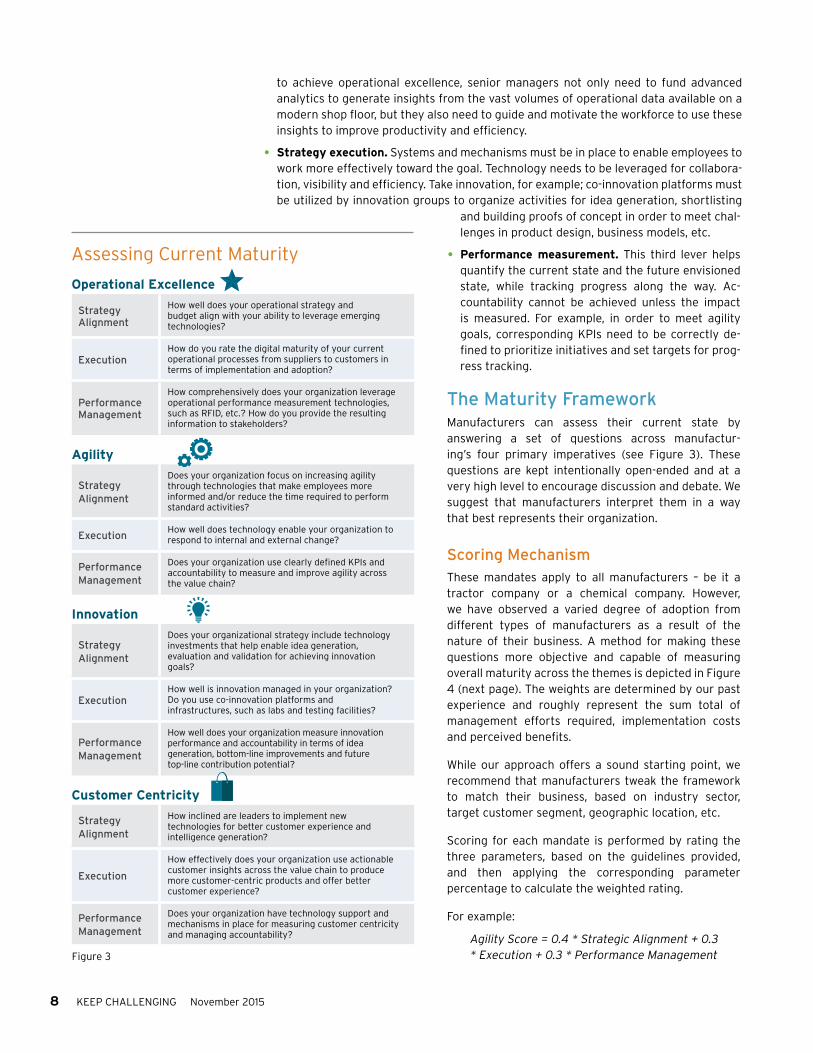
Assessing Current Maturity
Figure 3
Operational Excellence
Strategy Alignment
How well does your operational strategy and budget align with your ability to leverage emerging technologies?
ExecutionHow do you rate the digital maturity of your current operational processes from suppliers to customers in terms of implementation and adoption?
Performance Management
How comprehensively does your organization leverage operational performance measurement technologies, such as RFID, etc.? How do you provide the resulting information to stakeholders?
Agility
Strategy Alignment
Does your organization focus on increasing agility through technologies that make employees more informed and/or reduce the time required to perform standard activities?
ExecutionHow well does technology enable your organization to respond to internal and external change?
Performance Management
Does your organization use clearly defined KPIs and accountability to measure and improve agility across the value chain?
Innovation
Strategy Alignment
Does your organizational strategy include technology investments that help enable idea generation, evaluation and validation for achieving innovation goals?
ExecutionHow well is innovation managed in your organization? Do you use co-innovation platforms and infrastructures, such as labs and testing facilities?
Performance Management
How well does your organization measure innovation performance and accountability in terms of idea generation, bottom-line improvements and future top-line contribution potential?
Customer Centricity
Strategy Alignment
How inclined are leaders to implement new technologies for better customer experience and intelligence generation?
Execution
How effectively does your organization use actionable customer insights across the value chain to produce more customer-centric products and offer better customer experience?
Performance Management
Does your organization have technology support and mechanisms in place for measuring customer centricity and managing accountability?
and building proofs of concept in order to meet chal-lenges in product design, business models, etc.
• Performance measurement. This third lever helps quantify the current state and the future envisioned state, while tracking progress along the way. Ac-countability cannot be achieved unless the impact is measured. For example, in order to meet agility goals, corresponding KPIs need to be correctly de-fined to prioritize initiatives and set targets for prog-ress tracking.
The Maturity FrameworkManufacturers can assess their current state by answering a set of questions across manufactur-ing’s four primary imperatives (see Figure 3). These questions are kept intentionally open-ended and at a very high level to encourage discussion and debate. We suggest that manufacturers interpret them in a way that best represents their organization.
Scoring MechanismThese mandates apply to all manufacturers – be it a tractor company or a chemical company. However, we have observed a varied degree of adoption from different types of manufacturers as a result of the nature of their business. A method for making these questions more objective and capable of measuring overall maturity across the themes is depicted in Figure 4 (next page). The weights are determined by our past experience and roughly represent the sum total of management efforts required, implementation costs and perceived benefits.
While our approach offers a sound starting point, we recommend that manufacturers tweak the framework to match their business, based on industry sector, target customer segment, geographic location, etc.
Scoring for each mandate is performed by rating the three parameters, based on the guidelines provided, and then applying the corresponding parameter percentage to calculate the weighted rating.
For example:
Agility Score = 0.4 * Strategic Alignment + 0.3 * Execution + 0.3 * Performance Management

A FRAMEWORK TO SPEED MANUFACTURING’S DIGITAL BUSINESS TRANSFORMATION 9
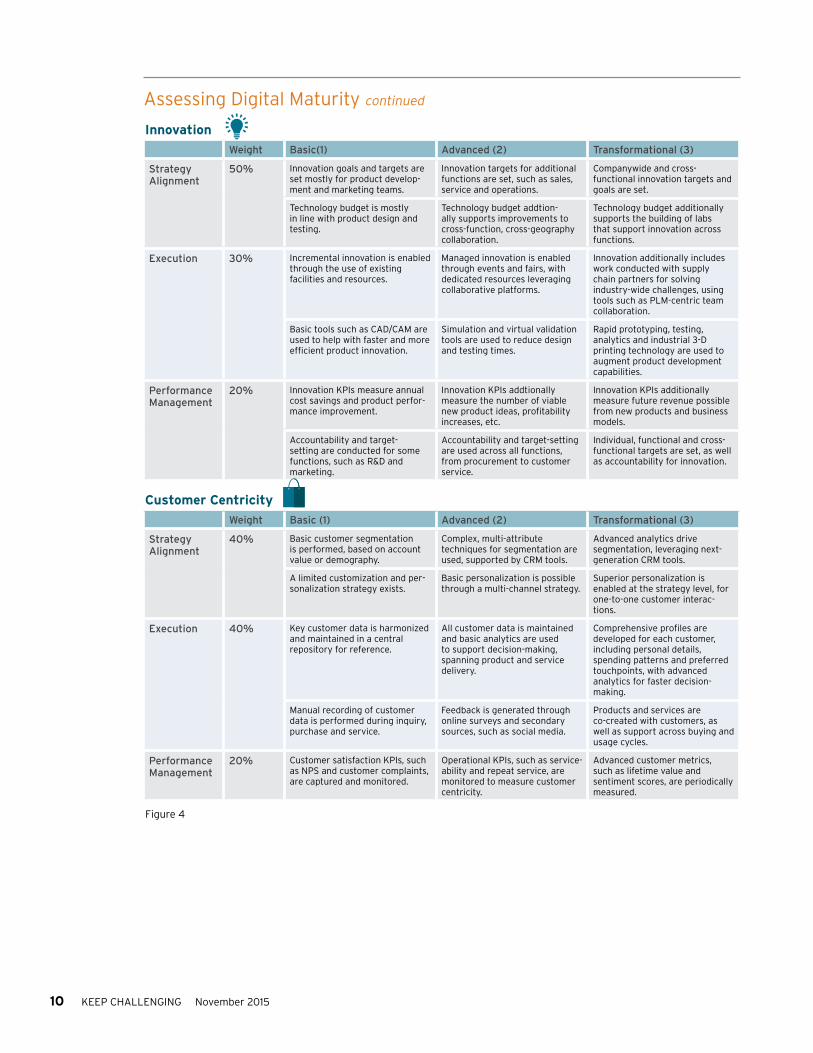
Assessing Digital MaturityScores are based on a scale from 1 to 3, where 1 represents least maturity, and 3 represents highest maturity.
Figure 4 continued on page 10
Operational Excellence
Weight Basic (1) Advanced (2) Transformational (3)
Strategy Alignment 30%
A digital operations strategy and vision is defined.
The digital operations strategy includes a department-specific list of digital initiatives.
For all digital initiatives, owners are identified, and implementa-tion timelines are defined.
Leaders communicate the operational strategy and review progress to motivate the workforce.
Leaders monitor improvements in process efficiencies, productiv-ity, etc. that result from any initiative.
Leaders assign responsibility to process owners for meeting targets and achieving ROI.
Execution 40%
Data is captured and stored in a central repository for root-cause analysis.
Operational data from the central repository is analyzed to define standard operating procedures, improve quality and reduce main-tenance costs.
Harmonized data from the central repository is analyzed in real-time to predict failures before they occur.
Engineering platforms assist managers in scheduling and performing operations based on orders and capacities.
Engineering platforms automati-cally schedule operations using predefined decision models.
Engineering platforms auto-matically schedule and perform activities, such as sequenced delivery of raw materials.
Performance Management 30%
Cost, quality and productivity data is manually collected and displayed.
Informed products automatically monitor performance data during manufacturing.
Performance data is collected and analyzed in real-time to generate deviation warnings and course-corrections.
Performance reports are generated for monthly reviews.
Dashboard-based performance data displays real-time updates and drill-downs.
Mobility and cloud solutions enable anytime/anywhere reporting and alerts.
Agility
Weight Basic (1) Advanced (2) Transformational (3)
Strategy Alignment 40%
Leadership is flexible to the changing business environment, but responses are mostly reactive.
Proactive measures are taken by leadership to handle changes based on internal and external information.
Leadership leverages advanced analytics and scenario analysis models to remain future-ready.
Customer-facing functions such as sales and service continuously evaluate new technologies for agility.
Upstream functions such as supply chain management have technology budgets to improve agility.
All functions, from product development to sales and service, invest in technologies to boost efficiency and improve response.
Execution 30%
Digital platforms enable periodic communication between downstream functions (such as sales) with upstream ones (such as manufacturing).
Digital platforms integrate all functions for demand and supply visibility within the organization.
A common platform includes upstream and downstream value chain partners, such as suppliers and retailers, for real-time information on sales, inventory, supplier excess capacity, etc.
Senior managers and key people in the organization leverage data to improve decision-making.
Almost everyone in the organiza-tion uses data and basic descrip-tive analytics.
A dedicated analytics team supports the organization with data analysis and insights generation.
Performance Management 30%
Business-level KPIs are used as an indicator for agility improve-ment as a result of technology implementation.
Specific agility KPIs, such as supply chain velocity and turnaround time, are used to prioritize investments and develop a digital roadmap.
Specific agility KPIs are used to prioritize investments and track progress.
Accountability exists only for implementation targets.
Accountability for improving specific agility KPIs exists at a function/department level.
Individual KPI ownership and accountability exists for achieving agility targets.
10 KEEP CHALLENGING November 2015
Innovation
Weight Basic(1) Advanced (2) Transformational (3)
Strategy Alignment
50% Innovation goals and targets are set mostly for product develop-ment and marketing teams.
Innovation targets for additional functions are set, such as sales, service and operations.
Companywide and cross- functional innovation targets and goals are set.
Technology budget is mostly in line with product design and testing.
Technology budget addtion-ally supports improvements to cross-function, cross-geography collaboration.
Technology budget additionally supports the building of labs that support innovation across functions.
Execution 30% Incremental innovation is enabled through the use of existing facilities and resources.
Managed innovation is enabled through events and fairs, with dedicated resources leveraging collaborative platforms.
Innovation additionally includes work conducted with supply chain partners for solving industry-wide challenges, using tools such as PLM-centric team collaboration.
Basic tools such as CAD/CAM are used to help with faster and more efficient product innovation.
Simulation and virtual validation tools are used to reduce design and testing times.
Rapid prototyping, testing, analytics and industrial 3-D printing technology are used to augment product development capabilities.
Performance Management
20% Innovation KPIs measure annual cost savings and product perfor-mance improvement.
Innovation KPIs addtionally measure the number of viable new product ideas, profitability increases, etc.
Innovation KPIs additionally measure future revenue possible from new products and business models.
Accountability and target-setting are conducted for some functions, such as R&D and marketing.
Accountability and target-setting are used across all functions, from procurement to customer service.
Individual, functional and cross-functional targets are set, as well as accountability for innovation.
Customer Centricity
Weight Basic (1) Advanced (2) Transformational (3)
Strategy Alignment
40% Basic customer segmentation is performed, based on account value or demography.
Complex, multi-attribute techniques for segmentation are used, supported by CRM tools.
Advanced analytics drive segmentation, leveraging next-generation CRM tools.
A limited customization and per-sonalization strategy exists.
Basic personalization is possible through a multi-channel strategy.
Superior personalization is enabled at the strategy level, for one-to-one customer interac-tions.
Execution 40% Key customer data is harmonized and maintained in a central repository for reference.
All customer data is maintained and basic analytics are used to support decision-making, spanning product and service delivery.
Comprehensive profiles are developed for each customer, including personal details, spending patterns and preferred touchpoints, with advanced analytics for faster decision-making.
Manual recording of customer data is performed during inquiry, purchase and service.
Feedback is generated through online surveys and secondary sources, such as social media.
Products and services are co-created with customers, as well as support across buying and usage cycles.
Performance Management
20% Customer satisfaction KPIs, such as NPS and customer complaints, are captured and monitored.
Operational KPIs, such as service-ability and repeat service, are monitored to measure customer centricity.
Advanced customer metrics, such as lifetime value and sentiment scores, are periodically measured.
Assessing Digital Maturity continued
Figure 4

A FRAMEWORK TO SPEED MANUFACTURING’S DIGITAL BUSINESS TRANSFORMATION 11
Assess
Plan
Recommend & Transform
Current-State Assessment and Competition Benchmarking
Recommendation Workshop
Roadmap Execution
Future State
Prioritization and Preparation of the Business Case
Roadmap Preparation
Operational Excellence
Customer Centricity
Agility
Innovation
Future State Definition
Competitive
Lean
Green
Reliable
Connected
Future state
Roadmap execution
Lowest Priority Moderate Priority
Moderate Priority Highest PriorityB C
(Bubble size represents implementation risk)BENEFIT
CO
ST
Gap Analysis
Identify limitations
Review system
Conceptualize solution
Validate
1
3 4
6 7
5
2
Using the FrameworkManufacturers can use this framework to either devise a transformation strategy themselves or hire a third-party to do so. Both approaches are covered in Figure 5.
Digital Transformation Approach
Figure 5

12 KEEP CHALLENGING November 2015
Phase 1: AssessThe first step entails thoroughly understanding both the as-is and to-be states of the orga-nization. This stage typically involves conducting several workshops and interviews with company stakeholders and external subject matter experts. Further, competitive analysis should be carried out with local and global players.
Competitive Benchmarking (Illustrative)
Envisioning the Future State (Illustrative)
Figure 6
Figure 7
4
2
1
1
1
1
2
2
3
1.5
1.5
1.5
1.5
2.5
2.5
2.5
2.5 0
0.5
1
1.5
2
2.5
3
Agility
Innovation Client
Benchmark
Business Excellence
Transformational
Operational Excellence
Customer Centricity
Supply chain visibility and flexibility
What-if scenarios and predictive analytics
Easy access to reliable and consolidated data for all
Crowdsourcing and co-innovation platforms
Collaborative operations planning and execution
Machine learning and prescriptive analytics
Omnichannel platform
Collaborative tools for faster NPD and process improvement
Tools for capturing VoC
Vendors & Supplier
Plant Operations & R&D Supply Chain &
Logistics
Sales & Marketing
Dealer & Customer
Experience Management
Senior Management Corporate
Functions
Operational Excellence
Customer Centricity
Agility
Innovation
• Current-state assessment and competition benchmarking: To get started, manufacturers must understand their current strengths and limitations, as well as how their digital capabilities compare with those of their competitors and best-in-class compa-nies. Figure 6 offers a high-level representation of the result of a typical competitor benchmarking and scoring exercise.
> Conduct due diligence: Understand and document current sys-tems and processes across the aforementioned industry man-dates through observation and user interviews; play it back to stakeholders for confirmation and approval.
> Identify comparable organizations: Select one or more direct competitors/best-in-class companies from across the globe to serve as a comparison.
> Complete benchmarking: Rate capabilities against benchmark/s across each theme depicted in the framework in order to gauge maturity levels.
• Future-state definition: This step involves defining digital capa-bilities across the themes as the end-state vision. The future-state vision is derived from the company vision, capability benchmark-ing, technological developments and industry best practices across the globe. Figure 7 provides a representation of an end-state vision at the conclusion of the assessment phase, with broad improve-ment areas highlighted with vision statements.
A FRAMEWORK TO SPEED MANUFACTURING’S DIGITAL BUSINESS TRANSFORMATION 13
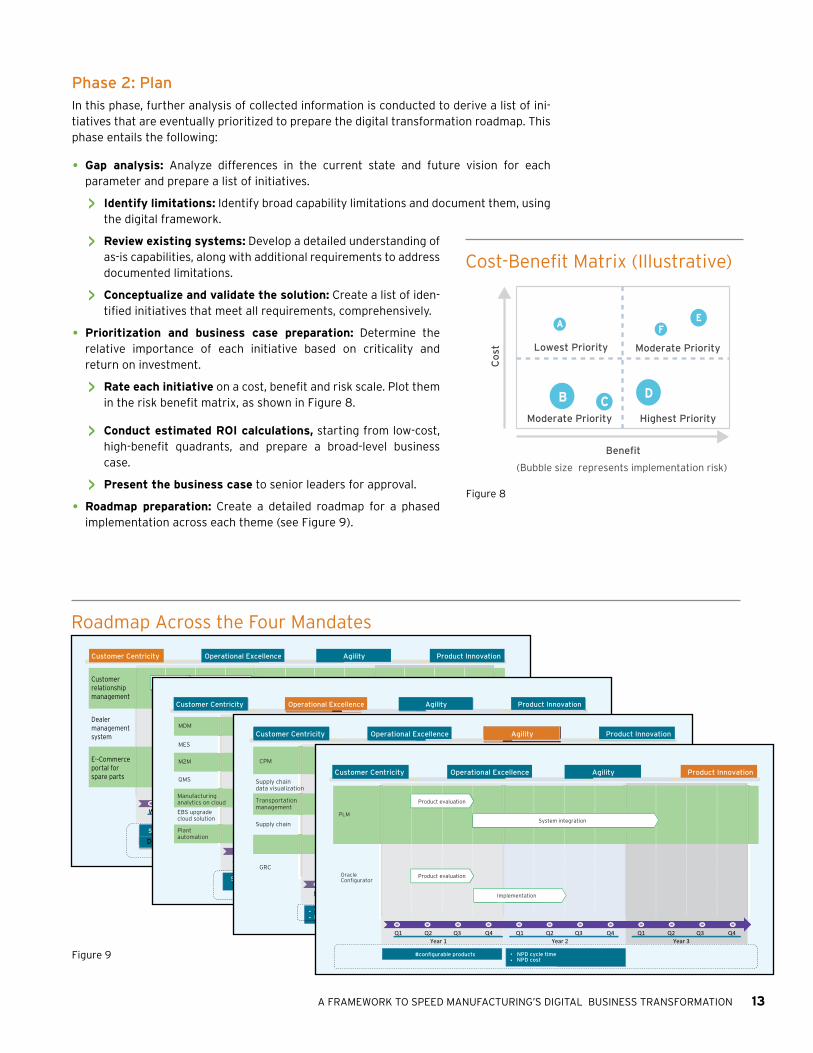
Phase 2: PlanIn this phase, further analysis of collected information is conducted to derive a list of ini-tiatives that are eventually prioritized to prepare the digital transformation roadmap. This phase entails the following:
• Gap analysis: Analyze differences in the current state and future vision for each parameter and prepare a list of initiatives.
> Identify limitations: Identify broad capability limitations and document them, using the digital framework.
> Review existing systems: Develop a detailed understanding of as-is capabilities, along with additional requirements to address documented limitations.
> Conceptualize and validate the solution: Create a list of iden-tified initiatives that meet all requirements, comprehensively.
• Prioritization and business case preparation: Determine the relative importance of each initiative based on criticality and return on investment.
> Rate each initiative on a cost, benefit and risk scale. Plot them in the risk benefit matrix, as shown in Figure 8.
> Conduct estimated ROI calculations, starting from low-cost, high-benefit quadrants, and prepare a broad-level business case.
> Present the business case to senior leaders for approval.
• Roadmap preparation: Create a detailed roadmap for a phased implementation across each theme (see Figure 9).
© 2014 Cognizant 7
WXs WYs WZs W[s WXs WYs WZs W[s WXs WYs WZs W[s\+/2sXs \+/2sYs \+/2sZs
Sales lead generation and conversion Cost of sales CustoM#"'1o$t*1ts'o$'so1?*>'M#%?*s
Customer Centricity Operational Excellence Agility Product Innovation
ut*5+t+$6/,($sD2(.4'6s+</54/,($s
Customerrelationshipmanagement
Customer data analyticsSocial CRM & analytics
ut*5+t+$6/,($s(;s#*/2+s*/26#s*(26/5s
U$=/$'+t+$6#s/$.sut*2(<+t+$6#s
D2(.4'6s+</54/,($s
Productevaluation
Implementation
Service and warranty costs
Parts sales through e-commerce
J4#6(t+2s5";+,t+s</54+s
Dealermanagementsystem
Dealer performance metrics
Customer satsifaction
E-‐Commerceportal forspare parts
Customer Centricity Operational Excellence Agility Product Innovation
© 2014 Cognizant 8
Q1 Q2 Q3 W[& WX& WY& WZ& W[& WX& WY& WZ& W[&Year 1 \+/2&Y& \+/2&Z&
• T'4"&)/7B#'"?+2)'."-%:1)&'• T'"#0-"G'U'&1"*.'• H-&)'-A'V:*>?),'
MES
M2M
Manufacturinganalytics on cloud
EBS upgradecloud solution
Plantautomation
QMS
MDM
:)*5+)+$6/,($&D2(.4'6&+</54/,($&
:)*5+)+$6/,($&
:)*5+)+$6/,($&
:)*5+)+$6/,($&/$.&2(55(46&
:)*5+)+$6/,($&
:)*5+)+$6/,($&
:)*5+)+$6/,($&
D2(.4'6&+</54/,($&
D2(.4'6&+</54/,($&
D2(.4'6&+</54/,($&
D2(.4'6&+</54/,($&
@62/6+%7&/$.&2(/.)/*&
Shop floor Manpower and MachineProductivity KPIs
• C*$:A*1):"?$+'1,1>#'7B#'
• M8#"*>>'1-$8#"&?-$'1-&)&'
Customer Centricity Operational Excellence Agility Product Innovation
© 2014 Cognizant 9
Q1 Q2 Q3 W[& WX& WY& WZ& W[& WX& WY& WZ& W[&Year 1 \+/2&Y& \+/2&Z&
••
Supply chaindata visualization
Supply chain
Transportationmanagement
CPM
GRC
:)*5+)+$6/,($&/$.&2(55(46&
:)*5+)+$6/,($&
:)*5+)+$6/,($&
:)*5+)+$6/,($&
!(55(46&
D2(.4'6&+</54/,($&
D2(.4'6&+</54/,($&
Product evaluation(planning, budgeting, forecasting
Product evaluation :)*5+)+$6/,($&
• J-"#1*&)'*11:"*1,'• M"%#"'A:>4>B#$)'T'
• H*&2')-'1*&2'1,1>#'7B#&• M8#"*>>'&:..>,'12*?$'1-&)&'
Transportation and logistics costsInventory levels
Customer Centricity Operational Excellence Agility Product Innovation
Q1 Q2 Q3 Q4Year 1
Q1 Q2 Q3 Q4Year 2
Q1 Q2 Q3 Q4Year 3
#configurable products
OracleConfigurator
PLM
Product evaluation
Product evaluation
System integration
Implementation
• NPD cycle timeNPD cost•
Product evaluation
Cost-Benefit Matrix (Illustrative)
Roadmap Across the Four Mandates
Figure 8
Figure 9
Lowest Priority Moderate Priority
Moderate Priority Highest Priority
B
A FE
DC
(Bubble size represents implementation risk)
Benefit
Cos
t

14 KEEP CHALLENGING November 2015
Phase 3: Recommend & ImplementThe final step includes:
• A recommendation workshop: Prepare a detailed business case (as depicted in Figure 10) for final budgetary approval. The business case should identify all revenue- and cost-related metrics that would be impacted by the digital transformation, calculating total implementation cost, agreeing upon improvement targets and arriving at the net business value gain. The detailed business case is presented to the key stakeholders (decision-makers), and concerns are cited and addressed. The workshop helps in final validation and user buy-in before implementation. Stakeholders also agree on imple-mentation timelines and risk mitigation measures for the transition.
Preparing a Business Case
Figure 10
SALES KPIs
PROCUREMENT
MAN-HOURS
Net business value
Total business value
Total cost of ownership
OPERATIONAL KPIs
Metrics impacting top line
Metrics impacting bottom line
Implementation expenses
• Execution: Finally, initiatives are implemented according to the roadmap, and progress is monitored until completion. Respective performance for the initiatives is continu-ously measured to assess impact.
Moving ForwardDigital technology has evolved at a rapid pace, and businesses are beginning to leverage the SMAC Stack by building new systems of engagement that act as a front end to legacy systems of record. Digital leaders already have a head start and are enjoying a significant competitive advantage.
As other manufacturers embark on a digital business transformation journey, or refine existing strategies, it is important for them to understand how they can maximize the impact of the new approach. SMAC Stack technologies are only a means to an end: enablement of a business process innovation or renovation. Fully adopting implemented technologies is critical to producing the business performance impact desired and, in turn, market relevance with partners and customers.
Our experience with digital transformation initiatives suggests that organizations should hold workshops for generating end-user buy-in, identify innovation leaders within various departments (and model their behaviors throughout the organization), and embrace change management techniques. Only then can manufacturers fully embrace digital business adoption and realize the resulting performance boost. A phased implementation roadmap, coupled with an adequate change management strategy, is critical to ensuring a successful transformation.
A FRAMEWORK TO SPEED MANUFACTURING’S DIGITAL BUSINESS TRANSFORMATION 15
Footnotes1 For additional insights, please read our white paper “Informed Manufacturing: The Next
Industrial Revolution,” April 2014, http://www.cognizant.com/InsightsWhitepapers/Informed-Manufacturing-The-Next-Industrial-Revolution.pdf.
2 Stephanie Overby, “Mercedes-AMG: A Showcase for Real-Time Business Decisions,” Forbes Insights, August 2014, http://www.forbes.com/forbesinsights/sap_mercedes/index.html.
3 Eric Fetters-Walp, “Chain Reaction: Boeing’s Supplier Management Works To Be More Effective, More Efficient — and Reduce Risks,” Boeing Frontiers, February 2011, http://www.boeing.com/news/frontiers/archive/2011/february/i_eot02.pdf.
4 “Dow Chemical Automates the Sample Process,” Oracle Corp., 2014, https://www.oracle.com/marketingcloud/content/documents/casestudies/dow-chemical-customer-success-oracle.pdf.
5 Amit Tiwari, “India’s Best Known Startup Story: The Journey of Flipkart,” Techstory, March 19, 2014, http://techstory.in/flipkart-story/.
6 “Paytm: Journey from Mobile Recharge to E-Commerce Market,” Delhi School of Internet Marketing, May 8, 2015, http://dsim.in/blog/case-study-paytm-journey-from-mobile-recharge-to-e-commerce-market/.
7 “3M: A Culture of Innovation,“ 3M, 2012, https://solutions.3m.com/3MContentRetrievalAPI/BlobServlet?lmd=1349327166000&locale=en_WW&assetType=MMM_Image&assetId=1319209959040&blobAttribute=ImageFile.
8 Anthony Hill, “Global Internet Users to Reach 7.6 Billion within the Next Five Years,” Broadband Choices, Sept. 23, 2014, http://www.broadbandchoices.co.uk/news/2014/09/global-internet-users-230914.
9 “Lenovo Orchestrates Messages across Channels to Drive Engagement,” Oracle Corp., https://www.oracle.com/marketingcloud/content/documents/casestudies/lenovo-custom-er-success-oracle.pdf.

16 KEEP CHALLENGING November 2015
AcknowledgmentsThe authors would like to thank Badrinath Setlur, Associate Vice-President, Cognizant Business Consulting, and Ganesh Dhulipati, Director, Manufacturing and Logistics Practice, for their guidance and support.
About the AuthorsArun Krishnan is a Director in Cognizant Business Consulting’s Discrete Manufacturing Practice. He has over 21 years of consulting experience throughout the manufacturing industry. He has led various projects in strategy consulting, process re-engineering, business analysis, problem struc-turing and solution development, program management and change management across diver-sified manufacturing and logistics companies. He earned his M.B.A. (PGDM) from IIM, Bangalore, and has a B-Tech in mechanical engineering from University of Calicut. He can be reached at [email protected] | https://www.linkedin.com/profile/view?id=22686378.
Gajanan Pujari is a Senior Consulting Manager within Cognizant Business Consulting’s Manufac-turing and Logistics Practice. He has 12-plus years of experience and has led multiple business consulting engagements in the areas of export sales distribution, supply chain analytics and IT portfolio rationalization for top automotive and industrial manufacturing companies. His areas of interest include the impact of IoT, digital and big data analytics technologies on the manufacturing industry. He holds an M.B.A. in analytical finance and operations management from the Indian School of Business (ISB), Hyderabad, and has a bachelor’s degree in production engineering from National Institute of Technology, Trichy, India. He can be reached at [email protected] | https://www.linkedin.com/profile/view?id=29549276.
Nirman Sarkar is a Consultant within Cognizant Business Consulting’s Manufacturing and Logistics Practice. He has five years of industry and consulting experience in value chain analysis and roadmapping, supply chain management, operations management and product development across the automotive and industrial products manufacturing industries. He holds an M.B.A. in finance and operations management from the Indian School of Business (ISB), Hyderabad, and has a bachelor’s degree in mechanical engineering from the National Institute of Technology, Durgapur, India. He can be reached at [email protected] | https://www.linkedin.com/profile/view?id=66782826.
World Headquarters500 Frank W. Burr Blvd.Teaneck, NJ 07666 USAPhone: +1 201 801 0233
Fax: +1 201 801 0243Toll Free: +1 888 937 3277
European Headquarters1 Kingdom Street
Paddington CentralLondon W2 6BD
Phone: +44 (0) 207 297 7600Fax: +44 (0) 207 121 0102
India Operations Headquarters#5/535, Old Mahabalipuram Road
Okkiyam Pettai, ThoraipakkamChennai, 600 096 India
Phone: +91 (0) 44 4209 6000Fax: +91 (0) 44 4209 6060
© Copyright 2015, Cognizant. All rights reserved. No part of this document may be reproduced, stored in a retrieval system, transmitted in any form or by any means, electronic, mechanical, photocopying, recording, or otherwise, without the express written permission from Cognizant. The information contained herein is subject to change without notice. All other trademarks mentioned herein are the property of their respective owners. 1614
About CognizantCognizant (NASDAQ: CTSH) is a leading provider of in-formation technology, consulting, and business process outsourcing services, dedicated to helping the world’s leading companies build stronger businesses. Headquar-tered in Teaneck, New Jersey (U.S.), Cognizant combines a passion for client satisfaction, technology innovation, deep industry and business process expertise, and a global, collaborative workforce that embodies the future of work. With over 100 development and delivery cen-ters worldwide and approximately 218,000 employees as of June 30, 2015, Cognizant is a member of the NAS-DAQ-100, the S&P 500, the Forbes Global 2000, and the Fortune 500 and is ranked among the top performing and fastest growing companies in the world. Visit us online at www.cognizant.com or follow us on Twitter: Cognizant.