Embed Size (px)
Citation preview

A Framework for Large Scale Use of Scanner Data in the Dutch CPI
Jan de Haan
Statistics Netherlands and Delft University of Technology
Ottawa Group, 20-22 May 2015

2
The basic idea
“Ideally, to make the production process as efficient as possible, a limited number of fully or semi-automated methods would be used. The purpose of this paper is to propose a framework supporting these plans. Our basic aggregation formula is what we refer to as a ‘quality-adjusted unit value index’, which is equal to the value index divided by a quantity index that is defined as the ratio of quality-adjusted or standardized quantities. Time dummy regression models play an important role in the estimation of the quality-adjustment (standardization) factors. There are two extreme cases. If information on all relevant item characteristics is available, then the use of time dummy hedonic models is preferred. When characteristics information is lacking, the use of time-product dummy (fixed-effects) models is proposed.”
(De Haan, 2015)
3
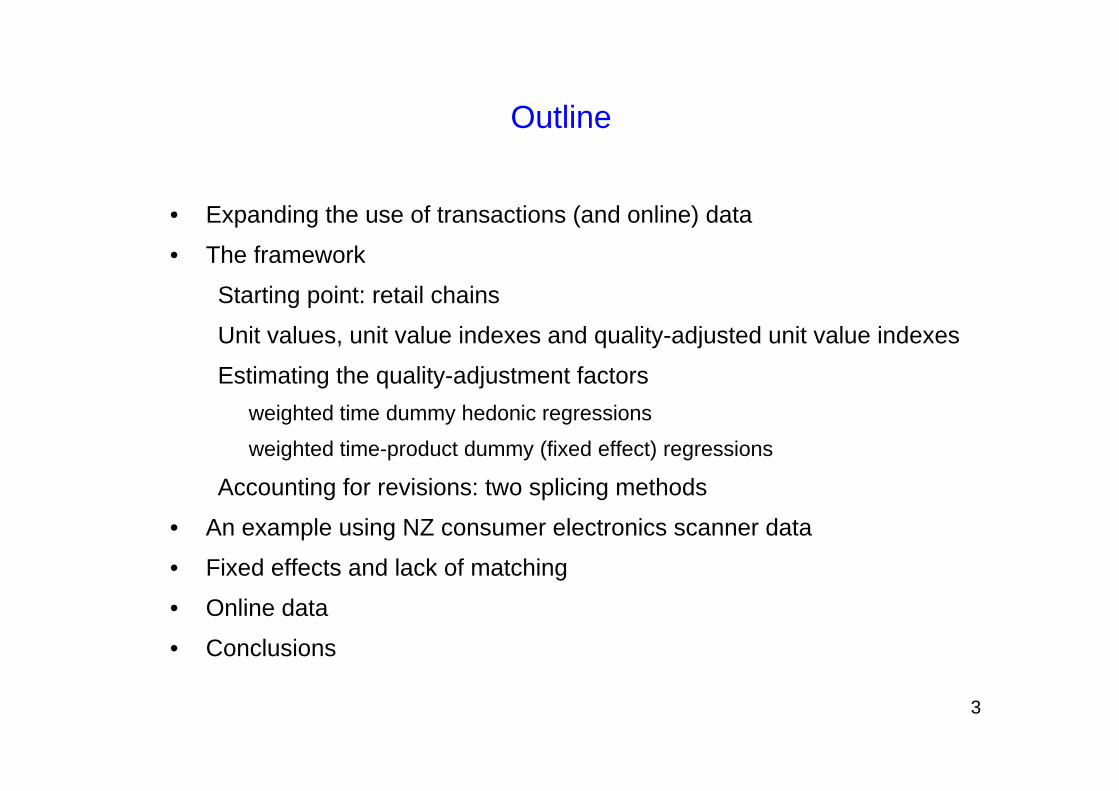
Outline
• Expanding the use of transactions (and online) data
• The framework
Starting point: retail chains
Unit values, unit value indexes and quality-adjusted unit value indexes
Estimating the quality-adjustment factorsweighted time dummy hedonic regressions
weighted time-product dummy (fixed effect) regressions
Accounting for revisions: two splicing methods
• An example using NZ consumer electronics scanner data
• Fixed effects and lack of matching
• Online data
• Conclusions

4
Expanding the use of transactions (and online) data
• Budget cuts - reduction of field price collection
• Expanding the use of ‘secondary data’ - new project just started
– scanner data provided by retail chains (supermarkets, drugstores, DIY stores, department stores, etc.)
– online data obtained through web-scraping
• New methods required
– Limited number of different methods
– Lower levels: trends more important than short-term changes
– Weighted (superlative-type) indexes
– Hedonic quality adjustment
• Focus on multilateral approaches; maximum use of matches in the data while being (approximately) free of chain drift

5
Retail chains and elementary aggregates
• Elementary aggregates: cross-classification of store types and product categories
• Each retail chain (and field collection) treated as a separate store type
• Product categories: COICOP classification at publication level
• Below lowest publication level: chain-specific elementary aggregates
• Typically a single price index method used for a particular chain (not required – type of product more important than type of chain)
• Most elementary price indexes currently unweighted
• Aggregation within and across chains: scanner data where possible
6
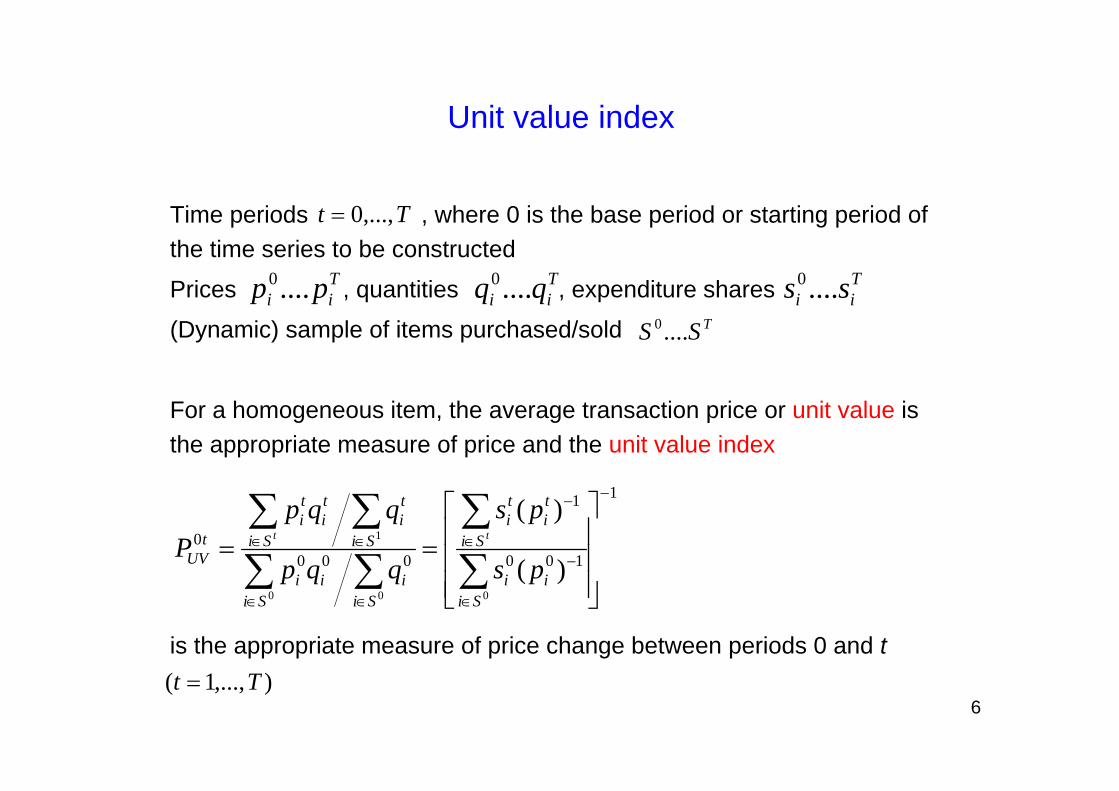
Unit value index
Time periods , where 0 is the base period or starting period of the time series to be constructed
Prices , quantities , expenditure shares
(Dynamic) sample of items purchased/sold
For a homogeneous item, the average transaction price or unit value is the appropriate measure of price and the unit value index
is the appropriate measure of price change between periods 0 and t
Tt ,...,0
Tii pp ....0 T
ii qq ....0 Tii ss ....0
1
100
1
0000
000
1
)(
)(
Siii
Si
ti
ti
Sii
Siii
Si
ti
Si
ti
ti
tUV ps
ps
qqp
qqpP tt
TSS ....0
),...,1( Tt
7
Quality-adjusted unit value index
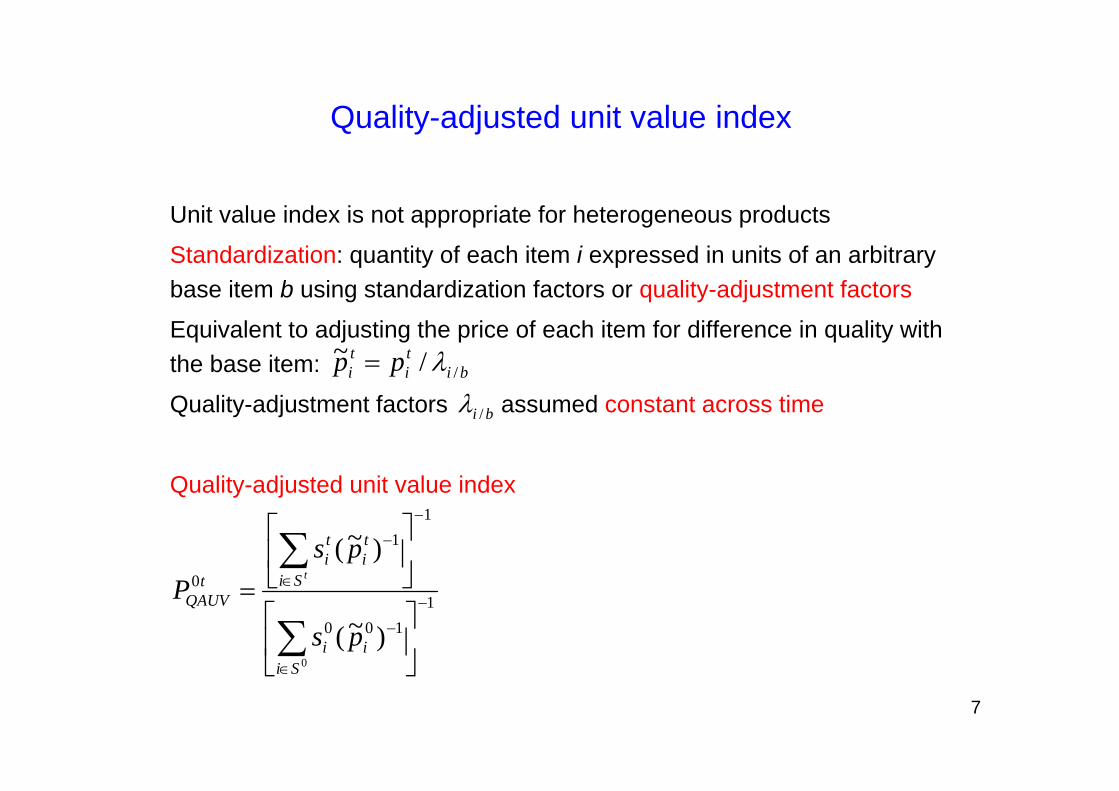
Unit value index is not appropriate for heterogeneous products
Standardization: quantity of each item i expressed in units of an arbitrary base item b using standardization factors or quality-adjustment factors
Equivalent to adjusting the price of each item for difference in quality with the base item:
Quality-adjustment factors assumed constant across time
Quality-adjusted unit value index
bi /
1100
11
0
0
)~(
)~(
Siii
Si
ti
ti
tQAUV
ps
psP
t
biti
ti pp //~
8
Quality-adjusted unit value index and quantity index
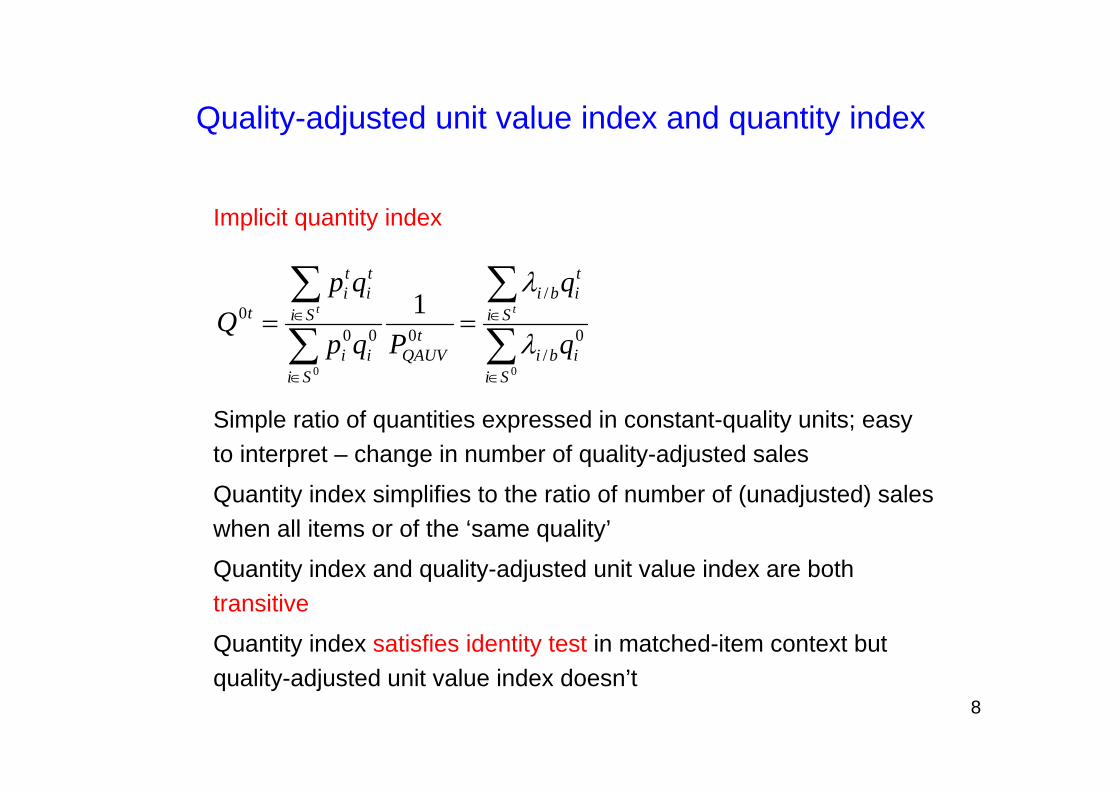
Implicit quantity index
Simple ratio of quantities expressed in constant-quality units; easy to interpret – change in number of quality-adjusted sales
Quantity index simplifies to the ratio of number of (unadjusted) sales when all items or of the ‘same quality’
Quantity index and quality-adjusted unit value index are both transitive
Quantity index satisfies identity test in matched-item context but quality-adjusted unit value index doesn’t
00
0/
/
0000 1
Siibi
Si
tibi
tQAUV
Siii
Si
ti
ti
t
q
q
Pqp
qpQ tt
9
Estimating the quality-adjustment factors
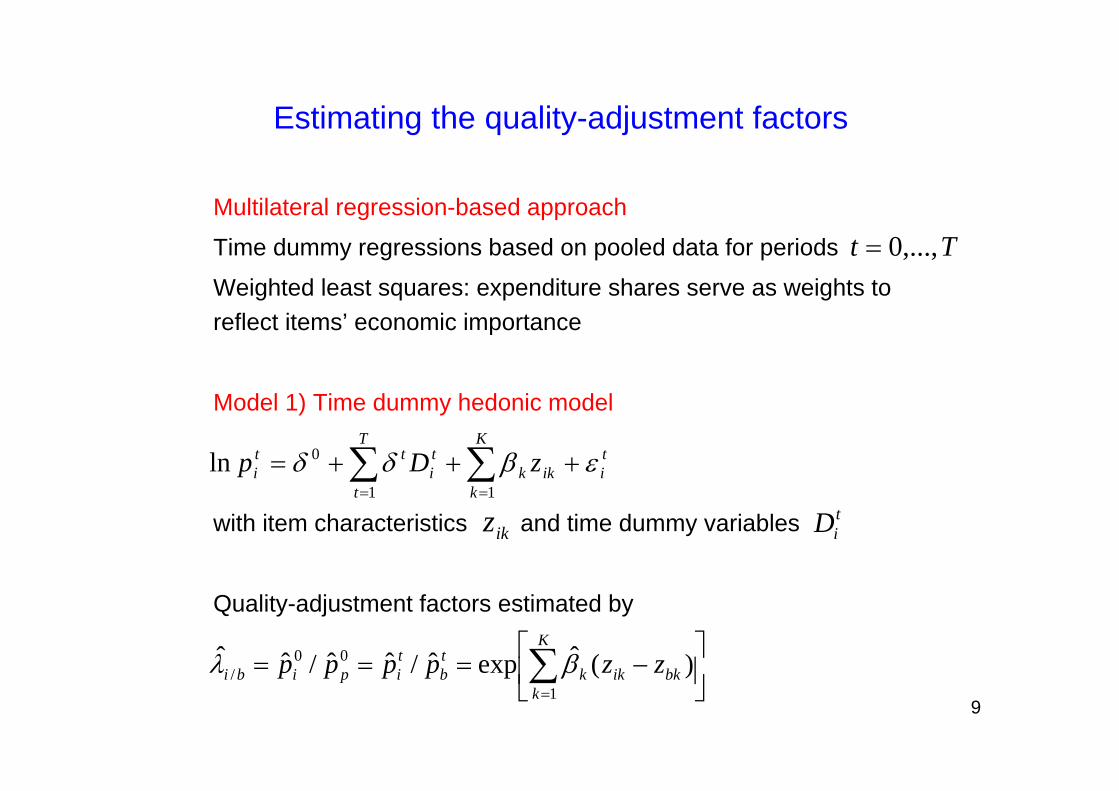
Multilateral regression-based approach
Time dummy regressions based on pooled data for periods
Weighted least squares: expenditure shares serve as weights to reflect items’ economic importance
Model 1) Time dummy hedonic model
with item characteristics and time dummy variables
Quality-adjustment factors estimated by
Tt ,...,0
tiik
K
kk
T
t
ti
tti zDp
11
0ln
ikz tiD
K
kbkikk
tb
tipibi zzpppp
1
00/ )(ˆexpˆ/ˆˆ/ˆˆ
10
Time dummy hedonic index
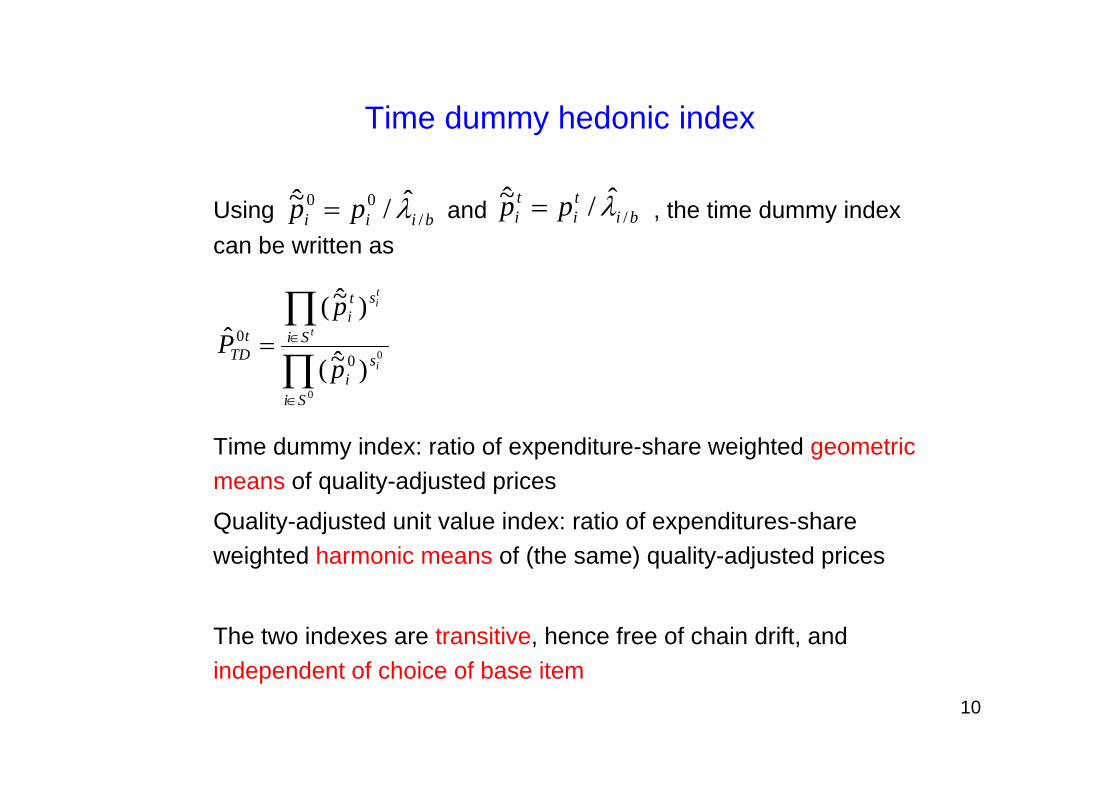
Using and , the time dummy index can be written as
Time dummy index: ratio of expenditure-share weighted geometric means of quality-adjusted prices
Quality-adjusted unit value index: ratio of expenditures-share weighted harmonic means of (the same) quality-adjusted prices
The two indexes are transitive, hence free of chain drift, and independent of choice of base item
0
0
)~̂(
)~̂(ˆ
00
Si
si
Si
sti
tTD
i
t
ti
p
pP
biii pp /00 ˆ/~̂ bi
ti
ti pp /
ˆ/~̂

11
Time dummy index and quality-adjusted unit value index
Relation between the two indexes
are regression residuals
Bracketed factor
- changes the ‘geometric quality-adjusted unit value index’ (i.e., the time dummy index) into the desired arithmetic quality-adjusted unit value index
- depends on variance of residuals and is expected to be very small
tSi
ti
ti
Siii
tTD
tQAUV us
usPP
)exp(
)exp(ˆˆ 0
00
00
)/ˆln( ti
ti
ti ppu
12
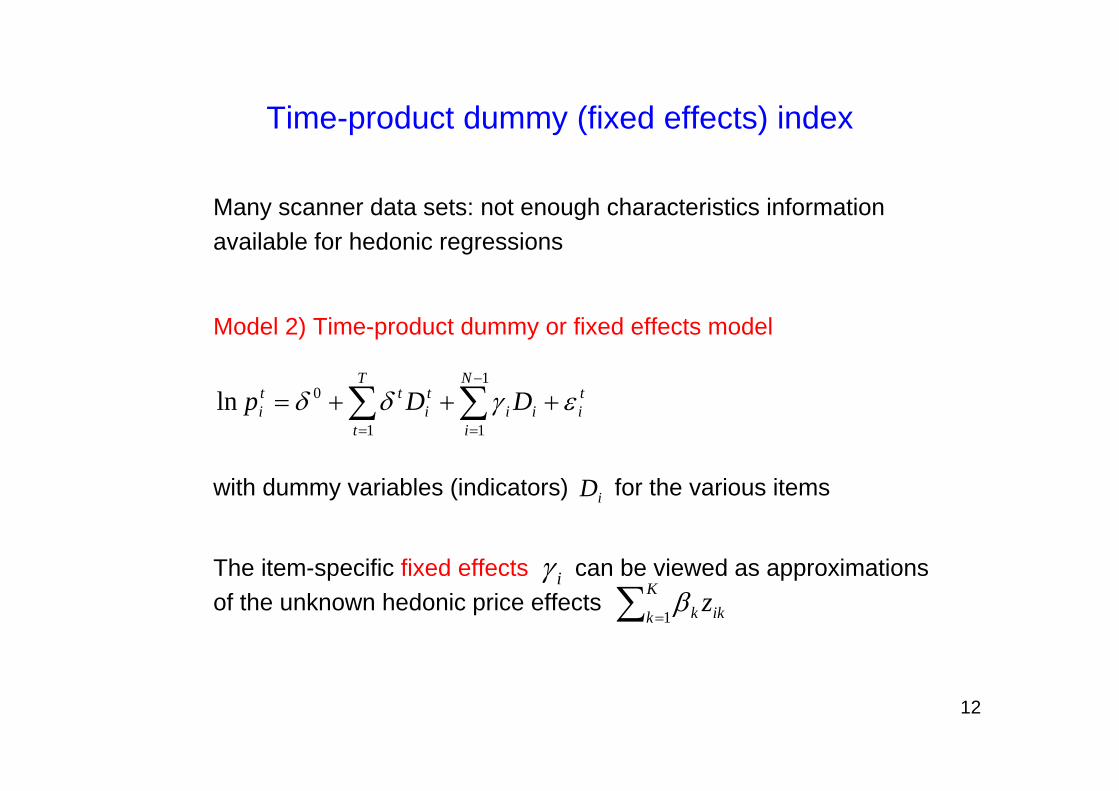
Time-product dummy (fixed effects) index
Many scanner data sets: not enough characteristics information available for hedonic regressions
Model 2) Time-product dummy or fixed effects model
with dummy variables (indicators) for the various items
The item-specific fixed effects can be viewed as approximations of the unknown hedonic price effects
ti
N
iii
T
t
ti
tti DDp
1
11
0ln
iD
i
K
k ikk z1

13
Time-product dummy (fixed effects) index
The time-product dummy or fixed effects (FE) model is a special case of the time dummy hedonic model, so
- same choice of regression weights (expenditure shares)
- similar relation with quality-adjusted unit value index
- TPD/FE index is transitive/free from chain drift
TPD/FE index
- might be called a quality-adjusted price index because it uses a form of ’overlap pricing’ for new and disappearing items
- needs at least two observations for an item to be non-trivially included; for example, new items in the last period (T) are not included!

14
Decomposition of time dummy hedonic and FE indexes
Because the weighted time dummy indexes are transitive, they can be written as chained period-on-period indexes
A single index movement can be decomposed as follows:
adjacent-period Tornqvist index
X
effect of disappearing items
X
effect of new items
X
‘residual factor’ (to make the chained index transitive)
15
Accounting for revisions
All multilateral indexes, including time hedonic, FE, and quality-adjusted unit value indexes, suffer from revisions
- when the sample period is extended and new data is added, the results for all periods will change
Rolling window approach
estimation window (fixed length) is moved forward and indexes (re-) estimated
Two issues:
- how should the estimates from the most recent window be linked to the existing time series, i.e. what is the preferred splicing method?
- what is the optimal window length?
16
Two splicing methods
Every splicing method impairs the transitivity property of multilateral price indexes, so chain drift in the linked time series cannot be completely ruled out
1) movement splice
after moving forward the window one month and re-estimating the model, the most recently estimated month-on-month movement of the index is spliced on to the existing time series
2) (Frances Krsinich’s) window splice
splices the entire newly estimated 13-month series on to the index level pertaining to 12 months ago
(by construction no chain drift in annual changes)
17
Two splicing methods
Movement splice is typically used for time dummy hedonic indexes (and GEKS indexes, an alternative multilateral approach with no characteristics information)
Window splice is probably more useful for FE indexes
Choice of estimation window length
- at least 5 quarters (or 13 months) to include strongly seasonal items
- not too long; assumption of fixed (underlying) characteristics parameters
With window splicing, the estimation window may differ from the splicing window

18
Quality-adjusted unit value indexes: an example
• New Zealand scanner data from market research company GfK
• Seven consumer electronics products
• Monthly data from mid-2008 to mid-2011
• Close to full coverage of New Zealand consumer market
• Items defined as unique combination of brand, model and available set of physical characteristics
• Data aggregated across outlet types
• High degree of churn (new and disappearing items)

19
Quality-adjusted unit value indexes: an example
• (Adjusted) R square values for WLS time dummy hedonic regressions range from 0.964 (DVD players) to 0.989 (portable media players)
• High R squares are partly due to aggregation over goods (barcodes) with identical characteristics
• We also estimated time dummy models using OLS, the resulting time dummy indexes and corresponding quality-adjusted unit value indexes
• (Adjusted) R squares for OLS regressions range from 0.859 to 0.913 (digital cameras)

20
Time dummy hedonic and quality-adjusted unit value indexes
0.3
0.4
0.5
0.6
0.7
0.8
0.9
1.0
1.1
1.2
Portable media players
TD (WLS) QAUV (WLS) TD (OLS) QAUV (OLS) RYQAUV
0.3
0.4
0.5
0.6
0.7
0.8
0.9
1.0
1.1
1.2
Digital cameras
TD (WLS) QUAV (WLS) TD (OLS) QUAV (OLS) RYQAUV
21
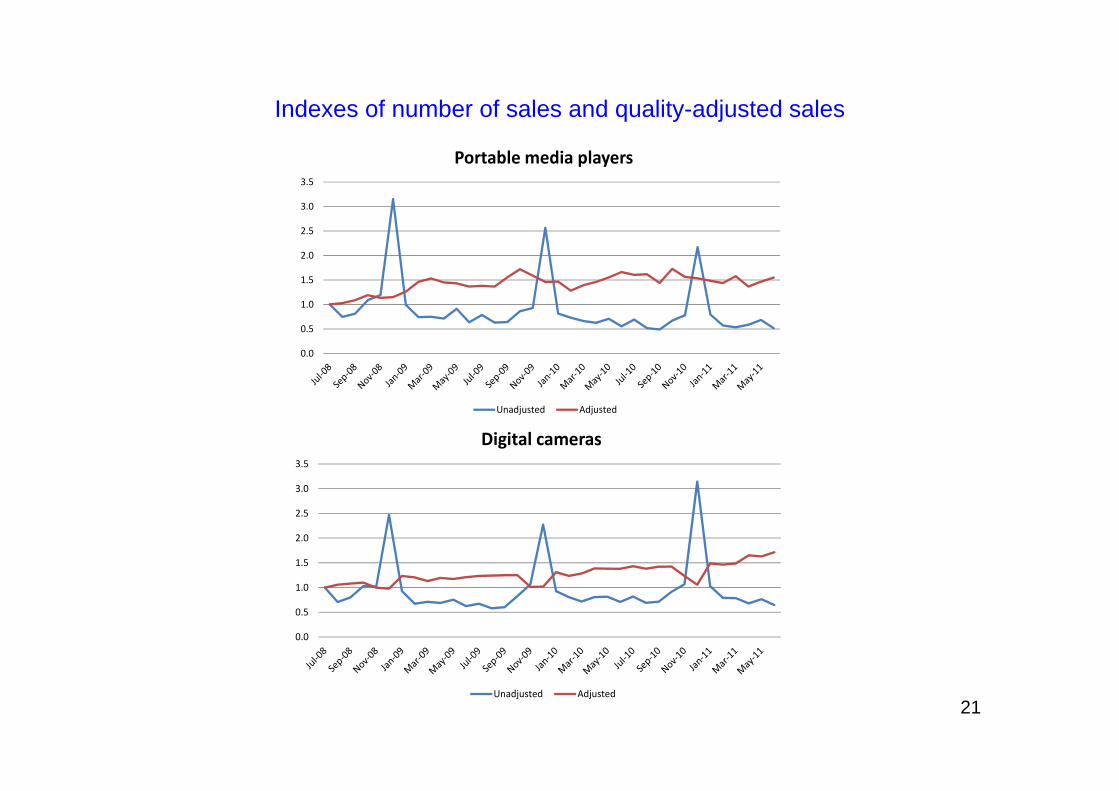
Indexes of number of sales and quality-adjusted sales
0.0
0.5
1.0
1.5
2.0
2.5
3.0
3.5
Portable media players
Unadjusted Adjusted
0.0
0.5
1.0
1.5
2.0
2.5
3.0
3.5
Digital cameras
Unadjusted Adjusted
22
Fixed effects and lack of matching
EAN (GTIN) can be too detailed to be useful as item identifier
- different EANs may relate to the ‘same’ item
- lack of matching over time
- rate of item churn overestimated
- hidden price changes will be missed in matched-model indexes, including FE indexes
Aggregating across EANs pertaining to the ‘same’ item required – in Australia: SKU
Not a big problem for time dummy hedonic indexes (although results will be increasingly model-based)

23
Online data
Prices collected from retailers’ websites via web scraping
Many issues involved
- coverage of items sold (websites versus physical stores)
- price differences between websites and stores?
- online versus offline purchases
- characteristics information?
- changes in websites
Quantities/expenditures are unobservable
- no unit values across the month or quarter, just ‘average prices’
- quality-adjusted unit values and weighted indexes not possible
24
Conclusions
Statistics Netherlands: increasing use of scanner data and online data
For efficiency reasons: limited number of fully or semi-automated methods
Regression-based methods most promising
- time dummy hedonic models (scanner data)
- time-product dummy / FE effects models (scanner data, online data)
Proposal: quality-adjusted unit value indexes rather than initial indexes (scanner data)
New project started – research and implementation; international collaboration?