Embed Size (px)
Citation preview

I am grateful to Clare Macallan for her assistance in drafting these remarks and to Nishat Anjum, Jack Meaning and Alexis Tessier for background research and analysis.
All speeches are available online at www.bankofengland.co.uk/news/speeches
1
A Framework for All Seasons? Speech given by
Mark Carney
Governor of the Bank of England
Bank of England Research Workshop on The Future of Inflation Targeting
9 January 2020

All speeches are available online at www.bankofengland.co.uk/news/speeches
2
2
Introduction
Following a chequered history of high and volatile inflation in the post-war era, the UK finally found monetary
success as an early adopter of inflation targeting in 1992. The UK’s current regime, launched in 1997,
delegated operational independence for setting monetary policy to the Bank of England and included many
institutional innovations that have stood the test of time – most notably a Monetary Policy Committee with a
mix of internal and external members; transparent, independent voting; and a clear accountability framework.
Since operational independence for inflation targeting was delegated to the MPC, there have been a raft of
improvements, both large and small. Transparency has steadily increased with initiatives ranging from
publishing detailed assumptions underlying forecasts ex ante to assessing forecast accuracy ex post as well
as the simultaneous release of Monetary Policy Summaries, Minutes, and Inflation Reports. More recently,
the MPC has introduced layered communications, with simpler, more accessible language and graphics to
reach the broadest possible audience, and we have launched the Monetary Policy Report in order to give
greater prominence to the most pressing issues shaping each monetary policy decision.
A major improvement to the inflation targeting framework itself was to confirm explicitly beginning with the
2013 remit that the MPC is required to have regard to trade-offs between keeping inflation at the target and
avoiding undesirably volatility in output. In other words, the MPC can use the full flexibility of inflation
targeting in the face of exceptionally large shocks to return inflation to target in a manner that provides as
much support as possible to employment and growth or, if necessary, promotes financial stability.
Even more fundamentally, the lessons of the global financial crisis prompted a radical overhaul of the Bank’s
broader policy framework. The crisis exposed the limits of inflation targeting itself, notably how a healthy
focus on price stability could become a dangerous distraction. Central banks had won the war against
inflation only to lose the peace as financial vulnerabilities built remorselessly during the Great Moderation.
Price stability clearly is not a guarantee of financial stability.
With the deficiencies of the Tripartite regime1 on full and painful display, the decision was taken in 2012 to
give the Bank of England responsibility for macroprudential and microprudential supervision. Two new
independent committees, the FPC and the PRC, were created and charged with maintaining financial
stability and safety and soundness of banks and insurers, respectively. In 2016, these committees were
placed on equal footing with the MPC, underscoring the symbiotic roles that all three play in underpinning
confidence in money and in promoting the best possible macro-economic outcomes.2 Any consideration of
1 In 1997, then Chancellor Gordon Brown put in place a new system for financial regulation, with responsibility shared by three institutions. The Bank of England was given responsibility for financial stability; the FSA was responsible for regulating individual banks; and the Treasury dealt with legislation. This arrangement became known as the “Tripartite”. 2 In addition to the Monetary Policy, Financial Policy and Prudential Regulation Committees, the Bank is responsible for the issuance of bank notes, provides the foundations of the payments system through RTGS, regulates systemic financial market infrastructure, and has powers and facilities to provide wide range of liquidity to banks and other financial institutions in order to promote the continuous functioning of the financial system during shocks. Other institutions that support confidence in the currency include legal tender status (meaning that you cannot be sued for non-payment of debts if you offer sterling to meet them) and the insurance of deposits of up to £85,000 at banks and building societies backed by the Government.

All speeches are available online at www.bankofengland.co.uk/news/speeches
3
3
the UK’s monetary policy framework must take into account this unique and highly effective institutional
structure.
To set the stage for today’s discussions, I would like to do two things. First, I will review the conduct and
performance of inflation targeting during my time as Governor. This period, which roughly coincides with the
post-crisis recovery and which has seen more than its share of shocks and structural developments,
provides some insights to the ability of inflation targeting to deliver price stability and support macroeconomic
outcomes. I will suggest that, so far at least, inflation targeting has proven to be a framework for all seasons,
an essential part of a robust foundation for economic prosperity.
It is important not to lose sight of the fundamental success in achieving price stability that has resulted from
delegation of inflation targeting to an independent central bank. In the two decades prior to independence,
inflation averaged over 6%. Since independence, it has been close to 2% and one-fifth as volatile (Table 1).
Inflation expectations have remained well anchored throughout some of the largest economic shocks in post-
war history.
Table 1: Inflation lower and less volatile since MPC independence
Annual CPI
Inflation Inflation volatility
Four-quarter
GDP growth
Four-quarter GDP
growth volatility
Unemployment rate
Real wage
growth
Pre-inflation targeting (1972-1992)
9.0 5.4 2.2 2.9 7.8 0.8
Start of inflation targeting to MPC independence (1993 – 1997 Q2)
2.3 0.4 2.9 0.7 9.0 0.3
MPC independence to crisis
(1997Q3 –2007)
1.6 0.5 3.0 0.9 5.4 0.7
2008 – end 2012 3.3 1.0 0.0 2.7 7.4 -0.3
2013 – present 1.7 1.0 2.0 0.5 5.1 0.2
The bar for change to the regime is very high. But while the inflation targeting regime has generally served
the UK well since its adoption, it would be Fukuyama-esque to declare it the end of monetary history. In the
second part of my remarks therefore I would like to raise some structural challenges to monetary policy that
favour careful consideration.
Inflation targeting may have proven to be the framework for all seasons, but what if the climate is changing?

All speeches are available online at www.bankofengland.co.uk/news/speeches
4
4
Could deep structural changes in our economies reduce the effectiveness of the regime? Is it possible that
political economy considerations could complicate the management of monetary policy? And could these
developments merit either a substantial adjustment to inflation targeting or even the adoption of a different
monetary policy framework in the years ahead?
In what follows, I will not presume to give the answers but would suggest that a careful and deliberate
research review of the UK’s monetary policy framework is warranted. That’s why my colleagues and I look
forward to the contributions of the distinguished group assembled here today. And it’s why the Bank will
conduct a dedicated research programme over the next year, joining many of our peers around the world in
similar exercises.3 At a minimum, as I advocated in my parliamentary testimony prior to joining the Bank,4
open, periodic reviews reinforce the legitimacy and acceptance of this vital component of the UK’s
macroeconomic landscape.
Let me begin by reviewing how inflation targeting has performed in recent years.
I. Monetary “Spring” – Securing the recovery
When I joined the Bank, a long economic winter of discontent was finally beginning to thaw. Throughout
most of 2011 and 2012, UK GDP growth (at around 1½%) had languished well below its pre-crisis trend (of
close to 3%), and unemployment was about 8%. But by mid-2013, there were signs of a nascent recovery:
four-quarter growth had picked up above 2%, and the unemployment rate fell to 7.7%, its joint lowest level
since early 2009 (Charts 1a and 1b). The timing and pace of the recovery had caught most unawares.
Chart 1: Signs of a nascent recovery by mid-2013
a) Swathe of survey indicators of quarterly UK GDP growth
Sources: IHS Markit/CIPS, BCC and CBI, Bank calculations.
3 In the US, the Federal Reserve is conducting a broad review of the strategy, tools, and communication practices it uses to pursue its monetary policy goals; the Bank of Canada is assessing a broad range of monetary policy frameworks ahead of its renewal in 2021 of the inflation-control agreement; and President Lagarde announced that the ECB will undertake a strategic review, which will include an assessment of monetary policy strategy and the operational framework. 4 Available at https://www.parliament.uk/documents/commons-committees/treasury/carney-pdf-TC-07-02-13.pdf.
-2.0
-1.5
-1.0
-0.5
0.0
0.5
1.0
2009 2010 2011 2012 2013
Percentage change on previous quarter
All speeches are available online at www.bankofengland.co.uk/news/speeches
5
5
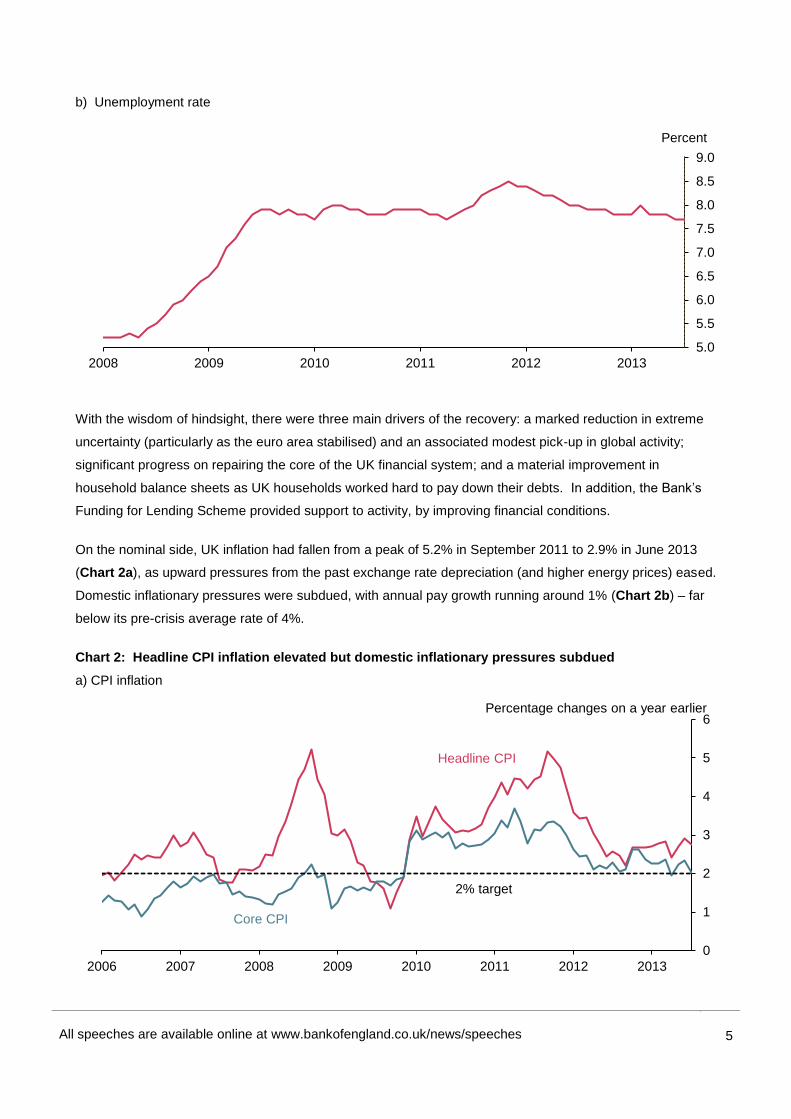
b) Unemployment rate
With the wisdom of hindsight, there were three main drivers of the recovery: a marked reduction in extreme
uncertainty (particularly as the euro area stabilised) and an associated modest pick-up in global activity;
significant progress on repairing the core of the UK financial system; and a material improvement in
household balance sheets as UK households worked hard to pay down their debts. In addition, the Bank’s
Funding for Lending Scheme provided support to activity, by improving financial conditions.
On the nominal side, UK inflation had fallen from a peak of 5.2% in September 2011 to 2.9% in June 2013
(Chart 2a), as upward pressures from the past exchange rate depreciation (and higher energy prices) eased.
Domestic inflationary pressures were subdued, with annual pay growth running around 1% (Chart 2b) – far
below its pre-crisis average rate of 4%.
Chart 2: Headline CPI inflation elevated but domestic inflationary pressures subdued
a) CPI inflation
5.0
5.5
6.0
6.5
7.0
7.5
8.0
8.5
9.0
2008 2009 2010 2011 2012 2013
Percent
0
1
2
3
4
5
6
2006 2007 2008 2009 2010 2011 2012 2013
Headline CPI
Percentage changes on a year earlier
Core CPI
2% target

All speeches are available online at www.bankofengland.co.uk/news/speeches
6
6
b) Whole economy regular pay growth
With output only having just returned to its pre-crisis peak and unemployment still several percentage points
above any reasonable estimates of its equilibrium rate, the MPC judged that there was a large amount of
spare capacity in the UK economy, and significant scope for aggregate demand to increase consistent with
inflation returning sustainably to the 2% target.
But the exact extent of slack was more uncertain than usual. Productivity had fallen alongside activity during
the recession, and its reported growth had been anaemic since, averaging around half its pre-crisis rate
(Chart 3). The MPC judged that slow productivity growth was partly a result of the post-crisis weakness in
the banking system, which had been restricting the reallocation of capital and labour.5 It was not clear how
quickly productivity growth might return to pre-crisis rates as demand recovered and financial intermediation
returned to normal. But old habits die hard, there was an (ultimately misplaced) optimism that productivity
growth would pick up sharply.
Chart 3: Productivity growth anaemic post-crisis
5 Whereas half of all productivity growth at the economy-wide level in the years prior to 2008 occurred through this channel, reallocation appeared to make no contribution to productivity growth around this time. See Barnett, A, Barriel, M, Chiu, A Franklin, F (2014), “The Productivity Puzzle: Firm-Level Perspectives,” Bank of England Working Paper.
0.0
0.5
1.0
1.5
2.0
2.5
3.0
3.5
4.0
4.5
5.0
2006 2007 2008 2009 2010 2011 2012 2013
Percent
100
102
104
106
108
110
112
114
116
118
2001 2002 2003 2004 2005 2006 2007 2008 2009 2010 2011 2012 2013
Index: 2001 Q1 = 100
All speeches are available online at www.bankofengland.co.uk/news/speeches
7
7
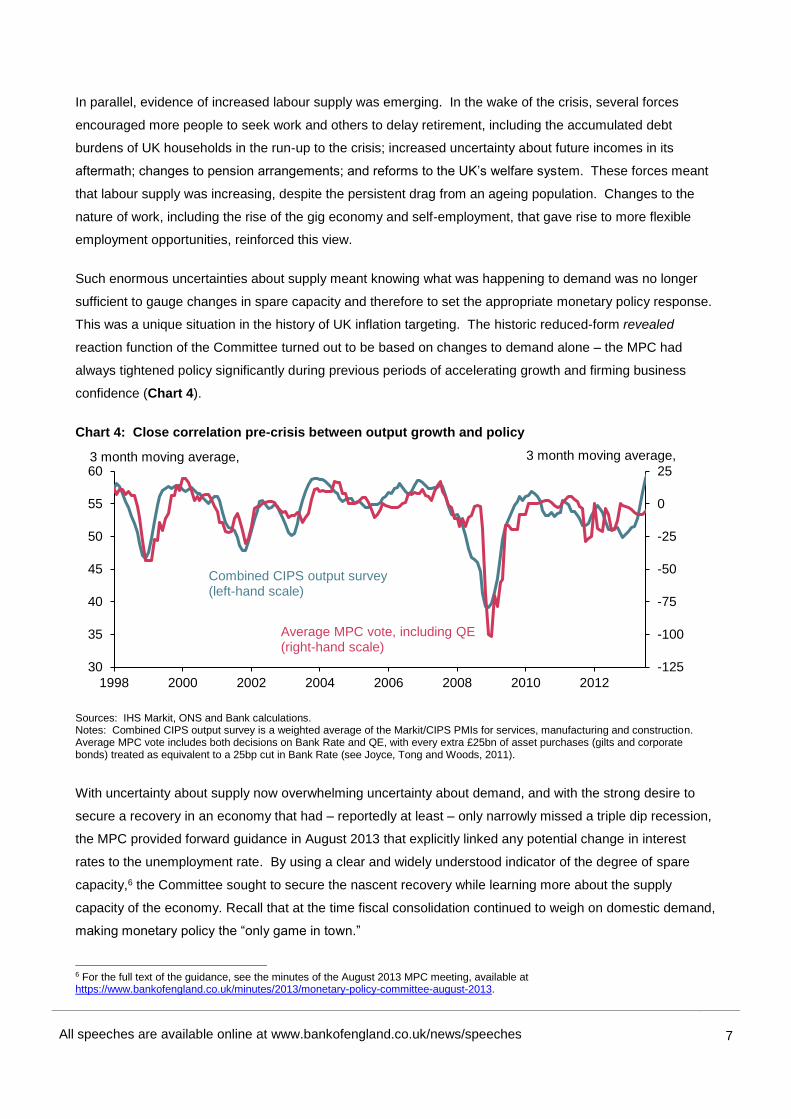
In parallel, evidence of increased labour supply was emerging. In the wake of the crisis, several forces
encouraged more people to seek work and others to delay retirement, including the accumulated debt
burdens of UK households in the run-up to the crisis; increased uncertainty about future incomes in its
aftermath; changes to pension arrangements; and reforms to the UK’s welfare system. These forces meant
that labour supply was increasing, despite the persistent drag from an ageing population. Changes to the
nature of work, including the rise of the gig economy and self-employment, that gave rise to more flexible
employment opportunities, reinforced this view.
Such enormous uncertainties about supply meant knowing what was happening to demand was no longer
sufficient to gauge changes in spare capacity and therefore to set the appropriate monetary policy response.
This was a unique situation in the history of UK inflation targeting. The historic reduced-form revealed
reaction function of the Committee turned out to be based on changes to demand alone – the MPC had
always tightened policy significantly during previous periods of accelerating growth and firming business
confidence (Chart 4).
Chart 4: Close correlation pre-crisis between output growth and policy
Sources: IHS Markit, ONS and Bank calculations. Notes: Combined CIPS output survey is a weighted average of the Markit/CIPS PMIs for services, manufacturing and construction. Average MPC vote includes both decisions on Bank Rate and QE, with every extra £25bn of asset purchases (gilts and corporate bonds) treated as equivalent to a 25bp cut in Bank Rate (see Joyce, Tong and Woods, 2011).
With uncertainty about supply now overwhelming uncertainty about demand, and with the strong desire to
secure a recovery in an economy that had – reportedly at least – only narrowly missed a triple dip recession,
the MPC provided forward guidance in August 2013 that explicitly linked any potential change in interest
rates to the unemployment rate. By using a clear and widely understood indicator of the degree of spare
capacity,6 the Committee sought to secure the nascent recovery while learning more about the supply
capacity of the economy. Recall that at the time fiscal consolidation continued to weigh on domestic demand,
making monetary policy the “only game in town.”
6 For the full text of the guidance, see the minutes of the August 2013 MPC meeting, available at https://www.bankofengland.co.uk/minutes/2013/monetary-policy-committee-august-2013.
-125
-100
-75
-50
-25
0
25
30
35
40
45
50
55
60
1998 2000 2002 2004 2006 2008 2010 2012
3 month moving average, 3 month moving average,
Combined CIPS output survey (left-hand scale)
Average MPC vote, including QE (right-hand scale)

All speeches are available online at www.bankofengland.co.uk/news/speeches
8
8
The message the Committee gave UK households and businesses was simple: the MPC would not even
think about tightening policy at least until the unemployment rate had fallen below 7%, consistent with the
creation of around three quarter of a million jobs. We reassured households and businesses that, after five
difficult years, the recovery would not be choked off prematurely.
On the basis of this past behaviour, the MPC would have raised interest rates by 2 to 3 percentage points
between August 2013 and the end of 2014 (Chart 5). For anyone who might suggest the MPC should have
followed its historic reaction function (and several external commentators did at the time7), note that, even on
unchanged policy, CPI inflation in the summer of 2016 was running at only about ½% and core CPI inflation
around 1¼%.
Chart 5: Forward market interest rates rose only modestly as unemployment fell quickly towards 7%
Sources: Bloomberg Finance L.P., IHS Markit, ONS and Bank calculations.
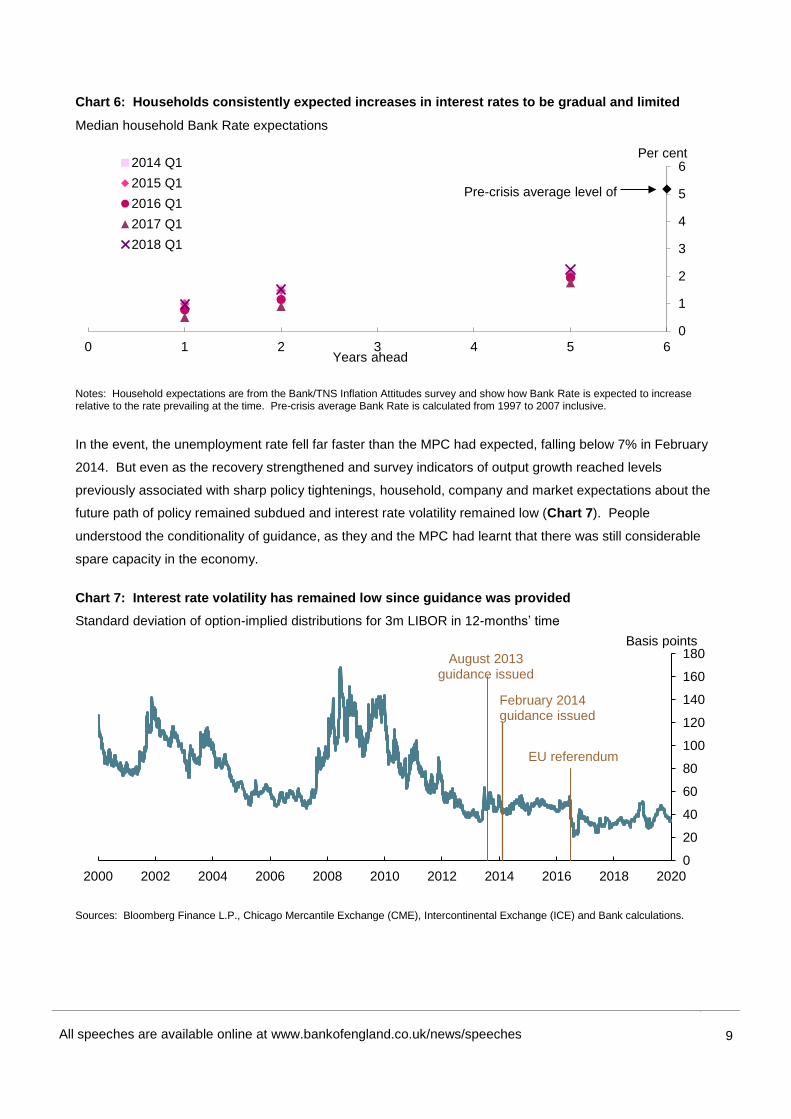
In an environment of strengthening domestic activity and some external exhortations to raise interest rates,
forward guidance was effective in managing expectations. Surveys conducted in the months that followed its
introduction indicated high awareness among companies, with almost half reporting that they expected Bank
Rate to remain at low levels for longer than they would have done had guidance not been in place. And the
majority of businesses said that the Bank’s policy guidance had made them more confident about UK
economic prospects. Household expectations also shifted markedly in favour of fewer and later rate
increases (Chart 6).8 In parallel, household and business confidence continued to strengthen, reinforcing
the economic momentum.
7 For example, the IEA’s Shadow Monetary Policy Committee voted for higher rates at all of its fourteen meetings between November 2013 and December 2014. 8 For more information, see the box on page 12 of the February 2014 Inflation Report.
August 2013 guidance issued
February 2014 guidance issued
0.0
0.5
1.0
1.5
2.0
2.5
3.0
3.5
4.0
Jan. 12 Jul. 12 Jan. 13 Jul. 13 Jan. 14 Jul. 14
Percent
Counterfactual path for Bank Rate based on historic correlation with survey indicators of output growth
UK 1 year instantenous forward
Data published showing unemployment fell to 6.9%
All speeches are available online at www.bankofengland.co.uk/news/speeches
9
9
Chart 6: Households consistently expected increases in interest rates to be gradual and limited
Median household Bank Rate expectations
Notes: Household expectations are from the Bank/TNS Inflation Attitudes survey and show how Bank Rate is expected to increase relative to the rate prevailing at the time. Pre-crisis average Bank Rate is calculated from 1997 to 2007 inclusive.
In the event, the unemployment rate fell far faster than the MPC had expected, falling below 7% in February
2014. But even as the recovery strengthened and survey indicators of output growth reached levels
previously associated with sharp policy tightenings, household, company and market expectations about the
future path of policy remained subdued and interest rate volatility remained low (Chart 7). People
understood the conditionality of guidance, as they and the MPC had learnt that there was still considerable
spare capacity in the economy.
Chart 7: Interest rate volatility has remained low since guidance was provided
Standard deviation of option-implied distributions for 3m LIBOR in 12-months’ time
Sources: Bloomberg Finance L.P., Chicago Mercantile Exchange (CME), Intercontinental Exchange (ICE) and Bank calculations.
0
1
2
3
4
5
6
0 1 2 3 4 5 6
2014 Q1
2015 Q1
2016 Q1
2017 Q1
2018 Q1
Per cent
Pre-crisis average level of
Years ahead
0
20
40
60
80
100
120
140
160
180
2000 2002 2004 2006 2008 2010 2012 2014 2016 2018 2020
Basis points
August 2013 guidance issued
February 2014 guidance issued
EU referendum

All speeches are available online at www.bankofengland.co.uk/news/speeches
10
10
The improved transparency of the inflation targeting framework also promoted this smooth learning process
about the supply side that helped maximise economic outcomes. Starting in 2014, the MPC began carrying
out a stocktake of the supply side of the economy each year, publishing its best collective judgments on the
natural rate of unemployment, the output gap, as well as the expected growth in productivity, labour supply
and potential output.9 As part of these exercises, the MPC revised down its (hitherto private) estimate of
equilibrium unemployment rate from 6½% in August 2013 to 5½% in August 2014,10 though it also judged
that spare capacity in the UK economy was gradually being used up as demand was growing rapidly while
supply growth was still subdued.
In short, spring was gradually turning to summer.
II. Summer – Supporting the expansion
By the end of 2014, the challenge for the MPC had become to keep the economy on this path to a long
economic summer by setting policy to return the level of output to potential and total CPI inflation sustainably
to the 2% target.
The MPC recognised that achieving this trajectory as the headwinds to demand following the crisis continued
to fade would likely require some tightening in monetary policy.
But how much? During the pre-crisis inflation targeting era, Bank Rate had averaged 5¾%, and the
equilibrium real interest rate was generally thought to be around 3¾%. Early in 2014, the Committee
concluded that the equilibrium interest rate – the level of the real policy rate that, if allowed to prevail for
several years, would place economic activity at its potential and keep inflation low and stable – had fallen
significantly.11 This equilibrium rate, r*, is determined not by central banks, but by the real, fundamental
factors driving desired savings and investment. For an open economy like the UK, those factors will reflect
global influences as well as domestic ones.12
Both long and shorter-term factors have contributed to the fall in equilibrium interest rates. In recent
decades, a set of powerful structural forces has been pushing down global r* – including demographic
change, slower potential growth, a larger left-hand tail in the distribution of economic outcomes, and the
increased cost of financial intermediation. The financial crisis added to this downward pressure. Uncertainty
rose, growth in other advanced economies slowed, financial conditions tightened, and both the public and
9 These annual stocktakes serve two purposes. First, they provide the MPC with a regular opportunity to step back from the month-to-month flow of economic data and consider supply-side developments as a whole and over an appropriately lengthy time period. Second, by undertaking routine systematic annual assessments of the supply-side, rather than addressing the issues ad hoc from quarter to quarter, we hoped to provide clarity on our analytical processes to observers outside the Bank. 10 See the August 2014 Inflation Report. The equilibrium unemployment rate depends on the horizon being considered, as wage pressures can arise for many reasons and some factors will be more persistent than others. These figures are the MPC’s estimates of the medium-term equilibrium unemployment rate, the measure most relevant for gauging wage pressures over the MPC’s three-year forecast period. This is distinct from the MPC’s estimate of the long-term equilibrium unemployment rate – which depends on structural factors such as the extent to which potential employees are aligned with vacancies in terms of skills, location and occupation; the benefits regime; and the influence of trade unions on wage bargaining – and which remained at 5% during this period. 11 See ‘The spirit of the season’, speech by Mark Carney at the Economic Club of New York, 9 December 2013 and the box on page 40 of the February 2014 Inflation Report. 12 See ‘[De]Globalisation and Inflation’, speech by Mark Carney given at the 2017 IMF Michel Camdessus Central Banking Lecture, 18 September 2017.

All speeches are available online at www.bankofengland.co.uk/news/speeches
11
11
private sectors sought to reduce their pace of borrowing. These shorter-term factors pushed the equilibrium
interest rate in the UK (and other advanced economies) into negative territory, prompting the adoption of
unconventional policies following the crisis.
The fading of the headwinds from the crisis implied that some of the fall in the equilibrium rate would
gradually unwind, though the structural forces were thought likely to persist for many years to come. As a
result, the MPC judged that the pace of Bank Rate increases consistent with eliminating slack and keeping
inflation close to the target would be gradual and that, even once spare capacity had been absorbed, the
appropriate level of Bank Rate was expected to be materially below the pre-crisis average of 5%.
Out of that assessment came the guidance that future rises in Bank Rate were expected to be “limited and
gradual” – a phrase so often repeated it became part of the monetary policy furniture.
As intended, the MPC’s “limited and gradual” guidance dampened interest rate volatility and reduced the
correlation between interest rate volatility and economic uncertainty. Both developments increased the
degree of monetary policy stimulus at a given policy rate, thereby reinforcing the recovery during turbulent
times.
GDP grew robustly over this period, supported by strong consumer and business spending against a
backdrop of continued fiscal consolidation. Unemployment continued to fall and the amount of excess
supply was gradually, but meaningfully, reduced. These factors looked set to provide the momentum
needed to bring domestic inflationary pressures back to up to a rate consistent with the inflation target. It
was notable that wage growth was already showing signs of picking up.
At this time, however, total CPI inflation had fallen to around zero. While below-target inflation partly
reflected the drag from past spare capacity, the majority was due to falls in energy prices, muted growth in
world prices and a recent appreciation of sterling.13 Measures of core inflation that attempt to strip out these
external factors had fallen much less sharply, though were still below target-consistent rates.
The MPC expected the effects of the external factors on inflation to be protracted, particularly the dampening
influence of sterling, which was likely to still be affecting inflation in two years' time or what is viewed as the
conventional policy horizon. The Committee had learnt from the experience of the post-crisis depreciation in
sterling that the pass-through of changes in the exchange rate through supply chains into UK CPI inflation is
slow, not swift, taking several years to complete.
The Committee therefore continued to maintain Bank Rate at 0.5%, judging this was appropriate to ensure
that waning drag on inflation from external price pressures would be balanced by further increases in
domestic inflationary pressures brought about by eliminating the remaining margin of spare capacity in the
economy. The performance of total and core CPI inflation in the run-up to the referendum was consistent
13 The MPC judged that these factors could explain around three-quarters to four-fifths of the deviation of inflation from target, with the remainder reflecting the impact of past spare capacity weighing on domestic cost growth.

All speeches are available online at www.bankofengland.co.uk/news/speeches
12
12
with this judgment – one that helped ensure that the UK economy continued to expand jobs and growth at
some of the strongest paces in the advanced world.
In my view, this period demonstrated the strength of the Bank’s expanded powers. Aware that the
combination of strong growth and historically low interest rates could lead to excessive risk taking, this was a
period of macroprudential activism by the Bank. In the five years to 2016, the major UK banks’ CET1 capital
ratios in aggregate nearly doubled, rising from 7.2% to 13.4%. The FPC introduced a new leverage ratio and
counter-cyclical capital buffer. With the PRC, it regularly stressed tested the major banks against a wide
range of extreme economic and financial shocks. In a major innovation, the FPC brought in two measures to
help ensure that mortgage underwriting standards did not deteriorate as they had in previous cycles and to
limit the rise of heavily indebted households.
The active management by the PRC and FPC of potential risks to financial stability ensured that monetary
policy could concentrate on its core responsibilities. Achieving those was about to get much more
complicated as summer came to an abrupt end.
III. Autumn – Managing the trade-off in the exceptional circumstances of Brexit
The main challenge facing the MPC most recently has been to support the UK economy through Brexit. To
maintain the seasonal metaphor, recent years could be described as autumnal, consistent with the start of
that season being associated with big changes like beginning a new school year or a new job.
Prior to the referendum, the MPC expected that a vote to leave would prompt the exchange rate to fall
sharply, inflation to rise above the 2% target, and growth to slow materially.14 That is exactly what happened
(Charts 8a, b and c).
Chart 8: Following vote to leave EU, sterling depreciated, inflation rose and growth slowed materially
a) Sterling ERI
14 See the May 2016 Inflation Report.
70
75
80
85
90
95
Jan. 15 Jul. 15 Jan. 16 Jul. 16 Jan. 17 Jul. 17 Jan. 18
Index, Jan 2005 = 100
EU referendum
EU summit

All speeches are available online at www.bankofengland.co.uk/news/speeches
13
13
b) CPI inflation
c) UK and G7 growth
Sources: Eikon from Refinitiv and Bank calculations.
Sterling dropped immediately following the referendum, the biggest recorded single day move, and it
subsequently traded around 15 to 20% below its late-2015 peak ahead of the referendum being called.
Inflation rose well above the 2% target, eventually peaking at 3.1% in late 2017, an overshoot entirely due to
the referendum-induced fall in sterling.
UK growth dropped from the fastest to the slowest in the G7. Households trimmed spending, as the effects
of sterling’s fall showed up in higher prices in the shops and squeezed their real incomes. Business
investment was cut back more markedly, despite supportive financial conditions and (at the time) strong
global growth, as companies understandably put projects on hold whilst they waited for greater clarity over
the UK’s future trading relationships.
-0.5
0.0
0.5
1.0
1.5
2.0
2.5
3.0
3.5
Jan 14 Jul 14 Jan 15 Jul 15 Jan 16 Jul 16 Jan 17 Jul 17 Jan 18
Per cent
EU referendum
-0.5
0.0
0.5
1.0
1.5
2.0
2.5
3.0
3.5
4.0
2015 2016 2017 2018
Percentage changes on a year earlier
UK GDP growth
Swathe of other G7 countries
EU referendum
All speeches are available online at www.bankofengland.co.uk/news/speeches
14
14
The weakness in investment has weighed on growth in the potential supply capacity of the UK economy,
through lower growth in the capital stock and reduced process innovation. Brexit-related uncertainties may
have dissuaded companies from expanding supply capacity or entering new markets. And companies have
spent considerable time and resources planning and preparing for various contingencies, limiting their ability
to produce output and take strategic decisions that would boost innovation and productivity.15
The MPC has repeatedly emphasised that monetary policy cannot prevent either the necessary real
adjustment as the UK moves to its new trading arrangements or the weaker real income growth likely to
accompany that adjustment. Monetary policy does, however, have a role to play in supporting the economy
during the adjustment process.
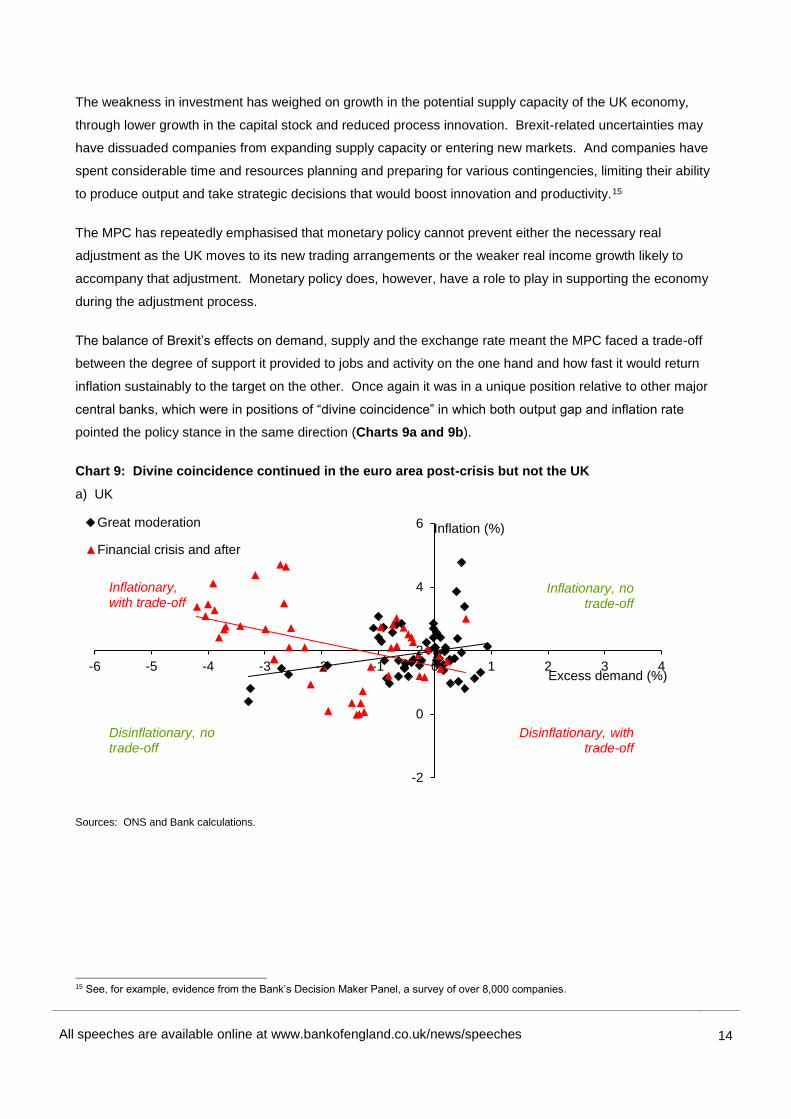
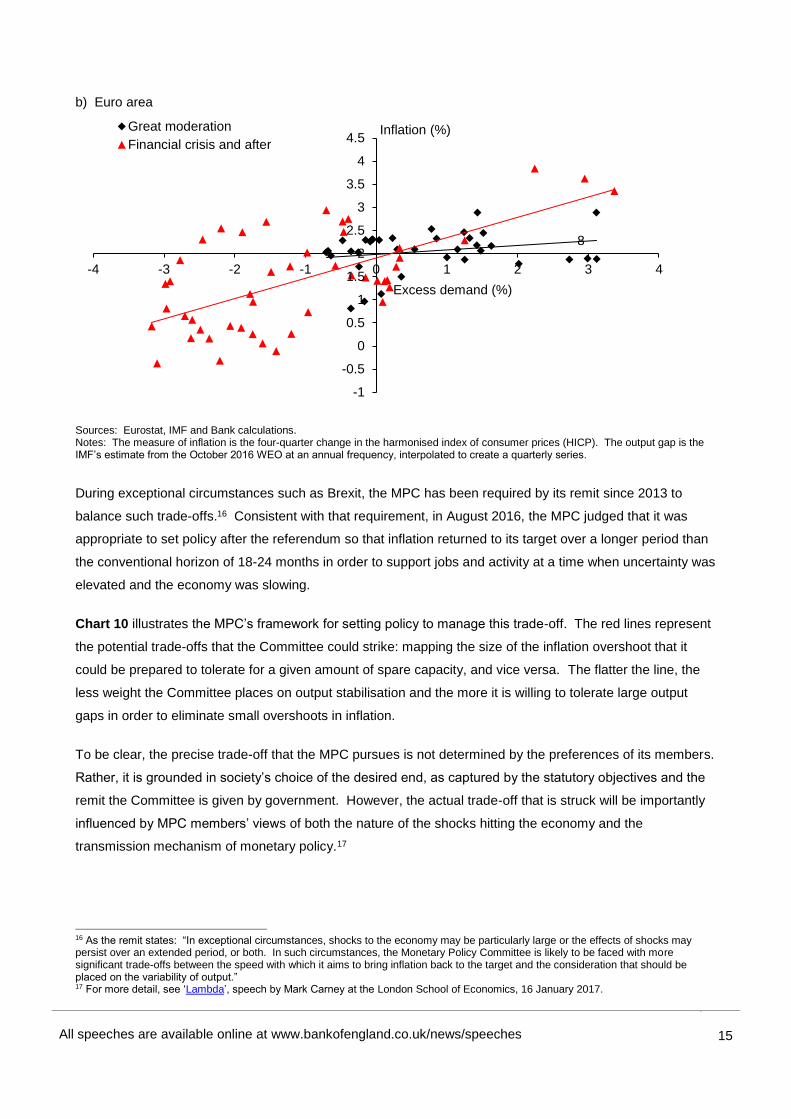
The balance of Brexit’s effects on demand, supply and the exchange rate meant the MPC faced a trade-off
between the degree of support it provided to jobs and activity on the one hand and how fast it would return
inflation sustainably to the target on the other. Once again it was in a unique position relative to other major
central banks, which were in positions of “divine coincidence” in which both output gap and inflation rate
pointed the policy stance in the same direction (Charts 9a and 9b).
Chart 9: Divine coincidence continued in the euro area post-crisis but not the UK
a) UK
Sources: ONS and Bank calculations.
15 See, for example, evidence from the Bank’s Decision Maker Panel, a survey of over 8,000 companies.
-2
0
2
4
6
-6 -5 -4 -3 -2 -1 0 1 2 3 4
Great moderation
Financial crisis and after
Excess demand (%)
Inflation (%)
Inflationary, no trade-off
Disinflationary, no trade-off
Disinflationary, with trade-off
Inflationary, with trade-off
All speeches are available online at www.bankofengland.co.uk/news/speeches
15
15
b) Euro area
Sources: Eurostat, IMF and Bank calculations. Notes: The measure of inflation is the four-quarter change in the harmonised index of consumer prices (HICP). The output gap is the IMF’s estimate from the October 2016 WEO at an annual frequency, interpolated to create a quarterly series.
During exceptional circumstances such as Brexit, the MPC has been required by its remit since 2013 to
balance such trade-offs.16 Consistent with that requirement, in August 2016, the MPC judged that it was
appropriate to set policy after the referendum so that inflation returned to its target over a longer period than
the conventional horizon of 18-24 months in order to support jobs and activity at a time when uncertainty was
elevated and the economy was slowing.
Chart 10 illustrates the MPC’s framework for setting policy to manage this trade-off. The red lines represent
the potential trade-offs that the Committee could strike: mapping the size of the inflation overshoot that it
could be prepared to tolerate for a given amount of spare capacity, and vice versa. The flatter the line, the
less weight the Committee places on output stabilisation and the more it is willing to tolerate large output
gaps in order to eliminate small overshoots in inflation.
To be clear, the precise trade-off that the MPC pursues is not determined by the preferences of its members.
Rather, it is grounded in society’s choice of the desired end, as captured by the statutory objectives and the
remit the Committee is given by government. However, the actual trade-off that is struck will be importantly
influenced by MPC members’ views of both the nature of the shocks hitting the economy and the
transmission mechanism of monetary policy.17
16 As the remit states: “In exceptional circumstances, shocks to the economy may be particularly large or the effects of shocks may persist over an extended period, or both. In such circumstances, the Monetary Policy Committee is likely to be faced with more significant trade-offs between the speed with which it aims to bring inflation back to the target and the consideration that should be placed on the variability of output.” 17 For more detail, see ‘Lambda’, speech by Mark Carney at the London School of Economics, 16 January 2017.
8
-1
-0.5
0
0.5
1
1.5
2
2.5
3
3.5
4
4.5
-4 -3 -2 -1 0 1 2 3 4
Great moderation
Financial crisis and afterInflation (%)
Excess demand (%)

All speeches are available online at www.bankofengland.co.uk/news/speeches
16
16
Charts 10a and 10b demonstrate how the expected trade-off evolved in successive MPC forecasts since the
referendum. They show the MPC's central projections at Year 2 and Year 3 respectively for CPI inflation on
the vertical axis against those for spare capacity (the opposite of excess demand) on the horizontal axis from
successive Inflation Reports between August 2016 and November 2017.18
Chart 10: MPC managed the trade-off19
a) Trade-off in successive Inflation Report projections at Year 2
b) Trade-off in successive Inflation Report projections at Year 3
18 The projections are conditioned on the market yield curves prevailing at the time the forecasts were made. 19 Each observation shows the central projection for spare capacity or excess demand at the end of the second / third year of the forecast period on the horizontal axis against the central projection for four-quarter CPI inflation at Year 2 / 3 on the vertical axis from successive Inflation Reports. The left-most observation (labelled "Aug. 2016 no stimulus") is a counterfactual version of the August 2016 Inflation Report forecasts with the effect of the MPC's Bank Rate cut, Term Funding Scheme and Asset Purchases removed. See ’Lambda’, speech by Mark Carney at the London School of Economics, 16 January 2017, for further details and discussion.
1.0
1.5
2.0
2.5
3.0
-1.5 -1.0 -0.5 0.0 0.5 1.0 1.5
Inflation (%)
Excess demand (%)
August 2016
Preferred trade-off if λ=1
Preferred trade-off if λ=0.1
November 2016February 2017
August 2016, no stimulus
May 2017 November 2017
August 2017
1.0
1.5
2.0
2.5
3.0
-1.0 -0.5 0.0 0.5 1.0
Inflation (%)
Excess demand (%)
August 2016
Preferred trade-off if λ=1
Preferred trade-off if λ=0.1
November 2016
February 2017
August 2016, no stimulus
May 2017
November 2017 August 2017
All speeches are available online at www.bankofengland.co.uk/news/speeches
17
17
Initially, the Committee judged that balancing the trade-off between ensuring a sustainable return of inflation
to target and supporting jobs and activity would require significant additional monetary support. It therefore
implemented a timely, coherent and comprehensive package of easing measures,20 which was reinforced by
actions taken by the Bank’s other policy committees, most notably the FPC’s cut of the CCyB rate.21
Collectively, these measures helped ensure domestic financial conditions remained supportive even as
uncertainty rose – a contrast to usual experience.
Despite this support, as well as much stronger-than-anticipated global growth and more supportive fiscal
policy, UK growth significantly underperformed the MPC’s projections ahead of the referendum, which were
conditioned on a vote to remain. Estimates of the drag from Brexit vary, but to give some perspective, the
level of UK GDP is currently some 3% lower than might have been expected given how demand in the rest of
the world has evolved since June 2016.22
Supported by the package of monetary policy measures, the broad-based global expansion and fiscal easing
in late 2016, UK growth did rise above the subdued rate of potential supply growth. Over the course of 2017
and 2018, unemployment continued to decline and spare capacity was steadily used up.
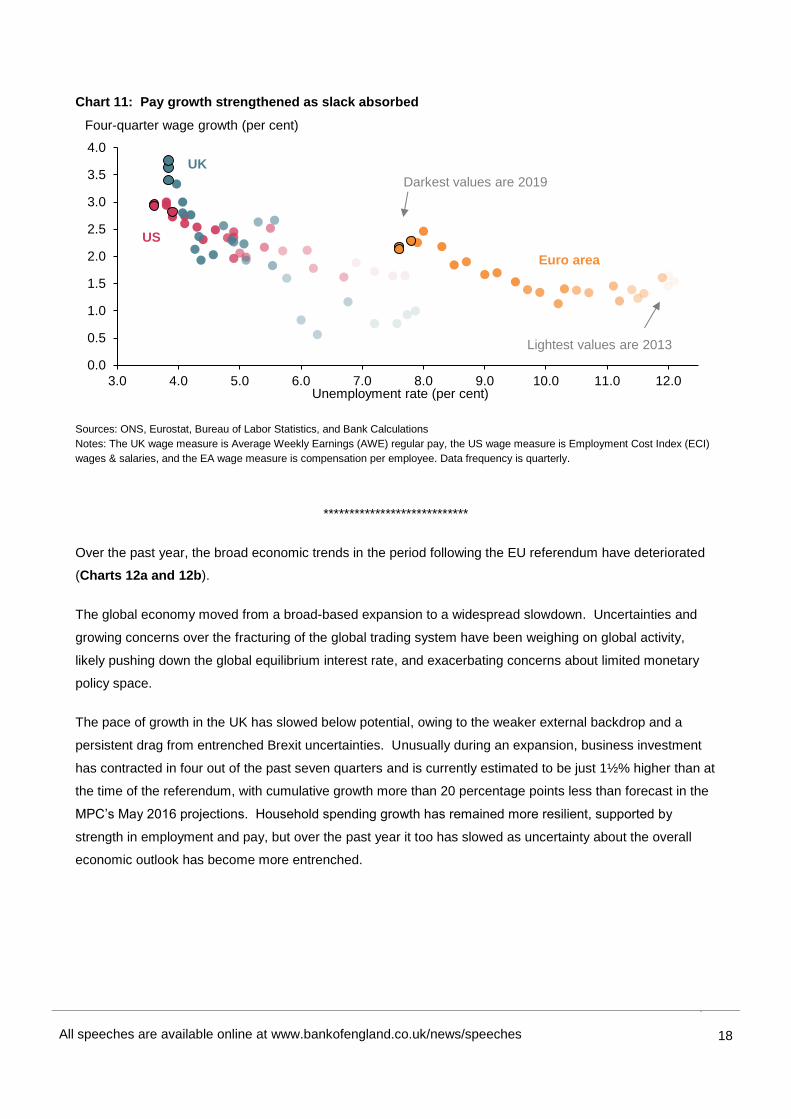
As the labour market tightened and companies found it harder to recruit and retain staff, wage growth began
to pick up as expected (Chart 11). Across the economy as a whole, pay growth rose from around 1½% a
year during 2010-15 to around 2¼% in 2016 and 2017 and 3% in 2018.23 Although these rates of pay
growth were still lower than pre-crisis averages that largely reflected weak productivity growth. As a result,
indicators of domestic inflationary pressures, such as unit labour cost growth, rose towards rates consistent
with the inflation target.
The steady absorption of slack and the prospect of moving into excess demand by the end of the MPC’s
three-year forecast period – evident in the dots showing the successive Inflation Report projections in
Chart 10b – reduced the degree to which it was appropriate to accommodate an extended period of inflation
above the target. As a consequence, the MPC began to remove some of the policy stimulus, raising Bank
Rate from ¼% to ½% in November 2017 and then to ¾% in August 2018 where it has remained since.
20 This comprised: a 25 basis point reduction in Bank Rate to 0.25%; a Term Funding Scheme to reinforce the pass-through of that cut to the borrowing rates faced by households and companies; £60 billion of gilt purchases; and £10 billion of corporate bond purchases. 21 The FPC cut the counter-cyclical capital buffer rate to zero, increasing credit availability by up to £150 billion; emphasised that banks’ liquidity reserves are usable; and amended the leverage ratio framework for UK banks by excluding central bank reserves. The PRA Board used regulatory flexibilities to smooth insurers’ transition to new regulatory standards in a very low interest rate environment. 22 This estimate is based on the approach to construct a “synthetic” measure of UK GDP described in ‘The Economic Outlook: Fading global tailwinds, intensifying Brexit headwinds’, speech given by Gertjan Vlieghe at the Resolution Foundation, 14 February 2019. 23 Figures are for whole economy average wages excluding bonuses (“regular pay”).
All speeches are available online at www.bankofengland.co.uk/news/speeches
18
18
Chart 11: Pay growth strengthened as slack absorbed
Sources: ONS, Eurostat, Bureau of Labor Statistics, and Bank Calculations
Notes: The UK wage measure is Average Weekly Earnings (AWE) regular pay, the US wage measure is Employment Cost Index (ECI)
wages & salaries, and the EA wage measure is compensation per employee. Data frequency is quarterly.
****************************
Over the past year, the broad economic trends in the period following the EU referendum have deteriorated
(Charts 12a and 12b).
The global economy moved from a broad-based expansion to a widespread slowdown. Uncertainties and
growing concerns over the fracturing of the global trading system have been weighing on global activity,
likely pushing down the global equilibrium interest rate, and exacerbating concerns about limited monetary
policy space.
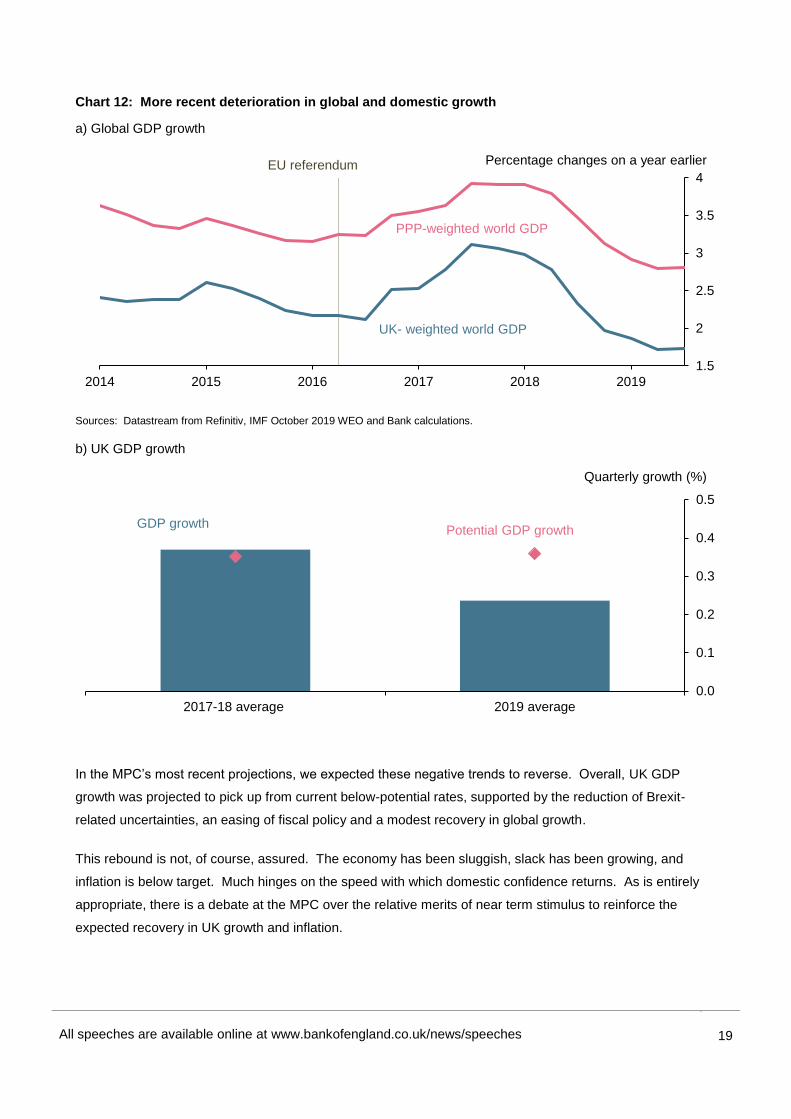
The pace of growth in the UK has slowed below potential, owing to the weaker external backdrop and a
persistent drag from entrenched Brexit uncertainties. Unusually during an expansion, business investment
has contracted in four out of the past seven quarters and is currently estimated to be just 1½% higher than at
the time of the referendum, with cumulative growth more than 20 percentage points less than forecast in the
MPC’s May 2016 projections. Household spending growth has remained more resilient, supported by
strength in employment and pay, but over the past year it too has slowed as uncertainty about the overall
economic outlook has become more entrenched.
0.0
0.5
1.0
1.5
2.0
2.5
3.0
3.5
4.0
3.0 4.0 5.0 6.0 7.0 8.0 9.0 10.0 11.0 12.0
Four-quarter wage growth (per cent)
Unemployment rate (per cent)
Darkest values are 2019
Euro area
UK
US
Lightest values are 2013
All speeches are available online at www.bankofengland.co.uk/news/speeches
19
19
Chart 12: More recent deterioration in global and domestic growth
a) Global GDP growth
Sources: Datastream from Refinitiv, IMF October 2019 WEO and Bank calculations.
b) UK GDP growth
In the MPC’s most recent projections, we expected these negative trends to reverse. Overall, UK GDP
growth was projected to pick up from current below-potential rates, supported by the reduction of Brexit-
related uncertainties, an easing of fiscal policy and a modest recovery in global growth.
This rebound is not, of course, assured. The economy has been sluggish, slack has been growing, and
inflation is below target. Much hinges on the speed with which domestic confidence returns. As is entirely
appropriate, there is a debate at the MPC over the relative merits of near term stimulus to reinforce the
expected recovery in UK growth and inflation.
1.5
2
2.5
3
3.5
4
2014 2015 2016 2017 2018 2019
Percentage changes on a year earlier
UK- weighted world GDP
EU referendum
PPP-weighted world GDP
0.0
0.1
0.2
0.3
0.4
0.5
2017-18 average 2019 average
Quarterly growth (%)
Potential GDP growth GDP growth

All speeches are available online at www.bankofengland.co.uk/news/speeches
20
20
On the one hand, there is a modest but rising degree of spare capacity in the UK and core inflation remains
subdued. There are downside risks from global growth and the possibility that uncertainties over future
trading relationships could remain entrenched. With the relatively limited space to cut Bank Rate, if evidence
builds that the weakness in activity could persist, risk management considerations would favour a relatively
prompt response.
On the other hand, global growth is showing tentative signs of stabilising. The global manufacturing PMI has
returned to expansionary territory, helping push the composite to a six month high in December. Past global
monetary policy stimulus is gaining traction and global financial conditions are supportive. Early indicators,
from financial market prices and the limited number of business surveys since the election, suggest that
there has been some reduction in Brexit-related and domestic policy uncertainties. The labour market
remains tight and domestically generated inflation remains generally firm. And total monetary policy space is
larger than conventional measures would suggest.
In the coming weeks, the MPC will watch closely surveys of business and consumer confidence (including
intelligence from our Agents) as well as global developments. We will also undertake our annual supply
stocktake. This assessment is particularly relevant as evidence is increasing that the entrenched
uncertainties in recent years may have weighed more heavily on supply growth than previously anticipated.
IV. Some Lessons for Inflation Targeting
While there will always be healthy debates about monetary policy tactics, the UK’s most recent recovery
provides some important lessons about the effectiveness of the UK’s Inflation Targeting framework.
First, the flexibility inherent in inflation targeting is highly valuable, particularly when combined with
mechanisms to improve transparency and accountability. In the wake of the referendum, the MPC’s
aggressive monetary easing, despite a sharply depreciating currency and rising inflation, was made much
more effective by the new requirements under its remit to explain clearly the trade-off it was pursuing
between supporting jobs and growth on the one hand and returning inflation sustainably to target on the
other.
The post-Referendum experience was exceptional, not least because it was the product of a delayed real
shock to the economy to which households, businesses and financial markets participants responded at
different speeds and to different degrees. But this issue of a trade-off is not unique. As has become
apparent since the financial crisis, the UK economy is subject to unusually large and protracted exchange
rate pass through that can be relevant at the monetary policy horizon. The MPC needs to understand the
reasons for such moves, decide whether to employ the flexibility in the inflation targeting framework to look
through them, and then explain clearly the rationale for its actions.
This goes to a more general point: a variety of aspects of the UK’s monetary policy framework – including
our open letters, our new MPR and greater clarity over forecast assumptions and sensitivities – are designed

All speeches are available online at www.bankofengland.co.uk/news/speeches
21
21
to help market participants, businesses and households understand the MPC’s reaction function and thereby
anticipate how monetary policy will evolve with the economy. This makes policy both easier to predict and
more effective.
Second, monetary policy is also more effective when it is combined with vigilant macro- and micro-prudential
policies.
A frequently expressed concern is that low policy rates are generating risks to financial stability – often linked
to undesirable “search for yield” behaviour.24 While vigilance is required, it is essential to leverage the
synergies of monetary and macro-prudential policies. In many situations monetary policy actions are
complementary to financial stability. After all, stimulating more risk taking is one of the goals of low policy
rates, whereas recessions emerge when demand shifts away from risky assets and towards safe assets.
Easing monetary policy changes people’s incentives in order to mitigate that shift.25 Low interest rates can
also benefit financial stability by making debts more serviceable.
More fundamentally, risks to financial stability should primarily be addressed by (macro and micro) prudential
policy, with monetary policy as the last – not the first – line of defence. This approach is codified in the UK
institutional set-up, with independent monetary and financial policy committees that are required by remit to
have regard of the actions of each other. By addressing macro financial risks at source and building
systemic resilience, the PRC and FPC allow monetary policy to concentrate on its job of delivering price
stability.
Third, “unconventional policies”, including asset purchases and forward guidance, are powerful policy tools in
a low r* environment with more frequent encounters with the effective lower bound. A growing body of
research shows that asset purchases led to substantial, long-lasting, reductions in long-term yields,26
providing support to activity when policy rates are constrained. Bank staff estimate that the MPC’s
£60 billion of asset purchases in August 2016 were equivalent to a Bank Rate cut of around 50 basis points.
As the MPC noted at the time, there was considerable scope to increase purchases and to use the Term
Funding Scheme to reinforce the pass through of further cuts to Bank rate had additional stimulus been
required.
24 Such behaviour would be particularly concerning if people do not recognise the riskiness of the assets they are investing in to achieve their desired returns, for example because they are complex instruments which disguise the underlying risk of the assets and / or because the assets lie outside the regulatory perimeter. There are parallels in both cases to the pre-crisis situation. 25 It is also important not to muddle cause and effect of low interest rates. One reason why equilibrium interest rates are low at the moment is because the distribution of economic outcomes has become more skewed to the downside. In this regard, low rates are a consequence of riskier environment, not the cause of higher risk premia. 26 For example, see Ihrig, J, Klee, E, Li, C, Wei, M, and Kachovec, J (2018), ‘Expectations about the Federal Reserve’s balance sheet and the term structure of interest rates’, International Journal of Central Banking, vol. 14(2), pp. 341-390.
All speeches are available online at www.bankofengland.co.uk/news/speeches
22
22
V. Winter – Monetary policy in a persistently low r* world
Looking ahead, deep structural changes in economies are creating disinflationary pressures at a time when
conventional monetary policy space is already limited. Inflation targeting frameworks will be tested in new
ways.
It feels like winter is coming.
In all likelihood, equilibrium interest rates will remain low for a prolonged period as many of the structural
forces that have pushed them down are set to persist for years. Moreover, these could likely to be reinforced
by flaws inherent in the international monetary and financial system27 and the disinflationary effects of
advances in technology and the changing nature of commerce.28
The principle structural force leaning in the other direction on inflation is that the shift towards de-
globalisation with the potential fracturing of the global trading system.
On balance, the global economy risks being trapped in a vicious cycle of lower global equilibrium interest
rates reducing monetary policy space, exacerbating downside risks, pushing down equilibrium rates further,
and leading to a global liquidity trap.
This environment raises questions over whether the current inflation targeting framework will provide
monetary policymakers sufficient scope to respond to adverse shocks to demand, whether it needs to be
adjusted or even replaced.
Currently, there is insufficient conventional policy space based on past experience. The average change in
policy rates across easing and tightening cycles pre-crisis was around 150 basis points in the UK, and
around 250 basis points in the US and the euro area.29 The average easing cycle in the UK prior to the crisis
was 250bps. All else equal, insufficient conventional policy space could lead to more frequent, and more
costly, episodes at the lower bound. Research indicates that if the equilibrium real interest rate settles at
1%, policy rates could hit zero as much as 40 per cent of the time, resulting in shortfalls of inflation from
target and output from potential of up to 2 percentage points.30 Prior to the crisis, the zero lower bound was
expected to bind just 10 per cent of the time, with only modest costs as each episode was anticipated to be
short in duration.31
27 These flaws reduce the rate of global potential growth, increases its downside skew, and bolsters the likelihood of an extreme downside event (a fatter left tail). As my colleague on the MPC Jan Vlieghe has illustrated, such a change in the distribution of economic outcomes reduces the global equilibrium rate of interest. See ‘Real interest rates and risk’, speech by Gertjan Vlieghe given at the Society of Business Economists’ Annual conference, 15 September 2017. 28 See, for example on pricing behaviour, Cavallo, A (2018), ‘More Amazon Effects: Online Competition and Pricing Behaviors’, paper prepared for the 2018 Jackson Hole Symposium, or ‘The Future of Work’, 2018 Whitaker Lecture given by Mark Carney at the Central Bank of Ireland, 14 September 2018, for a broader discussion of the effects on the Phillips curve. 29 In the UK, the average cut in Bank Rate in easing cycles was larger than the average increase in tightening cycles. For example, Bank Rate was cut by a total of 250 basis points in the easing cycles of 1998-99 and 2001-04. 30 Bernanke, B, Kiley, M and Roberts, J (2019) ‘Monetary Policy Strategies for a Low-Rate Environment’, Finance and Economics Discussion Series 2019-009. 31 Reifschneider, D, and Williams, JC (2000) ‘Three Lessons for Monetary Policy in a Low Inflation Era’, Journal of Money, Credit and Banking, Vol. 32(4), pp. 936-966.

All speeches are available online at www.bankofengland.co.uk/news/speeches
23
23
Recent experience in the euro area and elsewhere suggests that policy rates can be cut somewhat below
zero. But it is unclear to what extent and for how long – uncertainties that can reduce the efficacy of
negative rates.
Research into the “reversal” level of the policy rate – the level at which any further rate cuts become
counterproductive – is still in its infancy. Initial results thus far suggest that the reversal rate is below zero
but could be time dependent, rising the longer that policy rates are held in negative territory. 32 The precise
level of the reversal rate varies significantly by jurisdiction and depends on factors like the structure of the
financial sector.
In the UK, the Bank’s analysis finds that very low interest rates are highly stimulative. Evidence from our
panel survey of households suggests that a 50 basis point cut in Bank Rate (even at low levels) raises
spending by 0.1% through cashflow effects alone. Moreover, the vast majority of savers who might lose
some interest income from lower policy rates stand to gain from increases in asset prices that result from
monetary policy stimulus, since only 2% of UK households have material deposit holdings without material
financial assets or property wealth.33 Concerns that low policy rates could weigh on investment because
they cause companies to divert funds towards improving the solvency of defined benefit pension schemes
are also overdone, because these funds are not that large and companies are come likely to make up
shortfalls by cutting dividends than capital expenditure.34
The binding constraint on Bank Rate reductions is their impact on the financial sector, particularly on the net
interest margins of building societies. The adverse impact on profitability, and therefore capital, would likely
limit the pass-through of rate cuts into loan rates, reducing the effectiveness of negative interest rates. That
is why the MPC has concluded that the lower bound on Bank Rate is “close to, but a little above, zero.” This
judgement is informed by close consultation with PRA supervisors.
Of course, the effectiveness of unconventional policies means that there is considerable total policy space.
In the UK, the MPC can increase its purchases of both gilts and corporate bonds, providing stimulus through
a number of channels including portfolio rebalancing. At present, there is sufficient headroom to at least
double the August 2016 package of £60 billion asset purchases, a number that will increase with further gilt
issuance. That would deliver the equivalent of around a 100 basis point cut to Bank Rate on top of the near
75 basis points of conventional policy space. Forward guidance at the ELB adds to this armoury. All told, a
reasonable judgement is that the combined conventional and unconventional policy space is in the
neighbourhood of the 250 basis points cut to Bank Rate seen in pre-crisis easing cycles.
32 For example, as banks’ profitability is gradually eroded, they may widen net interest margins by cutting deposit rates further or raising loan rates. For more detail on the potential for time dependency, see Brunnermeir, MK and Koby, Y (2018) ‘The Reversal Interest Rate’, NBER Working Paper No. 25406. 33 It is also worth remembering that monetary policy works in part through channels that are unaffected by low rates, including its effect on the exchange rate, which provide further support by boosting labour income. 34 Bank staff estimate that such behaviour has reduced GDP by only 0.1% in total since 2007. A far more important determinant of the sustainability of defined benefit pensions is future productivity growth.
All speeches are available online at www.bankofengland.co.uk/news/speeches
24
24
That said, there are arguments for the “risk management” approach advocated by Charles Evans among
others to minimise the risks of hitting the effective lower bound (ELB).35 This approach calls for easing policy
more aggressively than would be prescribed by the central outlook for activity and inflation when policy rates
are close to their lower bound. The additional easing provided by such a strategy removes some of the
downward bias to inflation outcomes introduced by the ELB. If it is understood by a sufficient proportion of
agents, and affects their expectations, it becomes even more powerful.
As well as considering monetary policy tactics within the current framework, an open question is whether the
framework itself should be adjusted to embed a commitment to hold rates lower for longer to provide
additional stimulus at the lower bound. This could overcome a central difficulty of “lower for longer”
strategies – how to make the commitment to delay lift-off credible given its inherent time inconsistency – by
“tying the hands” of the policy committee to prevent it from reneging.
One option, involving only a modest change to the current framework, is a “whites of their eyes” strategy, in
which policy remains on hold until there is clear evidence that inflation has returned sustainably to target.
Such an approach could be accommodated within the flexibility of current inflation targeting frameworks, as it
would involve trading off somewhat higher inflation in future with lessening the constraint of the ELB today.
There could be benefits to changing the remit to recognise explicitly that this is an acceptable use of
flexibility. In this regard, the UK’s monetary framework could be well-suited to this strategy as a temporary
approach to addressing constraints at the ELB. In particular, the annual confirmation of the MPC’s remit and
use of open letters could promote the accountability of the Committee in pursuing this strategy. This
underscores the importance of developing measures of core domestically generated inflation to help gauge
when inflation has returned sustainably to target, as headline UK inflation can be pushed far from underlying
domestic inflationary pressures due to movements in the exchange rate.
A stronger variant would be to change temporarily the inflation target objective to build in a bias to stimulate
at the lower bound. Ben Bernanke has advocated a temporary shift from inflation to price level targeting
when policy rates reach their lower bound.36 Others have suggested moving from a point target to average
inflation targeting. Both options would require policymakers to “make up” any period of low inflation arising
from the constraints of the lower bound with higher inflation in future, increasing monetary stimulus.
However, these strategies might work less well in open, than closed economies, particularly ones like the UK
where exchange rate pass-through is large and protracted. The response of the exchange rate to shocks
would likely push up inflation during downturns in domestic activity, leading make-up strategies to generate
perverse policy prescriptions.
35 See Evans, C, Fisher, J, Gourio, F and Krane, S (2015), 'Risk Management for Monetary Policy Near the Zero Lower Bound’, Brookings Papers on Economic Activity, Economic Studies Program, vol. 46(1), pp. 141-219. 36 See Bernanke, B et al, ibid.

All speeches are available online at www.bankofengland.co.uk/news/speeches
25
25
An alternative and more radical approach than developing tools to provide stimulus at the ELB is to make it
less likely that policy rates need to reach it. Absent divine reflation, the most frequently discussed option is
to raise the inflation target. In theory, once achieved, and if inflation expectations moved up smoothly
consistent with the new target, then this framework change would reduce the frequency of hitting the ELB.
However, like many ideas in economics, this works better in theory than practice. There are a host of
unanswered questions about the transition to the higher target, including the potential for it to destabilise
inflation expectations. And it is necessary to consider whether the benefits from less frequent episodes at
the ELB justify the costs of the additional inflation at the permanently higher target.
As Ben Bernanke has recently argued, unconventional policy tools already achieve the equivalent of raising
the inflation target in the US from 2% to 5%, without needing to incur any of these costs. Moreover, research
by the Bank of Canada shows that it is those who are most vulnerable and on the lowest incomes who lose
out the most from higher inflation.37 So even if the costs of a higher inflation target might be small in
aggregate, the distributional consequences could be considerable. Such fundamentally political
considerations are a reminder why it is best for governments to choose the definition of price stability and for
central banks to work out how to achieve it with the tools are their disposal.
Before closing I would like to acknowledge a set of broader political economy considerations that could arise
in a low-for-long world. These could complicate the execution of current inflation targeting remits, and in the
extreme overwhelm them.
While all monetary policy tools have distributional effects, asset purchases have generated far greater
attention than have changes in interest rates. For example, there is a perception that asset purchases
increase inequality. In the extreme, this risks undermining trust in monetary policy makers and the
constituency for operational independence.
Again, it bears remembering that distributional considerations are rightly the responsibility of governments
not of independent technocratic monetary policy committees that are narrowly mandated to achieve price
stability. In the event, Bank of England research shows that income and wealth inequality has been stable in
the UK since the early 1990s, and fell in the years after the crisis when the MPC used unconventional
policies. Those who gained least from the higher asset prices that resulted from the MPC’s asset purchases
gained more from its broader effects supporting jobs and activity.38 Simulations using the Bank’s main
forecasting model suggest that the Bank’s monetary policy easing in response to the crisis measures raised
the level of GDP by around 8% relative to trend and lowered unemployment by 4 percentage points at their
peak. Without this action, real wages would have been 8% lower, or around £2,000 per worker per year, and
1.5 million more people would have been out of work.39
37 See ‘Renewal of the Inflation-Control Target: Background Information – October 2016’, Bank of Canada. 38 See Bunn, P, Pugh, A and Yeates, C (2018) ‘The distributional impact of monetary policy easing in the UK between 2008 and 2014’, Bank of England Staff Working Paper No. 720. 39 See ‘The Spectre of Monetarism’, Roscoe Lecture given by Mark Carney at Liverpool John Moores University, 5 December 2016.
All speeches are available online at www.bankofengland.co.uk/news/speeches
26
26
That said, greater use of unconventional monetary policy could increase the risk that the Bank’s core mission
is co-opted in the pursuit of other public policies goals. Perhaps reflecting the success of inflation targeting
in achieving price stability, in recent years a host of issues have been laid at the door of the Bank of England
from increasing housing affordability to improving poor productivity. There have also been calls for asset
purchases to address policy goals not directly related to monetary policy, such as people’s QE or MMT –
which essentially equate to fiscal policy – and green QE to support the transition to a net zero carbon world
by supporting green finance.
In my view, these should be resisted. While carefully circumscribed independence is highly effective in
delivering price and financial stability, it cannot deliver lasting prosperity and it cannot address broader
societal challenges. Calls for the Bank to solve broader challenges ignore the Bank’s carefully defined
objectives. And they often confuse independence with omnipotence.
That is not to suggest that in a liquidity trap, fiscal policy would not have an important and powerful role. But
even if that unfortunate circumstance were to come to pass, those decisions are best taken by governments.
Central banks are fiscal price takers; the government is the Stackelberg leader.
In summary, in my view, all these issues underscore the value of a careful deliberate review of the current
monetary framework, and the value of today’s research workshop.
Conclusion
To conclude, the flexibility in the UK monetary policy framework means that the MPC has been able to
support the UK economy through the changing of the seasons.
Despite the economy being buffeted by diverse and sizable shocks since the recovery began, inflation has
averaged 1.7%; GDP growth has generally been robust, averaging around 2%, and above the subdued rate
of potential supply growth. The wide margin of spare capacity present after the crisis was absorbed,
unemployment is at multi-decade lows and employment at an all-time high. Real wages have finally returned
to relatively strong rates of growth. Inflation expectations have remained anchored to the target, even when
CPI inflation has temporarily moved away from it.
This performance underscores that the bar for changing the regime is high. But it is nonetheless healthy to
review it periodically, and that review is supported by the Bank’s active research agenda. Today’s workshop
is organised with that in mind, and we appreciate all your contributions to help focus our research efforts.
There is an old saying that there is no such thing as bad weather, just inappropriate clothing. With the
economic climate changing, let’s ensure that the Bank remains well suited to deliver its mission to maintain
price and financial stability in support of the Good of the people of the United Kingdom.