Embed Size (px)
Citation preview
sensors
Article
A Formal Methodology to Design and DeployDependable Wireless Sensor Networks
Alessandro Testa 1, Marcello Cinque 2, Antonio Coronato 3,* and Juan Carlos Augusto 4
1 Ministero dell’Economia e delle Finanze, Rome 00187, Italy; [email protected] Dipartimento di Ingegneria Elettrica e delle Tecnologie dell’Informazione,
University of Naples “Federico II”, Naples 80125, Italy; [email protected] CNR-ICAR, Naples 80131, Italy4 Department of Computer Science and R.G. on Development of Intelligent Environments,
Middlesex University of London, London NW4 2SH, UK; [email protected]* Correspondence: [email protected]; Tel.: +39-81-6139-511
Academic Editor: Leonhard M. ReindlReceived: 10 August 2016; Accepted: 14 December 2016; Published: 23 December 2016
Abstract: Wireless Sensor Networks (WSNs) are being increasingly adopted in critical applications,where verifying the correct operation of sensor nodes is a major concern. Undesired events mayundermine the mission of the WSNs. Hence, their effects need to be properly assessed beforedeployment, to obtain a good level of expected performance; and during the operation, in order toavoid dangerous unexpected results. In this paper, we propose a methodology that aims at assessingand improving the dependability level of WSNs by means of an event-based formal verificationtechnique. The methodology includes a process to guide designers towards the realization ofa dependable WSN and a tool (“ADVISES”) to simplify its adoption. The tool is applicable tohomogeneous WSNs with static routing topologies. It allows the automatic generation of formalspecifications used to check correctness properties and evaluate dependability metrics at design timeand at runtime for WSNs where an acceptable percentage of faults can be defined. During the runtime,we can check the behavior of the WSN accordingly to the results obtained at design time and we candetect sudden and unexpected failures, in order to trigger recovery procedures. The effectiveness ofthe methodology is shown in the context of two case studies, as proof-of-concept, aiming to illustratehow the tool is helpful to drive design choices and to check the correctness properties of the WSN atruntime. Although the method scales up to very large WSNs, the applicability of the methodologymay be compromised by the state space explosion of the reasoning model, which must be faced bypartitioning large topologies into sub-topologies.
Keywords: Wireless Sensor Networks; formal methods; dependability; metrics; modeling
1. Introduction and Motivation
Wireless Sensor Networks (WSNs) [1] are being increasingly used in critical application scenarioswhere the level of trust on WSNs becomes an important factor, affecting the success of industrialWSN applications. The extensive use of this kind of network stresses the need to verify theirdependability—dependability is defined as the ability of a system to deliver a service that can justifiablybe trusted [2]. It is an integrated concept encompassing the attributes of reliability, availability,maintainability, safety, and integrity—not only at design time to prevent wrong design choices but alsoat runtime in order to make a WSN more robust against failures that may occur during its operation.
Typical critical scenarios are environmental monitoring (e.g., detection of fires in forests [1]),structural monitoring of civil engineering structures [3], health monitoring (in medical scenarios) [4]and patient monitoring [5,6] by means of Ambient Intelligence (AmI [7]) systems. For example,
Sensors 2017, 17, 19; doi:10.3390/s17010019 www.mdpi.com/journal/sensors
Sensors 2017, 17, 19 2 of 32
in the case of remote patient monitoring, alerts must be raised and processed within a temporalthreshold; functional incorrectness or runtime failures may result in catastrophic consequences forthe patient. These types of applications are considered safety-critical and they must be designedand developed with intrinsic and stringent dependability requirements [8]. Thus, depending on theapplication scenarios, different dependability requirements can be defined, such as, node lifetime,network resiliency and coverage of the monitoring area.
The work presented in [9] evidenced that also in a simple deployment, a single node can beresponsible for the failure of a huge piece of the network. For instance, a node that is close to the sink(i.e., the gateway of the WSN that has the role to collect all of the measures detected by the sensors) ismore likely to fail due to the great demand that it is subjected to, and its failure would likely cause theisolation of a set of nodes from the sink.
Therefore, it is necessary to verify the WSNs at design time against given correctness properties,in order to increase the confidence about the robustness of the designed solution before putting it intooperation. Also, in the IoT (Internet of Things) networks, the design of a dependable WSN platformhas became a main focus of research. In fact, in [10], the authors propose a functional design andimplementation of a complete WSN platform that can be used for a range of long-term environmentalmonitoring IoT applications.
Moreover, it is also important to avoid unexpected results or dangerous effects during the runtimeof the WSN; this can be obtained by checking traces of events generated from the system run againstthe same correctness properties used at design time.
Formal methods can be used for these purposes, due to their wide adoption in the literatureto verify the correctness of a system specification [11] or to perform runtime verification [12,13].However, the practical use of formal methods for the verification of dependability properties of WSNshas received little attention, due to the distance between system engineers and formal methods expertsand the need to re-adapt the formal specification to different design choices. Even if a developmentteam were to invest on the definition of a detailed specification of WSN correctness properties, a designchange (e.g., different network topology) could require one to rethink the formal specification, incurringextra undesirable costs.
To overcome these limitations, the contribution of this paper is manyfold. Specifically, we propose:
• a formal methodology to support the design and deployment of dependable WSNs both at designtime (static verification) and at runtime (runtime verification);
• the definition of a unique formal specification of WSN correctness, based on the event calculusformalism, subdivided in two logical subsets: a general correctness specification, valid independentlyof the particular WSN under study, and a structural specification related to the properties of thetarget WSN (e.g., number of nodes, topology, etc.);
• the adoption of specific WSN dependability metrics, such as connection resiliency and coverage,introduced in [14], for measuring dependability degree and providing a quantitative assessmentof a WSN;
• an automated verification tool, named ADVISES (AutomateD VerIfication of wSn with EventcalculuS), to facilitate the adoption of the proposed approach.
The key idea of the proposed methodology is to base the verification of correctness propertieson a set of specifications that can be used interchangeably at design time and at runtime.The decomposition of the specification in two sets simplifies the adoption of the approach.While general correctness specifications do not need to be adapted when changing the target WSN,structural specifications depend on the target, and are designed to be generated automatically.
The ADVISES tool facilitates the adoption of the proposed methodology by system engineerswith no experience of formal methods. At design time, it can be used to perform a robustness checking ofthe target WSN, i.e., to verify the long-term robustness of the WSN (in terms of the proposed metrics)against random sequences of undesired events, useful to identify corner cases and dependability
Sensors 2017, 17, 19 3 of 32
bottlenecks. At runtime, it monitors the deployed WSN. If an undesired event occurs, the toolcalculates the current values of dependability metrics (e.g., raising an alarm if a given criticality levelis reached) and it assesses the criticality of the network, in terms of the future hazardous scenarios thatcan happen, considering the new network conditions.
The proposed methodology and tool has been applied on two realistic WSNs representativeof health monitoring scenarios. Whilst these scenarios are on the smaller size, they are valuableas proof-of-concept and also to explain how to use the generic problem solving approach and toolpresented in this article. The case studies show how the approach is useful to deeply investigate thereasons of inefficiency and to re-target design choices. They also show how the same specification canbe used at runtime to check the correct behavior of a real WSN, deployed on the field and monitoredby ADVISES.
The technique presented in this paper is applicable to homogeneous WSNs with static routingtopologies. In addition, for illustrative reasons, the specifications presented in the paper focus onnode connectivity and isolation problems, and do not take into account the quality of produced sensordata. However, let us stress that the specifications can be easily extended to cover the aspects ofWSN behavior not covered in the paper. We will provide specific examples of possible extensions inthe paper.
The rest of the paper is organized as follows. A discussion of the related work is given in Section 2.Section 3 is dedicated to the description of a process underlying our the proposed methodology.Section 4 reports the definition of the correctness specifications (general and structural) of WSNsfollowing the event calculus formalism. Section 5 addresses the static verification in the form ofrobustness checking. The runtime verification technique is discussed in Section 6. In Section 7 the casestudies are discussed. Finally, in Section 8 the paper concludes with final remarks, a discussion oflimitations, and indications for future work.
2. Related Work
Several approaches have been proposed in the literature for the dependability evaluation of WSNsproperties: experimental, simulative, analytical and formal.
Experimental approaches are used to measure the dependability directly from a real distributedsystem during its operation, and thus they allow the analysis of dependability at runtime [15]. In thefield of WSNs, Li and Liu presented in [16] a deployment of 27 Crossbow Mica2 motes that composea WSN. They describe a Structure-Aware Self-Adaptive WSN system (SASA) designed in orderto detect changes of the network due to unexpected collapses and to maintain the WSN integrity.Detection latency, system errors, network bandwidth and packet loss rate were measured; coverage andconnection resiliency metrics are not considered. In the prototyping phase, it is possible to perform anaccelerated testing, for example by forcing faults in sensor nodes (by means of Fault Injection (FI) [17,18]).In [19], a dependability model and a dependable distributed WSN framework for Structural HealthMonitoring (called DependSHM) are presented. Another relevant work on dependable WSN for SHMis [20]. An approach is presented in order to repair the WSN and guarantee a specified degree of faulttolerance. The approach searches the repairing points in clusters and places a set of backup sensorsat those points. Shakkira et al. [21] propose a lightweight trust decision-making scheme that hasalso been extended to reduce calculation overheads and improve energy efficiency by integrating aninnovative protocol defined for data exchange.
Simulative approaches for assessing WSNs usually make use of behavioral simulators, i.e., toolsable to reproduce the expected behavior of a system by means of a code-based description, and theyare involved in the design phase. Typical simulative approaches to evaluate WSN fault/failure modelsare provided in [22,23]. In [22] authors address the problem of modeling and evaluating the reliabilityof the communication infrastructure of a WSN. The first on-line model-based testing technique [23]has been conceived to identify the sensors that have the highest probability to be faulty. Behavioralsimulators, as NS-2 [24] and Avrora [25], allow the reproduction of the expected behavior of WSN
Sensors 2017, 17, 19 4 of 32
nodes on the basis of the real application planned to execute on nodes. However, it is not alwayspossible to observe non-functional properties of WSNs by means of simulative approaches, sincemodels need to be redefined and adapted to the specific network to simulate.
The study of the performance and dependability of WSNs can be performed by means ofanalytical models [26–31]. In [26], authors introduce an approach for the automated generationof WSN dependability models, based on a variant of Petri nets. An analytical model to predict thebattery exhaustion and the lifetime of a WSN (LEACH) is discussed in [27]. In [28] the authors presenta network state model used to forecast the energy of a sensor. In [32] , a methodology to evaluate thereliability and availability of Wireless Sensor Networks in industrial environments that are subjectto permanent faults on network devices is proposed. In [30], authors propose a reactive distributedscheme for detecting faulty nodes. In [29], k-connectivity in secure wireless sensor networks under therandom pairwise key predistribution scheme with unreliable links is investigated. In [31], a techniqueto mitigate identity delegation attacks is introduced.
Formal approaches offer new opportunities for the dependability study of WSNs. Recently,different formal methods and tools have been applied for the modeling and analysis of WSNs,such as [33–35]. In [33], Kapitanova and Son apply a formal tool to WSNs. They propose a formallanguage to specify a generic WSN and a tool to simulate it. However, the formal specificationhas to be rewritten if the WSN under study changes. In [34], Man et al. propose a methodologyfor modeling, analysis and development of WSNs using a formal language (PAWSN) and a toolenvironment (TEPAWSN). They consider only power consumption as a dependability metric thatis necessary but not sufficient to assess the WSN dependability (e.g., other problems of WSN,such as the isolation problem of a node have been analyzed) and also they apply only simulation.In [35], Boonma and Suzuki describe a model-driven performance engineering framework for WSNs(called Moppet). This framework uses the event calculus formalism [36] to estimate, only at designtime, the performance of WSN applications in terms of power consumption and lifetime of each sensornode; other dependability metrics, such as coverage and connection resiliency are not considered.The features related to a particular WSN have to be set in the framework every time that a newexperiment starts.
There are some papers ([37,38]) that considered formal methods in real-time contexts. In [37],Olveczky and Mesenguer model and study WSN algorithms using the Real-Time Maude formalism.Though authors adopt this formalism, they use an NS-2 simulator to analyze the considered scenarios,making the work very similar to simulative approaches. The work presented in [38] considers a WSNas a Reactive Multi-Agent System consisting of concurrent reactive agents. In this paper, dependabilitymetrics are not treated and calculated and authors just describe the structure of a Reactive DecisionalAgent by means of a formal language.
Finally, in [39], the authors model and evaluate the reliability and lifetime of a WSN under sometypical working scenarios based on the sensor node modes (sleep and active) and the mechanism ofalternating between these modes. By means of numerical examples, they illustrate the reliability andlifetime of a WSN. Wang et al. [40] implement binary decision diagrams based algorithms to facilitatethe design, deployment, and maintenance of reliable WSNs for critical applications.
An open issue with formal specifications of WSNs is that they need to be adapted when changingthe target WSN configuration, e.g., in terms of the number of nodes and topology. To address thisproblem, it is necessary to provide separated specifications and thus conceive two logical sets ofspecifications: a general specification for WSN correctness properties that is valid for any WSN,and a structural specification related to the topology of the target WSN, designed in order to begenerated automatically. Currently, there are proposals in the literature documenting the applicationof formal methods to model the WSN but they only focus on some dependability metrics as lifetimeand power consumption; it is necessary to provide a method of assessing the dependability in terms ofother important key dependability metrics, such as coverage and connection resiliency to undesired
Sensors 2017, 17, 19 5 of 32
events. Moreover, no approach has been defined using formal methods for doing static and runtimeWSN verification as we propose in this paper.
3. The Process of the Methodology
Formal methods have been widely adopted in the literature to verify the correctness of a system,taking into account specifications. The verification is performed by providing proof on an abstractmathematical model of the system. Until now, there is no work that has proven how to use a uniqueformal approach to perform dependability assessment at design time and at runtime.
This paper defines a new, full, formal methodology to support verification of WSNs both at designtime (through static verification) and runtime (through runtime verification) exploiting only one set offormal specifications divided into two subsets: general (unchangeable and valid for any WSN) andstructural (variable on the basis of particular configuration of the WSN) specifications.
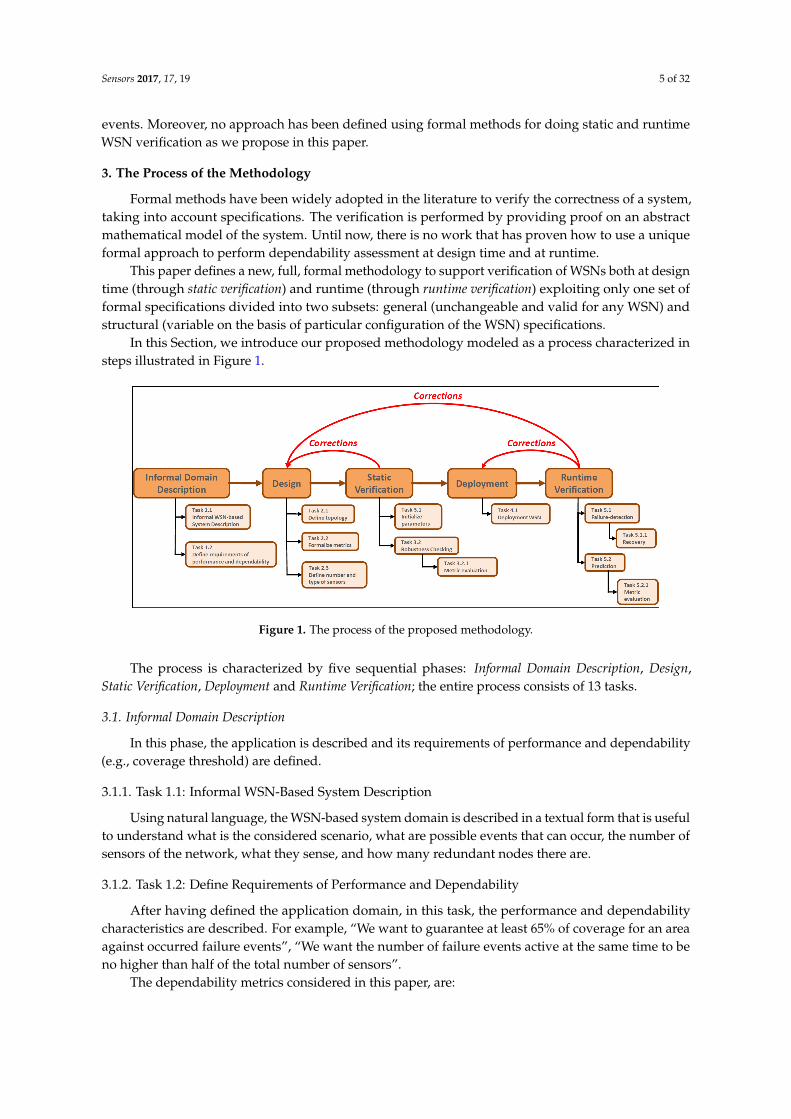
In this Section, we introduce our proposed methodology modeled as a process characterized insteps illustrated in Figure 1.
Figure 1. The process of the proposed methodology.
The process is characterized by five sequential phases: Informal Domain Description, Design,Static Verification, Deployment and Runtime Verification; the entire process consists of 13 tasks.
3.1. Informal Domain Description
In this phase, the application is described and its requirements of performance and dependability(e.g., coverage threshold) are defined.
3.1.1. Task 1.1: Informal WSN-Based System Description
Using natural language, the WSN-based system domain is described in a textual form that is usefulto understand what is the considered scenario, what are possible events that can occur, the number ofsensors of the network, what they sense, and how many redundant nodes there are.
3.1.2. Task 1.2: Define Requirements of Performance and Dependability
After having defined the application domain, in this task, the performance and dependabilitycharacteristics are described. For example, “We want to guarantee at least 65% of coverage for an areaagainst occurred failure events”, “We want the number of failure events active at the same time to beno higher than half of the total number of sensors”.
The dependability metrics considered in this paper, are:

Sensors 2017, 17, 19 6 of 32
• connection resiliency represents the number of node failures and disconnection events that can besustained while preserving a given number of nodes connected to the sink.
• coverage is the time interval in which the WSN can operate, while preserving a given number ofnodes connected to the sink.
The computation of these metrics is threshold-based. The threshold expresses the fraction offailed and isolated nodes that the user can tolerate, given its design constraints. For instance, a WSNof 20 nodes and a threshold set to 50% means that, at most, 10 isolated nodes can be tolerated.
The coverage is then defined as the interval [0, t], t being the timepoint of the event that causedthe isolation of a number of nodes exceeding the threshold.
Clearly, the definition of the threshold depends on the specific problem and relies on experthumans who want to use the approach to make an informed estimation that is useful to improvetheir design (such as, how to improve the WSN topology in order to make it tolerant to at least 50%of node failures). Nevertheless, while for some applications, a fixed threshold could not be defined,the approach does not restrict the use of a single threshold. Metrics can be evaluated with varyingvalues of thresholds, e.g., to find out the maximum number of tolerable failures to achieve the wantedresiliency level.
It is worth noting that it is easy to extend the set of metrics. Indeed, in some related work, weconsidered also metrics related with the correct delivery of packets and the power consumption asperformance and dependability metrics.
3.2. Design
This phase includes the design of a WSN defining the topology represented by means of a treegraph with the sink node as the root. Since several WSNs are composed by sensors that are in a fixedplace (i.e., in the case of structural monitoring, hospital environment monitoring, fire monitoring,home environment monitoring, etc), we focus on static routing topologies that can be representedas directed spanning trees [41] (with the sink as the root). Dependability metrics are formalized andnumber and type of sensors are defined.
3.2.1. Task 2.1: Define Topology
This task defines the topology; nodes and links are identified. From the structure of the WSN,we retrieve the corresponding spanning tree.
3.2.2. Task 2.2: Formalize Metrics
This task formalizes the required metrics on the basis of requirements defined in the previousstep (e.g., coverage computation).
3.2.3. Task 2.3: Define Number and Type of Sensors
This task is complementary to the Task 2.1 in order to define topology and fix the numberof the sensors. In particular, the properties of sensors -e.g., Receive/Transmit (RX/TX) energyconsumption- are defined since they are considered in the next phase (Static verification).
3.3. Static Verification
The designed WSN is verified in terms of the defined dependability properties. The verification isstatic in the sense that the network is not still operating.
The effects of the reasoning, performed on the basis of the defined specifications (general andstructural), impact on the designed WSN. For instance, if the results of the static verification do notmeet the dependability requirements, it could be necessary to modify the topology of the WSN, or relaxthe requirements.

Sensors 2017, 17, 19 7 of 32
3.3.1. Task 3.1: Initialize Parameters
This task focuses on the choice and initialization of the parameters needed to perform staticverification. The designed topology is loaded; then users can set several parameters, such as numberof timepoints, sensors and tolerated failures. Moreover, dependability thresholds are set.
3.3.2. Task 3.2: Robustness Checking
In this task, the WSN design is verified by means of an event-based formal approach.Dependability metrics (formalized in the Section 3.2.2) are evaluated against random sequencesof undesired events, useful to identify corner cases and dependability bottlenecks.
3.3.3. Task 3.2.1: Metric Evaluation
This task performs the computation of the dependability metrics (such as coverage and connectionresiliency) analyzing the outcome produced by the robustness checking process. The metrics arecalculated on the basis of their definitions and considering the output produced by the formal reasoner.Once the metric values have been obtained, this task provides the comparison among them and thethreshold values set by the user.
3.4. Deployment
In this phase, the WSN, verified at design time, is actually deployed distributing wireless sensorsin one or more environments.
Task 4.1: Deployment WSN
The aim of this task is to physically deploy the WSN in one or more environments.
3.5. Runtime Verification
Runtime verification is performed on the final running system. The aim is to formally checkthe running system (the WSN) against some correctness properties. The detection of the violationof a correctness property may be used either to trigger a recovery procedure for the running system,or to handle the incorrect status in a safe way. This feature is very useful as long as (although thecorrectness of the models of the system is granted by formal static verification activities) the quality ofthe running system may degrade to an unacceptable level, which can be identified just by runtimeverification activities.
3.5.1. Task 5.1: Failure-Detection
In this task, failure events (node failures, disconnections, ...), occurring in the wireless sensors,are detected during the system running and an event is generated in a particular formalism in order tostart the computing of the new dependability degree.
3.5.2. Task 5.1.1: Recovery
In this task, if the current value of metrics is lower than the desired threshold, the networkcharacteristics (topology, position of the nodes, power of transmission, etc.) can be modified to letthe WSN be able to satisfy the required dependability level. For instance, a node X can becomea dependability bottleneck if it is positioned in a way that makes it the only one to be used to connecttwo different portions of the WSN. A failure of node X then makes a whole portion of the WSN isolated.In the recovery task, once the problem is understood, the positions of node X can be modified in orderto let it share the traffic load with another node.
Sensors 2017, 17, 19 8 of 32
3.5.3. Task 5.2: Prediction
This task may allow the designing of predictive models for the running system. In particular,runtime verification is of course mainly focused on identifying the current situation of the system,which is the result of the sequence of events collected until the current moment. However, startingfrom the current situation and the sequence of past events, it is possible to exploit predictive models toforesee the forthcoming levels of dependability of the system.
3.5.4. Task 5.2.1: Metric Evaluation
This task operates like task 3.2.1. Of course, in this case, the target of the measure is the finalrunning system, instead of a model of it.
4. Specifications
In this section, we describe the formal specification of WSN correctness composed by two logicalsets: in the first one, we define invariant rules that are applicable to any WSN and thus written only onetime; in the second set, we define variable specifications that are dependent on a given WSN structure(i.e., topology, number of nodes, sent packets, etc.). All the defined formal specification underlies theverification process described in the previous section to perform static and runtime verification:
1. general correctness specification—set of correctness properties’ specifications, valid independentlyof the particular WSN under study
2. structural specification—a set of specifications and parameters related to the properties of thetarget WSN, e.g., number of nodes, network topology, quality of the wireless channel (in terms ofdisconnection probability), and initial charge of batteries. It has to be adapted when changing thetarget WSN, having thus the advantage of minimizing the effort.
4.1. Event Calculus
Since the normal and failing behavior of a WSN can be characterized in terms of an event flow(for instance, a node is turned on, a packet is sent, a packet is lost, a node stops working due tocrash or battery exhaustion, or it gets isolated from the rest of the network due to the failure of othernodes, etc.), we adopt an event-based formal language. In particular, among several event-basedformal languages, we choose Event Calculus, since its simplicity, its wide adoption in the sensornetworks arena [35,42–44], and the possibility to formally analyze the behavior of a system as eventflows, offer simple ways to evaluate the dependability metrics of our interest, even at runtime.
Event calculus was proposed for the first time in [45] and then it was extended in several ways [46].This language belongs to the family of logical languages and it is commonly used for representing andreasoning regarding the events and their effects [47].
Fluent, event and predicate are the basic concepts of event calculus [36]. Fluents are formalized asfunctions and they represent a stable status of the system. For every timepoint, the value of fluents orthe events that occur can be specified.
This language is also named “narrative-based”: in the event calculus, there is a single time-lineon which events occur and this event sequence represents the narrative. Dependability metrics can beevaluated by analyzing the narrative generated by an event calculus reasoner based on the specificationof the target WSN. A narrative is useful to understand a particular behavior of a WSN.
The most important and used predicates of event calculus are:Initiates, Terminates, HoldsAtand Happens.
Supposing that e is an event, f is a fluent and t is a timepoint, we have:
• Initiates (e, f, t): it means that, if the event e is executed at time t, then the fluent f will be trueafter t.
• Terminates (e, f, t): it has a similar meaning, with the only difference being that when the event eis executed at time t, then the fluent f will be false after t.
Sensors 2017, 17, 19 9 of 32
• HoldsAt (f, t): it is used to tell which fluents hold at a given timepoint.• Happens (e, t): it is used when the event e occurs at timepoint t.
Several techniques are considered to perform automated reasoning in event calculus, such assatisfiability solving, first-order logic automated theorem proving, Answer Set Programming and logicprogramming in Prolog.
To check the proposed correctness properties defined in event calculus, we use the Discrete EventCalculus (DEC) Reasoner [48]. The DEC Reasoner uses satisfiability (SAT) solvers [49] and by means ofthis we are able to perform reasoning, such as deduction, abduction, post-diction, and model finding.The DEC Reasoner is documented in detail in [50,51] in which its syntax is explained (e.g., the meaningof the symbols used in the formulas).
4.2. General Correctness Specification
The general correctness specification is described in the following. It specifies that a WSN performscorrectly if no undesired events (or failures) happen. From the results of a detailed Failure Modes andEffect Analysis (FMEA) conducted on WSNs in [52], the following are examples of undesired events,ordered from the most severe one to the least severe one:
1. isolation event, i.e., a node is no longer able to reach the sink;2. packet loss event, i.e., a packet is lost during the traversal of the network;3. battery exhaustion event, i.e., a node stops working since it has run out of battery.
These first two types of events are actually not independent, but might be caused by simpler“basic events”, such as the stop of one or more nodes (e.g., due to crash or battery exhaustion), or thetemporary disconnection of a node to its neighbor(s) due to transmission errors. So, the occurrence ofthe third event (battery exhaustion) might cause packet losses and isolation events, if no alternativeroutes are present in the network. In turn, the battery exhaustion event is dependent on the powerconsumption of the nodes as a consequence of packet sending and receiving activities (in generalassumed to be power demanding activities with respect to CPU activities [53]).
In this paper, we concentrate on the specifications related to the first event (isolation event) beingthe most severe one according to the FMEA in [52]; specifications of the other two events (packet lossand battery exhaustion), defined also in [52], are here omitted for a matter of space.
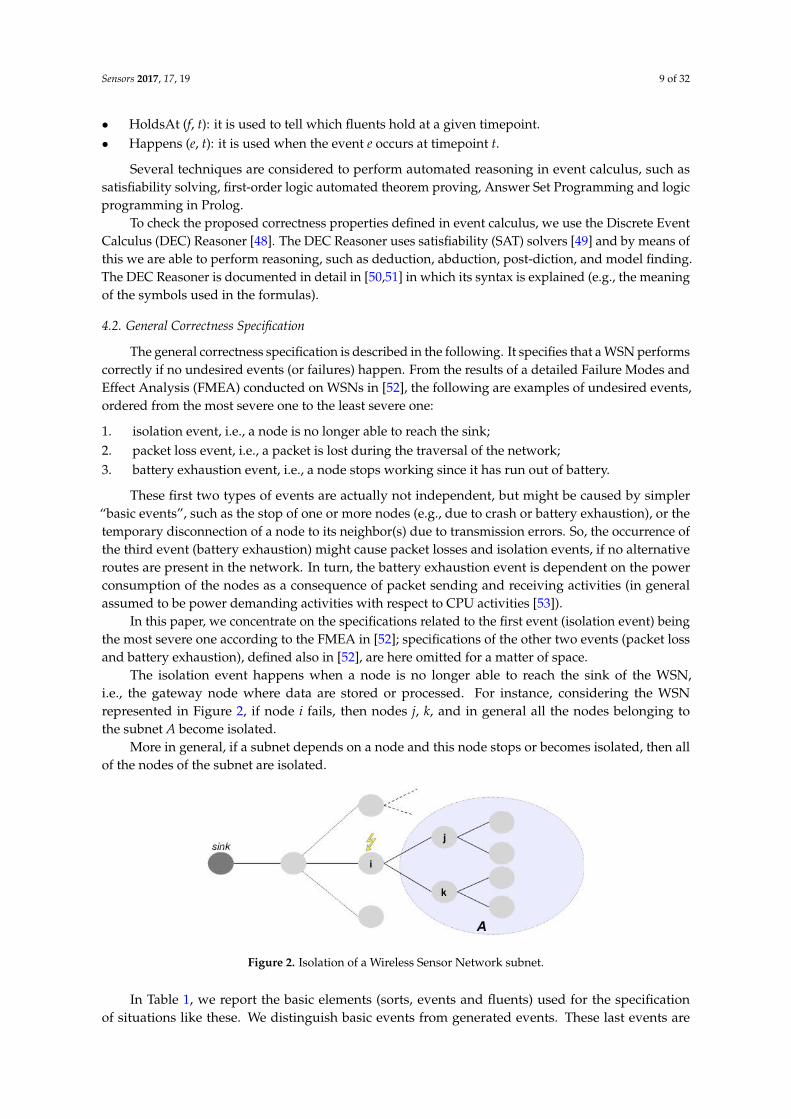
The isolation event happens when a node is no longer able to reach the sink of the WSN,i.e., the gateway node where data are stored or processed. For instance, considering the WSNrepresented in Figure 2, if node i fails, then nodes j, k, and in general all the nodes belonging tothe subnet A become isolated.
More in general, if a subnet depends on a node and this node stops or becomes isolated, then allof the nodes of the subnet are isolated.
Figure 2. Isolation of a Wireless Sensor Network subnet.
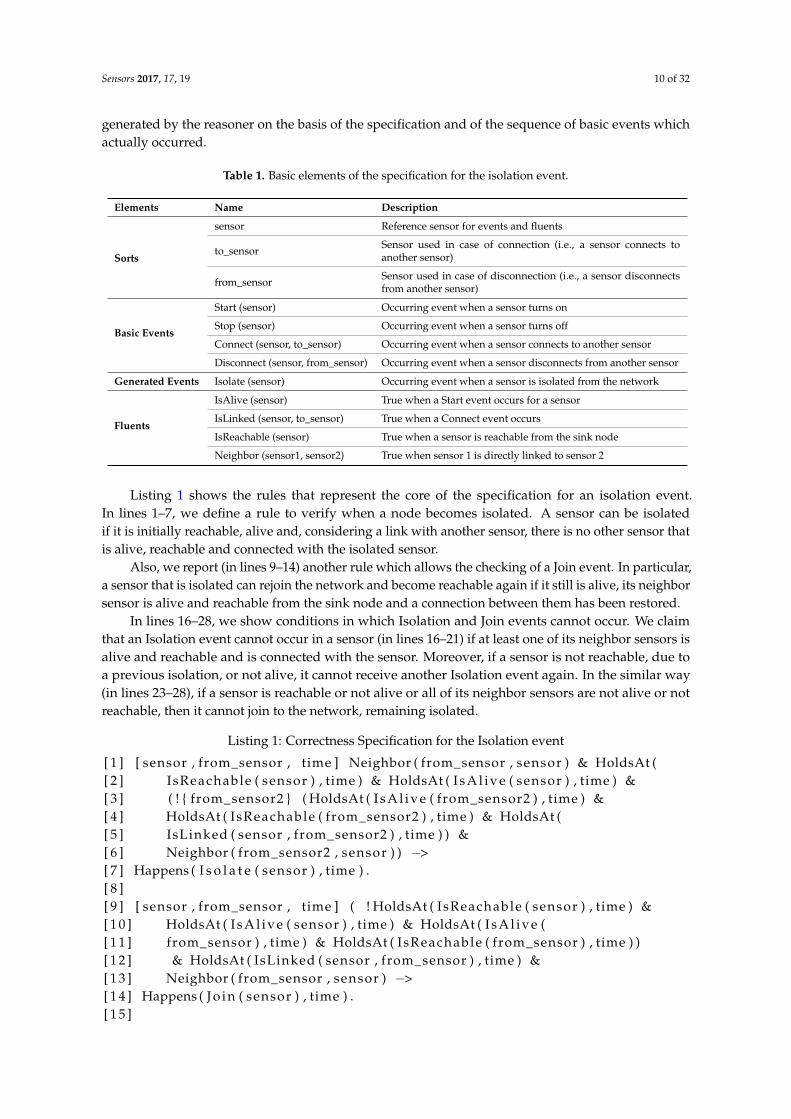
In Table 1, we report the basic elements (sorts, events and fluents) used for the specificationof situations like these. We distinguish basic events from generated events. These last events are
Sensors 2017, 17, 19 10 of 32
generated by the reasoner on the basis of the specification and of the sequence of basic events whichactually occurred.
Table 1. Basic elements of the specification for the isolation event.
Elements Name Description
Sorts
sensor Reference sensor for events and fluents
to_sensor Sensor used in case of connection (i.e., a sensor connects toanother sensor)
from_sensor Sensor used in case of disconnection (i.e., a sensor disconnectsfrom another sensor)
Basic Events
Start (sensor) Occurring event when a sensor turns on
Stop (sensor) Occurring event when a sensor turns off
Connect (sensor, to_sensor) Occurring event when a sensor connects to another sensor
Disconnect (sensor, from_sensor) Occurring event when a sensor disconnects from another sensor
Generated Events Isolate (sensor) Occurring event when a sensor is isolated from the network
Fluents
IsAlive (sensor) True when a Start event occurs for a sensor
IsLinked (sensor, to_sensor) True when a Connect event occurs
IsReachable (sensor) True when a sensor is reachable from the sink node
Neighbor (sensor1, sensor2) True when sensor 1 is directly linked to sensor 2
Listing 1 shows the rules that represent the core of the specification for an isolation event.In lines 1–7, we define a rule to verify when a node becomes isolated. A sensor can be isolatedif it is initially reachable, alive and, considering a link with another sensor, there is no other sensor thatis alive, reachable and connected with the isolated sensor.
Also, we report (in lines 9–14) another rule which allows the checking of a Join event. In particular,a sensor that is isolated can rejoin the network and become reachable again if it still is alive, its neighborsensor is alive and reachable from the sink node and a connection between them has been restored.
In lines 16–28, we show conditions in which Isolation and Join events cannot occur. We claimthat an Isolation event cannot occur in a sensor (in lines 16–21) if at least one of its neighbor sensors isalive and reachable and is connected with the sensor. Moreover, if a sensor is not reachable, due toa previous isolation, or not alive, it cannot receive another Isolation event again. In the similar way(in lines 23–28), if a sensor is reachable or not alive or all of its neighbor sensors are not alive or notreachable, then it cannot join to the network, remaining isolated.
Listing 1: Correctness Specification for the Isolation event
[ 1 ] [ sensor , from_sensor , time ] Neighbor ( from_sensor , sensor ) & HoldsAt ([ 2 ] IsReachable ( sensor ) , time ) & HoldsAt ( I s A l i v e ( sensor ) , time ) &[ 3 ] ( ! { from_sensor2 } ( HoldsAt ( I s A l i v e ( from_sensor2 ) , time ) &[ 4 ] HoldsAt ( IsReachable ( from_sensor2 ) , time ) & HoldsAt ([ 5 ] IsLinked ( sensor , from_sensor2 ) , time ) ) &[ 6 ] Neighbor ( from_sensor2 , sensor ) ) −>[ 7 ] Happens ( I s o l a t e ( sensor ) , time ) .[ 8 ][ 9 ] [ sensor , from_sensor , time ] ( ! HoldsAt ( IsReachable ( sensor ) , time ) &[ 1 0 ] HoldsAt ( I s A l i v e ( sensor ) , time ) & HoldsAt ( I s A l i v e ([ 1 1 ] from_sensor ) , time ) & HoldsAt ( IsReachable ( from_sensor ) , time ) )[ 1 2 ] & HoldsAt ( IsLinked ( sensor , from_sensor ) , time ) &[ 1 3 ] Neighbor ( from_sensor , sensor ) −>[ 1 4 ] Happens ( J o i n ( sensor ) , time ) .[ 1 5 ]
Sensors 2017, 17, 19 11 of 32
[ 1 6 ] [ sensor , from_sensor , time ] ( ( HoldsAt ( I s A l i v e ( from_sensor ) , time ) &[ 1 7 ] HoldsAt ( IsReachable ( from_sensor ) , time ) & HoldsAt ([ 1 8 ] IsLinked ( sensor , from_sensor ) , time ) ) | ! HoldsAt ([ 1 9 ] IsReachable ( sensor ) , time ) | ! HoldsAt ( I s A l i v e ( sensor ) , time ) )[ 2 0 ] & Neighbor ( from_sensor , sensor ) −>[ 2 1 ] ! Happens ( I s o l a t e ( sensor ) , time ) .[ 2 2 ][ 2 3 ] [ sensor , from_sensor , time ] ( HoldsAt ( IsReachable ( sensor ) , time ) |[ 2 4 ] ! HoldsAt ( I s A l i v e ( sensor ) , time ) | ! HoldsAt ([ 2 5 ] IsLinked ( sensor , from_sensor ) , time ) |[ 2 6 ] ! HoldsAt ( I s A l i v e ( from_sensor ) , time ) | ! HoldsAt ([ 2 7 ] IsReachable ( from_sensor ) , time ) ) & Neighbor ( from_sensor , sensor)−>[ 2 8 ] ! Happens ( J o i n ( sensor ) , time ) .
4.3. Structural Specification
General correctness specifications are complemented by a structural specification that comprisesa set of specifications and parameters related to the properties of the target WSN, e.g., number of nodes,network topology, quality of the wireless channel (in terms of disconnection probability), and initialcharge of batteries. This specification depends on a particular WSN topology and thus, differentlyfrom the specifications described in the previous sub-section, it varies on the basis of the characteristicsof the target WSN.
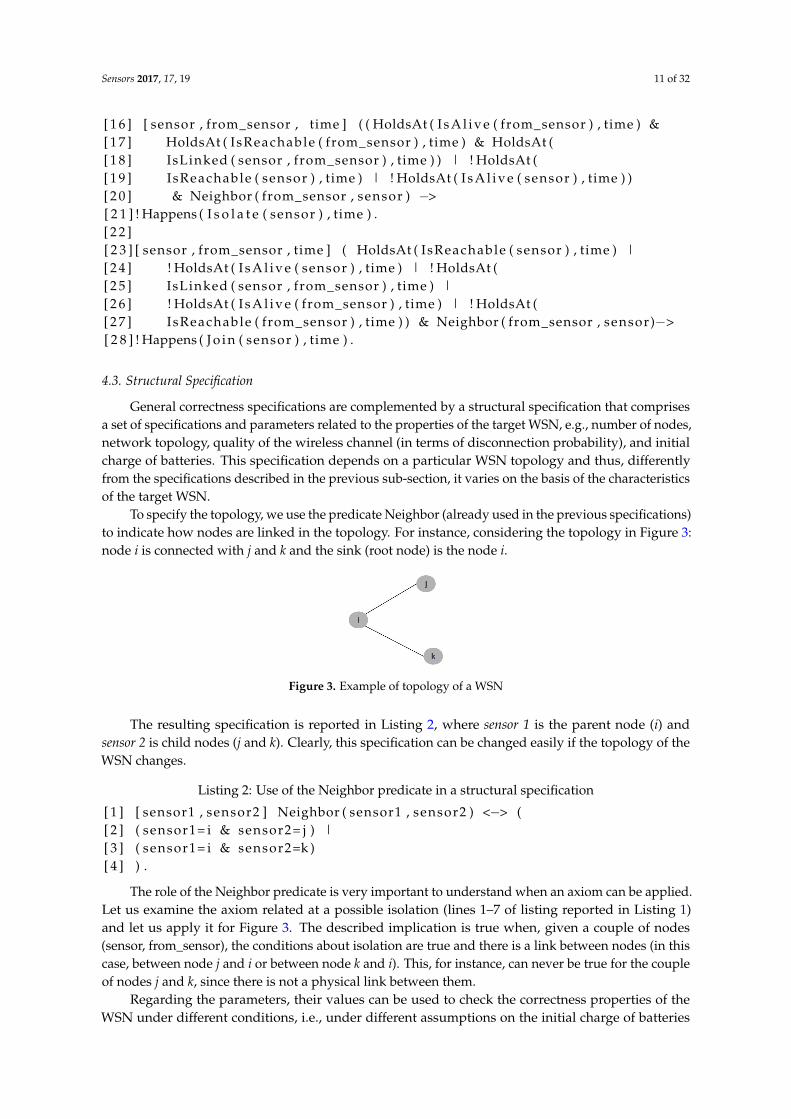
To specify the topology, we use the predicate Neighbor (already used in the previous specifications)to indicate how nodes are linked in the topology. For instance, considering the topology in Figure 3:node i is connected with j and k and the sink (root node) is the node i.
Figure 3. Example of topology of a WSN
The resulting specification is reported in Listing 2, where sensor 1 is the parent node (i) andsensor 2 is child nodes (j and k). Clearly, this specification can be changed easily if the topology of theWSN changes.
Listing 2: Use of the Neighbor predicate in a structural specification
[ 1 ] [ sensor1 , sensor2 ] Neighbor ( sensor1 , sensor2 ) <−> ([ 2 ] ( sensor1= i & sensor2= j ) |[ 3 ] ( sensor1= i & sensor2=k )[ 4 ] ) .
The role of the Neighbor predicate is very important to understand when an axiom can be applied.Let us examine the axiom related at a possible isolation (lines 1–7 of listing reported in Listing 1)and let us apply it for Figure 3. The described implication is true when, given a couple of nodes(sensor, from_sensor), the conditions about isolation are true and there is a link between nodes (in thiscase, between node j and i or between node k and i). This, for instance, can never be true for the coupleof nodes j and k, since there is not a physical link between them.
Regarding the parameters, their values can be used to check the correctness properties of theWSN under different conditions, i.e., under different assumptions on the initial charge of batteries
Sensors 2017, 17, 19 12 of 32
(e.g., to verify a WSN in the middle of its life), or under different environmental conditions affecting thequality of the channels (impacting on the probability of having a disconnection event when checkingthe robustness of the WSN).
4.4. Metrics Computation
The metrics of interest can be evaluated by using the narrative produced by the reasoner startingfrom the specification.
Starting from the coverage, it can be calculated by considering the threshold value and byanalyzing the IsReachable(sensor) and IsAlive(sensor) fluents found to be true in the event traceproduced by the reasoner: if a IsReachable(x) or a IsAlive(sensor) fluent is false in the event trace,this means that node x became isolated or it stopped. For example, in the case of coverage at 50%,for a WSN with seven nodes, there is coverage when at least four nodes are not isolated (i.e., theyare reachable). Hence, as soon as four different nodes are neither reachable nor alive (looking at thefluents), the network is not covered anymore. The coverage can be then evaluated as the interval [0, t],t being the timepoint of the last failure or disconnection event in the narrative before the isolation(e.g., the timepoint of the event that caused the isolation of a number of nodes exceeding the threshold).
The connection resiliency can then be evaluated as the number of failure and disconnectionevents (namely, Stop(sensor) and Disconnect(sensor, from_sensor) events) that happen within thecoverage interval, excluding the last failure/disconnection event, that is, the one that actually leads thenumber of isolated nodes to overcome the threshold. For example, if we have coverage in the interval[0, 6], and during this period three failure/disconnection events can be counted, then the connectionresiliency is 2, that is, the WSN was able to tolerate two failures or disconnections while preservingmore than 50% of the nodes connected.
Let us stress that the specifications and metrics adopted in the paper are chosen for illustrativereasons to show the use of the proposed methodology for static and runtime verification in practicalterms. If needed in particular application settings, the specification can be easily extended with morefluents and then the narrative used to evaluate other metrics. For instance, one can add a ”battery level”fluent to evaluate the power consumption of nodes, or a ”packet delivery” fluent to model the flow ofpackets among nodes and evaluate the probability of correct packet delivery.
4.5. Example: A Wireless Body Sensor Network
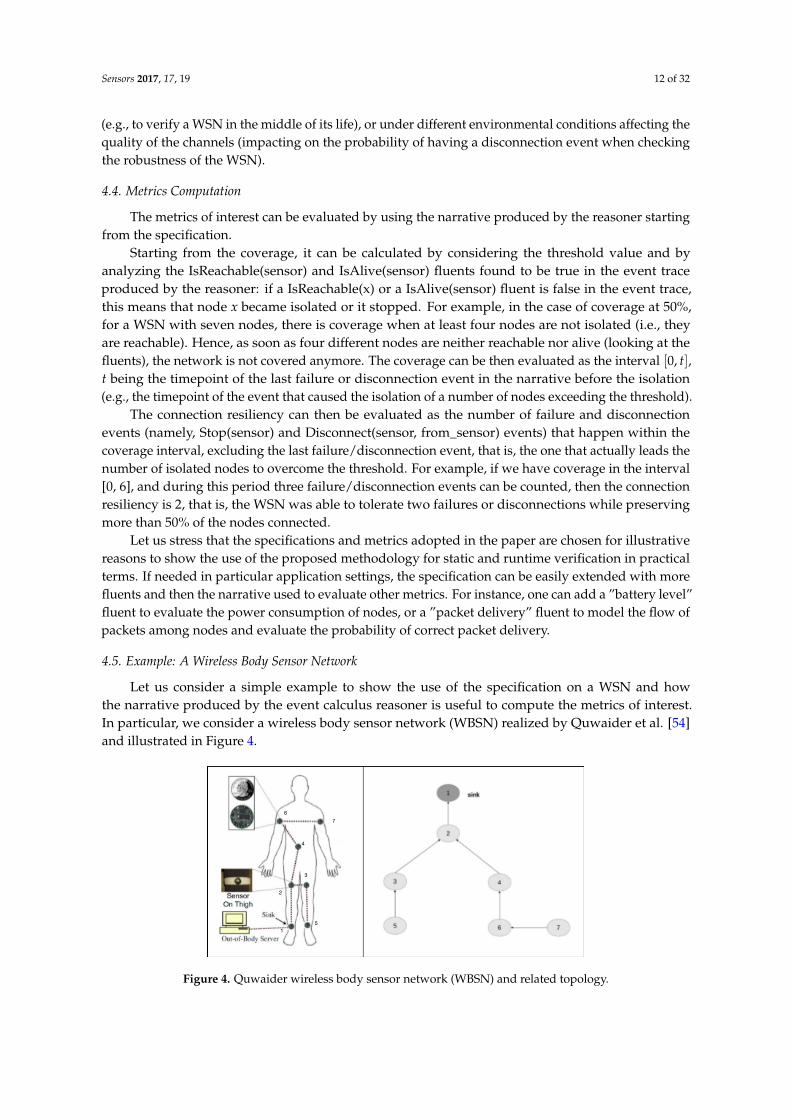
Let us consider a simple example to show the use of the specification on a WSN and howthe narrative produced by the event calculus reasoner is useful to compute the metrics of interest.In particular, we consider a wireless body sensor network (WBSN) realized by Quwaider et al. [54]and illustrated in Figure 4.
�
�
�
�
�
�
�
Figure 4. Quwaider wireless body sensor network (WBSN) and related topology.
Sensors 2017, 17, 19 13 of 32
This WBSN (Figure 4 on left side) is constructed by mounting seven sensor nodes attached ontwo ankles, two thighs, two upper-arms and one on the waist area. Each node consists of a 900 MHzMica2Dot MOTE (running Tiny-OS operating system).
On the right side of Figure 4, we report the node tree graph corresponding to the WSN, where thearrows indicate the relationship between a couple of nodes (i.e., node 2 depends on node 1, node 3 and4 depend on node 2, etc.).
The corresponding specification of the topology is reported in the Listing 3.Assuming a coverage threshold of 50%, let us suppose to be interested in analyzing the behavior
of the WBSN if the following events occur: Disconnect(5,3) at timepoint 1 and Stop(4) at timepoint 3.
Listing 3: Structural specification of the WBSN topology
[ 6 ] [ sensor1 , sensor2 ] Neighbor ( sensor1 , sensor2 ) <−> ([ 7 ] ( sensor1 =1 & sensor2 =2) |[ 8 ] ( sensor1 =2 & sensor2 =3) | ( sensor1 =2 & sensor2 =4) |[ 9 ] ( sensor1 =3 & sensor2 =5) |[ 1 0 ] ( sensor1 =4 & sensor2 =6) |[ 1 1 ] ( sensor1 =6 & sensor2 =7)[ 1 2 ] ) .
If the specification is correct, we should observe a coverage interval that equals to [0, 3] (i.e., whennode 4 stops at timepoint 3, four nodes are not reachable, namely 4, 5, 6 and 7), and a connectionresiliency equals to 1 (i.e., only one event—the Disconnect (5,3) event—is tolerated). To test the desiredevent sequence, we add an event trace (Listing 4) to the specification, composed by a list of Happenspredicates that specify nodes and timepoints in which a given event occurs. The completion statementspecifies that a predicate symbol (i.e., Happens) should be subject to predicate completion.
Listing 4: Event trace
[ 1 4 ] Happens ( Disconnect (5 , 3 ) , 1 ) .[ 1 5 ] Happens ( Stop ( 4 ) , 3 ) .[ 1 6 ][ 1 7 ] completion Happens[ 1 8 ]
Finally, in the last part, we consider ranges of values for sensors and timepoints (Listing 5). In thiscase, we know that the network is composed of seven nodes and we want to observe what couldhappen in 10 timepoints.
Listing 5: Parameters
[ 2 1 ] range sensor 1 7[ 2 2 ] range time 0 10
Listing 6 reports the outcome (the narrative) produced by the DEC Reasoner. The event traceconfirms our expectations. We can observe that after the stop of node 4, nodes 6 and 7 become notreachable. Considering that node 5 was already not reachable, this means that a total of four nodes areisolated. The coverage is computed as the timepoint of the last failure event causing such isolation,that is 3. Consequently, the connection resiliency is computed by counting the number of failure anddisconnection events in the interval [0, 3], excluding the last event; hence, it is equal to 1, as expected.
For this example, we consider both the coverage and connection resiliency threshold set as valueschosen without particular meaning; in fact, on the basis of the desired outcome, the thresholds can beset by means of the our proposed tool.
Sensors 2017, 17, 19 14 of 32
Listing 6: Outcome of the DEC Reasoner
[ 1 ] 0[ 2 ] 1[ 3 ] Happens ( Disconnect ( 5 , 3 ) , 1 ) .[ 4 ] 2[ 5 ] −IsLinked ( 5 , 3 ) .[ 6 ] Happens ( I s o l a t e ( 5 ) , 2 ) .[ 7 ] 3[ 8 ] −IsReachable ( 5 ) .[ 9 ] Happens ( Stop ( 4 ) , 3 ) .[ 1 0 ] 4[ 1 1 ] −I s A l i v e ( 4 ) .[ 1 2 ] Happens ( I s o l a t e ( 6 ) , 4 ) .[ 1 3 ] 5[ 1 4 ] −IsReachable ( 6 ) .[ 1 5 ] Happens ( I s o l a t e ( 7 ) , 5 ) .[ 1 6 ] 6[ 1 7 ] −IsReachable ( 7 ) .[ 2 0 ] 7[ 2 1 ] 8[ 2 2 ] 9[ 2 3 ] 10
5. Static Verification
In the previous example, we have shown how the specifications and the reasoning performedon them can be exploited to analyze the WSN response to a given sequence of undesired events.This concept can be extended to test the WSN against a variable sequence of events, in order to verifyits design (textitstatic verification) in the form of a coverage robustness checking.
Specifically, the verification consists of analyzing the robustness of the network, in terms ofcoverage, against a variable number of failures (stop and disconnection events), from 1 to n, where nis selected by the user, considering all combinations without repetitions. This is useful to check howmany node failures the network can tolerate, while guaranteeing a given minimum level of coverage.For example, if we consider a network composed by m nodes and a threshold coverage equal to 50%,we may want to understand what are the sequences of failures causing more than m/two nodes to beisolated (i.e., coverage under the specified threshold) and how the resiliency level varies when varyingthe sequences of failures. This allows the evaluation of the maximum (and minimum) resiliencylevel reachable by a given topology and what are the critical failure sequences, i.e., the shortest onescausing a loss of coverage. These are particularly useful to pinpoint weak points in the network(so-called dependability bottlenecks).
We developed an algorithm to generate automatically the sequences of failures (stop anddisconnection events specified with Happens predicates) against which to check the robustness of theWSN. The algorithm is implemented by the ADVISES tool (see Section 7.1), and it is aimed at reducingthe number of failure sequences to be checked. The principles are to avoid repetitions and to end thesequence as soon as the coverage level becomes lower than the user defined threshold. For instance, westart considering all the cases when there is one failure. By means of the DEC Reasoner, we computethe coverage; if the coverage is above the threshold, the resiliency is surely greater than 1, becausethere is just one failure and it is tolerated in all cases. In the generic k-th step, we consider sequencesof k failures. If the generic sequence { f1, f2, ..., fk} leads to a coverage below the threshold, we donot consider sequences starting with an { f1, f2, ..., fk} prefix in the (k + 1)-th step. By considering
Sensors 2017, 17, 19 15 of 32
the percentage of sequences with k failures where the coverage is above the threshold, let us say rk%,we can say that the resiliency is k in rk% of cases.
6. Runtime Verification
The aim of this step is i) to perform a Runtime Verification (RV) [12,55] detecting failure eventsoccurring in a real WSN, possibly to activate recovery actions and ii) to perform a prediction of thecritical levels of next failure events that may occur in the WSN, in order to take countermeasuresin advance. In this case, critical events, e.g., Stop and Disconnect, are not simulated anymore withHappens predicates, but they are detected from the real system, through system monitors. Detailsabout such monitors are not in the scope of this paper, and are addressed in our previous work in [56].
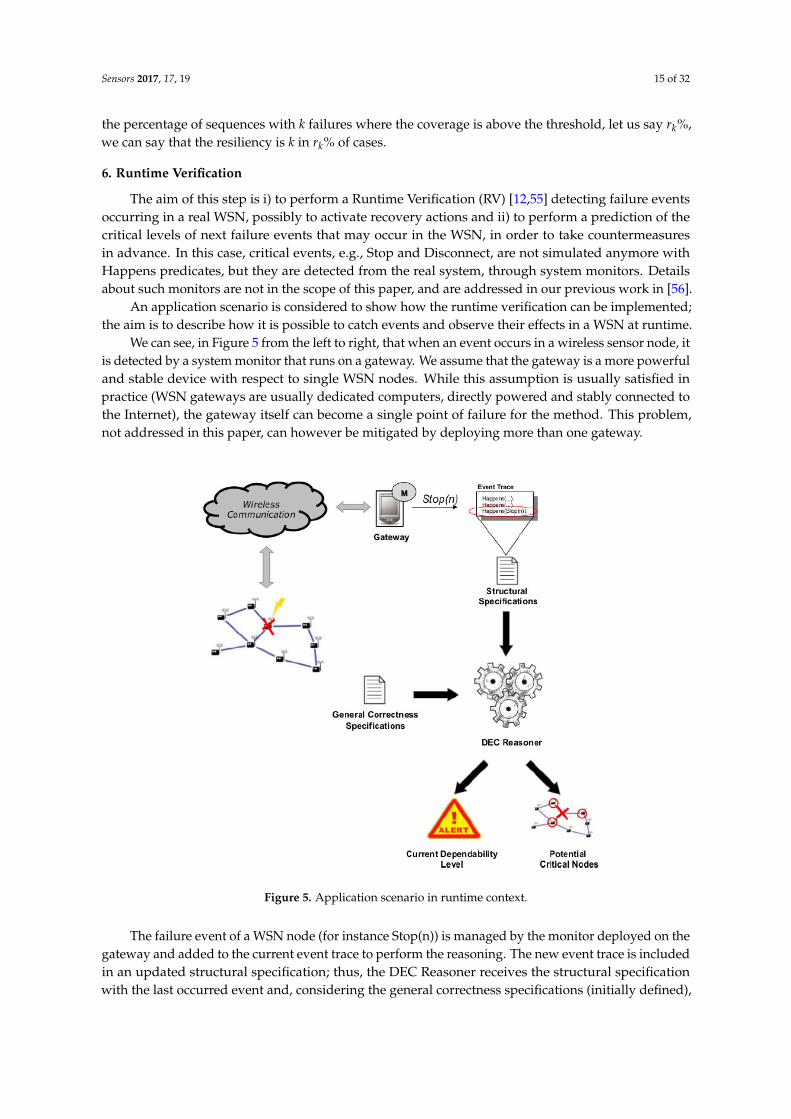
An application scenario is considered to show how the runtime verification can be implemented;the aim is to describe how it is possible to catch events and observe their effects in a WSN at runtime.
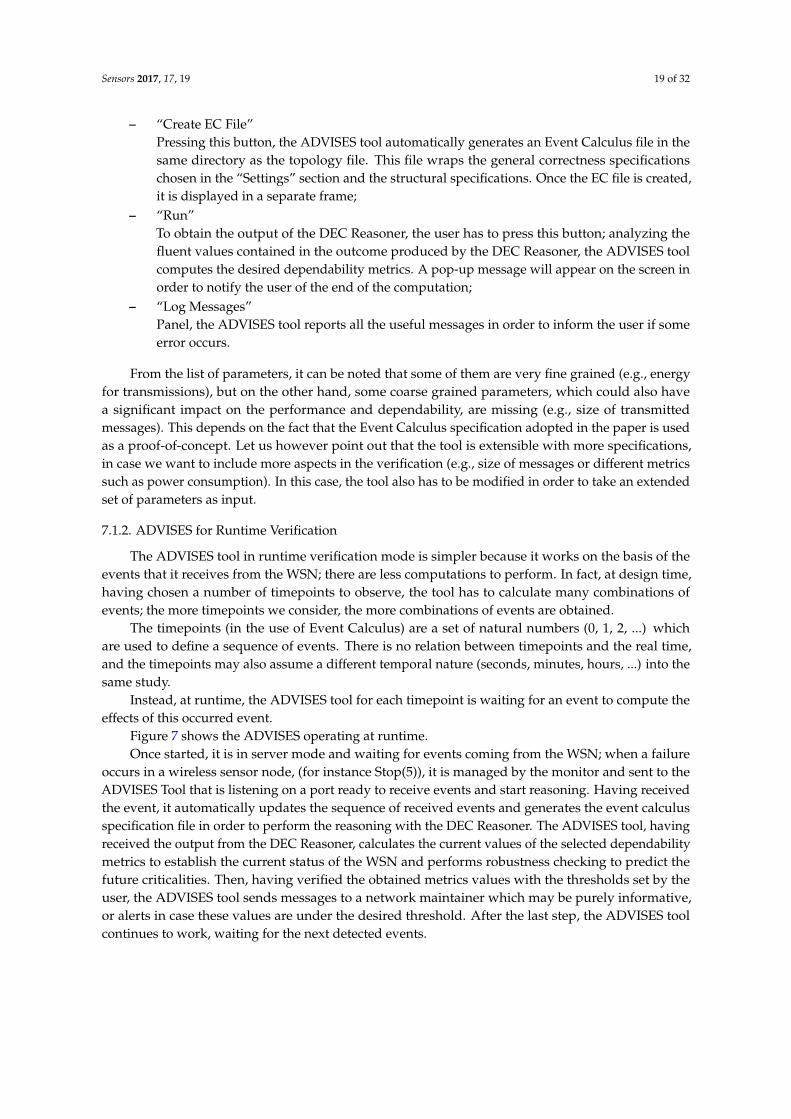
We can see, in Figure 5 from the left to right, that when an event occurs in a wireless sensor node, itis detected by a system monitor that runs on a gateway. We assume that the gateway is a more powerfuland stable device with respect to single WSN nodes. While this assumption is usually satisfied inpractice (WSN gateways are usually dedicated computers, directly powered and stably connected tothe Internet), the gateway itself can become a single point of failure for the method. This problem,not addressed in this paper, can however be mitigated by deploying more than one gateway.
Figure 5. Application scenario in runtime context.
The failure event of a WSN node (for instance Stop(n)) is managed by the monitor deployed on thegateway and added to the current event trace to perform the reasoning. The new event trace is includedin an updated structural specification; thus, the DEC Reasoner receives the structural specificationwith the last occurred event and, considering the general correctness specifications (initially defined),
Sensors 2017, 17, 19 16 of 32
performs the reasoning, returning a couple of outcomes: (i) the Current Dependability Level of theWSN and (ii) the Potential Critical Nodes.
The first outcome reports the current WSN dependability level (i.e., the WSN now covers theX% of the monitored area, and it has been resilient to Y failures so far). The second outcome isa prediction about possible critical events that may occur after the current event (e.g., from now on,node Z represents a weak point in the WSN: it should be replicated or its batteries should be replaced).Moreover, the runtime verification is useful to further verify, at runtime, the WSN design that hasbeen validated at design time. Even if a WSN is checked at design time, it is necessary to observewhether the implemented WSN conforms to expectations and to continuously monitor whether it isable to cope with unexpected events. If the network becomes isolated due to the failure of the onlynode connecting to the gateway, then the whole network will result isolated. This severe failure eventcould be already recognized by the method at design time, either by performing a what-if analysis or arobustness checking run, suggesting that the user reinforce the connectivity of the network.
Clearly, the quality of the information provided to the user depends on the quality of the detection.However, let us stress that the consequences of a wrong detection can be mitigated by the user.The outcome of the runtime verification is an alert to the user coupled with an indication of potentialcritical nodes. The alerted user can then check the actual state of the network before performing anyinadequate reaction. Let us also observe that the probability of a wrong detection depends on the typeof events to be detected. In the case of a fail stop behavior (such as a node crash as assumed in thepaper) then the probability of wrong detection is very low since it is easy to verify for a given intervalof time (through the monitors) if the node is indeed stopped. In this case, it is possible to providereliable information to the reasoner and to the user.
7. Case Studies
In this section, by means of two case studies, we apply the methodology described in Section 3 tostudy and improve the robustness of two WSNs.
We have performed our experiments on a Intel P4 machine, CPU Clock 3.5 GHz, 512 MB RAM,equipped with Linux, Kernel 3.8.8. Although rather old, this hardware setting is representative of theprocessing power of a hypothetical gateway to be used at runtime (see Section 7.2.2).
We have focused on WSN-based healthcare systems due to their criticality related to patientmonitoring scenarios.
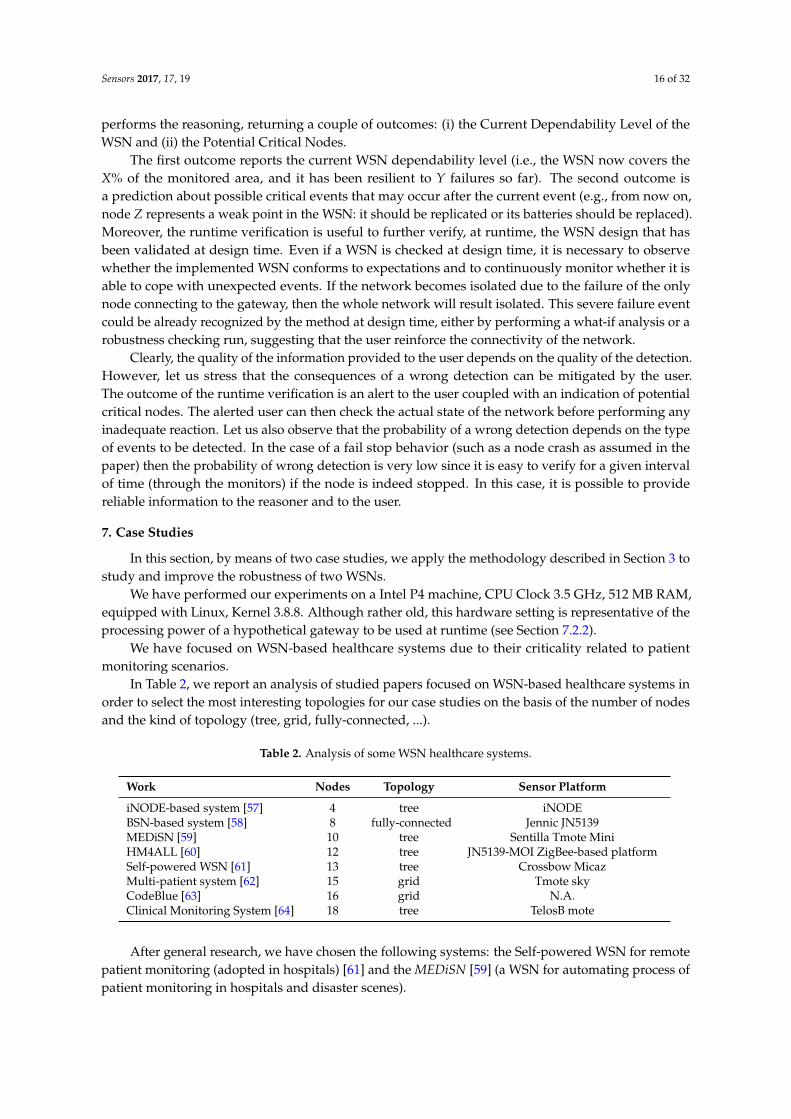
In Table 2, we report an analysis of studied papers focused on WSN-based healthcare systems inorder to select the most interesting topologies for our case studies on the basis of the number of nodesand the kind of topology (tree, grid, fully-connected, ...).
Table 2. Analysis of some WSN healthcare systems.
Work Nodes Topology Sensor Platform
iNODE-based system [57] 4 tree iNODEBSN-based system [58] 8 fully-connected Jennic JN5139MEDiSN [59] 10 tree Sentilla Tmote MiniHM4ALL [60] 12 tree JN5139-MOI ZigBee-based platformSelf-powered WSN [61] 13 tree Crossbow MicazMulti-patient system [62] 15 grid Tmote skyCodeBlue [63] 16 grid N.A.Clinical Monitoring System [64] 18 tree TelosB mote
After general research, we have chosen the following systems: the Self-powered WSN for remotepatient monitoring (adopted in hospitals) [61] and the MEDiSN [59] (a WSN for automating process ofpatient monitoring in hospitals and disaster scenes).
Sensors 2017, 17, 19 17 of 32
The two networks have features that are useful to check the performances of our tool and thuscollect interesting results. The former (Self-powered WSN) is represented by a perfect balanced tree;the latter is characterized by a sequence of three nodes in a row that could easily cause the majority ofbottleneck and isolation problems; in particular, considering the MEDiSN network, we show how thisnetwork could improve by modifying the placement of the nodes.
In order to facilitate and automatize the application of the proposed methodology(comprising static and runtime verification) against a general case study, a Java-based tool, calledADVISES (available on sourgeforce) (AutomateD VerIfication of wSn with Event calculuS),has beendesigned and implemented.
7.1. The ADVISES Tool
The goal of the ADVISES tool [52] is to provide technical support to the methodology addressingpractical aspects (e.g., setting of parameters necessary to start verification, realization of structuralspecification in an automatic way and merge with general specification).
This tool has been realized (i) to operate in double mode: static and runtime; (ii) to automaticallygenerate the structural specifications given the properties of a target WSN; (iii) to perform the reasoningstarting from the correctness and structural specifications; (iv) to compute dependability metricsstarting from the event trace produced by the reasoner; and (v) to receive events in real-time froma WSN to start runtime verification and to evaluate current and future criticalities.
In particular, at runtime, it is like a server that is in waiting for new events coming from the WSNand that are detected by means of a system monitor.
Since the static and runtime verification do not require the same number of input parameters,we present the ADVISES tool operating in double mode: in static mode we need to select severalparameters that in runtime mode they are not necessary.
7.1.1. ADVISES for Static Verification
The ADVISES tool in static verification needs several parameters, such as the number of packets,the number of failures, the battery capacity value of a node, the initial event trace, etc.
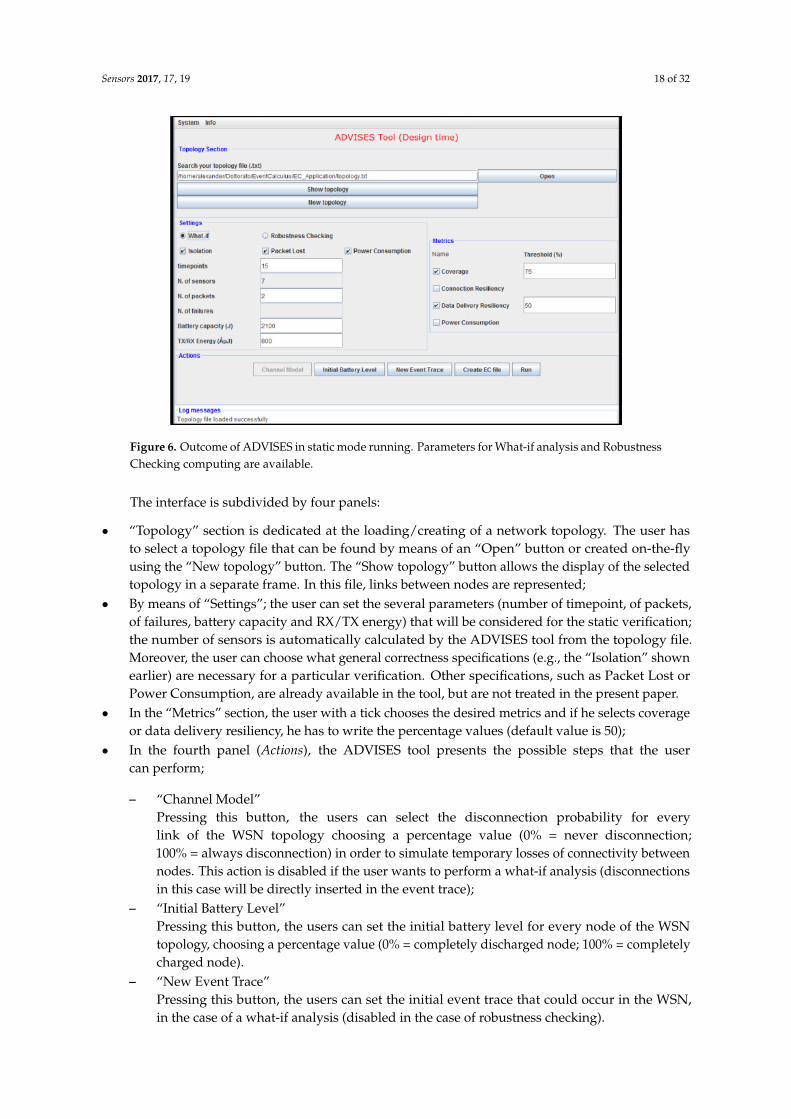
By means of the interface shown in Figure 6, a user can simply specify (i) the topology of thetarget WSN (using a connectivity matrix); (ii) the formal correctness specifications (e.g., for checkingisolation events); (iii) the temporal window size to consider (in terms of the number of timepoints);(iv) the number of packets that each sensor can send; (v) the number of failures to be simulated (in caseof robustness checking); (vi) the battery capacity of a sensor (in J) and the needed energy for RX/TXoperations (in µJ); (vii) the metrics to calculate (for coverage, the threshold value is also necessary);(viii) the channel model; (ix) the initial battery level (to simulate nodes that do not start with fullbattery capacity; if not specified, then the battery capacity (parameter vi) is assumed as initial batterylevel); (x) the initial event trace (in case the user wants to perform a “what-if” analysis for a given setof events instead of a robustness check with random sequences of undesired events).
The number of failures to be simulated is a parameter that can be set by the user depending onhis/her objectives. For instance, if the user wants to verify whether the WSN is resilient to at leastthree failures (connection resiliency equals 3) then at least three failures have to be simulated for eachrobustness checking random run. Clearly, the number of failures should not exceed the number ofnodes or the number of paths present in the topology. However, this check is currently not performedby the tool.
Sensors 2017, 17, 19 18 of 32
Figure 6. Outcome of ADVISES in static mode running. Parameters for What-if analysis and RobustnessChecking computing are available.
The interface is subdivided by four panels:
• “Topology” section is dedicated at the loading/creating of a network topology. The user hasto select a topology file that can be found by means of an “Open” button or created on-the-flyusing the “New topology” button. The “Show topology” button allows the display of the selectedtopology in a separate frame. In this file, links between nodes are represented;
• By means of “Settings”; the user can set the several parameters (number of timepoint, of packets,of failures, battery capacity and RX/TX energy) that will be considered for the static verification;the number of sensors is automatically calculated by the ADVISES tool from the topology file.Moreover, the user can choose what general correctness specifications (e.g., the “Isolation” shownearlier) are necessary for a particular verification. Other specifications, such as Packet Lost orPower Consumption, are already available in the tool, but are not treated in the present paper.
• In the “Metrics” section, the user with a tick chooses the desired metrics and if he selects coverageor data delivery resiliency, he has to write the percentage values (default value is 50);
• In the fourth panel (Actions), the ADVISES tool presents the possible steps that the usercan perform;
– “Channel Model”Pressing this button, the users can select the disconnection probability for everylink of the WSN topology choosing a percentage value (0% = never disconnection;100% = always disconnection) in order to simulate temporary losses of connectivity betweennodes. This action is disabled if the user wants to perform a what-if analysis (disconnectionsin this case will be directly inserted in the event trace);
– “Initial Battery Level”Pressing this button, the users can set the initial battery level for every node of the WSNtopology, choosing a percentage value (0% = completely discharged node; 100% = completelycharged node).
– “New Event Trace”Pressing this button, the users can set the initial event trace that could occur in the WSN,in the case of a what-if analysis (disabled in the case of robustness checking).
Sensors 2017, 17, 19 19 of 32
– “Create EC File”Pressing this button, the ADVISES tool automatically generates an Event Calculus file in thesame directory as the topology file. This file wraps the general correctness specificationschosen in the “Settings” section and the structural specifications. Once the EC file is created,it is displayed in a separate frame;
– “Run”To obtain the output of the DEC Reasoner, the user has to press this button; analyzing thefluent values contained in the outcome produced by the DEC Reasoner, the ADVISES toolcomputes the desired dependability metrics. A pop-up message will appear on the screen inorder to notify the user of the end of the computation;
– “Log Messages”Panel, the ADVISES tool reports all the useful messages in order to inform the user if someerror occurs.
From the list of parameters, it can be noted that some of them are very fine grained (e.g., energyfor transmissions), but on the other hand, some coarse grained parameters, which could also havea significant impact on the performance and dependability, are missing (e.g., size of transmittedmessages). This depends on the fact that the Event Calculus specification adopted in the paper is usedas a proof-of-concept. Let us however point out that the tool is extensible with more specifications,in case we want to include more aspects in the verification (e.g., size of messages or different metricssuch as power consumption). In this case, the tool also has to be modified in order to take an extendedset of parameters as input.
7.1.2. ADVISES for Runtime Verification
The ADVISES tool in runtime verification mode is simpler because it works on the basis of theevents that it receives from the WSN; there are less computations to perform. In fact, at design time,having chosen a number of timepoints to observe, the tool has to calculate many combinations ofevents; the more timepoints we consider, the more combinations of events are obtained.
The timepoints (in the use of Event Calculus) are a set of natural numbers (0, 1, 2, ...) whichare used to define a sequence of events. There is no relation between timepoints and the real time,and the timepoints may also assume a different temporal nature (seconds, minutes, hours, ...) into thesame study.
Instead, at runtime, the ADVISES tool for each timepoint is waiting for an event to compute theeffects of this occurred event.
Figure 7 shows the ADVISES operating at runtime.Once started, it is in server mode and waiting for events coming from the WSN; when a failure
occurs in a wireless sensor node, (for instance Stop(5)), it is managed by the monitor and sent to theADVISES Tool that is listening on a port ready to receive events and start reasoning. Having receivedthe event, it automatically updates the sequence of received events and generates the event calculusspecification file in order to perform the reasoning with the DEC Reasoner. The ADVISES tool, havingreceived the output from the DEC Reasoner, calculates the current values of the selected dependabilitymetrics to establish the current status of the WSN and performs robustness checking to predict thefuture criticalities. Then, having verified the obtained metrics values with the thresholds set by theuser, the ADVISES tool sends messages to a network maintainer which may be purely informative,or alerts in case these values are under the desired threshold. After the last step, the ADVISES toolcontinues to work, waiting for the next detected events.
Sensors 2017, 17, 19 20 of 32
Figure 7. Outcome of ADVISES in runtime mode running. Only timepoint parameter is editable: thisis the observation time in an experiment at runtime.
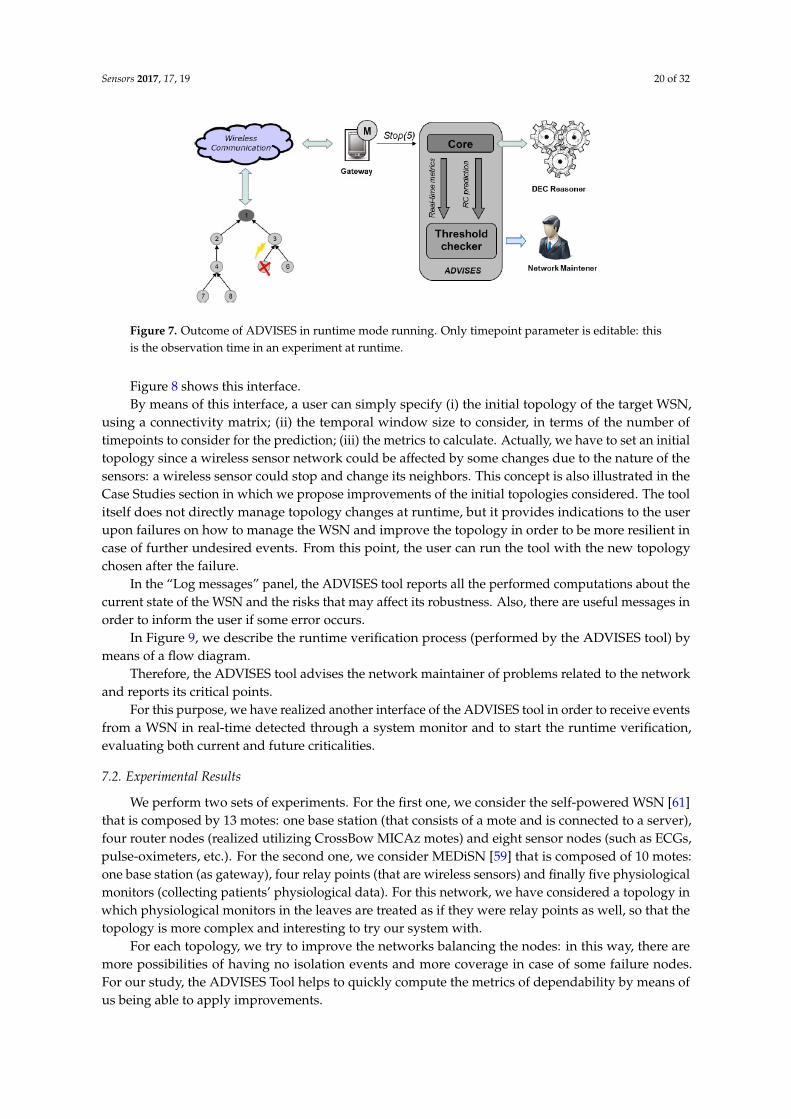
Figure 8 shows this interface.By means of this interface, a user can simply specify (i) the initial topology of the target WSN,
using a connectivity matrix; (ii) the temporal window size to consider, in terms of the number oftimepoints to consider for the prediction; (iii) the metrics to calculate. Actually, we have to set an initialtopology since a wireless sensor network could be affected by some changes due to the nature of thesensors: a wireless sensor could stop and change its neighbors. This concept is also illustrated in theCase Studies section in which we propose improvements of the initial topologies considered. The toolitself does not directly manage topology changes at runtime, but it provides indications to the userupon failures on how to manage the WSN and improve the topology in order to be more resilient incase of further undesired events. From this point, the user can run the tool with the new topologychosen after the failure.
In the “Log messages” panel, the ADVISES tool reports all the performed computations about thecurrent state of the WSN and the risks that may affect its robustness. Also, there are useful messages inorder to inform the user if some error occurs.
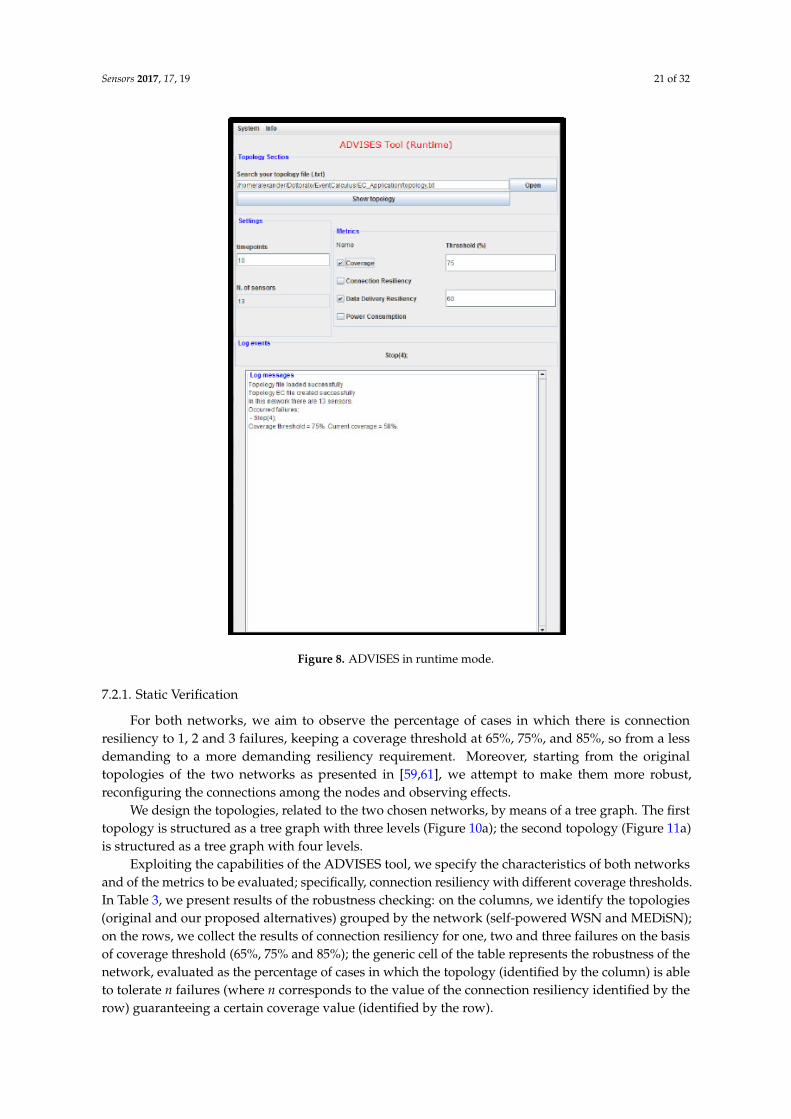
In Figure 9, we describe the runtime verification process (performed by the ADVISES tool) bymeans of a flow diagram.
Therefore, the ADVISES tool advises the network maintainer of problems related to the networkand reports its critical points.
For this purpose, we have realized another interface of the ADVISES tool in order to receive eventsfrom a WSN in real-time detected through a system monitor and to start the runtime verification,evaluating both current and future criticalities.
7.2. Experimental Results
We perform two sets of experiments. For the first one, we consider the self-powered WSN [61]that is composed by 13 motes: one base station (that consists of a mote and is connected to a server),four router nodes (realized utilizing CrossBow MICAz motes) and eight sensor nodes (such as ECGs,pulse-oximeters, etc.). For the second one, we consider MEDiSN [59] that is composed of 10 motes:one base station (as gateway), four relay points (that are wireless sensors) and finally five physiologicalmonitors (collecting patients’ physiological data). For this network, we have considered a topology inwhich physiological monitors in the leaves are treated as if they were relay points as well, so that thetopology is more complex and interesting to try our system with.
For each topology, we try to improve the networks balancing the nodes: in this way, there aremore possibilities of having no isolation events and more coverage in case of some failure nodes.For our study, the ADVISES Tool helps to quickly compute the metrics of dependability by means ofus being able to apply improvements.
Sensors 2017, 17, 19 21 of 32
Figure 8. ADVISES in runtime mode.
7.2.1. Static Verification
For both networks, we aim to observe the percentage of cases in which there is connectionresiliency to 1, 2 and 3 failures, keeping a coverage threshold at 65%, 75%, and 85%, so from a lessdemanding to a more demanding resiliency requirement. Moreover, starting from the originaltopologies of the two networks as presented in [59,61], we attempt to make them more robust,reconfiguring the connections among the nodes and observing effects.
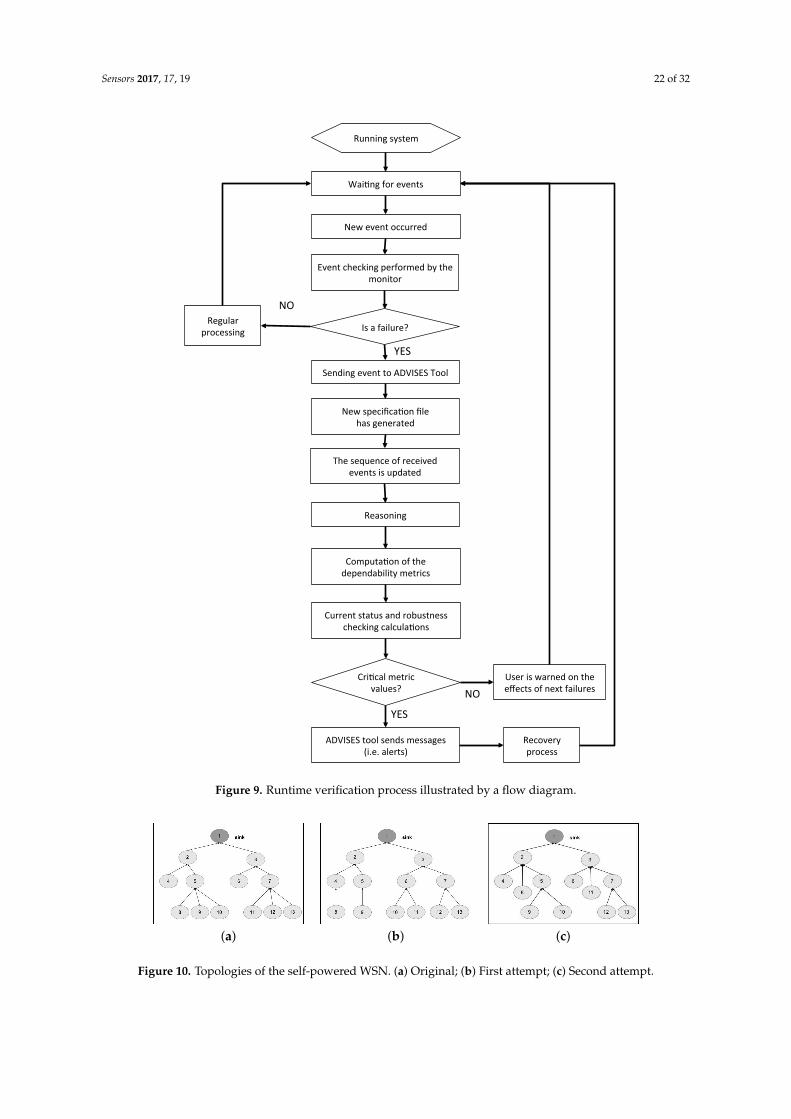
We design the topologies, related to the two chosen networks, by means of a tree graph. The firsttopology is structured as a tree graph with three levels (Figure 10a); the second topology (Figure 11a)is structured as a tree graph with four levels.
Exploiting the capabilities of the ADVISES tool, we specify the characteristics of both networksand of the metrics to be evaluated; specifically, connection resiliency with different coverage thresholds.In Table 3, we present results of the robustness checking: on the columns, we identify the topologies(original and our proposed alternatives) grouped by the network (self-powered WSN and MEDiSN);on the rows, we collect the results of connection resiliency for one, two and three failures on the basisof coverage threshold (65%, 75% and 85%); the generic cell of the table represents the robustness of thenetwork, evaluated as the percentage of cases in which the topology (identified by the column) is ableto tolerate n failures (where n corresponds to the value of the connection resiliency identified by therow) guaranteeing a certain coverage value (identified by the row).
Sensors 2017, 17, 19 22 of 32
Wai$ngforevents
Neweventoccurred
Isafailure?Regular
processing
SendingeventtoADVISESTool
Eventcheckingperformedbythemonitor
Thesequenceofreceivedeventsisupdated
Newspecifica$onfilehasgenerated
Reasoning
Computa$onofthedependabilitymetrics
Currentstatusandrobustnesscheckingcalcula$ons
ADVISEStoolsendsmessages(i.e.alerts)
Cri$calmetricvalues?
NO
YES
YES
UseriswarnedontheeffectsofnextfailuresNO
Runningsystem
Recoveryprocess
Figure 9. Runtime verification process illustrated by a flow diagram.
(a) (b) (c)
Figure 10. Topologies of the self-powered WSN. (a) Original; (b) First attempt; (c) Second attempt.
Sensors 2017, 17, 19 23 of 32
(a) (b) (c)
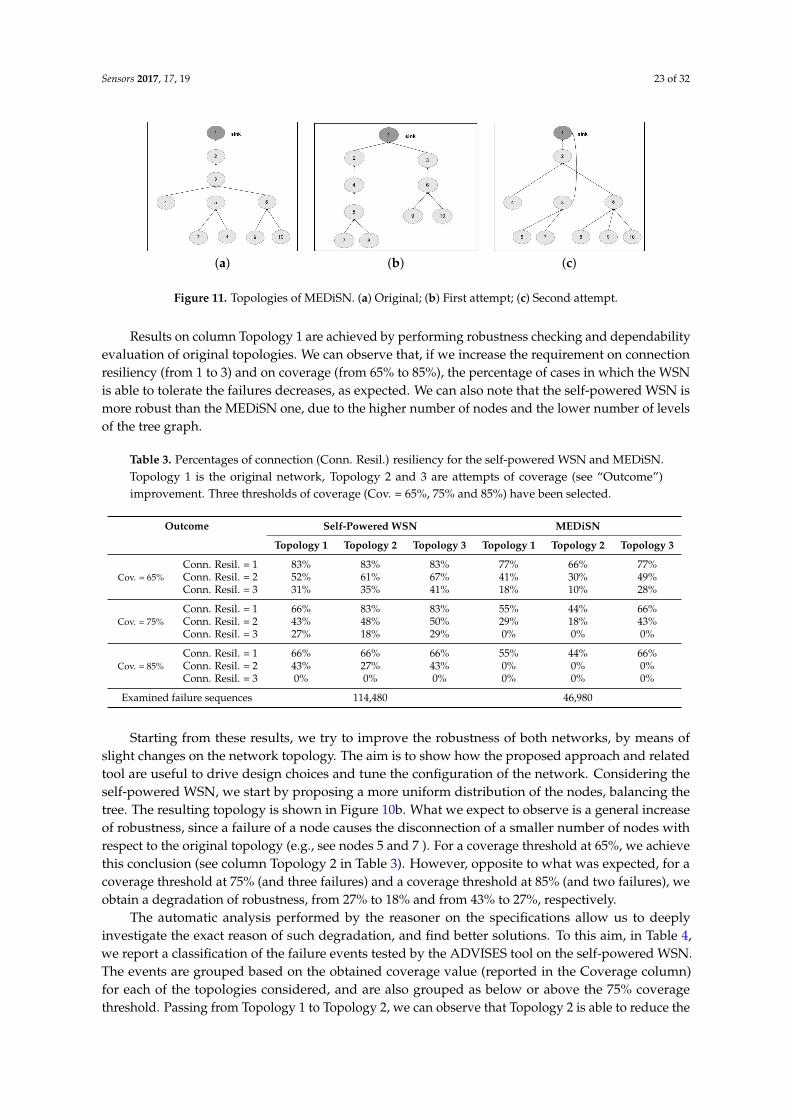
Figure 11. Topologies of MEDiSN. (a) Original; (b) First attempt; (c) Second attempt.
Results on column Topology 1 are achieved by performing robustness checking and dependabilityevaluation of original topologies. We can observe that, if we increase the requirement on connectionresiliency (from 1 to 3) and on coverage (from 65% to 85%), the percentage of cases in which the WSNis able to tolerate the failures decreases, as expected. We can also note that the self-powered WSN ismore robust than the MEDiSN one, due to the higher number of nodes and the lower number of levelsof the tree graph.
Table 3. Percentages of connection (Conn. Resil.) resiliency for the self-powered WSN and MEDiSN.Topology 1 is the original network, Topology 2 and 3 are attempts of coverage (see “Outcome”)improvement. Three thresholds of coverage (Cov. = 65%, 75% and 85%) have been selected.
Outcome Self-Powered WSN MEDiSN
Topology 1 Topology 2 Topology 3 Topology 1 Topology 2 Topology 3
Cov. = 65%Conn. Resil. = 1 83% 83% 83% 77% 66% 77%Conn. Resil. = 2 52% 61% 67% 41% 30% 49%Conn. Resil. = 3 31% 35% 41% 18% 10% 28%
Cov. = 75%Conn. Resil. = 1 66% 83% 83% 55% 44% 66%Conn. Resil. = 2 43% 48% 50% 29% 18% 43%Conn. Resil. = 3 27% 18% 29% 0% 0% 0%
Cov. = 85%Conn. Resil. = 1 66% 66% 66% 55% 44% 66%Conn. Resil. = 2 43% 27% 43% 0% 0% 0%Conn. Resil. = 3 0% 0% 0% 0% 0% 0%
Examined failure sequences 114,480 46,980
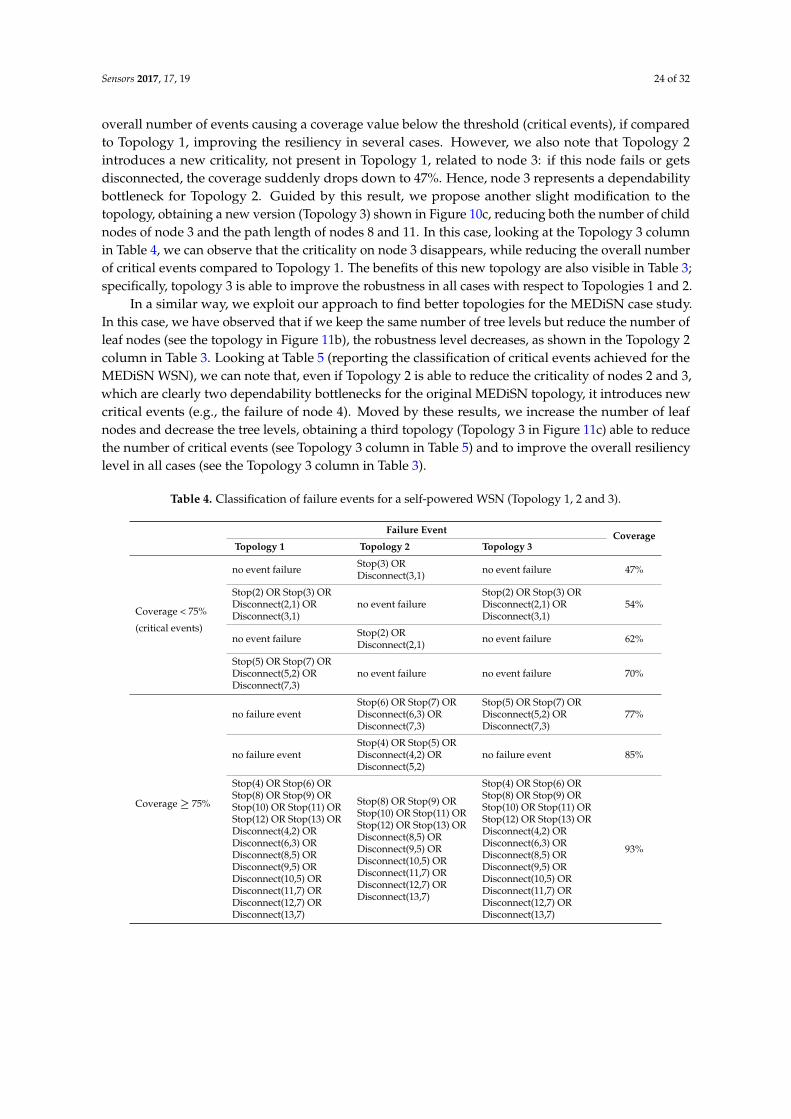
Starting from these results, we try to improve the robustness of both networks, by means ofslight changes on the network topology. The aim is to show how the proposed approach and relatedtool are useful to drive design choices and tune the configuration of the network. Considering theself-powered WSN, we start by proposing a more uniform distribution of the nodes, balancing thetree. The resulting topology is shown in Figure 10b. What we expect to observe is a general increaseof robustness, since a failure of a node causes the disconnection of a smaller number of nodes withrespect to the original topology (e.g., see nodes 5 and 7 ). For a coverage threshold at 65%, we achievethis conclusion (see column Topology 2 in Table 3). However, opposite to what was expected, for acoverage threshold at 75% (and three failures) and a coverage threshold at 85% (and two failures), weobtain a degradation of robustness, from 27% to 18% and from 43% to 27%, respectively.
The automatic analysis performed by the reasoner on the specifications allow us to deeplyinvestigate the exact reason of such degradation, and find better solutions. To this aim, in Table 4,we report a classification of the failure events tested by the ADVISES tool on the self-powered WSN.The events are grouped based on the obtained coverage value (reported in the Coverage column)for each of the topologies considered, and are also grouped as below or above the 75% coveragethreshold. Passing from Topology 1 to Topology 2, we can observe that Topology 2 is able to reduce the
Sensors 2017, 17, 19 24 of 32
overall number of events causing a coverage value below the threshold (critical events), if comparedto Topology 1, improving the resiliency in several cases. However, we also note that Topology 2introduces a new criticality, not present in Topology 1, related to node 3: if this node fails or getsdisconnected, the coverage suddenly drops down to 47%. Hence, node 3 represents a dependabilitybottleneck for Topology 2. Guided by this result, we propose another slight modification to thetopology, obtaining a new version (Topology 3) shown in Figure 10c, reducing both the number of childnodes of node 3 and the path length of nodes 8 and 11. In this case, looking at the Topology 3 columnin Table 4, we can observe that the criticality on node 3 disappears, while reducing the overall numberof critical events compared to Topology 1. The benefits of this new topology are also visible in Table 3;specifically, topology 3 is able to improve the robustness in all cases with respect to Topologies 1 and 2.
In a similar way, we exploit our approach to find better topologies for the MEDiSN case study.In this case, we have observed that if we keep the same number of tree levels but reduce the number ofleaf nodes (see the topology in Figure 11b), the robustness level decreases, as shown in the Topology 2column in Table 3. Looking at Table 5 (reporting the classification of critical events achieved for theMEDiSN WSN), we can note that, even if Topology 2 is able to reduce the criticality of nodes 2 and 3,which are clearly two dependability bottlenecks for the original MEDiSN topology, it introduces newcritical events (e.g., the failure of node 4). Moved by these results, we increase the number of leafnodes and decrease the tree levels, obtaining a third topology (Topology 3 in Figure 11c) able to reducethe number of critical events (see Topology 3 column in Table 5) and to improve the overall resiliencylevel in all cases (see the Topology 3 column in Table 3).
Table 4. Classification of failure events for a self-powered WSN (Topology 1, 2 and 3).
Failure Event CoverageTopology 1 Topology 2 Topology 3
Coverage < 75%
no event failure Stop(3) ORDisconnect(3,1) no event failure 47%
(critical events)
Stop(2) OR Stop(3) ORDisconnect(2,1) ORDisconnect(3,1)
no event failureStop(2) OR Stop(3) ORDisconnect(2,1) ORDisconnect(3,1)
54%
no event failure Stop(2) ORDisconnect(2,1) no event failure 62%
Stop(5) OR Stop(7) ORDisconnect(5,2) ORDisconnect(7,3)
no event failure no event failure 70%
Coverage ≥ 75%
no failure eventStop(6) OR Stop(7) ORDisconnect(6,3) ORDisconnect(7,3)
Stop(5) OR Stop(7) ORDisconnect(5,2) ORDisconnect(7,3)
77%
no failure eventStop(4) OR Stop(5) ORDisconnect(4,2) ORDisconnect(5,2)
no failure event 85%
Stop(4) OR Stop(6) ORStop(8) OR Stop(9) ORStop(10) OR Stop(11) ORStop(12) OR Stop(13) ORDisconnect(4,2) ORDisconnect(6,3) ORDisconnect(8,5) ORDisconnect(9,5) ORDisconnect(10,5) ORDisconnect(11,7) ORDisconnect(12,7) ORDisconnect(13,7)
Stop(8) OR Stop(9) ORStop(10) OR Stop(11) ORStop(12) OR Stop(13) ORDisconnect(8,5) ORDisconnect(9,5) ORDisconnect(10,5) ORDisconnect(11,7) ORDisconnect(12,7) ORDisconnect(13,7)
Stop(4) OR Stop(6) ORStop(8) OR Stop(9) ORStop(10) OR Stop(11) ORStop(12) OR Stop(13) ORDisconnect(4,2) ORDisconnect(6,3) ORDisconnect(8,5) ORDisconnect(9,5) ORDisconnect(10,5) ORDisconnect(11,7) ORDisconnect(12,7) ORDisconnect(13,7)
93%

Sensors 2017, 17, 19 25 of 32
Table 5. Classification of failure events for MEDiSN (Topology 1, 2 and 3).
Failure Event CoverageTopology 1 Topology 2 Topology 3
Coverage < 75%
Stop(2) ORDisconnect(2,1) no event failure no event failure 10%
(critical events)
Stop(3) ORDisconnect(3,2) no event failure no event failure 20%
no event failure no event failure Stop(2) OR Disconnect(2,1) 40%
no event failure Stop(2) ORDisconnect(2,1) no event failure 50%
no event failureStop(3) OR Stop(4) ORDisconnect(3,1) ORDisconnect(4,2)
Stop(6) OR Disconnect(6,2) 60%
Stop(5) OR Stop(6) ORDisconnect(5,3) ORDisconnect(6,3)
Stop(5) OR Stop(6) ORDisconnect(5,4) ORDisconnect(6,3)
Stop(3) OR Disconnect(3,1) 70%
Coverage ≥ 75%
Stop(4) OR Stop(7) ORStop(8) OR Stop(9) ORStop(10) ORDisconnect(4,3) ORDisconnect(7,5) ORDisconnect(8,5) ORDisconnect(9,6) ORDisconnect(10,6)
Stop(7) OR Stop(8) ORStop(9) OR Stop(10) ORDisconnect(7,5) ORDisconnect(8,5) ORDisconnect(9,6) ORDisconnect(10,6)
Stop(4) OR Stop(5) ORStop(7) OR Stop(8) ORStop(9) OR Stop(10) ORDisconnect(4,2) ORDisconnect(5,3) ORDisconnect(7,3) ORDisconnect(8,6) ORDisconnect(9,6) ORDisconnect(10,6)
90%
In both the cases, we have seen how the proposed approach is useful to precisely spotdependability bottlenecks and define more robust configurations. For both experiments, the ADVISEStool has performed a total of 161,460 reasonings on the specifications (114,480 for the self-powered WSNand 46,980 for MEDiSN). In particular, Table 6 shows the number of failure sequences and the relatedtime spent by the ADVISES Tool to perform the reasoning in the self-powered WSN and in MEDiSNnetworks considering a coverage threshold value equal to 75%. In the worst case (12,144 differentfailure sequences tested for the self-powered WSN) the tool takes about 9 h to perform the evaluationon our commodity hardware. While this time could still be acceptable at design time (and it does notaffect the conceptual validity of the approach), it clearly represents a practical limit, especially for largeWSNs. This issue, and related solutions that we are currently investigating, are further discussed inSection 8.
Table 6. Reasoning time of the ADVISES Tool for a self-powered WSN and MEDiSN consideringa threshold value equal to 75%.
Connection ResiliencySelf-Powered WSN MEDiSN
Failure Sequences Elapsed Time (s) Failure Sequences Elapsed Time (s)
1 24 1500 18 6002 552 9720 306 21603 12,144 32,580 4896 2820
7.2.2. Runtime Verification
After the static analysis, we physically deploy the best topologies (topology 3 for both WSNs) atour labs to perform runtime verification.
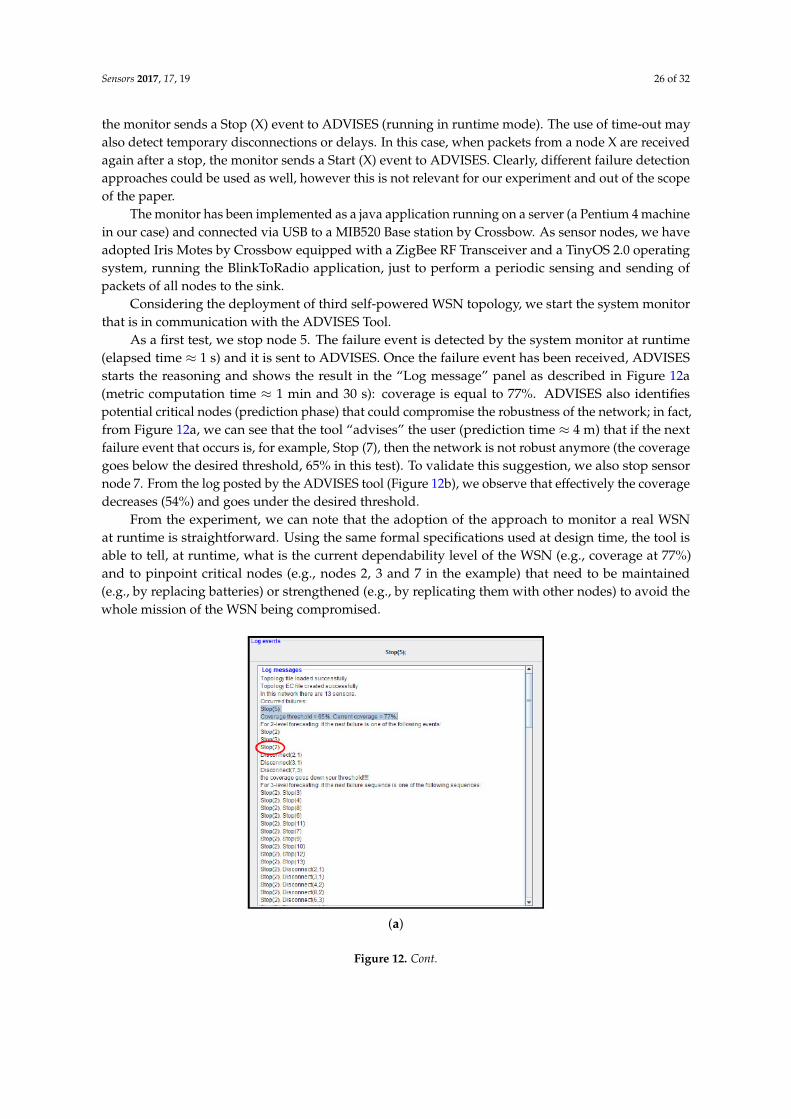
For this purpose, we have designed and implemented a system monitor with the aim of detectingfailure events from the real-world WSN. The monitor runs on a machine and listens for packets comingfrom all sensors trough the sink node of the WSN. The detection of events (such as the stop of anode) is performed assuming that each sensor sends packets periodically, with a known rate, which iscommon to several WSN applications. Hence, for every node, the monitor sets a timeout, which isreset each time the monitor receives a packet from the given node. If the timeout expires for a node X,
Sensors 2017, 17, 19 26 of 32
the monitor sends a Stop (X) event to ADVISES (running in runtime mode). The use of time-out mayalso detect temporary disconnections or delays. In this case, when packets from a node X are receivedagain after a stop, the monitor sends a Start (X) event to ADVISES. Clearly, different failure detectionapproaches could be used as well, however this is not relevant for our experiment and out of the scopeof the paper.
The monitor has been implemented as a java application running on a server (a Pentium 4 machinein our case) and connected via USB to a MIB520 Base station by Crossbow. As sensor nodes, we haveadopted Iris Motes by Crossbow equipped with a ZigBee RF Transceiver and a TinyOS 2.0 operatingsystem, running the BlinkToRadio application, just to perform a periodic sensing and sending ofpackets of all nodes to the sink.
Considering the deployment of third self-powered WSN topology, we start the system monitorthat is in communication with the ADVISES Tool.
As a first test, we stop node 5. The failure event is detected by the system monitor at runtime(elapsed time ≈ 1 s) and it is sent to ADVISES. Once the failure event has been received, ADVISESstarts the reasoning and shows the result in the “Log message” panel as described in Figure 12a(metric computation time ≈ 1 min and 30 s): coverage is equal to 77%. ADVISES also identifiespotential critical nodes (prediction phase) that could compromise the robustness of the network; in fact,from Figure 12a, we can see that the tool “advises” the user (prediction time ≈ 4 m) that if the nextfailure event that occurs is, for example, Stop (7), then the network is not robust anymore (the coveragegoes below the desired threshold, 65% in this test). To validate this suggestion, we also stop sensornode 7. From the log posted by the ADVISES tool (Figure 12b), we observe that effectively the coveragedecreases (54%) and goes under the desired threshold.
From the experiment, we can note that the adoption of the approach to monitor a real WSNat runtime is straightforward. Using the same formal specifications used at design time, the tool isable to tell, at runtime, what is the current dependability level of the WSN (e.g., coverage at 77%)and to pinpoint critical nodes (e.g., nodes 2, 3 and 7 in the example) that need to be maintained(e.g., by replacing batteries) or strengthened (e.g., by replicating them with other nodes) to avoid thewhole mission of the WSN being compromised.
(a)
Figure 12. Cont.
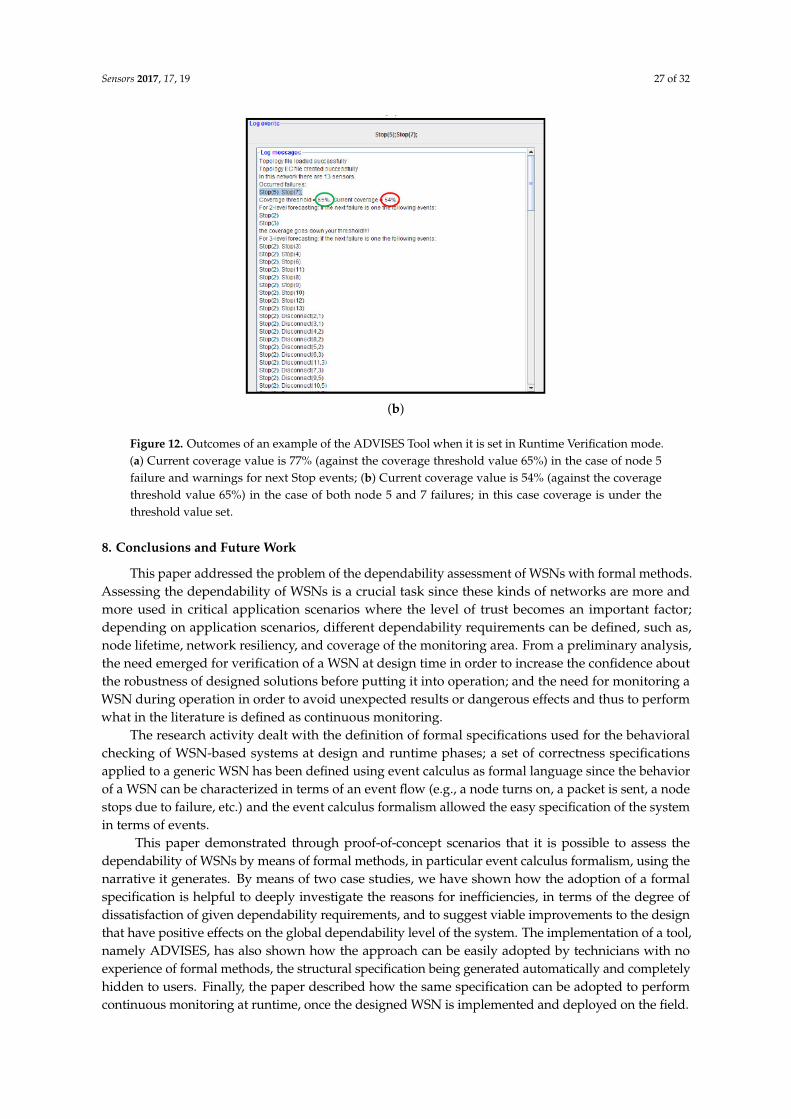
Sensors 2017, 17, 19 27 of 32
(b)
Figure 12. Outcomes of an example of the ADVISES Tool when it is set in Runtime Verification mode.(a) Current coverage value is 77% (against the coverage threshold value 65%) in the case of node 5failure and warnings for next Stop events; (b) Current coverage value is 54% (against the coveragethreshold value 65%) in the case of both node 5 and 7 failures; in this case coverage is under thethreshold value set.
8. Conclusions and Future Work
This paper addressed the problem of the dependability assessment of WSNs with formal methods.Assessing the dependability of WSNs is a crucial task since these kinds of networks are more andmore used in critical application scenarios where the level of trust becomes an important factor;depending on application scenarios, different dependability requirements can be defined, such as,node lifetime, network resiliency, and coverage of the monitoring area. From a preliminary analysis,the need emerged for verification of a WSN at design time in order to increase the confidence aboutthe robustness of designed solutions before putting it into operation; and the need for monitoring aWSN during operation in order to avoid unexpected results or dangerous effects and thus to performwhat in the literature is defined as continuous monitoring.
The research activity dealt with the definition of formal specifications used for the behavioralchecking of WSN-based systems at design and runtime phases; a set of correctness specificationsapplied to a generic WSN has been defined using event calculus as formal language since the behaviorof a WSN can be characterized in terms of an event flow (e.g., a node turns on, a packet is sent, a nodestops due to failure, etc.) and the event calculus formalism allowed the easy specification of the systemin terms of events.
This paper demonstrated through proof-of-concept scenarios that it is possible to assess thedependability of WSNs by means of formal methods, in particular event calculus formalism, using thenarrative it generates. By means of two case studies, we have shown how the adoption of a formalspecification is helpful to deeply investigate the reasons for inefficiencies, in terms of the degree ofdissatisfaction of given dependability requirements, and to suggest viable improvements to the designthat have positive effects on the global dependability level of the system. The implementation of a tool,namely ADVISES, has also shown how the approach can be easily adopted by technicians with noexperience of formal methods, the structural specification being generated automatically and completelyhidden to users. Finally, the paper described how the same specification can be adopted to performcontinuous monitoring at runtime, once the designed WSN is implemented and deployed on the field.
Sensors 2017, 17, 19 28 of 32
The implementation and actual use of the approach also helped us to highlight practical limitsto be solved. We have considered topologies of WSNs adopted in typical critical scenarios, such ashealthcare (with 7/15 nodes). The simplicity of such topologies, although taken from real examples,may lead to doubts regarding the general usefulness of the approach (the same reasoning could beperformed intuitively with no need of a tool). However, we selected the examples with the aim ofpointing out how ADVISES allows the quantitative justification of design choices against preciserequirements and metrics, helping technicians to have the instruments to make informed designdecisions, e.g., when he/she is forced to choose between a few topologies to be considered, due torestrictions. The selection has been done also with the objective of implementing the topology on thefield, with real WSN nodes, in order to practically show how the same approach and tool can be usedboth at design time and at runtime for continuous monitoring.
Concerning the time complexity of the method, it is strictly dependent on that of the EC, whichhas been estimated (assuming n the number of events) as O(n−3) in case of absolute time and totalordering of the events [65], O(2n−3) in the case of relative times and partial ordering [66]. The proposedmethodology relies on two kinds of analysis (runtime verification and static verification) based onrelative times and partial ordering of events. Therefore, the time complexity is upper bounded toO(2n−3). For runtime verification, the reasoner is invoked just one time at the occurrence of the adverseevent in the network. For static verification, the reasoner is invoked a number of times, correspondingto the combinations without repetitions of the emulated failures. Generally, in both cases, the numberof events k generated for the analysis in EC is the square of the number of nodes N of the network.
During the experimental phase, we have also tested the correct functioning of the specificationwith topologies with more nodes (about 100) but we experienced a remarkable deterioration of theperformance on our commodity hardware (about 1 h to test all the sequences with only one failure),due to the state space explosion problem. While this issue does not affect the conceptual validity ofthe approach and its use on typical critical WSNs, it undermines its practical adoption for very largeWSNs. The issue can be partially solved at design time by using more powerful hardware and byconsidering that the user, at design time, is more favourable to waiting for the reasoning result if thiscan help his/her design decisions. However, the issue remains for the runtime monitoring, wherethe output of the reasoning must be provided with due timing constraints and with no assumptionson the processing power of gateways. To face this scalability problem, we are currently conceivinga method to divide a large topology in several sub-topologies (equivalent to WSN clusters). During theruntime, the different sub-topologies can be monitored by different gateways (acting as cluster heads),performing the reasoning on each sub-topology in parallel and then finally joining the results takinginto account the dependences between the sub-topologies.
Although the methodology here presented may not always identify an optimal topology from allpossibly desirable features, it still improves the support to analyze similarly complex topologies wherethe difference may not be obvious to the designer. The generic strategy and tool presented in this articlefacilitates the experimentation and comparison of different heuristics to address different problems.Two obvious areas of experimentation and improvement are the relaxation of restrictions and theimprovement of efficiency. From this perspective, the computational platform used for experimentationin this article is anecdotal and the main contribution is in problem solving strategies.
We base our approach on sensors that are fixed (such as beacons) and with an established datarouting reducing a topology, such as a spanning tree that is valid for a WSN. As future work, we planto extend the use of the specification also for mobile scenarios, specifying further events that notifywireless sensor movements within clusters and from cluster to cluster.
Acknowledgments: The research work reported in this paper has been partially supported by the eAsy inteLligentservice Platform for Healthy Ageing (ALPHA) Project.
Author Contributions: Alessandro Testa, Marcello Cinque, Antonio Coronato and Juan Carlos Augusto conceivedthe methodology, designed the experiments and analyzed the results. Alessandro Testa developed the softwaresystem and conducted the experiments.

Sensors 2017, 17, 19 29 of 32
Conflicts of Interest: The authors declare no conflict of interest.
References
1. Stankovic, J.A. Wireless sensor networks. Computer 2008, 41, 92–95.2. Avizienis, A.; Laprie, J.C.; Randell, B.; Landwehr, C. Basic concepts and taxonomy of dependable and secure
computing. IEEE Trans. Dependable Secure Comput. 2004, 1, 11–33.3. Yick, J.; Mukherjee, B.; Ghosal, D. Wireless Sensor Network Survey; Elsevier: Amsterdam, The Netherlands,
2008; pp. 2292–2330.4. Alemdar, H.; Ersoy, C. Wireless sensor networks for healthcare: A survey. Comput. Netw. 2010, 54, 2688–2710.5. Coronato, A.; de Pietro, G. Formal design of ambient intelligence applications. Computer 2010, 43, 60–68.6. Augusto, J.C.; Zheng, H.; Mulvenna, M.D.; Wang, H.; Carswell, W.; Jeffers, W.P. Design and modelling of the
nocturnal AAL care system. In Proceedings of the 2nd International Symposium on Ambient Intelligence(ISAmI 2011), Salamanca, Spain, 6–8 April 2011; pp. 109–116.
7. Aarts, E.; Wichert, R. Ambient Intelligence; TechnologyGuide: Newton, MA, USA, 2009; pp. 244–249.8. Coronato, A.; De Pietro, G. Formal specification and verification of ubiquitous and pervasive systems.
ACM Trans. Auton. Adapt. Syst. 2011, 6, 1–6.9. Cinque, M.; Cotroneo, D.; Di Martinio, C.; Russo, S. Modeling and assessing the dependability of wireless
sensor networks. In Proceedings of the 26th IEEE International Symposium on Reliable Distributed Systems(SRDS’07), Beijing, China, 10–12 October 2007; pp. 33–44.
10. Lazarescu, M.T. Design of a WSN platform for long-term environmental monitoring for IoT applications.IEEE J. Emerg. Sel. Top. Circuits Syst. 2013, 3, 45–54.
11. Woodcock, J.; Larsen, P.G.; Bicarregui, J.; Fitzgerald, J. Formal methods: Practice and experience. ACM 2009,41, 19.
12. Leucker, M.; Schallhart, C. A brief account of runtime verification. J. Log. Algebraic Program. 2009, 78, 293–303.13. Bakhouya, M.; Campbell, R.; Coronato, A.; Pietro, G.D.; Ranganathan, A. Introduction to special section on
formal methods in pervasive computing. ACM Trans. Auton. Adapt. Syst. 2012, 7, 6.14. Testa, A.; Coronato, A.; Cinque, M.; Augusto, J.C. Static verification of wireless sensor networks with formal
methods. In Proceedings of the IEEE 2012 Eighth International Conference on Signal Image Technology andInternet Based Systems (SITIS), Naples, Italy, 25–29 November 2012; pp. 587–594.
15. Bondavalli, A.; Ceccarelli, A.; Falai, L.; Vadursi, M. A New Approach and a Related Tool for DependabilityMeasurements on Distributed Systems. IEEE Trans. Instrum. Meas. 2010, 59, 820–831.
16. Li, M.; Liu, Y. Underground coal mine monitoring with wireless sensor networks. ACM Trans. Sens. Netw.2009, 5, 1–29.
17. Cinque, M.; Cotroneo, D.; Martino, C.D.; Russo, S.; Testa, A. AVR-INJECT: A tool for injecting faults inWireless Sensor Nodes. In Proceedings of the IEEE International Symposium on Parallel & DistributedProcessing (IPDPS), Rome, Italy, 23–29 May 2009; pp. 1–8.
18. Cinque, M.; Cotroneo, D.; di Martino, C.; Testa, A. An effective approach for injecting faults in wireless sensornetwork operating systems. In Proceedings of the 2010 IEEE Symposium on Computers and Communications(ISCC), Riccione, Italy, 22–25 June 2010; pp. 567–569.
19. Bhuiyan, M.; Wang, G.; Wu, J.; Cao, J.; Liu, X.; Wang, T. Dependable structural health monitoring usingwireless sensor networks. IEEE Trans. Dependable Secure Comput. 2015, PP, 1.
20. Bhuiyan, M.Z.A.; Wang, G.; Cao, J.; Wu, J. Deploying wireless sensor networks with fault-tolerance forstructural health monitoring. IEEE Trans. Comput. 2015, 64, 382–395.
21. Shakkira, K.; Mohamed, M.T. Advanced Lightweight, Dependable and secure Trust System for Clusteredwireless sensor networks. In Proceedings of the 2015 International Conference on Innovations in Information,Embedded and Communication Systems (ICIIECS), Coimbatore, India, 19–20 March 2015; pp. 1–4.
22. Shrestha, A.; Xing, L.; Liu, H. Infrastructure communication reliability of wireless sensor networks.In Proceedings of the 2nd IEEE International Symposium on Dependable, Autonomic and Secure Computing,Indianapolis, India, 29 September–1 October 2006; pp. 250–257.
23. Koushanfar, F.; Potkonjak, M.; Sangiovanni-Vincentelli, A. On-line fault detection of sensor measurements.In Proceedings of the 2003 IEEE Sensors, Toronto, ON, Canada, 22–24 October 2003; pp. 974–979.

Sensors 2017, 17, 19 30 of 32
24. Zhang, J.; Li, W.; Cui, D.; Zhao, X.; Yin, Z. The NS2-based simulation and research on wireless sensornetwork route protocol. In Proceedings of the 5th International Conference on Wireless Communications,Networking and Mobile Computing (WiCom’09), Beijing, China, 24–26 September 2009; pp. 1–4.
25. Titzer, B.L.; Lee, D.K.; Palsberg, J. Avrora: Scalable sensor network simulation with precise timing.In Proceedings of the 4th International Symposium on Information Processing in Sensor Networks (IPSN’05),Los Angeles, CA, USA, 24–27 April 2005.
26. Di Martino, C.; Cinque, M.; Cotroneo, D. Automated generation of performance and dependability modelsfor the assessment of wireless sensor networks. IEEE Trans. Comput. 2012, 61, 870–884.
27. Heinzelman, W.; Chandrakasan, A.; Balakrishnan, H. Energy-efficient communication protocol for wirelessmicrosensor networks. In Proceedings of the 33rd Annual Hawaii International Conference on SystemSciences, Maui, HI, USA, 4–7 January 2000; p. 10.
28. Mini, A.F.; Nath, B.; Loureiro, A.A.F. A probabilistic approach to predict the energy consumption in wirelesssensor networks. In Proceedings of the IV Workshop de Comunicao sem Fio e Computao Mvel, Sao Paulo,Brazil, 23–25 October 2002; pp. 23–25.
29. Yavuz, F.; Zhao, J.; Yagan, O.; Gligor, V. Designing secure and reliable wireless sensor networks undera pairwise key predistribution scheme. In Proceedings of the 2015 IEEE International Conference onCommunications (ICC), London, UK, 8–12 June 2015; pp. 6277–6283.
30. Sharma, K.P.; Sharma, T.P. rDFD: Reactive distributed fault detection in wireless sensor networks. Wirel. Netw.2016, 22, 1–16.
31. Khalil, I.M.; Khreishah, A.; Ahmed, F.; Shuaib, K. Dependable wireless sensor networks for reliable andsecure humanitarian relief applications. Ad Hoc Netw. 2014, 13, 94–106.
32. Silva, I.; Guedes, L.A.; Portugal, P.; Vasques, F. Reliability and availability evaluation of wireless sensornetworks for industrial applications. Sensors 2012, 12, 806–838.
33. Kapitanova, K.; Son, S. MEDAL: A coMpact event description and analysis language for wireless sensornetworks. In Proceedings of the 2009 Sixth International Conference on Networked Sensing Systems (INSS),Pittsburgh, PA, USA, 17–19 June 2009; pp. 1–4.
34. Man, K.L.; Vallee, T.; Leung, H.; Mercaldi, M.; van der Wulp, J.; Donno, M.; Pastrnak, M. TEPAWSN—A toolenvironment for wireless sensor networks. In Proceedings of the 2009 4th IEEE Conference on IndustrialElectronics and Applications (ICIEA 2009), Xi’an, China, 25–27 May 2009; pp. 730–733.
35. Boonma, P.; Suzuki, J. Moppet: A model-driven performance engineering framework for wireless sensornetworks. Comput. J. 2010, 53, 1674–1690.
36. Shanahan, M. The event calculus explained. Lect. Notes Comput. Sci. 1999, 1600, 409–430.37. Ölveczky, P.; Meseguer, J. Specification and analysis of real-time systems using Real-Time Maude.
In Fundamental Approaches to Software Engineering; Springer: Berlin, Germany, 2004; pp. 354–358.38. Romadi, R.; Berbia, H. Wireless sensor network a specification method based on reactive decisional agents.
In Proceedings of the 3rd International Conference on Information and Communication Technologies:From Theory to Applications (ICTTA 2008), Damascus, Syria, 7–11 April 2008; pp. 1–5.
39. Wang, C.; Xing, L.; Vokkarane, V.M.; Sun, Y.L. Reliability and lifetime modeling of wireless sensor nodes.Microelectron. Reliab. 2014, 54, 160–166.
40. Wang, C.; Xing, L.; Vokkarane, V.M.; Sun, Y.L. Infrastructure communication sensitivity analysis of wirelesssensor networks. Qual. Reliab. Eng. Int. 2016, 32, 581–594.
41. Liang, Y.; Liu, R. Routing topology inference for wireless sensor networks. ACM SIGCOMM Comput.Commun. Rev. 2013, 43, 21–28.
42. Zoumboulakis, M.; Roussos, G. Complex Event Detection in Extremely Resource-Constrained Wireless SensorNetworks; Kluwer Academic Publishers: Hingham, MA, USA, 2011; Volume 16, pp. 194–213.
43. Bromuri, S.; Stathis, K. Distributed agent environments in the Ambient Event Calculus. In Proceedings ofthe Third ACM International Conference on Distributed Event-Based Systems (DEBS’09), Nashville, TN,USA, 6–9 July 2009; pp. 1–12.
44. Blum, J.; Magill, E. Telecare service challenge: Conflict detection. In Proceedings of the 2011 5th InternationalConference on Pervasive Computing Technologies for Healthcare (PervasiveHealth), Dublin, Ireland,23–26 May 2011; pp. 502–507.
45. Kowalski, R.; Sergot, M. A logic-based calculus of events. New Gener. Comput. 1986, 4, 67–95.46. Mueller, E.T. Automating commonsense reasoning using the event calculus. Commun. ACM 2009, 52, 113–117.
Sensors 2017, 17, 19 31 of 32
47. Van Harmelen, F.; Lifschitz, V.; Porter, B. Handbook of Knowledge Representation; Foundations of ArtificialIntelligence; Elsevier: Amsterdam, The Netherlands, 2008.
48. Kim, T.W.; Lee, J.; Palla, R. Circumscriptive event calculus as answer set programming. In Proceedings of the21st International Jiont Conference on Artifical Intelligence (IJCAI’09), Pasadena, CA, USA, 11–17 July 2009;pp. 823–829.
49. Hamadi, Y.; Jabbour, S.; Sais, L. ManySAT: A parallel SAT solver. J. Satisfiability Boolean Model. Comput. 2009,6, 245–262.
50. Mueller, E.T. DECReasoner. 2005. Available online: http://decreasoner.sourceforge.net (accessed on12 March 2014).
51. Muller, E.T. Discrete Event Calculus Reasoner Documentation. 2008. Available online: http://decreasoner.sourceforge.net/csr/decreasoner.pdf (accessed on 12 March 2014).
52. Testa, A. Dependability Assessment of Wireless Sensor Networks with Formal Methods. Ph.D. Thesis,University of Naples Federico II, Napoli, Italy, 2013.
53. Gungor, V.C.; Hancke, G.P. Industrial wireless sensor networks: Challenges, design principles, and technicalapproaches. IEEE Trans. Ind. Electron. 2009, 56, 4258–4265.
54. Quwaider, M.; Biswas, S. DTN routing in body sensor networks with dynamic postural partitioning.Ad Hoc Netw. 2010, 8, 824–841.
55. Coronato, A.; de Pietro, G. Tools for the rapid prototyping of provably correct ambient intelligenceapplications. IEEE Trans. Softw. Eng. 2012, 38, 975–991.
56. Cinque, M.; Coronato, A.; Testa, A. Dependable Services for Mobile Health Monitoring Systems. Int. J.Ambient Comput. Intell. 2012, 4, 1–15.
57. Ying, H.; Schlosser, M.; Schnitzer, A.; Schafer, T.; Schlafke, M.E.; Leonhardt, S.; Schiek, M. Distributedintelligent sensor network for the rehabilitation of Parkinson’s patients. Trans. Inform. Technol. Biomed. 2011,15, 268–276.
58. Wu, C.H.; Tseng, Y.C. Data compression by temporal and spatial correlations in a body-area sensor network:A case study in pilates motion recognition. IEEE Trans. Mob. Comput. 2011, 10, 1459–1472.
59. Ko, J.; Lim, J.H.; Chen, Y.; Musvaloiu-E, R.; Terzis, A.; Masson, G.M.; Gao, T.; Destler, W.; Selavo, L.;Dutton, R.P. MEDiSN: Medical emergency detection in sensor networks. ACM Trans. Embed. Comput. Syst.2010, 10, 1–29.
60. Fernández-López, H.; Afonso, J.A.; Correia, J.; Simões, R. HM4All: A vital signs monitoring system basedin spatially distributed zigBee networks. In Proceedings of the IEEE 2010 4th International Conference onPervasive Computing Technologies for Healthcare (PervasiveHealth), Munich, Germany, 22–25 March 2010;pp. 1–4.
61. Hande, A.; Polk, T.; Walker, W.; Bhatia, D. Self-powered wireless sensor networks for remote patientmonitoring in hospitals. Sensors 2006, 6, 1102–1117.
62. Fariborzi, H.; Moghavvemi, M. Architecture of a wireless sensor network for vital signs transmissionin hospital setting. In Proceedings of the 2007 International Conference on Convergence InformationTechnology (ICCIT’07), Gyeongju, Korea, 21–23 November 2007; pp. 745–749.
63. Qiu, Y.; Zhou, J.; Baek, J.; Lopez, J. Authentication and key establishment in dynamic wireless sensornetworks. Sensors 2010, 10, 3718–3731.
64. Chipara, O.; Lu, C.; Bailey, T.C.; Roman, G.C. Reliable clinical monitoring using wireless sensor networks:Experiences in a step-down hospital unit. In Proceedings of the 8th ACM Conference on EmbeddedNetworked Sensor Systems (SenSys’10), Zurich, Switzerland, 3–5 November 2010; pp. 155–168.
65. Chittaro, L.; Montanari1, A. Efficient temporal reasoning in the cached event calculus. Comput. Int. 1996,12, 359–382.
66. Chittaro, L.; Montanari, A. Speeding up temporal reasoning by exploiting the notion of kernel of an orderingrelation. In Proceedings of the Second International Workshop on Temporal Representation and Reasoning(TIME’95), Melbourne Beach, FL, USA, 26 April 1995; pp. 73–80.
c© 2016 by the authors; licensee MDPI, Basel, Switzerland. This article is an open accessarticle distributed under the terms and conditions of the Creative Commons Attribution(CC-BY) license (http://creativecommons.org/licenses/by/4.0/).


![Training staff to use a new MCQ Generation methodology ... · concerning the most appropriate format of MCQ test item [10] and a specification for a formal MCQ-Creation methodology[11]](https://img.pdfslide.us/doc/110x75/5f066af47e708231d417e4b0/training-staff-to-use-a-new-mcq-generation-methodology-concerning-the-most-appropriate.jpg)


![LNCS 7000 - A Formal Methodology for Compositional Cross ...dsm/papers/minyoung/formal-meth.pdf[22] also aims to trade off multimedia quality against energy by introducing a hierarchy](https://img.pdfslide.us/doc/110x75/6022a4a295b6a743303c86e8/lncs-7000-a-formal-methodology-for-compositional-cross-dsmpapersminyoungformal-methpdf.jpg)