Embed Size (px)
Citation preview
Communication
A Footnote on Allostery
F. H. C. Crick and Jeffries Wyman
Medical Research Council Laboratory of Molecular Biology, Hills Road, Cambridge CB2 0QH, EnglandIstituto Regina Elena per lo Studio e la la Cura die Tumori, Rome 00161, Italy
Correspondence to Stuart J. Edelstein: [email protected]://dx.doi.org/10.1016/j.jmb.2013.03.012Edited by Stuart J. Edelstein
Abstract
Amanuscript on allostery signed by Francis Crick and Jeffries Wyman was sent by Crick to Jacques Monod in1965. Monod transmitted a copy of the manuscript, upon which he had written several comments, to Jean-Pierre Changeux, then a post-doctoral fellow at the University of California Berkeley in the laboratory ofHoward Schachman. Changeux provided a copy to Stuart Edelstein, a graduate student in the samelaboratory. The manuscript was never submitted for publication, but Edelstein retained his copy since that timeand has edited it for publication in the special issue on allostery. The text emphasized the interpretation of theproperties of an allosteric oligomer by characterizing its equivalent monomer. The text also developed theconcept of the allosteric range and included a simple equation for calculation of the Hill coefficient from theparameters of the Monod-Wyman-Changeux model.
© 2013 Elsevier Ltd. All rights reserved.
Editor's Preface
The text by Francis Crick (1916–2004) and JeffriesWyman (1901–1995) published posthumously herefor the first time was written in 1965, principally inreaction to a footnote on page 115 of the article byMonod, Wyman, and Changeux that appeared in thesame year in the Journal of Molecular Biology.1 Themanuscript circulated among a few scientists interest-ed in allostery who were associated with JacquesMonod's group at thePasteur Institute, but it wasneversubmitted for publication. Although prompted by thefootnote in question, the text also introduces a numberof original insights that clearly illustrate extensivereflections onallosteric theory, especially the conceptsof “allosteric range” and “equivalent monomer”, whichprecede thedirect discussion of the footnote in the finalsection of the text. Other mathematical subtleties ofallostery that undoubtedly required close examinationand extensive reworking of the relevant equations arepresented. This effort reveals considerable acumenon the part of Crick in the area of allostery, a subjectwith which his name is not generally associated.The original manuscript was skillfully typed except
for the more complicated equations, which werehandwritten. The text did not contain an abstract,and the headings as they appeared in the original
0022-2836/$ - see front matter © 2013 Elsevier Ltd. All rights reserve
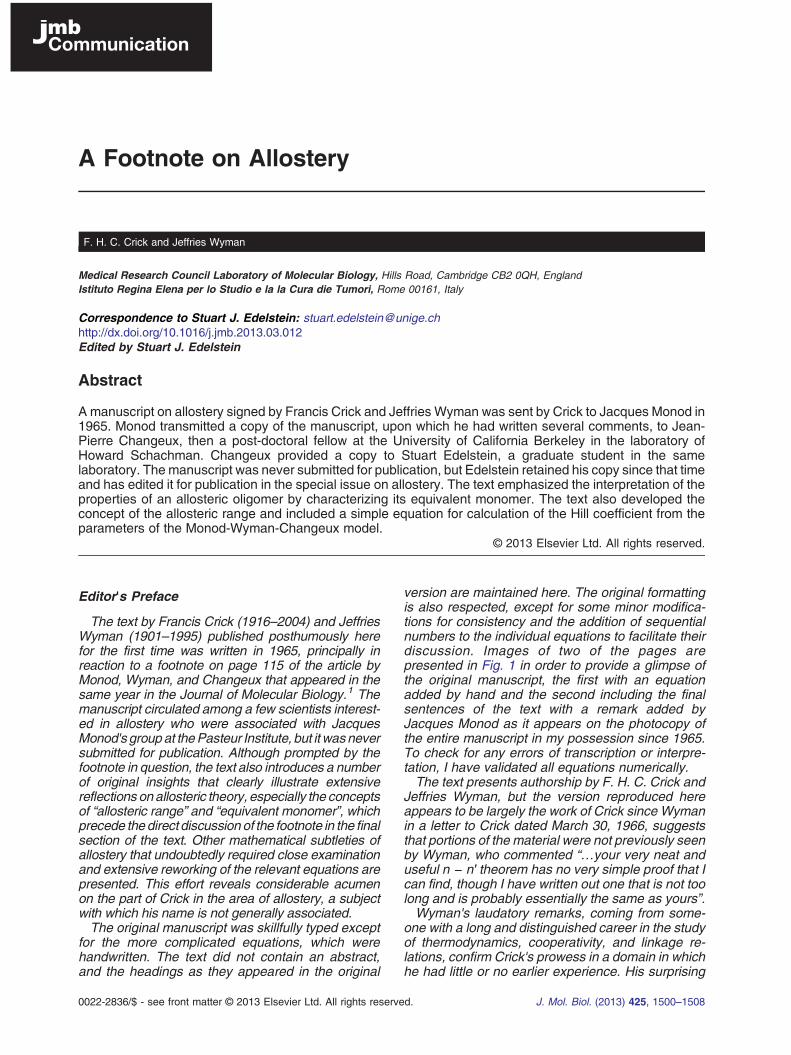
version are maintained here. The original formattingis also respected, except for some minor modifica-tions for consistency and the addition of sequentialnumbers to the individual equations to facilitate theirdiscussion. Images of two of the pages arepresented in Fig. 1 in order to provide a glimpse ofthe original manuscript, the first with an equationadded by hand and the second including the finalsentences of the text with a remark added byJacques Monod as it appears on the photocopy ofthe entire manuscript in my possession since 1965.To check for any errors of transcription or interpre-tation, I have validated all equations numerically.The text presents authorship by F. H. C. Crick and
Jeffries Wyman, but the version reproduced hereappears to be largely the work of Crick since Wymanin a letter to Crick dated March 30, 1966, suggeststhat portions of the material were not previously seenby Wyman, who commented “…your very neat anduseful n − n′ theorem has no very simple proof that Ican find, though I have written out one that is not toolong and is probably essentially the same as yours”.Wyman's laudatory remarks, coming from some-
one with a long and distinguished career in the studyof thermodynamics, cooperativity, and linkage re-lations, confirm Crick's prowess in a domain in whichhe had little or no earlier experience. His surprising
d. J. Mol. Biol. (2013) 425, 1500–1508
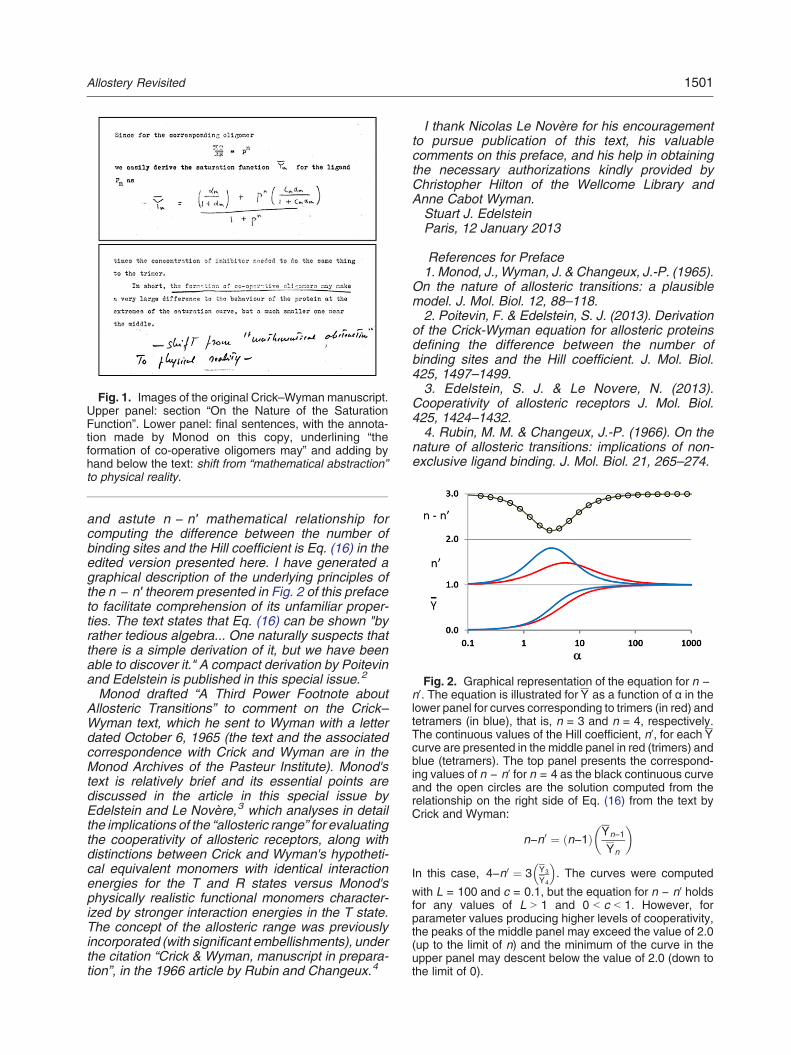
Fig. 1. Images of the original Crick–Wyman manuscript.Upper panel: section “On the Nature of the SaturationFunction”. Lower panel: final sentences, with the annota-tion made by Monod on this copy, underlining “theformation of co-operative oligomers may” and adding byhand below the text: shift from “mathematical abstraction”to physical reality.
Fig. 2. Graphical representation of the equation for n −n′. The equation is illustrated for Y as a function of α in thelower panel for curves corresponding to trimers (in red) andtetramers (in blue), that is, n = 3 and n = 4, respectively.The continuous values of the Hill coefficient, n′, for each Ycurve are presented in the middle panel in red (trimers) andblue (tetramers). The top panel presents the correspond-ing values of n − n′ for n = 4 as the black continuous curveand the open circles are the solution computed from therelationship on the right side of Eq. (16) from the text byCrick and Wyman:
n−n0 ¼ n−1ð Þ Yn−1
Yn
� �
In this case, 4−n0 ¼ 3 Y3
Y4
� �. The curves were computed
with L = 100 and c = 0.1, but the equation for n − n′ holdsfor any values of L N 1 and 0 b c b 1. However, forparameter values producing higher levels of cooperativity,the peaks of the middle panel may exceed the value of 2.0(up to the limit of n) and the minimum of the curve in theupper panel may descent below the value of 2.0 (down tothe limit of 0).
1501Allostery Revisited
and astute n − n′ mathematical relationship forcomputing the difference between the number ofbinding sites and the Hill coefficient is Eq. (16) in theedited version presented here. I have generated agraphical description of the underlying principles ofthe n − n′ theorem presented in Fig. 2 of this prefaceto facilitate comprehension of its unfamiliar proper-ties. The text states that Eq. (16) can be shown "byrather tedious algebra... One naturally suspects thatthere is a simple derivation of it, but we have beenable to discover it." A compact derivation by Poitevinand Edelstein is published in this special issue.2
Monod drafted “A Third Power Footnote aboutAllosteric Transitions” to comment on the Crick–Wyman text, which he sent to Wyman with a letterdated October 6, 1965 (the text and the associatedcorrespondence with Crick and Wyman are in theMonod Archives of the Pasteur Institute). Monod'stext is relatively brief and its essential points arediscussed in the article in this special issue byEdelstein and Le Novère,3 which analyses in detailthe implications of the “allosteric range” for evaluatingthe cooperativity of allosteric receptors, along withdistinctions between Crick and Wyman's hypotheti-cal equivalent monomers with identical interactionenergies for the T and R states versus Monod'sphysically realistic functional monomers character-ized by stronger interaction energies in the T state.The concept of the allosteric range was previouslyincorporated (with significant embellishments), underthe citation “Crick & Wyman, manuscript in prepara-tion”, in the 1966 article by Rubin and Changeux.4
I thank Nicolas Le Novère for his encouragementto pursue publication of this text, his valuablecomments on this preface, and his help in obtainingthe necessary authorizations kindly provided byChristopher Hilton of the Wellcome Library andAnne Cabot Wyman.Stuart J. EdelsteinParis, 12 January 2013
References for Preface1. Monod, J., Wyman, J. & Changeux, J.-P. (1965).
On the nature of allosteric transitions: a plausiblemodel. J. Mol. Biol. 12, 88–118.2. Poitevin, F. & Edelstein, S. J. (2013). Derivation
of the Crick-Wyman equation for allosteric proteinsdefining the difference between the number ofbinding sites and the Hill coefficient. J. Mol. Biol.425, 1497–1499.3. Edelstein, S. J. & Le Novere, N. (2013).
Cooperativity of allosteric receptors J. Mol. Biol.425, 1424–1432.4. Rubin, M. M. & Changeux, J.-P. (1966). On the
nature of allosteric transitions: implications of non-exclusive ligand binding. J. Mol. Biol. 21, 265–274.
1502 Allostery Revisited
Introduction
Recently, Monod, Wyman, and Changeux (1965)published a very interesting paper entitled “On theNature of Allosteric Transitions: A Plausible Model”.1
Their theory assumed that there are no directinteractions between different sites in an allostericprotein, either between sites for the same ligand orbetween sites for different ligands. Instead, theprotein is considered to exist in just two possibleconformations, which they call R and T. Each ligandhas a different affinity for these two states, and for thisreason, indirect interactions can occur between thebinding of the various ligands. In particular, theydevelop the theory for symmetrical oligomers, and byassuming that amixed oligomer (in which someof theprotomers are in the R configuration and some are inthe T configuration) cannot occur, they easily showthat their model can give strong co-operative effects.Toward the end of their paper, they point out that
their theory could be applied equally well to anallosteric monomer (n = 1 in their terminology).However, they argue that there are advantageousamplifying properties associated with the molecularsymmetry of oligomers and that “the molecularsymmetry of allosteric proteins is used to amplifyand effectively translate a low-energy signal”. Thisargument is supported by a footnote (p. 115) giving asimple numerical example that purports to show thata tetramer can be as much as 1000 times assensitive to a ligand as a monomer.This footnote has prompted us to look more
closely into the mathematical properties of theirmodel. We first introduce the concept of theequivalent monomer and give an easy derivation ofthe general equation for the binding or any number ofdifferent non-competitive ligands. We then discusssome of the properties of the saturation curve fortheir model in the case of a single ligand. Inparticular, we consider when it is “symmetrical” andthe value of its “slope”. Next we consider the physicalrestrictions on the various parameters involved andshow how much these co-operative or allostericeffects reduce the overall sensitivity of the protein tothe substrate. The tables give some numericalexamples for certain special values of the constants.Finally, we consider the argument in the footnote
mentioned above, demonstrate that it is misleading,and give an example to illustrate that, under certainconditions, their claim for the “amplification” effect ofan oligomer over a monomer is well justified.
The Model Described
We shall consider a model identical in its essentialfeatures to that of Monod, Wyman, and Changeux(1965).1 For a fuller description of this model, thereader is referred to their paper, p. 90. In addition, weshall limit ourselves to what they called (p. 95) “K
systems” and will not consider “V systems” in whichthe two states of the protein have the same bindingaffinities but differ in their catalytic activities.The protein is an oligomer consisting of n identical
protomers, arranged symmetrically. There are dis-tinct sites for the different ligands F1, F2, F3,…Fm.There is no direct interaction between any of thesesites, whether they are on the same protomer or theyare on different protomers. The protein exists in twoand only two distinct configurations, the R state andthe T state. All mixed states, in which some of theprotomers are in the R state and some are in the Tstate, are considered to be so unfavorable energet-ically that we can ignore them. In general, the affinityof a ligand for the T state is different from its affinityfor the R state. We define:
Fm = concentration (activity) of the m th ligand.Km, Km′ = microscopic dissociation constants forthe binding of them th ligand to the R and T states,respectively.αm = Fm/Km
cm = Km/Km′. Thus, αmcm = Fm/Km′R0, T0 = concentration (activities) of the R and Tstates, respectively, with no ligands attached.L = equilibrium constant between the R and Tstates such that T0 = LR0.
The Equivalent Monomer
It is convenient at this point to introduce “themathematically equivalent monomer” that, for con-venience, we shall abbreviate to “the equivalentmonomer”. This is a hypothetical monomer that canexist in two states, the r state and the t state closelyanalogous to the R and T states of the oligomer. Ithas the following properties:
(1) The microscopic binding constants of all thevarious ligands have the same values for theequivalent monomer as they have for eachprotomer in the oligomer.
(2) The free-energy difference between the R andT states is, for the oligomer, n times thecorresponding value in the monomer (n is thenumber of equivalent monomers making upthe oligomer).
The crucial assumption is the second one. Asstated above, Monod, Wyman, and Changeux usedthe symbol L for the equilibrium constant betweenthe two states, defining it as
T0 ¼ LR0 ð1Þfor the oligomer. We shall use, in addition, theterminology
t0 ¼ ℓr0 ð2Þ
1503Allostery Revisited
where the small letters apply to the equivalentmonomer, and we shall retain the capital letters forthe oligomer. Thus, the second assumption isequivalent to
L ¼ ℓn ð3ÞOur actual oligomer, in its mathematical proper-
ties, can be considered to be constructed byassembling together n equivalent monomers insuch a way that their r states are completely coupledtogether and that their t states are also completelycoupled but that this coupling does not affect thefree-energy difference per protomer between the twostates nor does it affect the microscopic bindingconstants of any of the ligands.It is of course important to realize that the equivalent
monomer is a mathematical fiction and is not theactualmonomer towhich the oligomermay dissociate.The usefulness of the concept of the equivalent
monomer springs from the theorem
∑T∑R
¼ ∑t∑r
� �n
ð4Þ
In fact, this theorem, which is true for any givenconcentrations whatsoever of the various possibleligands, applies even if there are direct interactionsbetween different sites on the same equivalentmonomer (or protomer) provided there is no directinteraction between any two sites on differentprotomers.The theorem is almost self-evident. Imagine that,
in the chosen solution of the ligands, the proteinmolecule is artificially constrained to be in the Rstate. Then the amount of the binding of the variousligands to the equivalent monomer (restrained in ther state) will be exactly the same as to a protomer ofthe oligomer. In the same way, if the protein isartificially held in the T state, the amount of thevarious ligands bound (though different from theamounts bound to the R state) will once again be thesame for the equivalent monomer (restrained in the tstate) as for a protomer of the oligomer. If theequivalent monomer is not constrained, it will spendpart of its time in the r state and part in the t state.This can be represented by an equilibrium constantand, thus, as a difference in free energy, E, betweenthe two states in this particular solution. Thus
∑t∑r
¼ exp −ERT
� �ð5Þ
Because of the various features of our model, thecorresponding figure for the oligomer is necessarilynE. Thus
∑T∑R
¼ exp −nE
RT
� �¼ ∑t
∑r
� �n
ð6Þ
which is what we set out to prove. We shall define
p ¼ ∑t∑r
� �ð7Þ
from which it follows that
pn ¼ ∑T∑R
� �ð8Þ
Thus, if the concentration of all the different ligandsin the solution is such that, for the equivalentmonomer, the r and t states occur equally often(i.e., p = 1), then the oligomer will also occurequally often in its R and T states in the samesolution and will bind exactly the same amount (perprotomer) of each ligand as the equivalent mono-mer does. In other words, when p = 1, the bindingcurves for the monomer and the oligomer passthrough the same point.The equivalent monomer enables us to derive very
easily the general formula for the binding of the mdifferent ligands. It is easy to show for the equivalentmonomer that p is given by
p ¼ ℓ 1þ c1α1ð Þ 1þ c2α2ð Þ… 1þ cmαmð Þ1þ α1ð Þ 1þ α2ð Þ… 1þ αmð Þ ð9Þ
Since for the corresponding oligomer
∑T∑R
¼ pn ð10Þ
we easily derive the saturation function Ym for theligand Fm as
Ym ¼αm
1þαm
� �þ pn cmαm
1þcmαm
� �1þ pn ð11Þ
This useful and general formula can also be derivedby considering the binding potential.
The Nature of the Saturation Function
We shall consider first the behavior with a singleligand. For simplicity, we drop the subscripts andwrite
Y ¼α
1þα
� �þ pn cα
1þcα
� �1þ pn ð12Þ
and
p ¼ ℓ 1þ cαð Þ1þ αð Þ ð13Þ
1504 Allostery Revisited
It is convenient to introduce several new symbols.Following Wyman,2 we define n′ (which he called n)by the equation
n0 ¼d ln Y
1−Y
� �d ln α
¼ α
Y 1−Y� � dY
dα
� �ð14Þ
Thus, n′ is the slope of Y1−Y
� �against α, each plotted
on a log scale (a Hill plot). Wyman showed that n′ isunity when there are no co-operative effects and thatit cannot exceed n, the number of protomers in theoligomer.We shall use n′max to mean the maximum value of
n′ as α varies while L, c, and n are fixed. The value ofα at which n′ = n′max we shall call αmax. The value ofα at which Y ¼ 1=2 we shall call α½.We must now consider the formal restrictions
upon n, α, L, and c. By their very nature, theycannot be negative. Moreover, n must be aninteger. We shall assume that c ≤ 1.0. This merelyamounts to saying which we are calling the R stateand which we are calling the T state. L can takeany positive value, but as allosteric effects areusually greatest when L is large, we shall mainlyconsider values of L greater than unity. We firstdispose of certain special cases that are of littleinterest.
(1) When L = 0, the protein is always in the Rstate.
(2) When L = ∞, the protein is always in the Tstate.
(3) When c = 1, the ratio of the R state to the Tstate does not change as α varies (becausethe ligand has equal affinity for the two states).
In all these cases, the saturation function Y is asimple hyperbola, and n′ = 1. In what follows, weshall not consider these special cases, although weshall consider what happens when c = 0.When α = 0,Y ¼ 0; when α = ∞, Y ¼ 1. At all other
values of α (c ≠ 1; L ≠ 0, L ≠ ∞), the saturationfunction has the following properties that are easilyproved. All other variables being kept constant,
(1) A decrease in L always increases Y.(2) An increase in c always increases Y.(3) An increase in n (L being constant, not ℓ)
always increases Y.
If, on the other hand, ℓ (not L), c, and α are keptconstant, an increase in n increases or decreasesY depending on whether p is less than or greaterthan unity. If p = 1, a change of n makes nodifference to Y.
The Symmetry of the Binding Curve
We ask under what conditions is the curve of Yagainst log α symmetrical about the midpointY ¼ 1=2. This depends upon n.
(1) For n = 1, it is always symmetrical. The
midpoint occurs when α ¼ 1þL1þLc2.
(2) For n = 2, it is always symmetrical. The
midpoint occurs when α ¼ 1þL1þLc2
� �1=2.
(3) For n = 3 or greater, it is only symmetrical ifℓ2c = 1. The midpoint occurs whenα ¼ ℓ ¼ 1ffiffi
cp .
It is of interest to ask what value of p has underthese various conditions. When n is greater than 2,the condition for symmetry, ℓ2c = 1, makes p = 1 atthe symmetrical midpoint α = ℓ. For the case n = 1 orn = 2, the curve is always symmetrical, but themidpoint in general does not occur when p = 1. Inthe special cases in which ℓ2c = 1, however, p isalways unity at the symmetrical midpoint, when α = ℓ,whatever the value of n.In physical terms, the condition ℓ2c = 1 implies
that the value of p when α = 0 (i.e., p = ℓ) is thereciprocal of the value of p when α = ∞ (i.e., p =ℓc). That is, the balance in favor of the T statewhen Y is zero is exactly equal to the balance infavor of the R state when Y goes to unity. It is thusnot surprising that the Hill plot is always symmet-rical under these conditions. Conversely, if ℓc N 1and ℓ N 1, the T state is favored over the wholerange, and if ℓc b 1 and ℓ b 1, the R statepredominates everywhere. In fact, as a roughrule, one can say that whether the T or the Rstate is the more common depends upon whetherℓ2c is greater or less than unity.In the special case c = 0, the value of p is unity
when α = ℓ − 1.
The Case of n → ∞
One gets some insight into the behavior of thesaturation function for higher values of n byconsidering the unrealistic case of n being verylarge. In these circumstances, pn approximates to astep function, the step going from pn = ℓn down topn = (ℓc)n at the point where α ¼ ℓ−1
1−ℓc
� �, since this
makes p = 1, assuming that ℓ and c are such that αcan attain this value. If ℓ N 1 and ℓc b 1, then pn
jumps down from infinity to zero at this point if n isinfinite. Thus, the saturation function will start off, atlow α, following the hyperbola Y ¼ ca
1þca, and at thepoint α ¼ ℓ−1
1−ℓc
� �, and will jump up to the hyperbola
Y ¼ α1þα as the entire protein swings suddenly from
the T state to the R state.It is easy to see that the binding curve will be
symmetrical (plotted against log α) if the value of Y
1505Allostery Revisited
just before the jump is equal to the value of 1−Y� �
just after the jump. That is, if the jump occurs when αis given by
cα1þ cα
¼ 1−α
1þ αð15Þ
This equation is satisfied if α ¼ 1ffiffic
p . Since the jumpoccurs whenα ¼ ℓ−1
1−ℓc, these two conditions imply thatℓ2c = 1, as might have been expected from ourprevious approach.
The Maximum Value of n′
The parameter n′ is in effect a convenient measureof the slope of the binding curve. It is thus useful toask how it varies with α. When α = 0 or α = ∞, n′takes the value 1.0. In between, it rises smoothly to amaximum except when n = 1, when naturally n′ isalways unity. The maximum is usually near the point:Y ¼ 1=2, but need not occur exactly at that valueunless the curve of Y against log α is symmetrical.By rather tedious algebra, it can be shown that, for
an oligomer made of n protomers, n′ is given by theformula
n−n0 ¼ n−1ð Þ Yn−1
Yn
� �ð16Þ
where
Yn ¼ α 1þ αð Þn−1 þ Lcα 1þ cαð Þn−11þ αð Þn þ L 1þ cαð Þn ð17Þ
and is thus the saturation function for the oligomerand whereYn−1 is obtained by substituting (n − 1) forn in this equation. This formula is true for all relevantvalues of n, L, c, and α. One naturally suspects thatthere is a simple derivation of it, but we have beenunable to discover it. It is easily shown that Yn−1 isnever greater than Yn.We now consider how the maximum value of n′ (as
α varies), which we have called n′max, varies with n,c, and ℓ. We have not obtained the general formulafor n′max as it appears to be very cumbersome buthave instead studied certain special cases. Weconsider first that n is given.(1) For a given value of ℓ, but differing values of c,
n′max is always a maximum when c = 0. For theseconditions (i.e., c = 0), n′max is given by
n0max ¼ n
αmax
1þ αmax
� �ð18Þ
where αmax (the value of α that makes n′ amaximum)is that value of α that satisfies the equation
1þ αð Þn−1 α n−1ð Þ−1½ � ¼ L ð19Þ(2) For a given value of c (c ≠ 0) but differing
values of ℓ, n′max is a maximum when ℓ2c = 1 and
occurs when αmax ¼ ℓ ¼ 1ffiffic
p . This is the condition thatmakes the binding curve symmetrical. For thisspecial case, n′max is given by the formula
n−n0max ¼
4ℓ n−1ð Þ1þ ℓð Þ2 ¼ 4
ffiffiffic
pn−1ð Þ
1þ ffiffiffic
p� �2 ð20Þ
Equivalent formulas are
n0max−1 ¼ n−1ð Þ ℓ−1
ℓþ 1
� �2
¼ n−1ð Þ 1−ffiffiffic
p
1þ ffiffiffic
p� �2
ð21Þ
As c → 0 (and thus ℓ → ∞), n′ → n.It is worth pointing out that, when ℓ2c ≠ 1, the value
of n′ at the special value of α which makes p = 1 isgiven by
n−n0ð Þ ¼ 2 n−1ð Þ 1þ ℓ2c� �
1þ ℓð Þ 1þ ℓcð Þ ð22Þ
This will often give a good approximation to n′max ifℓ2c is not far from unity.In considering how n′max varies when n is altered,
we shall consider c to be fixed and also ℓ (note: ℓ, notL). For algebraic simplicity, we shall restrict our-selves to those special cases in which ℓ2c = 1. If thisis so, then from the equation above [Eq. (21)], wesee that when n increases, n′max also increases. It isplausible that this is also true when ℓ2c ≠ 1.
The Allosteric Range
It is useful to have a parameter to denote howmuch an allosteric protein changes as the concen-tration of a ligand goes from zero to infinity. We thusintroduce the concept of the “allosteric range”, whichis the modulus of the difference between the values
∑T∑Tþ∑R at these two extremes. Thus, if the protein is
entirely in the T state when α = 0 and entirely in theR state when α = ∞, then Q, the allosteric range, willbe unity. For the case of a single ligand,Q is given by
Q ¼ L1þ L
� �−
Lcn
1þ Lcn
� �¼ L 1−cnð Þ
1þ Lð Þ 1þ cnð Þ ð23Þ
It is easy to see, for a given L, thatQ increases whencn decreases. Thus, for a given n, Q is a maximumwhen c = 0. For a given c, Q increases as nincreases (c b 1).When n and c are both given, we can easily show
that Q is a maximum when L2cn = 1. That is, whenℓ2c = 1. When this is so, the inaccessible range (1 −Q) is 1−Qð Þ ¼ 2
Lþ1. This is tabulated in Table 2 forvarious values of α½ and n. On the other hand, whenc = 0, the inaccessible range is 1−Qð Þ ¼ 1
Lþ1, exactly
half the value when ℓ2c = 1. This is because the
1506 Allostery Revisited
inaccessible range is in two parts, one where ∑T∑Tþ∑R
is near zero and other one when it is near unity. Forthe symmetrical case, ℓ2c = 1, these two inaccessi-ble regions are equal. However, when c = 0, theinaccessible region occurs only when ∑T
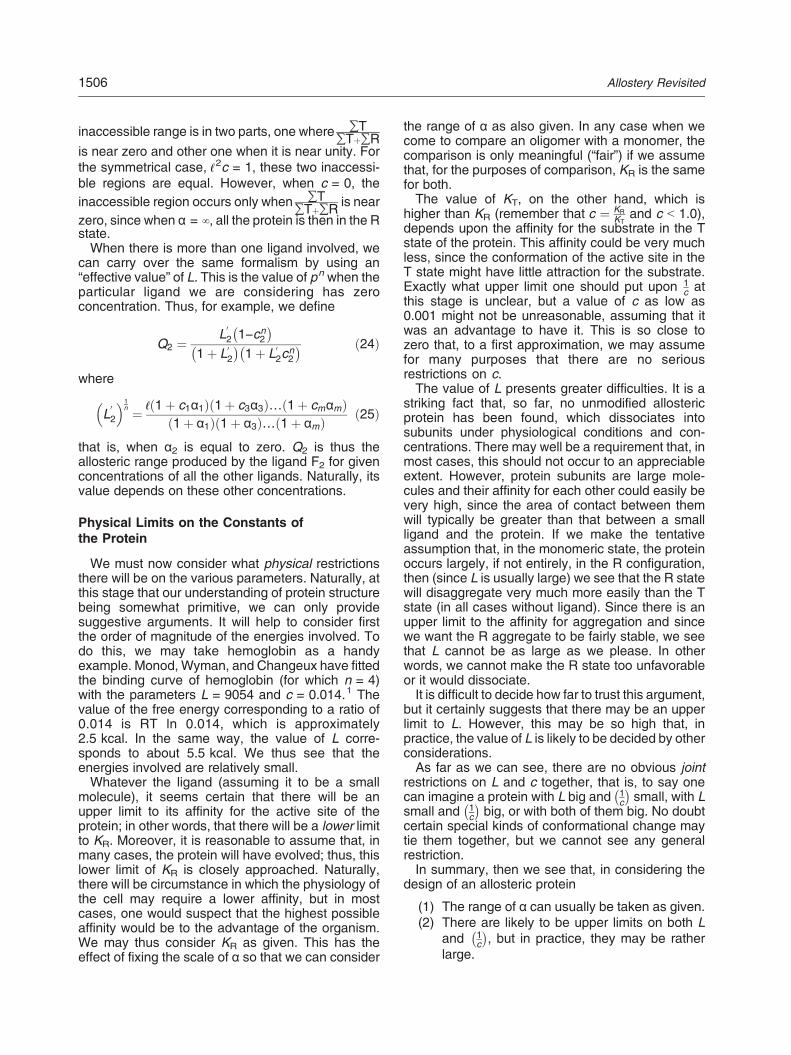
∑Tþ∑R is nearzero, since when α = ∞, all the protein is then in the Rstate.When there is more than one ligand involved, we
can carry over the same formalism by using an“effective value” of L. This is the value of pn when theparticular ligand we are considering has zeroconcentration. Thus, for example, we define
Q2 ¼ L02 1−cn
2
� �1þ L0
2
� �1þ L0
2cn2
� � ð24Þ
where
L02
� �1n ¼ ℓ 1þ c1α1ð Þ 1þ c3α3ð Þ… 1þ cmαmð Þ
1þ α1ð Þ 1þ α3ð Þ… 1þ αmð Þ ð25Þ
that is, when α2 is equal to zero. Q2 is thus theallosteric range produced by the ligand F2 for givenconcentrations of all the other ligands. Naturally, itsvalue depends on these other concentrations.
Physical Limits on the Constants ofthe Protein
We must now consider what physical restrictionsthere will be on the various parameters. Naturally, atthis stage that our understanding of protein structurebeing somewhat primitive, we can only providesuggestive arguments. It will help to consider firstthe order of magnitude of the energies involved. Todo this, we may take hemoglobin as a handyexample. Monod, Wyman, and Changeux have fittedthe binding curve of hemoglobin (for which n = 4)with the parameters L = 9054 and c = 0.014.1 Thevalue of the free energy corresponding to a ratio of0.014 is RT ln 0.014, which is approximately2.5 kcal. In the same way, the value of L corre-sponds to about 5.5 kcal. We thus see that theenergies involved are relatively small.Whatever the ligand (assuming it to be a small
molecule), it seems certain that there will be anupper limit to its affinity for the active site of theprotein; in other words, that there will be a lower limitto KR. Moreover, it is reasonable to assume that, inmany cases, the protein will have evolved; thus, thislower limit of KR is closely approached. Naturally,there will be circumstance in which the physiology ofthe cell may require a lower affinity, but in mostcases, one would suspect that the highest possibleaffinity would be to the advantage of the organism.We may thus consider KR as given. This has theeffect of fixing the scale of α so that we can consider
the range of α as also given. In any case when wecome to compare an oligomer with a monomer, thecomparison is only meaningful (“fair”) if we assumethat, for the purposes of comparison, KR is the samefor both.The value of KT, on the other hand, which is
higher than KR (remember that c ¼ KRKT
and c b 1.0),depends upon the affinity for the substrate in the Tstate of the protein. This affinity could be very muchless, since the conformation of the active site in theT state might have little attraction for the substrate.Exactly what upper limit one should put upon 1
c atthis stage is unclear, but a value of c as low as0.001 might not be unreasonable, assuming that itwas an advantage to have it. This is so close tozero that, to a first approximation, we may assumefor many purposes that there are no seriousrestrictions on c.The value of L presents greater difficulties. It is a
striking fact that, so far, no unmodified allostericprotein has been found, which dissociates intosubunits under physiological conditions and con-centrations. There may well be a requirement that, inmost cases, this should not occur to an appreciableextent. However, protein subunits are large mole-cules and their affinity for each other could easily bevery high, since the area of contact between themwill typically be greater than that between a smallligand and the protein. If we make the tentativeassumption that, in the monomeric state, the proteinoccurs largely, if not entirely, in the R configuration,then (since L is usually large) we see that the R statewill disaggregate very much more easily than the Tstate (in all cases without ligand). Since there is anupper limit to the affinity for aggregation and sincewe want the R aggregate to be fairly stable, we seethat L cannot be as large as we please. In otherwords, we cannot make the R state too unfavorableor it would dissociate.It is difficult to decide how far to trust this argument,
but it certainly suggests that there may be an upperlimit to L. However, this may be so high that, inpractice, the value of L is likely to be decided by otherconsiderations.As far as we can see, there are no obvious joint
restrictions on L and c together, that is, to say onecan imagine a protein with L big and 1
c
� �small, with L
small and 1c
� �big, or with both of them big. No doubt
certain special kinds of conformational change maytie them together, but we cannot see any generalrestriction.In summary, then we see that, in considering the
design of an allosteric protein
(1) The range of α can usually be taken as given.(2) There are likely to be upper limits on both L
and 1c
� �, but in practice, they may be rather
large.
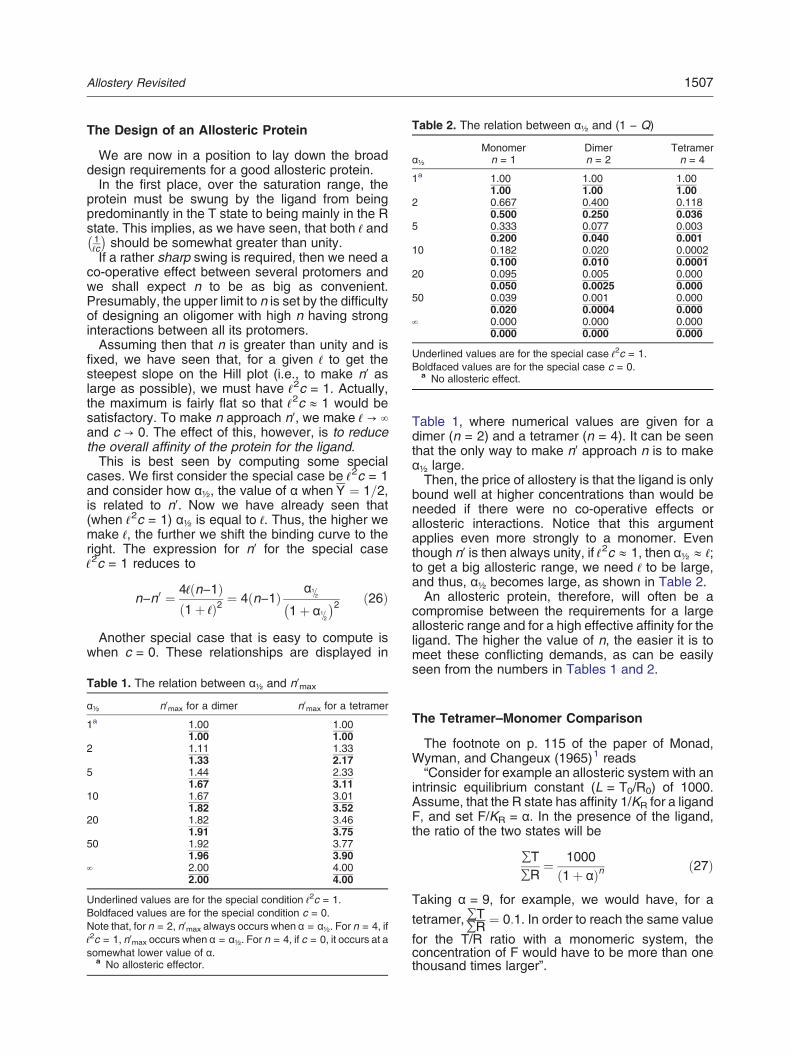
Table 2. The relation between α½ and (1 − Q)
α½Monomern = 1
Dimern = 2
Tetramern = 4
1a 1.00 1.00 1.001.00 1.00 1.00
2 0.667 0.400 0.1180.500 0.250 0.036
5 0.333 0.077 0.0030.200 0.040 0.001
10 0.182 0.020 0.00020.100 0.010 0.0001
20 0.095 0.005 0.0000.050 0.0025 0.000
50 0.039 0.001 0.0000.020 0.0004 0.000
∞ 0.000 0.000 0.0000.000 0.000 0.000
Underlined values are for the special case ℓ2c = 1.Boldfaced values are for the special case c = 0.
a No allosteric effect.
1507Allostery Revisited
The Design of an Allosteric Protein
We are now in a position to lay down the broaddesign requirements for a good allosteric protein.In the first place, over the saturation range, the
protein must be swung by the ligand from beingpredominantly in the T state to being mainly in the Rstate. This implies, as we have seen, that both ℓ and1ℓc
� �should be somewhat greater than unity.
If a rather sharp swing is required, then we need aco-operative effect between several protomers andwe shall expect n to be as big as convenient.Presumably, the upper limit to n is set by the difficultyof designing an oligomer with high n having stronginteractions between all its protomers.Assuming then that n is greater than unity and is
fixed, we have seen that, for a given ℓ to get thesteepest slope on the Hill plot (i.e., to make n′ aslarge as possible), we must have ℓ2c = 1. Actually,the maximum is fairly flat so that ℓ2c ≈ 1 would besatisfactory. To make n approach n′, we make ℓ → ∞and c → 0. The effect of this, however, is to reducethe overall affinity of the protein for the ligand.This is best seen by computing some special
cases. We first consider the special case be ℓ2c = 1and consider how α½, the value of α when Y ¼ 1=2,is related to n′. Now we have already seen that(when ℓ2c = 1) α½ is equal to ℓ. Thus, the higher wemake ℓ, the further we shift the binding curve to theright. The expression for n′ for the special caseℓ2c = 1 reduces to
n−n0 ¼ 4ℓ n−1ð Þ1þ ℓð Þ2 ¼ 4 n−1ð Þ α1=2
1þ α1=2
� �2 ð26Þ
Another special case that is easy to compute iswhen c = 0. These relationships are displayed in
Table 1. The relation between α½ and n′max
α½ n′max for a dimer n′max for a tetramer
1a 1.00 1.001.00 1.00
2 1.11 1.331.33 2.17
5 1.44 2.331.67 3.11
10 1.67 3.011.82 3.52
20 1.82 3.461.91 3.75
50 1.92 3.771.96 3.90
∞ 2.00 4.002.00 4.00
Underlined values are for the special condition ℓ2c = 1.Boldfaced values are for the special condition c = 0.Note that, for n = 2, n′max always occurs when α = α½. For n = 4, ifℓ2c = 1, n′max occurs when α = α½. For n = 4, if c = 0, it occurs at asomewhat lower value of α.
a No allosteric effector.
Table 1, where numerical values are given for adimer (n = 2) and a tetramer (n = 4). It can be seenthat the only way to make n′ approach n is to makeα½ large.Then, the price of allostery is that the ligand is only
bound well at higher concentrations than would beneeded if there were no co-operative effects orallosteric interactions. Notice that this argumentapplies even more strongly to a monomer. Eventhough n′ is then always unity, if ℓ2c ≈ 1, then α½ ≈ ℓ;to get a big allosteric range, we need ℓ to be large,and thus, α½ becomes large, as shown in Table 2.An allosteric protein, therefore, will often be a
compromise between the requirements for a largeallosteric range and for a high effective affinity for theligand. The higher the value of n, the easier it is tomeet these conflicting demands, as can be easilyseen from the numbers in Tables 1 and 2.
The Tetramer–Monomer Comparison
The footnote on p. 115 of the paper of Monad,Wyman, and Changeux (1965)1 reads“Consider for example an allosteric system with an
intrinsic equilibrium constant (L = T0/R0) of 1000.Assume, that the R state has affinity 1/KR for a ligandF, and set F/KR = α. In the presence of the ligand,the ratio of the two states will be
∑T∑R
¼ 10001þ αð Þn ð27Þ
Taking α = 9, for example, we would have, for a
tetramer, ∑T∑R ¼ 0:1. In order to reach the same value
for the T/R ratio with a monomeric system, theconcentration of F would have to be more than onethousand times larger”.
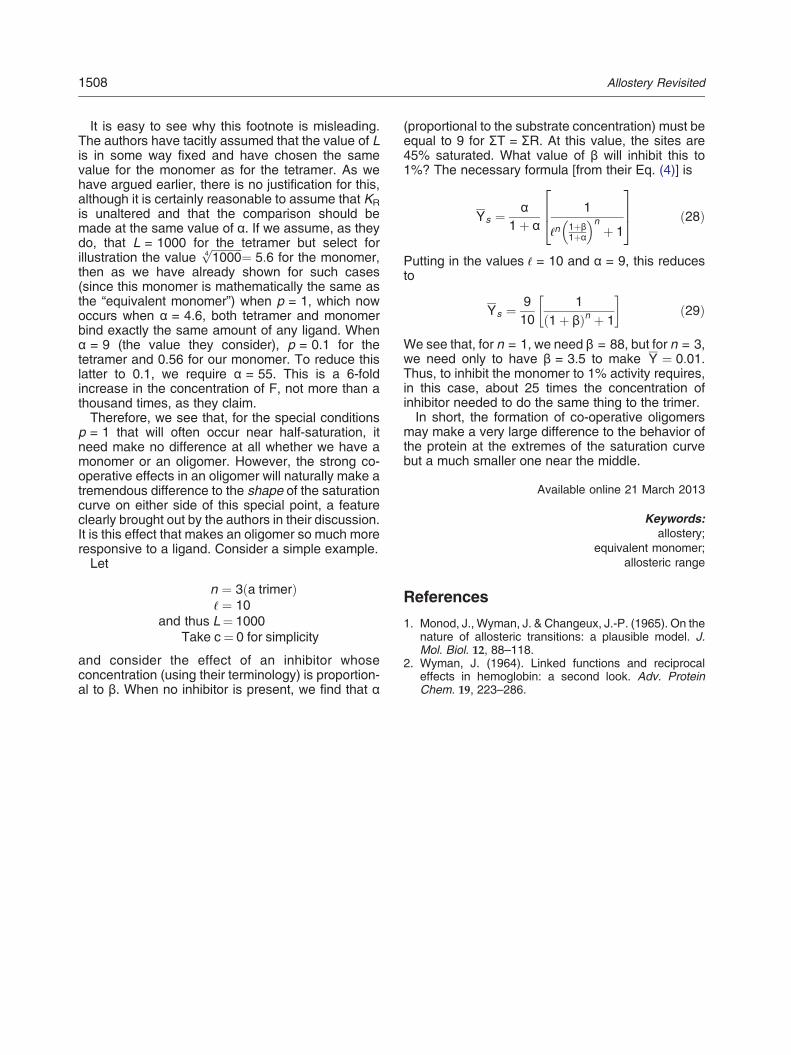
1508 Allostery Revisited
It is easy to see why this footnote is misleading.The authors have tacitly assumed that the value of Lis in some way fixed and have chosen the samevalue for the monomer as for the tetramer. As wehave argued earlier, there is no justification for this,although it is certainly reasonable to assume that KRis unaltered and that the comparison should bemade at the same value of α. If we assume, as theydo, that L = 1000 for the tetramer but select forillustration the value
ffiffiffiffiffiffiffiffiffiffiffi10004
p ¼ 5:6 for the monomer,then as we have already shown for such cases(since this monomer is mathematically the same asthe “equivalent monomer”) when p = 1, which nowoccurs when α = 4.6, both tetramer and monomerbind exactly the same amount of any ligand. Whenα = 9 (the value they consider), p = 0.1 for thetetramer and 0.56 for our monomer. To reduce thislatter to 0.1, we require α = 55. This is a 6-foldincrease in the concentration of F, not more than athousand times, as they claim.Therefore, we see that, for the special conditions
p = 1 that will often occur near half-saturation, itneed make no difference at all whether we have amonomer or an oligomer. However, the strong co-operative effects in an oligomer will naturally make atremendous difference to the shape of the saturationcurve on either side of this special point, a featureclearly brought out by the authors in their discussion.It is this effect that makes an oligomer so much moreresponsive to a ligand. Consider a simple example.Let
n ¼ 3 a trimerð Þℓ ¼ 10
and thus L¼ 1000Take c¼ 0 for simplicity
and consider the effect of an inhibitor whoseconcentration (using their terminology) is proportion-al to β. When no inhibitor is present, we find that α
(proportional to the substrate concentration) must beequal to 9 for ΣT = ΣR. At this value, the sites are45% saturated. What value of β will inhibit this to1%? The necessary formula [from their Eq. (4)] is
Ys ¼ α1þ α
1
ℓn 1þβ1þα
� �nþ 1
264
375 ð28Þ
Putting in the values ℓ = 10 and α = 9, this reducesto
Ys ¼ 910
11þ βð Þn þ 1
ð29Þ
We see that, for n = 1, we need β = 88, but for n = 3,we need only to have β = 3.5 to make Y ¼ 0:01.Thus, to inhibit the monomer to 1% activity requires,in this case, about 25 times the concentration ofinhibitor needed to do the same thing to the trimer.In short, the formation of co-operative oligomers
may make a very large difference to the behavior ofthe protein at the extremes of the saturation curvebut a much smaller one near the middle.
Available online 21 March 2013
Keywords:allostery;
equivalent monomer;allosteric range
References
1. Monod, J., Wyman, J. & Changeux, J.-P. (1965). On thenature of allosteric transitions: a plausible model. J.Mol. Biol. 12, 88–118.
2. Wyman, J. (1964). Linked functions and reciprocaleffects in hemoglobin: a second look. Adv. ProteinChem. 19, 223–286.