Embed Size (px)
Citation preview
Geoff Smith Pharmaceutical Technologies
Leicester School of Pharmacy
De Montfort University
www.dmu.ac.uk/geoffsmith
A focus on PAT in freeze-drying
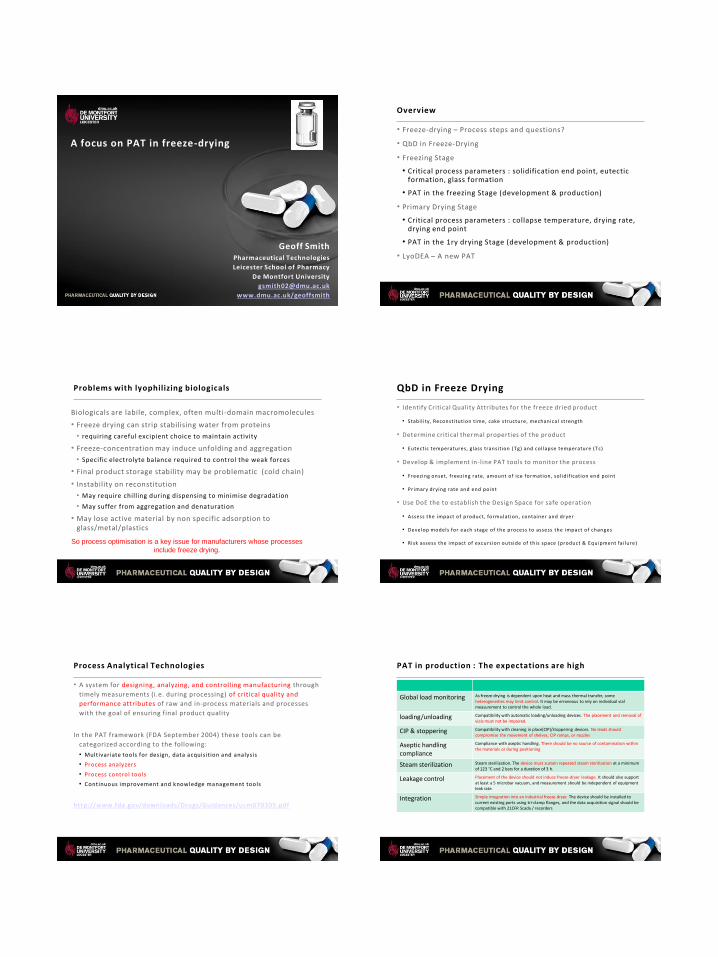
• Freeze-drying – Process steps and questions?
• QbD in Freeze-Drying
• Freezing Stage
• Critical process parameters : solidification end point, eutectic formation, glass formation
• PAT in the freezing Stage (development & production)
• Primary Drying Stage
• Critical process parameters : collapse temperature, drying rate, drying end point
• PAT in the 1ry drying Stage (development & production)
• LyoDEA – A new PAT
Overview
Problems with lyophilizing biologicals
Biologicals are labile, complex, often multi -domain macromolecules
• Freeze drying can strip stabilising water from proteins
• requiring careful excipient choice to maintain activity
• Freeze-concentration may induce unfolding and aggregation
• Specific electrolyte balance required to control the weak forces
• Final product storage stability may be problematic (cold chain)
• Instability on reconstitution
• May require chilling during dispensing to minimise degradation
• May suffer from aggregation and denaturation
• May lose active material by non specific adsorption to glass/metal/plastics
3
So process optimisation is a key issue for manufacturers whose processes
include freeze drying.
• Identify Critical Quality Attributes for the freeze dried product
• Stabi l i ty, Reconstitution time, cake structure, mechanical strength
• Determine critical thermal properties of the product
• Eutectic temperatures, glass transition ( Tg) and col lapse temperature (Tc)
• Develop & implement in-l ine PAT tools to monitor the process
• Freezing onset, freezing rate, amount of ice formation, sol idification end point
• Primary drying rate and end point
• Use DoE the to establish the Design Space for safe operation
• Assess the impact of product, formulation, container and dryer
• Develop models for each stage of the process to assess the impact of changes
• Risk assess the impact of excursion outside of this space (product & Equipment fai lure)
QbD in Freeze Drying
• A system for designing, analyzing, and controlling manufacturing through
timely measurements (i.e. during processing) of critical quality and
performance attributes of raw and in-process materials and processes
with the goal of ensuring final product quality
In the PAT framework (FDA September 2004) these tools can be
categorized according to the following:
• Multivariate tools for design, data acquisition and analysis
• Process analyzers
• Process control tools
• Continuous improvement and knowledge management tools
http://www.fda.gov/downloads/Drugs/Guidances/ucm070305.pdf
Process Analytical Technologies
Global load monitoring As freeze-drying is dependent upon heat and mass thermal transfer, some heterogeneities may limit control. It may be erroneous to rely on individual vial measurement to control the whole load.
loading/unloading Compatibility with automatic loading/unloading devices. The placement and removal of vials must not be impaired.
CIP & stoppering Compatibility with cleaning in place(CIP)/stoppering devices. No leads should compromise the movement of shelves, CIP ramps, or nozzles
Aseptic handling compliance
Compliance with aseptic handling. There should be no source of contamination within the materials or during positioning
Steam sterilization Steam sterilization. The device must sustain repeated steam sterilization at a minimum of 123 °C and 2 bars for a duration of 3 h.
Leakage control Placement of the device should not induce freeze-dryer leakage. It should also support at least a 5 microbar vacuum, and measurement should be independent of equipment leak rate.
Integration Simple integration into an industrial freeze-dryer. The device should be installed to current existing ports using tri-clamp flanges, and the data acquisition signal should be compatible with 21CFR Scada / recorders
PAT in production : The expectations are high

Comparison of PATs for Production
Modified from Mayeresse et al. PDA J Pharm Sci Technol. 2007 May-Jun;61(3):160-74
Drying rate & End Point End point Freeze drying cycle design
• Process design achieved by multiple cycles to establish high&low operational limits
• Repeatability established by consistency of batches and process trend monitoring
Freezing 1ry drying 2ry drying Tem
pera
ture
Vacuum
Time (Hours)
Vacuum
(how deep?) Ramp rate
Anneal?
How long? Temp.
(How high?)
Product Scales
1: Microscopic : Molecular dynamics in the unfrozen phase (relevance to
collapse temperature)
2: Mesoscopic: Ice crystals and connectivity (relevance to drying rates)
3: Macroscopic I : Ice formation from the base (impact on scale 2).
Temperature differences across the ice layer, changing ratio of ice layer
and dry layer during drying,
4: Macroscopic II : design of vial (size, wall thickness, base characteristics),
Impact of vial dimensions in relation to fill height, clustering of vials
Engineering scale
1: size of shelf, separation of shelves, edge effects
2: loading of drier, condenser capacity, coolant capacity, dimensions of
ducting between the chamber and condenser (choke flow) etc..
•
PAT : What do you need to measure and at what scale
FREEZING STAGE
The Desired state?
(Freezing onset, freezing rate, amount of ice formation,
solidification end point)
End of freezing stage : Product temperature stabilises
-40
-30
-20
-10
0
10
20
30
0 0.5 1 1.5 2 2.5 3 3.5 4 4.5
Tem
pe
ratu
re/°
C
Time/h
Thermocouple Shelf temperature
1ry drying Hold time?
Freezing is a critical step
Super-cooling & nucleation, induction
• Ice nucleation is a random process- can
impact homogeneity of product
• Slower freezing gives rise to bigger ice
crystals and permits faster sublimation JA
Searles et al J Pharm Sci 90; 860-71 (2001)
• Rapid freezing may be needed for labile
products (Åkerblom et al Infusions
Therapie 1992; 19:283-287)
• Annealing (raising the temperature during
freezing stage) may improve ice crystal
growth JA Searles et al J Pharm Sci 90;872-
87 (2001)
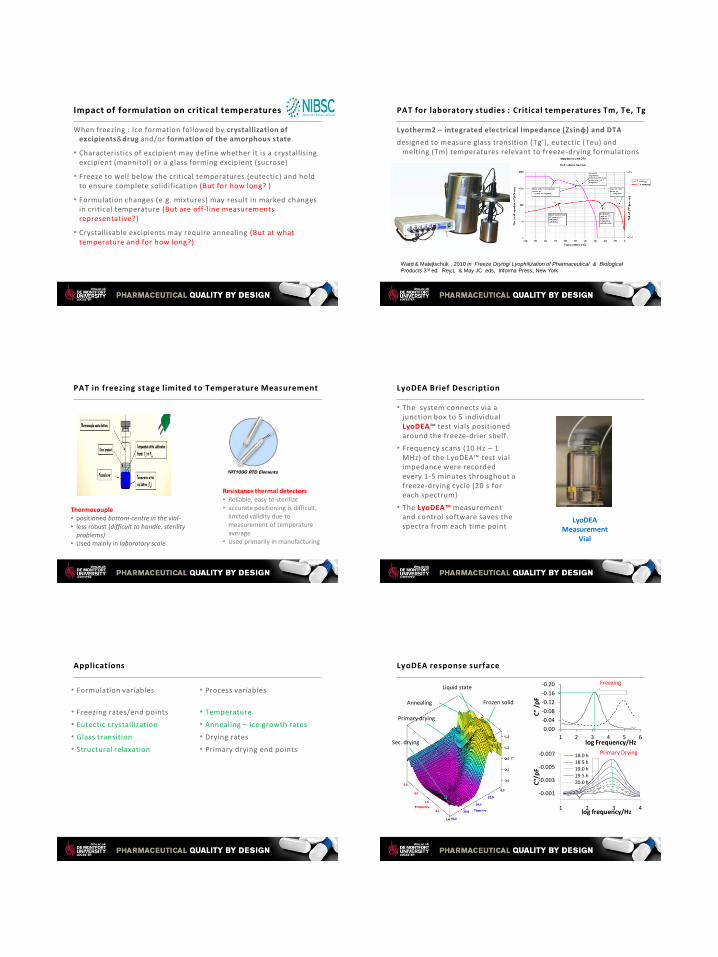
When freezing : Ice formation followed by crystallization of excipients&drug and/or formation of the amorphous state
• Characteristics of excipient may define whether it is a crystallising excipient (mannitol) or a glass forming excipient (sucrose)
• Freeze to well below the critical temperatures (eutectic) and hold to ensure complete solidification (But for how long? )
• Formulation changes (e.g. mixtures) may result in marked changes in critical temperature (But are off-line measurements representative?)
• Crystallisable excipients may require annealing (But at what temperature and for how long?)
Impact of formulation on critical temperatures
Lyotherm2 – integrated electrical Impedance (Zsinφ) and DTA
designed to measure glass transition (Tg’), eutectic (Teu) and melting (Tm) temperatures relevant to freeze-drying formulations
PAT for laboratory studies : Critical temperatures Tm, Te, Tg
Ward & Matejtschuk , 2010 in Freeze Drying/ Lyophilization of Pharmaceutical & Biological
Products 3rd ed. Rey,L & May JC eds, Informa Press, New York
PAT in freezing stage limited to Temperature Measurement
Resistance thermal detectors • Reliable, easy to sterilize • accurate positioning is difficult,
limited validity due to measurement of temperature average
• Used primarily in manufacturing
Thermocouple • positioned bottom-centre in the vial- • less robust (difficult to handle, sterility
problems) • Used mainly in laboratory scale
• The system connects via a junction box to 5 individual LyoDEA™ test vials positioned around the freeze-drier shelf.
• Frequency scans (10 Hz – 1 MHz) of the LyoDEA™ test vial impedance were recorded every 1-5 minutes throughout a freeze-drying cycle (20 s for each spectrum)
• The LyoDEA™ measurement and control software saves the spectra from each time point
LyoDEA Brief Description
LyoDEA Measurement
Vial
Junction Box
Applications
• Formulation variables
• Freezing rates/end points
• Eutectic crystallization
• Glass transition
• Structural relaxation
• Process variables
• Temperature
• Annealing – ice growth rates
• Drying rates
• Primary drying end points
LyoDEA response surface
-0.20
-0.16
-0.12
-0.08
-0.04
0.00
1 2 3 4 5 6
C"
/pF
log Frequency/Hz
-0.007
-0.005
-0.003
-0.001
1 2 3 4
C″/
pF
log frequency/Hz
18.0 h 18.5 h 19.0 h 19.5 h 20.0 h
Primary Drying
Freezing
Frozen solid
Liquid state
Annealing
Primary drying
Sec. drying
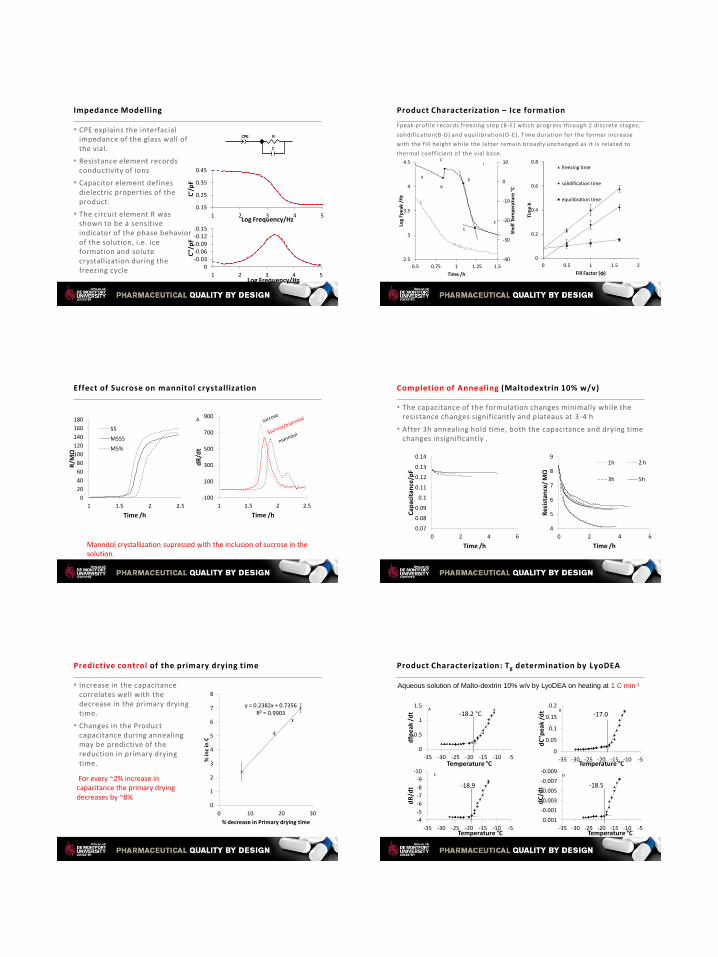
• CPE explains the interfacial impedance of the glass wall of the vial.
• Resistance element records conductivity of ions
• Capacitor element defines dielectric properties of the product.
• The circuit element R was shown to be a sensitive indicator of the phase behavior of the solution, i.e. ice formation and solute crystallization during the freezing cycle
Impedance Modelling
CPE R
C
Element Freedom Value Error Error %
CPE-T Free(±) 8.8536E-13 N/A N/A
CPE-P Free(±) 0.98823 N/A N/A
R Free(±) 4.106E08 N/A N/A
C Free(±) 3.001E-12 N/A N/A
Data File:
Circuit Model File: E:\Experimental work\Sucrose FD\Maltodextrin solution freezing.mdl
Mode: Run Fitting / Selected Points (0 - 0)
Maximum Iterations: 100
Optimization Iterations: 0
Type of Fitting: Complex
Type of Weighting: Calc-Modulus
-0.15 -0.12 -0.09 -0.06 -0.03
0
1 2 3 4 5
C''/
pF
Log Frequency/Hz
0.15
0.25
0.35
0.45
1 2 3 4 5
C'/
pF
Log Frequency/Hz
Fpeak profile records freezing step (B-E) which progress through 2 discrete stages;
solidification(B-D) and equilibration(D-E). Time duration for the former increase
with the fi l l height while the latter remain broadly unchanged as it is related to
thermal coefficient of the vial base.
Product Characterization – Ice formation
0
0.2
0.4
0.6
0.8
0 0.5 1 1.5 2
Tim
e h
Fill Factor (ɸ)
freezing time
solidification time
equilibration time
-40
-30
-20
-10
0
10
2.5
3
3.5
4
4.5
0.5 0.75 1 1.25 1.5
Shel
f Te
mp
erat
ure
°C
Log
Fpea
k /H
z
Time /h
A
B
C
D
I
E
F
Effect of Sucrose on mannitol crystallization
0
20
40
60
80
100
120
140
160
180
1 1.5 2 2.5
R/M
Ω
Time /h
S5
M5S5
M5%
A
-100
100
300
500
700
900
1 1.5 2 2.5
dR
/dt
Time /h
Mannitol crystallization supressed with the inclusion of sucrose in the solution.
• The capacitance of the formulation changes minimally while the resistance changes significantly and plateaus at 3 -4 h
• After 3h annealing hold time, both the capacitance and drying time changes insignificantly .
Completion of Annealing (Maltodextrin 10% w/v)
4
5
6
7
8
9
0 2 4 6
Res
ista
nce
/ M
Ω
Time /h
1h 2 h
3h 5h
0.07
0.08
0.09
0.1
0.11
0.12
0.13
0.14
0 2 4 6
Cap
acit
ance
/pF
Time /h
• Increase in the capacitance correlates well with the decrease in the primary drying time.
• Changes in the Product capacitance during annealing may be predictive of the reduction in primary drying time.
Predictive control of the primary drying time
y = 0.2382x + 0.7356 R² = 0.9903
0
1
2
3
4
5
6
7
8
0 10 20 30
% in
c in
C
% decrease in Primary drying time
For every ~2% increase in capacitance the primary drying decreases by ~8%
Product Characterization: Tg determination by LyoDEA
0
0.5
1
1.5
-35 -30 -25 -20 -15 -10 -5
dfp
eak
/dt
Temperature °C
-18.2 °C A
0
0.05
0.1
0.15
0.2
-35 -30 -25 -20 -15 -10 -5
dC
"pea
k /d
t
Temperature °C
-17.0 B
-10
-9
-8
-7
-6
-5
-4
-35 -30 -25 -20 -15 -10 -5
dR
/dt
Temperature °C
-18.9
C -0.009
-0.007
-0.005
-0.003
-0.001
0.001
-35 -30 -25 -20 -15 -10 -5
dC
/dt
Temperature °C
-18.5
D
Aqueous solution of Malto-dextrin 10% w/v by LyoDEA on heating at 1 C min-1
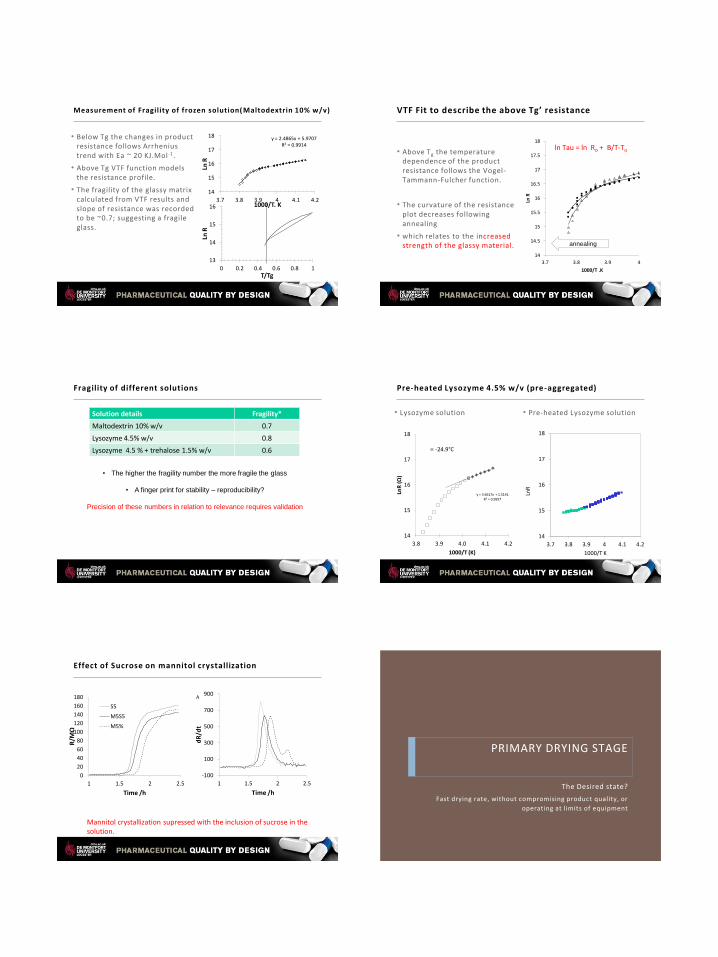
Measurement of Fragility of frozen solution( Maltodextrin 10% w/v)
• Below Tg the changes in product resistance follows Arrhenius trend with Ea ~ 20 KJ.Mol -1.
• Above Tg VTF function models the resistance profile.
• The fragility of the glassy matrix calculated from VTF results and slope of resistance was recorded to be ~0.7; suggesting a fragile glass.
y = 2.4865x + 5.9707 R² = 0.9914
14
15
16
17
18
3.7 3.8 3.9 4 4.1 4.2 Ln
R
1000/T. K
13
14
15
16
0 0.2 0.4 0.6 0.8 1
Ln R
T/Tg
14
14.5
15
15.5
16
16.5
17
17.5
18
3.7 3.8 3.9 4
Ln R
1000/T .K
VTF Fit to describe the above Tg’ resistance
ln Tau = ln Ro + B/T-To • Above Tg the temperature
dependence of the product resistance follows the Vogel-Tammann-Fulcher function.
• The curvature of the resistance plot decreases following annealing
• which relates to the increased strength of the glassy material . annealing
Fragility of different solutions
Solution details Fragility*
Maltodextrin 10% w/v 0.7
Lysozyme 4.5% w/v 0.8
Lysozyme 4.5 % + trehalose 1.5% w/v 0.6
• The higher the fragility number the more fragile the glass
• A finger print for stability – reproducibility?
Precision of these numbers in relation to relevance requires validation
Pre-heated Lysozyme 4.5% w/v (pre-aggregated)
• Lysozyme solution
y = 3.6617x + 1.5141
R² = 0.9957
14
15
16
17
18
3.8 3.9 4.0 4.1 4.2
LnR
(Ω
)
1000/T (K)
-24.9°C
• Pre-heated Lysozyme solution
14
15
16
17
18
3.7 3.8 3.9 4 4.1 4.2
LnR
1000/T K
Effect of Sucrose on mannitol crystallization
0
20
40
60
80
100
120
140
160
180
1 1.5 2 2.5
R/M
Ω
Time /h
S5
M5S5
M5%
A
-100
100
300
500
700
900
1 1.5 2 2.5
dR
/dt
Time /h
Mannitol crystallization supressed with the inclusion of sucrose in the solution.
PRIMARY DRYING STAGE
The Desired state?
Fast drying rate, without compromising product quality, or
operating at limits of equipment

Design Space for Primary Drying
• The aim is to achieve an acceptable drying rate, without
• compromising product quality
• operating the equipment at (or beyond) the limits of its capability
• Lab scale instruments for screening formulations and process conditions to optimise drying profiles Microbalance
• PAT and “intelligent” freeze drying software has allowed
• in process monitoring
• interactive control of the cycle
PAT in Primary Drying
Methodologies for Production Scale
• pressure rise and MTM (Tang et al Pharm Res 2005,22;685-700),
• tunable diode laser absorption spectroscopy ( Gieseler et al J Pharm Sci
2007,96;1776-93)
• soft sensor probes (Barresi et al Int J Refrigeration 2009,32;1003-14)
have enabled critical process parameters (drying rate) to be monitored and used
to drive cycle progression and method optimisation.
• Methodologies for Development/lab Scale
near infra-red & Raman spectroscopy (De Beer et al J Pharm Sci 2009,98;3430) to
model drying within analytical equipment and to assess stabilization ( Hedoux et
al J Pharm Sci 2013,102;2484-94)
Design Space
Sub
limat
ion
Rat
e (d
m/d
t)
• A target sublimation rate can be achieved by two independently controlled variables:
(i) Chamber pressure (shown on the x axis)
(ii) Shelf temperature (shown as a floating variable)
Chang & Fisher 1995
The dotted line is the minimum acceptable drying rate
Shelf Tem
peratu
re (Ts )
Chamber Pressure (Pc) 50 – 300 mTorr
Primary Drying Modelling : Heat and Mass Transfer
Dry layer resistance Rp
Thickness of Ice Layer Di
Stopper resistance Rs
Chamber pressure (Pc)
Tp & Pi
Internal cross sectional area of one vial (Av)
ΔT = Tb - Tp
Shelf Ts
)TT(KAt/q psvvdd
ps
civddR
)PP(At/m
02.24T/145Pln pi
t/mHt/q s dddd
Design Space
• Lower chamber pressures (Pc) increases the driving force for sublimation
dm/dt ∝ (Pi - Pc)
• Effect seen for a constant ice vapour pressure, P i
• i.e. A constant product temperature (Tp)
• Linear increase in rate with decreasing chamber pressure
Product temperature (Tp)
-35 °
Sub
limat
ion
Rat
e (d
m/d
t)
dm/dt ∝ (Pi - Pc)
Chamber Pressure (Pc) 50 – 300 mTorr
• Increases sublimation rates requires greater rate of heating (dq/dt),
dm/dt =
H i dq/dt
• which, for a constant product temperature,
can only come from increasing the shelf temperature (Ts)
dq/dt = AvKv (Ts−Tp)
Design Space
20°
Product temperature (Tp)
10°
-10°
0°
Shelf Tem
peratu
re (Ts )
-35 °
Sub
limat
ion
Rat
e (d
m/d
t)
dm/dt = Hi dq/dt dq/dt = AvKA (Ts−Tp)
Chamber Pressure (Pc) 50 – 300 mTorr
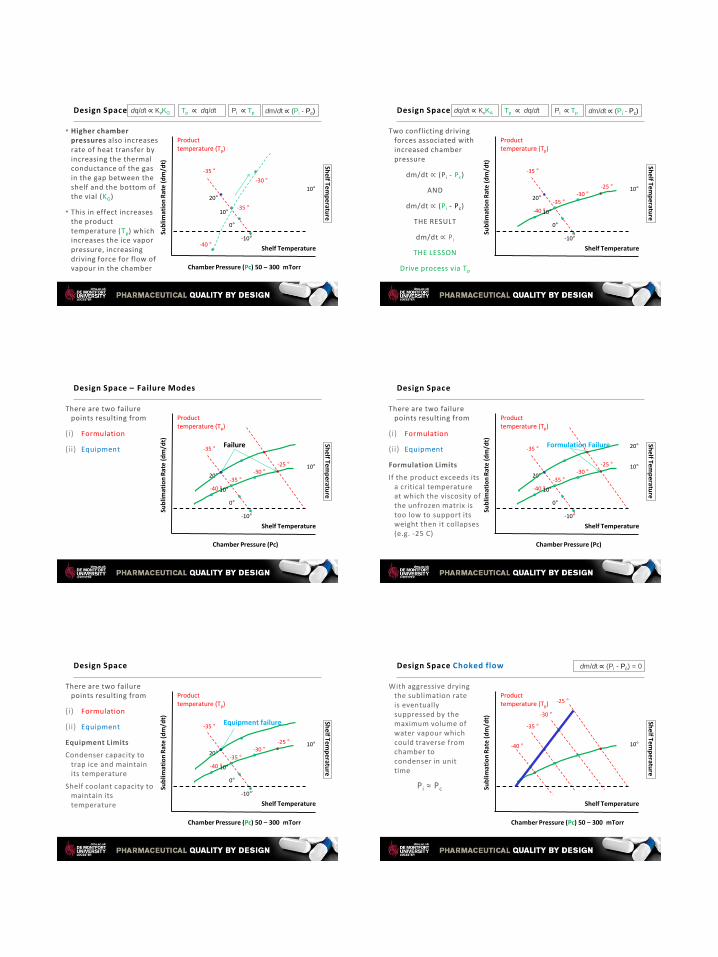
Design Space
• Higher chamber pressures also increases rate of heat transfer by increasing the thermal conductance of the gas in the gap between the shelf and the bottom of the vial (KG)
• This in effect increases the product temperature (Tp) which increases the ice vapor pressure, increasing driving force for flow of vapour in the chamber
-40 °
-35 °
-30 °
Shelf Temperature
10°
Shelf Tem
peratu
re
-35 °
Product temperature (Tp)
Sub
limat
ion
Rat
e (d
m/d
t)
dq/dt ∝ KvKG
20°
10°
-10°
0°
Pi ∝ Tp Tp ∝ dq/dt dm/dt ∝ (Pi - Pc)
Chamber Pressure (Pc) 50 – 300 mTorr
Design Space
Two conflicting driving forces associated with increased chamber pressure
dm/dt ∝ (P i - Pc)
AND
dm/dt ∝ (P i - Pc)
THE RESULT
dm/dt ∝ P i
THE LESSON
Drive process via Tp
-40 °
-35 °
-30 ° -25 °
Shelf Temperature
10°
Shelf Tem
peratu
re
-35 °
Product temperature (Tp)
Sub
limat
ion
Rat
e (d
m/d
t)
dq/dt ∝ KvKA
20°
10°
-10°
0°
Pi ∝ Tp Tp ∝ dq/dt dm/dt ∝ (Pi - Pc)
Design Space – Failure Modes
There are two failure points resulting from
(i) Formulation
(ii) Equipment
-40 °
-35 °
-30 ° -25 °
Shelf Temperature
10°
Shelf Tem
peratu
re
-35 °
Product temperature (Tp)
Sub
limat
ion
Rat
e (d
m/d
t)
Chamber Pressure (Pc)
20°
10°
-10°
0°
Failure
Design Space
There are two failure points resulting from
(i) Formulation
(ii) Equipment
Formulation Limits
If the product exceeds its a critical temperature at which the viscosity of the unfrozen matrix is too low to support its weight then it collapses (e.g. -25 C)
-40 °
-35 °
-30 ° -25 °
Shelf Temperature
10°
Shelf Tem
peratu
re
-35 °
Product temperature (Tp)
Sub
limat
ion
Rat
e (d
m/d
t)
Chamber Pressure (Pc)
20°
10°
-10°
0°
Formulation Failure 20°
Design Space
There are two failure points resulting from
(i) Formulation
(ii) Equipment
Equipment Limits
Condenser capacity to trap ice and maintain its temperature
Shelf coolant capacity to maintain its temperature
-40 °
-35 °
-30 ° -25 °
Shelf Temperature
10°
Shelf Tem
peratu
re
-35 °
Product temperature (Tp)
Sub
limat
ion
Rat
e (d
m/d
t)
20°
10°
-10°
0°
Equipment failure
Chamber Pressure (Pc) 50 – 300 mTorr
Design Space Choked flow
With aggressive drying the sublimation rate is eventually suppressed by the maximum volume of water vapour which could traverse from chamber to condenser in unit time
Pi ≈ Pc
Shelf Temperature
10°
Shelf Tem
peratu
re
-35 °
Product temperature (Tp)
Sub
limat
ion
Rat
e (d
m/d
t)
-40 °
-30 °
-25 °
dm/dt ∝ (Pi - Pc) = 0
Chamber Pressure (Pc) 50 – 300 mTorr

Design Space Choked flow
Similar effects have been observed with the physical spacing of the shelves in a stack can also pose a resistance to the increasing sublimative flow,
with pockets of greater chamber pressure building up between narrowly separated shelves and limiting the effective drying rate.
Shelf Temperature
10°
Shelf Tem
peratu
re
-35 °
Product temperature (Tp)
Sub
limat
ion
Rat
e (d
m/d
t)
-40 °
-30 °
-25 °
dm/dt ∝ (Pi - Pc) = 0
Chamber Pressure (Pc) 50 – 300 mTorr
Design Space
-40 °
-35 °
-30 ° -25 °
Shelf Temperature
30°
20°
0°
-10°
10° -20 °
Shelf Tem
peratu
re
-40 °
-30 °
-25 ° -20 °
-35 °
-40 ° -30 ° -25 °
-35 °
Product temperature (Tp)
Chamber Pressure (Pc) 50 – 300 mTorr
Sub
limat
ion
Rat
e (d
m/d
t)
Complete the DoE!!
Using a range of chamber pressures and shelf temperatures to establish the limits of the equipment
The design space is shown by the yellow triangle
Operate at the apex of the triangle to drive process efficiencies
Measure pressure rise
P(t)
Calculate Product temperature at
sublimation front
Tp
Set Shelf Temperature
Ts
Calculate Mass transport
dm/dt
Calculate Mass transport
dq/dt
Calculate Thermal coefficient
of vial
kv
Calculate Product temperature at
base of line
Tb
∆T = Tb – Tp = [24.7 Lice(P0 − Pc) /(Rp + Rs) − 0.0102Lice(Ts − Tp)]/1 −
0.0102Dice
psciv RPPA
dtdm
/
/
Limitations Smart freeze drying
a minimum product surface area of greater
than 300 cm2 or ¾ of the sample
tray
relatively leak-free
drier
aqueous solvent
solids content 3-
15%
No. Of vials > 1/3 of the
capacity
single chamber freeze-driers
30-60 min rest interval
(vacuum recovery)
• The fpeak showed a good correlation
with the product temperature during
product cooling (A), freezing (B) and
thawing (C)
• Provided there is no change in
phase, then a linear correlation
exists between Log F and
temperature (A, C-D)
• Use LyoDEA response to drive the
process
Product Characterization : phase behaviour, temperature
y = 0.0128x + 4.3756 R² = 0.9886
y = 0.04x + 4.1536 R² = 0.9951
2.5
3
3.5
4
4.5
5
5.5
6
-40 -30 -20 -10 0 10 20 30
Log
Fpe
ak/H
z
Temperature /°C
A
B
C
-0.16
-0.12
-0.08
-0.04
0.00
2 4 6
C″/
pF
log Frequency
17 C
13 C
10 C
7 C
3 C
-2 C
-7 C
Lactose 3%
• In some cases the maximum in the derivative corresponds to the point at which the ice front has receded to 50% of the height of the product (in the case of lactose)
3 5 7 9
0.0
0.5
1.0
3 5 7 9
-0.1
0.0
Distance Fraction
dCpeak/dt
V…

Sucrose 3%
• In other case the maximum in the derivative corresponds to the point at which the external ice front has receded to 100% of the height of the product (in the case of sucrose
• Can these observation be used to indicate/inform the user about the flatness of the drying front?
• In all case the approach of the derivative to a value of zero indicates the end of the primary drying process.
0.0
0.5
1.0
3 5 7 9 11 13
-0.04
-0.03
-0.02
-0.01
0.00
Distance fraction from ice
front
Time in Hours
dC/dt
• Impedance measurement data from sucrose 2.5% w/v were analysed for
the determination of primary drying end point.
• Time slice of the imaginary capacitance at 1kHz showed a sharp decline
as the ice sublimation was complete.
End Point Determination
Results: Defining the End of Primary Drying
-6
-5
-4
-3
20 22 24 26 28 30
-Lo
g d
C'K
Hz/
dt
Time h
a
-6
-5
-4
-3
20 22 24 26 28 30
Log
dC
″1K
Hz/
dt
Time/h
b
-50
-40
-30
-20
20 22 24 26 28 30
Tem
per
atu
re /
°C
Time h
Product temperature c
LyoDEA offers a non invasive measurement of primary drying time which is in good agreement with the thermocouple.
Shelf temperature distribution: Spatial mapping
5
3
• The temperature variation measurement during freezing stage.
• Thermocouple measurements of vials filled with oil.
• Gray scale shows minimum-maximum during freezing.
• ΔT ~ 1-2 °C across shelf can affect ice formation (already stochastic) and impact drying time
• 1 °C increase in 1° drying T can shorten drying time by ~13%
• Ice crystallization rates can impact the amount of ice and the particle size
Leading to variations in:
1. drying rates (because of the impact on the resistance to vapour flow, Rp)
2. concentration on solutes in the unfrozen fraction, which impacts Tg which impacts the primary drying temperature.
Impact of Spatial Temperature Map on Ice Formation
5
4
F Rate Ice Crystal Size
Rp Unfrozen fraction
Fast Small High High
Slow Large Low Low
Fast
Slow
LyoDEA Spatial mapping: Primary drying times
-50
-40
-30
-20
-10
0
10
20
30
-7
-6
-5
-4
-3
-2
-1
20 25 30 35 40
Tem
pe
ratu
re °C
dC
″ 1
Hz/
dt
Time h
Lactose 10%
1. Primary drying time distribution across the shelf identifies three distinct spatial regions characteristic of thermal variations in the shelf.
2. Edge effects – may extend across three vials around the periphery of the shelf
3 1 2
1
1
1
2
3
2
1
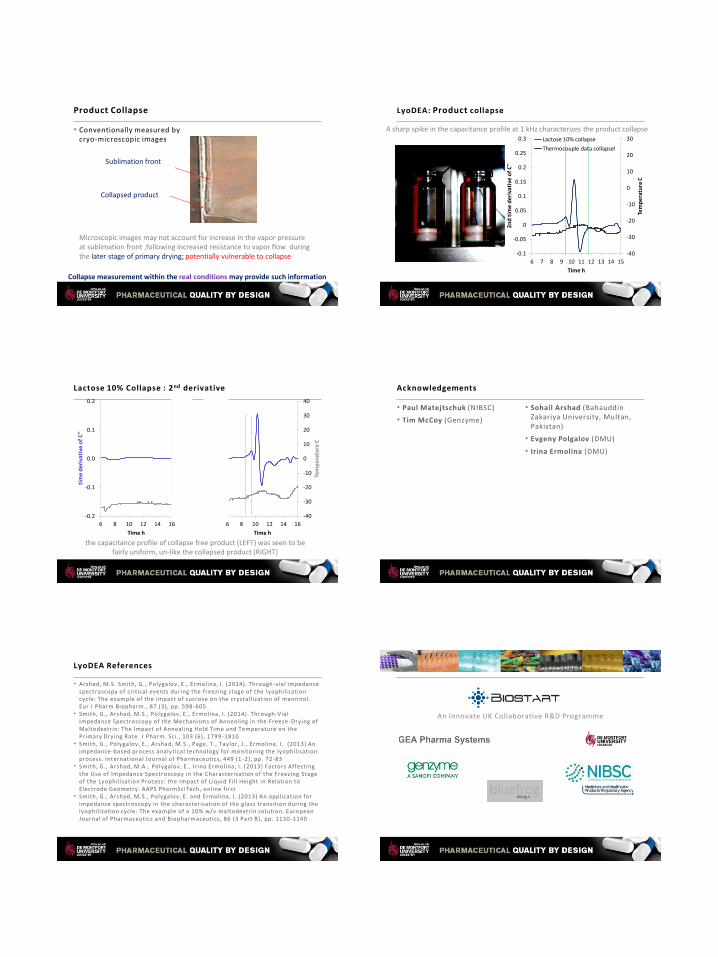
• Conventionally measured by cryo-microscopic images
Product Collapse
Sample lactose 10% w/v
Sublimation front
Collapsed product
Microscopic images may not account for increase in the vapor pressure at sublimation front ,following increased resistance to vapor flow during the later stage of primary drying; potentially vulnerable to collapse
Collapse measurement within the real conditions may provide such information
LyoDEA: Product collapse
A sharp spike in the capacitance profile at 1 kHz characterizes the product collapse
-40
-30
-20
-10
0
10
20
30
-0.1
-0.05
0
0.05
0.1
0.15
0.2
0.25
0.3
6 7 8 9 10 11 12 13 14 15
Tem
pe
ratu
re C
2n
d t
ime
de
riva
tive
of
C''
Time h
Lactose 10% collapse
Thermocouple data collapsel
Lactose 10% Collapse : 2nd derivative
-40
-30
-20
-10
0
10
20
30
40
-0.2
-0.1
0.0
0.1
0.2
6 8 10 12 14 16
Tem
pe
ratu
re C
2n
d t
ime
de
riva
tive
of
C''
Time h
-40
-30
-20
-10
0
10
20
30
40
-0.2
-0.1
0.0
0.1
0.2
6 8 10 12 14 16
Tem
pe
ratu
re C
tim
e d
eri
vati
ve o
f C
''
Time h
the capacitance profile of collapse free product (LEFT) was seen to be fairly uniform, un-like the collapsed product (RIGHT)
• Paul Matejtschuk (NIBSC)
• Tim McCoy (Genzyme)
• Sohail Arshad (Bahauddin Zakariya University, Multan, Pakistan)
• Evgeny Polgalov (DMU)
• Irina Ermolina (DMU)
Acknowledgements
• Arshad, M.S. Smith, G., Polygalov, E., Ermolina, I . (2014). Through-vial impedance spectroscopy of critical events during the freezing stage of the lyophilization cycle: The example of the impact of sucrose on the crystall ization of mannitol. Eur J Pharm Biopharm., 87 (3), pp. 598-605
• Smith, G., Arshad, M.S., Polygalov, E., Ermolina, I . (2014). Through-Vial Impedance Spectroscopy of the Mechanisms of Annealing in the Freeze -Drying of Maltodextrin: The Impact of Annealing Hold Time and Temperature on the Primary Drying Rate. J Pharm. Sci., 103 (6), 1799 -1810
• Smith, G., Polygalov, E., Arshad, M.S., Page, T., Taylor, J. , Ermolina, I . (2013) An impedance-based process analytical technology for monitoring the lyophilisation process. International Journal of Pharmaceutics, 449 (1 -2), pp. 72-83
• Smith, G., Arshad, M.A., Polygalov, E., Ir ina Ermolina, I . (2013) Factors Affecting the Use of Impedance Spectroscopy in the Characterisation of the Freezing Stage of the Lyophilisation Process: the Impact of Liquid Fil l Height in Relation to Electrode Geometry. AAPS PharmSciTech, online first
• Smith, G., Arshad, M.S., Polygalov, E. and Ermolina, I . (2013) An application for impedance spectroscopy in the characterisation of the glass transition during the lyophilization cycle: The example of a 10% w/v maltodextrin solution. European Journal of Pharmaceutics and Biopharmaceutics, 86 (3 Part B), pp. 1130-1140
LyoDEA References
An Innovate UK Collaborative R&D Programme