Embed Size (px)
Citation preview
A fishery-independent assessment of anoverfished rockfish stock, cowcod (Sebasteslevis), using direct observations from an occupiedsubmersible
Mary M. Yoklavich, Milton S. Love, and Karin A. Forney
Abstract: A meaningful assessment of cowcod (Sebastes levis) has been conducted using visual, nonextractive, habitat-specific methods. Following the precipitous decline of rockfish (Sebastes spp.) stocks along the Pacific coast, it wasevident that more effective methods were needed to assess several species in untrawlable habitats. Cowcod weresurveyed within large Cowcod Conservation Areas (CCAs) off southern California using direct observations from theresearch submersible Delta over eight major offshore rocky banks in depths of 74 to 322 m. Maps of seafloor substra-tum and bathymetry were used to identify and quantify these areas. A line-transect analysis of fish counts, perpendicu-lar distances of fish from the track line, lengths of survey tracks, and area of each rocky bank was used to estimateabundance. Biomass, calculated from abundance, fish length, and a weight–length relationship, varied with mean sizeof cowcod on these banks. These fishery-independent results have contributed to the recent assessment of cowcod bythe Pacific Fishery Management Council. A time series of results from visual surveys is now necessary to evaluate atrend in cowcod biomass with respect to increased time of protection within the CCAs.
Résumé : Nous avons fait une évaluation significative du sébaste Sebastes levis (« cowcod ») en utilisant des méthodesvisuelles qui ne nécessitent pas de retraits et qui sont spécifiques à l’habitat. Après le déclin rapide des stocks de sé-bastes (Sebastes spp.) le long de la côte du Pacifique, il est devenu évident qu’il fallait des méthodes plus efficacespour évaluer plusieurs des espèces dans les habitats dans lesquels on ne peut utiliser de chalut. Nous avons inventoriéles S. levis dans de grandes aires de conservation de S. levis (« Cowcod Conservation Areas », CCA) au large du sudde la Californie au moyen d’observations directes faites du submersible de recherche Delta sur huit bancs rocheux dularge à des profondeurs de 74–322 m. Des cartes du substrat du fond de la mer et la bathymétrie ont servi à identifieret à quantifier ces zones. Nous avons estimé l’abondance à partir de l’analyse des dénombrements de poissons sur destransects linéaires, des distances perpendiculaires des poissons à partir d’un tracé linéaire, des longueurs des tracésd’échantillonnage et de la surface de chaque banc rocheux. La biomasse, calculée à partir de l’abondance, de la lon-gueur des poissons et d’une relation masse–longueur, varie en fonction de la taille moyenne des S. levis sur ces bancs.Ces résultats obtenus indépendamment de la pêche ont contribué à l’évaluation faite récemment de S. levis par le Paci-fic Fishery Management Council. Il faudra maintenant établir une série chronologique de résultats provenant des inven-taires visuels afin d’évaluer la tendance de la biomasse des S. levis en fonction de la durée croissante de la protectiondans les CCA.
[Traduit par la Rédaction] Yoklavich et al. 1804
Introduction
Survey data of adult groundfishes off the US west coast re-cently have been called into question because of ineffectivemethods used to assess several species in heterogeneous high-relief habitats (e.g., US General Accounting Office (GAO)2004). In these habitats, sedentary rockfishes (Sebastes spp.)in particular are difficult or impossible to appraise accurately
with such conventional survey methods as bottom-trawl gear.This is because this gear is virtually excluded from irregularrock habitats (Zimmermann 2003) where many rockfish spe-cies are most abundant (Stein et al. 1992; Love andYoklavich 2006). Consequently, alternative survey techniquesusing visual observations are being developed to accuratelyassess the abundance and, in some cases, the recovery of suchspecies (O’Connell and Carlile 1993; Jagielo et al. 2003).
Can. J. Fish. Aquat. Sci. 64: 1795–1804 (2007) doi:10.1139/F07-145 © 2007 NRC Canada
1795
Received 26 December 2006. Accepted 9 October 2007. Published on the NRC Research Press Web site at cjfas.nrc.ca on 27 November 2007.J19731
M.M. Yoklavich.1 Fisheries Ecology Division, Southwest Fisheries Science Center, National Marine Fisheries Service,110 Shaffer Road, Santa Cruz, CA 95060, USA.M.S. Love. Marine Science Institute, University of California, Santa Barbara, CA 93106, USA.K.A. Forney. Protected Resources Division, Southwest Fisheries Science Center, National Marine Fisheries Service,110 Shaffer Road, Santa Cruz, CA 95060, USA.
1Corresponding author (e-mail: [email protected]).
Along with six other species of rockfishes on the westcoast, cowcod (Sebastes levis; Fig. 1) has been declaredoverfished by NOAA’s National Marine Fisheries Service(NMFS). Harvested both commercially and recreationallyfor decades off central and southern California, this seden-tary species presently is estimated to be at about 7% of itsunfished biomass, and it will likely take close to 90 years torebuild the population to 40% of historic levels (Butler et al.
2003). Based on fishing records and larval fish surveys,cowcod historically have been most abundant in high-reliefrock habitats around some of the islands and on offshorebanks of the Southern California Bight (Moser et al. 2000;Butler et al. 2003). In an unprecedented effort to protectcowcod from incidental harvest in some of these key areas,two Cowcod Conservation Areas (CCAs) were establishedby the Pacific Fishery Management Council (PFMC) in 2001.
© 2007 NRC Canada
1796 Can. J. Fish. Aquat. Sci. Vol. 64, 2007
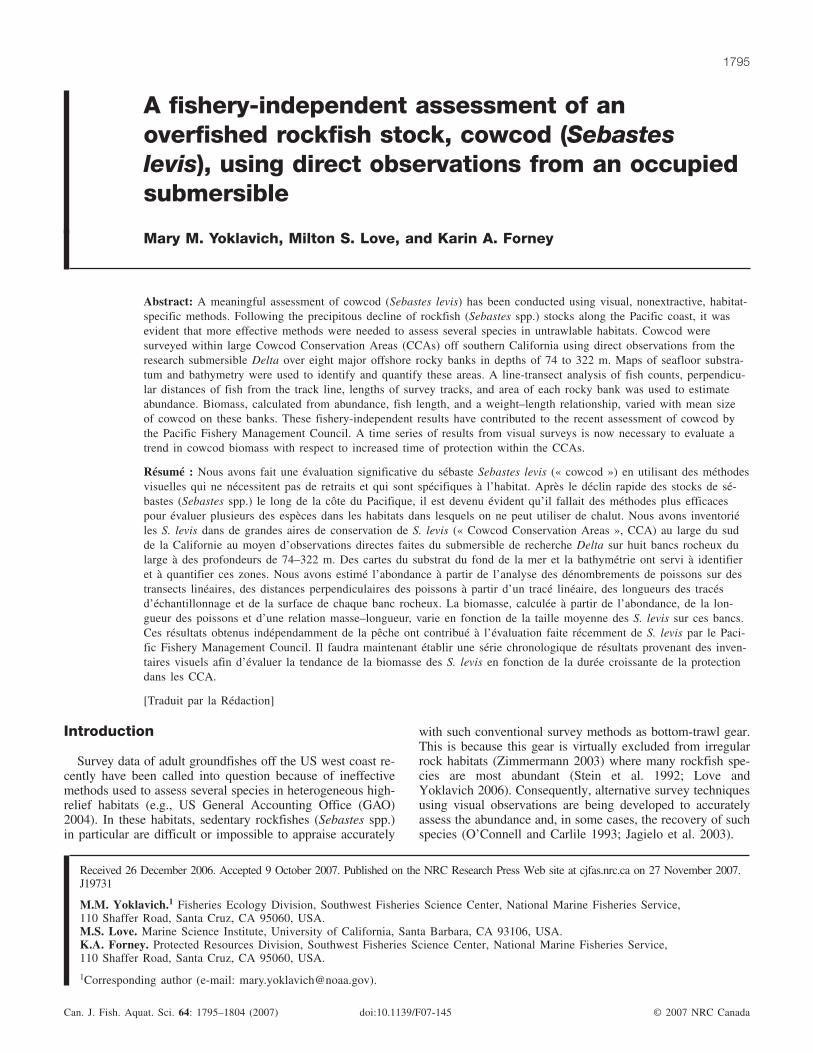
Fig. 1. (a) Adult cowcod (Sebastes levis) in rocky habitat (photograph by J. Bright), and (b) subadult cowcod inside a sponge (photo-graph by M. McCrea) in 190–200 m water depth off southern California.
The CCAs encompass 14 750 km2 (4300 nm2) where fishingfor all groundfishes is prohibited year-round in water depthsgreater than about 36 m. It is notable that these closed areasalso protect at least 50 other species of rockfishes, in addi-tion to cowcod.
Survey data for juvenile and adult cowcod, and indeed formost groundfish species, historically have been sparse offsouthern California, and there have been no comprehensivefishery-independent surveys of demersal stages of cowcod inthis area. The goal of our study was to effectively surveycowcod by making direct visual counts along quantifiabletrack lines inside the CCAs. Our objectives were to collectbank-specific data on abundance, size, and biomass ofcowcod living in mixed sediment and rock substrata and toevaluate our submersible line-transect method for the assess-ment of cowcod.
Materials and methodsWe surveyed demersal juvenile and adult cowcod from
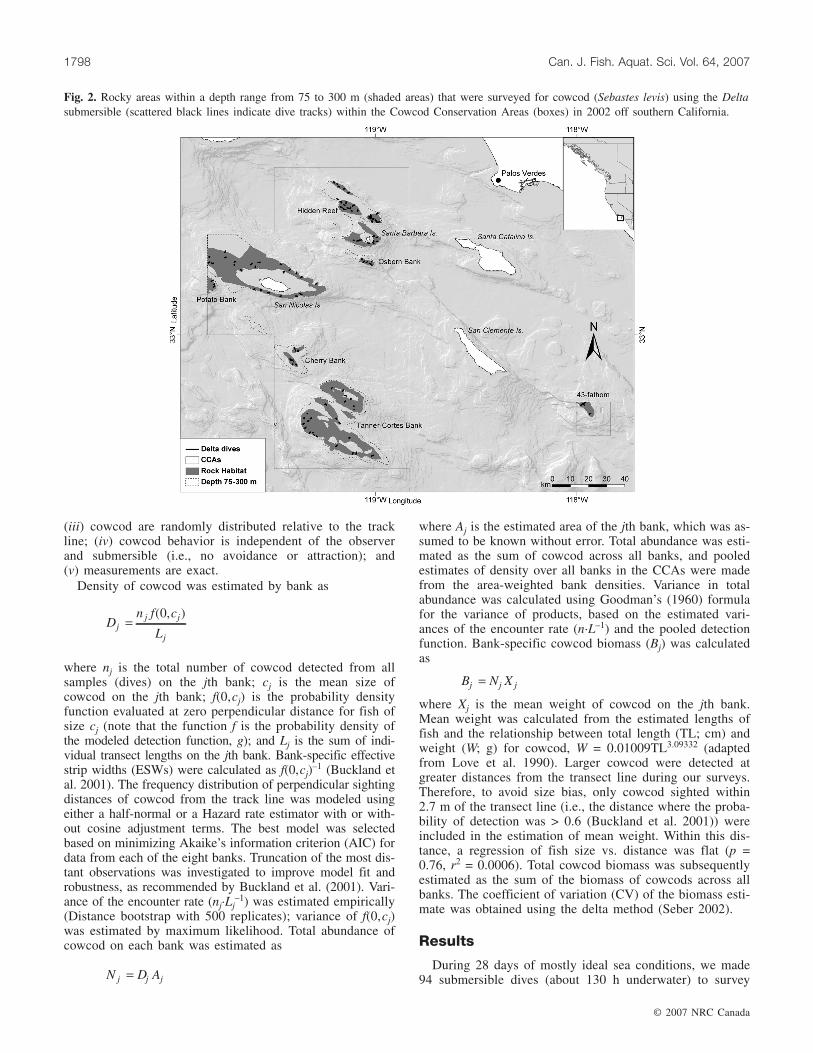
8 October to 4 November 2002 using a one-sided line-transect method (Buckland et al. 2001) and direct visualobservations made during dives in an occupied research sub-mersible (Delta). The Delta (length = 4.8 m long) accommo-dates one scientific observer and one pilot and has amaximum operating depth of 365 m and a cruising speed of1.5 knots. Our surveys were conducted over eight major off-shore rocky banks inside the two newly established CCAsoff southern California (Fig. 2). All of these banks are long-time recreational and commercial fishing sites (Butler et al.2003).
An individual dive was considered the sample unit for thissurvey. During a dive, we tried to maintain a constant dis-tance within 1 m of the seafloor and a constant speed be-tween 0.5 and 1.0 knots, depending on substratum type (i.e.,generally slower speed in complex habitats). Target durationof each dive was 60 min, although the last dive of a day wasoccasionally cut short if the submersible depleted its powersource. Dives were made during daytime and documentedwith three video cameras. An externally mounted high-8color video camera was positioned above the middle port-hole on the starboard side of the submersible. The scientificobserver conducted the survey through this same porthole,verbally recording onto the videotape the incidence of cow-cod along the track line of each dive. The observer also esti-mated the size (total length in centimetres) of each cowcodand its perpendicular distance (in feet, later converted tometres (1 foot = 0.3048 m)) from the track line. Horizontalvisibility was very good (9–18 m) throughout the survey.Two parallel lasers were installed at 20 cm apart on eitherside of the external video camera; this system was used toestimate the total length of fish to the nearest 5 cm for juve-niles (<40 cm) and 10 cm for fish ≥40 cm. Perpendiculardistances to cowcod from the track line were estimated byobservers, who trained their eyes using a handheld sonar gunaimed at objects (e.g., either large fish or nearby boulders)when they were perpendicular to the submersible.
A second color video camera was positioned inside thesubmersible in front of the lower port on the starboard sideduring most dives to record fishes in the area closest to thesubmersible (i.e., monitoring the line at zero perpendicular
distance). Additionally, a monochrome, low-light videocamera was externally mounted facing forward of the surveyto document potential movement (avoidance or attraction) ofcowcod prior to detection by observer in the submersible.
We restricted our survey to mixed sediment and rock sub-strata (i.e., rock outcrops, boulders, and cobbles interspersedwith sand or mud sediments) within a nominal depth rangeof 75–300 m. These criteria represented likely cowcod habi-tats (Yoklavich et al. 2000; Johnson et al. 2001). Digital,georeferenced maps of seafloor substratum types (on a spa-tial scale of 10s of metres to kilometres), interpreted fromside-scan sonar, multibeam bathymetry, seismic reflection,and other geophysical surveys (Greene et al. 2003), andbathymetric data in 5-m intervals (P. Serpa, California De-partment of Fish and Game, 20 Lower Ragsdale Drive, Suite100, Monterey, CA 93940, USA, personal communication)were used to identify and quantify the sites meeting thesecriteria. Additionally, catch and effort records of cowcodfrom onboard creel censuses of commercial passenger fish-ing vessels conducted by CDFG in 1975–1978 and 1986–1989 were used to assist in locating appropriate survey sites(M.S. Love and M.M. Yoklavich, unpublished data). Wewere able to focus our survey on the eight banks (i.e., 9%(1330 km2) of the total area inside the CCAs) that repre-sented essentially all available cowcod habitat (Fig. 2).
Each of these eight banks was gridded into 1.5 km ×1.5 km cells, based on likely distance to be covered during adive. Cells were then randomly selected to locate dives. Thedirection of each dive was selected haphazardly, keeping ter-rain on the starboard side and gradually trending upslope (ifthere was a slope) during the duration of the dive. Duringeach dive, the Delta submersible was tracked using an ORETrackpoint II plus (ORE Offshore, West Wareham, Massa-chusetts) ultra-short baseline (USBL) acoustic system, dif-ferential GPS, and WINFROG software (vers. 3.1; FUGRO,San Diego, California); the position of the submersible wascollected every 30 s throughout each dive. The positioningsystem was linked to an ArcView® GIS (vers. 3.2; ESRICorp., Redlands, California), and a scientific navigatoraboard the support vessel tracked the submersible in realtime relative to depth and gridded seafloor habitat maps. Thenavigator directed the submersible’s course via two-way ra-dio communication with the pilot, keeping the submersiblewithin the designated grid cell and habitat. The pilot and sci-entific observer inside the submersible did not influence thedirection of travel. The length of each dive track line wascalculated from the navigation data, after removing obviousoutliers and smoothing both the easting and northing valueswith a five-point boxcar moving average.
We used the multiple covariates distance sampling analy-sis engine in Distance 4.1 (Release 2) software (Buckland etal. 2004; Thomas et al. 2004) to calculate density and totalabundance for cowcod at each of the eight banks. Fish sizewas included as a covariate in the detection function becausecowcod vary greatly in size (5–100 cm) and larger fish canbe seen more easily at a distance. Key assumptions of theline-transect method include the following: (i) all individualson the track line are detected (i.e., the track-line detectionprobability (g(0)) = 1); (ii) a closed population during thesurvey (i.e., no immigration, emigration, births, and deaths);
© 2007 NRC Canada
Yoklavich et al. 1797
(iii) cowcod are randomly distributed relative to the trackline; (iv) cowcod behavior is independent of the observerand submersible (i.e., no avoidance or attraction); and(v) measurements are exact.
Density of cowcod was estimated by bank as
Dn f c
Lj
j j
j
=( )0,
where nj is the total number of cowcod detected from allsamples (dives) on the jth bank; cj is the mean size ofcowcod on the jth bank; f(0,cj) is the probability densityfunction evaluated at zero perpendicular distance for fish ofsize cj (note that the function f is the probability density ofthe modeled detection function, g); and Lj is the sum of indi-vidual transect lengths on the jth bank. Bank-specific effectivestrip widths (ESWs) were calculated as f(0,cj)
–1 (Buckland etal. 2001). The frequency distribution of perpendicular sightingdistances of cowcod from the track line was modeled usingeither a half-normal or a Hazard rate estimator with or with-out cosine adjustment terms. The best model was selectedbased on minimizing Akaike’s information criterion (AIC) fordata from each of the eight banks. Truncation of the most dis-tant observations was investigated to improve model fit androbustness, as recommended by Buckland et al. (2001). Vari-ance of the encounter rate (nj·Lj
–1) was estimated empirically(Distance bootstrap with 500 replicates); variance of f(0,cj)was estimated by maximum likelihood. Total abundance ofcowcod on each bank was estimated as
N D Aj j j=
where Aj is the estimated area of the jth bank, which was as-sumed to be known without error. Total abundance was esti-mated as the sum of cowcod across all banks, and pooledestimates of density over all banks in the CCAs were madefrom the area-weighted bank densities. Variance in totalabundance was calculated using Goodman’s (1960) formulafor the variance of products, based on the estimated vari-ances of the encounter rate (n·L–1) and the pooled detectionfunction. Bank-specific cowcod biomass (Bj) was calculatedas
B N Xj j j=
where Xj is the mean weight of cowcod on the jth bank.Mean weight was calculated from the estimated lengths offish and the relationship between total length (TL; cm) andweight (W; g) for cowcod, W = 0.01009TL3.09332 (adaptedfrom Love et al. 1990). Larger cowcod were detected atgreater distances from the transect line during our surveys.Therefore, to avoid size bias, only cowcod sighted within2.7 m of the transect line (i.e., the distance where the proba-bility of detection was > 0.6 (Buckland et al. 2001)) wereincluded in the estimation of mean weight. Within this dis-tance, a regression of fish size vs. distance was flat (p =0.76, r2 = 0.0006). Total cowcod biomass was subsequentlyestimated as the sum of the biomass of cowcods across allbanks. The coefficient of variation (CV) of the biomass esti-mate was obtained using the delta method (Seber 2002).
Results
During 28 days of mostly ideal sea conditions, we made94 submersible dives (about 130 h underwater) to survey
© 2007 NRC Canada
1798 Can. J. Fish. Aquat. Sci. Vol. 64, 2007
Fig. 2. Rocky areas within a depth range from 75 to 300 m (shaded areas) that were surveyed for cowcod (Sebastes levis) using the Deltasubmersible (scattered black lines indicate dive tracks) within the Cowcod Conservation Areas (boxes) in 2002 off southern California.
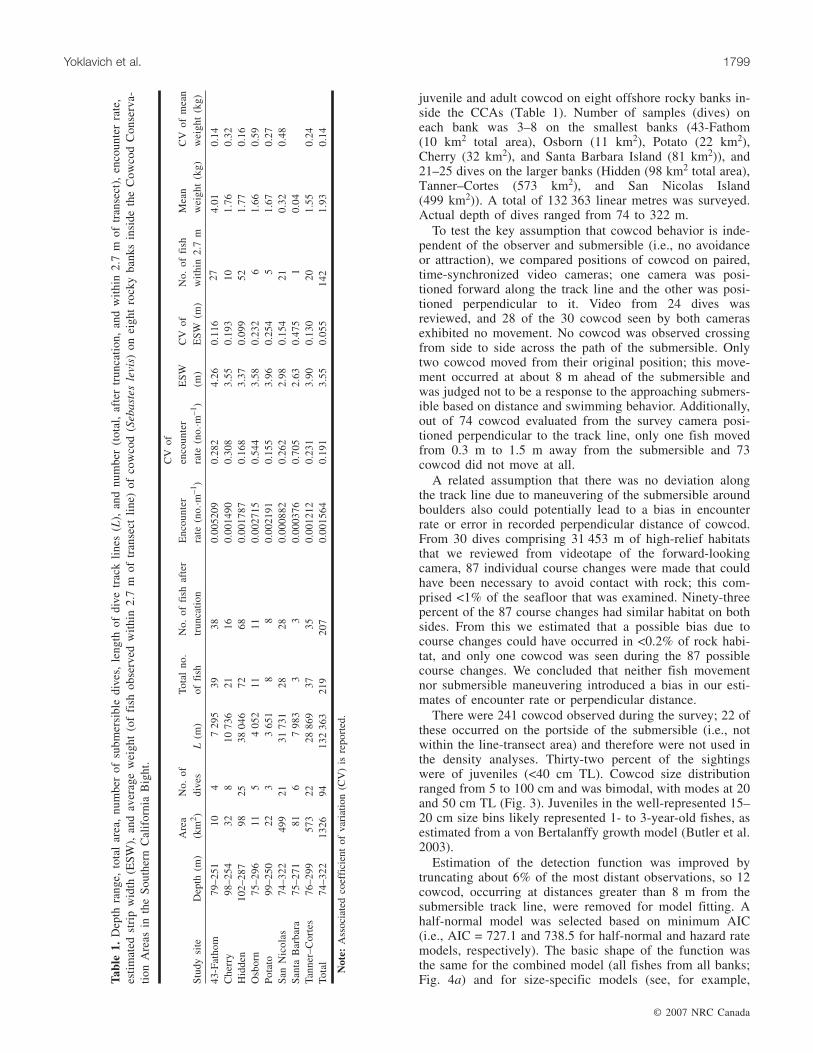
juvenile and adult cowcod on eight offshore rocky banks in-side the CCAs (Table 1). Number of samples (dives) oneach bank was 3–8 on the smallest banks (43-Fathom(10 km2 total area), Osborn (11 km2), Potato (22 km2),Cherry (32 km2), and Santa Barbara Island (81 km2)), and21–25 dives on the larger banks (Hidden (98 km2 total area),Tanner–Cortes (573 km2), and San Nicolas Island(499 km2)). A total of 132 363 linear metres was surveyed.Actual depth of dives ranged from 74 to 322 m.
To test the key assumption that cowcod behavior is inde-pendent of the observer and submersible (i.e., no avoidanceor attraction), we compared positions of cowcod on paired,time-synchronized video cameras; one camera was posi-tioned forward along the track line and the other was posi-tioned perpendicular to it. Video from 24 dives wasreviewed, and 28 of the 30 cowcod seen by both camerasexhibited no movement. No cowcod was observed crossingfrom side to side across the path of the submersible. Onlytwo cowcod moved from their original position; this move-ment occurred at about 8 m ahead of the submersible andwas judged not to be a response to the approaching submers-ible based on distance and swimming behavior. Additionally,out of 74 cowcod evaluated from the survey camera posi-tioned perpendicular to the track line, only one fish movedfrom 0.3 m to 1.5 m away from the submersible and 73cowcod did not move at all.
A related assumption that there was no deviation alongthe track line due to maneuvering of the submersible aroundboulders also could potentially lead to a bias in encounterrate or error in recorded perpendicular distance of cowcod.From 30 dives comprising 31 453 m of high-relief habitatsthat we reviewed from videotape of the forward-lookingcamera, 87 individual course changes were made that couldhave been necessary to avoid contact with rock; this com-prised <1% of the seafloor that was examined. Ninety-threepercent of the 87 course changes had similar habitat on bothsides. From this we estimated that a possible bias due tocourse changes could have occurred in <0.2% of rock habi-tat, and only one cowcod was seen during the 87 possiblecourse changes. We concluded that neither fish movementnor submersible maneuvering introduced a bias in our esti-mates of encounter rate or perpendicular distance.
There were 241 cowcod observed during the survey; 22 ofthese occurred on the portside of the submersible (i.e., notwithin the line-transect area) and therefore were not used inthe density analyses. Thirty-two percent of the sightingswere of juveniles (<40 cm TL). Cowcod size distributionranged from 5 to 100 cm and was bimodal, with modes at 20and 50 cm TL (Fig. 3). Juveniles in the well-represented 15–20 cm size bins likely represented 1- to 3-year-old fishes, asestimated from a von Bertalanffy growth model (Butler et al.2003).
Estimation of the detection function was improved bytruncating about 6% of the most distant observations, so 12cowcod, occurring at distances greater than 8 m from thesubmersible track line, were removed for model fitting. Ahalf-normal model was selected based on minimum AIC(i.e., AIC = 727.1 and 738.5 for half-normal and hazard ratemodels, respectively). The basic shape of the function wasthe same for the combined model (all fishes from all banks;Fig. 4a) and for size-specific models (see, for example,
© 2007 NRC Canada
Yoklavich et al. 1799
Stu
dysi
teD
epth
(m)
Are
a(k
m2 )
No.
ofdi
ves
L(m
)To
tal
no.
offi
shN
o.of
fish
afte
rtr
unca
tion
Enc
ount
erra
te(n
o.·m
–1)
CV
ofen
coun
ter
rate
(no.
·m–1
)E
SW
(m)
CV
ofE
SW
(m)
No.
offi
shw
ithi
n2.
7m
Mea
nw
eigh
t(k
g)C
Vof
mea
nw
eigh
t(k
g)
43-F
atho
m79
–251
104
729
539
380.
0052
090.
282
4.26
0.11
627
4.01
0.14
Che
rry
98–2
5432
810
736
2116
0.00
1490
0.30
83.
550.
193
101.
760.
32H
idde
n10
2–28
798
2538
046
7268
0.00
1787
0.16
83.
370.
099
521.
770.
16O
sbor
n75
–296
115
405
211
110.
0027
150.
544
3.58
0.23
26
1.66
0.59
Pot
ato
99–2
5022
33
651
88
0.00
2191
0.15
53.
960.
254
51.
670.
27S
anN
icol
as74
–322
499
2131
731
2828
0.00
0882
0.26
22.
980.
154
210.
320.
48S
anta
Bar
bara
75–2
7181
67
983
33
0.00
0376
0.70
52.
630.
475
10.
04Ta
nner
–Cor
tes
76–2
9957
322
2886
937
350.
0012
120.
231
3.90
0.13
020
1.55
0.24
Tota
l74
–322
1326
9413
236
321
920
70.
0015
640.
191
3.55
0.05
514
21.
930.
14
Not
e:A
ssoc
iate
dco
effi
cien
tof
vari
atio
n(C
V)
isre
port
ed.
Tab
le1.
Dep
thra
nge,
tota
lar
ea,
num
ber
ofsu
bmer
sibl
edi
ves,
leng
thof
dive
trac
kli
nes
(L),
and
num
ber
(tot
al,
afte
rtr
unca
tion
,an
dw
ithi
n2.
7m
oftr
anse
ct),
enco
unte
rra
te,
esti
mat
edst
rip
wid
th(E
SW
),an
dav
erag
ew
eigh
t(o
ffi
shob
serv
edw
ithi
n2.
7m
oftr
anse
ctli
ne)
ofco
wco
d(S
ebas
tes
levi
s)on
eigh
tro
cky
bank
sin
side
the
Cow
cod
Con
serv
a-ti
onA
reas
inth
eS
outh
ern
Cal
ifor
nia
Big
ht.
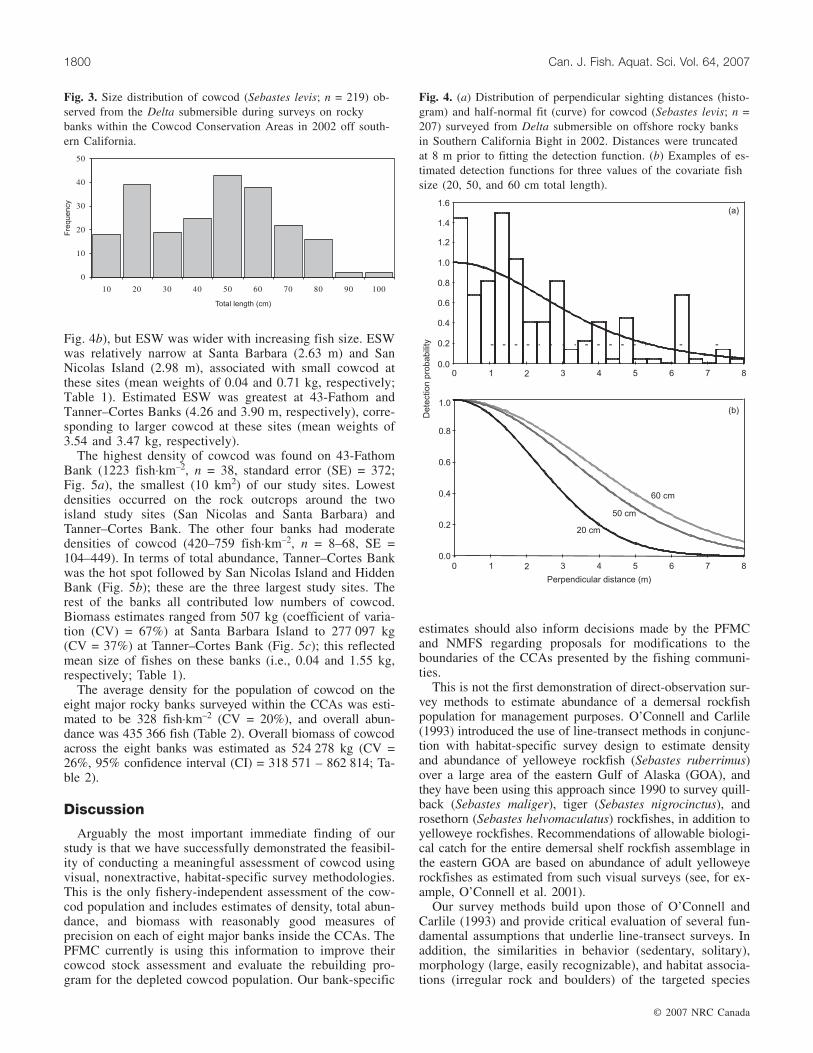
Fig. 4b), but ESW was wider with increasing fish size. ESWwas relatively narrow at Santa Barbara (2.63 m) and SanNicolas Island (2.98 m), associated with small cowcod atthese sites (mean weights of 0.04 and 0.71 kg, respectively;Table 1). Estimated ESW was greatest at 43-Fathom andTanner–Cortes Banks (4.26 and 3.90 m, respectively), corre-sponding to larger cowcod at these sites (mean weights of3.54 and 3.47 kg, respectively).
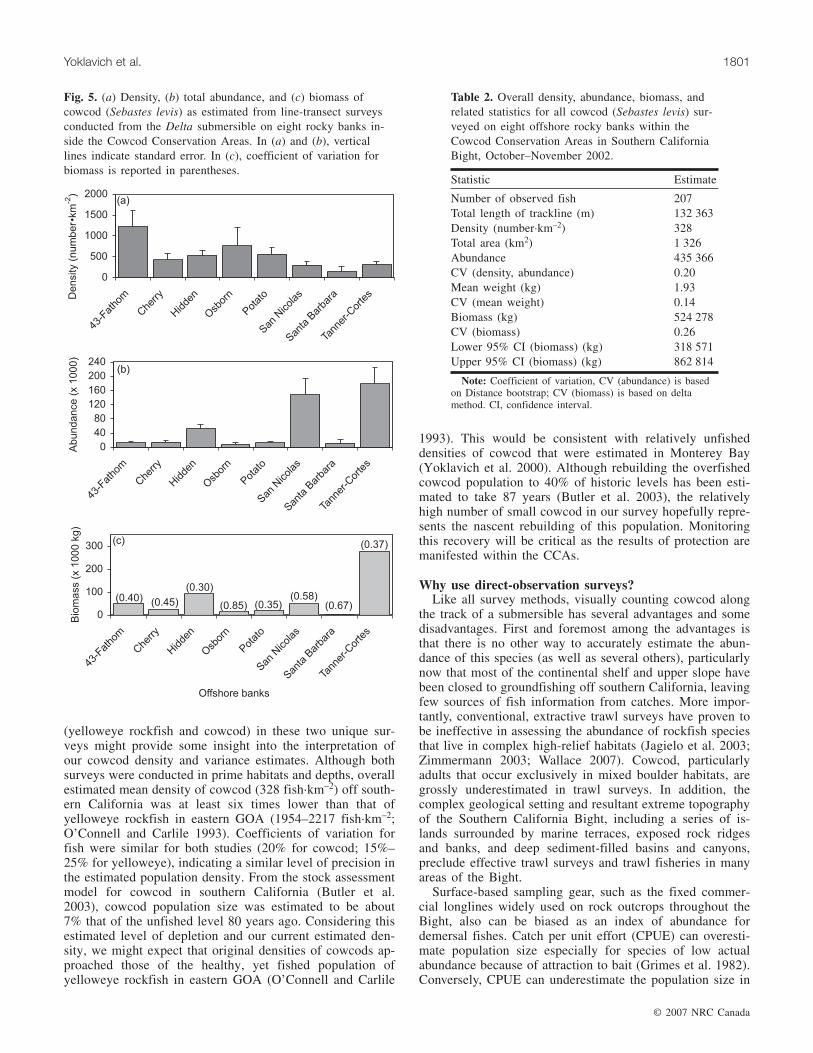
The highest density of cowcod was found on 43-FathomBank (1223 fish·km–2, n = 38, standard error (SE) = 372;Fig. 5a), the smallest (10 km2) of our study sites. Lowestdensities occurred on the rock outcrops around the twoisland study sites (San Nicolas and Santa Barbara) andTanner–Cortes Bank. The other four banks had moderatedensities of cowcod (420–759 fish·km–2, n = 8–68, SE =104–449). In terms of total abundance, Tanner–Cortes Bankwas the hot spot followed by San Nicolas Island and HiddenBank (Fig. 5b); these are the three largest study sites. Therest of the banks all contributed low numbers of cowcod.Biomass estimates ranged from 507 kg (coefficient of varia-tion (CV) = 67%) at Santa Barbara Island to 277 097 kg(CV = 37%) at Tanner–Cortes Bank (Fig. 5c); this reflectedmean size of fishes on these banks (i.e., 0.04 and 1.55 kg,respectively; Table 1).
The average density for the population of cowcod on theeight major rocky banks surveyed within the CCAs was esti-mated to be 328 fish·km–2 (CV = 20%), and overall abun-dance was 435 366 fish (Table 2). Overall biomass of cowcodacross the eight banks was estimated as 524 278 kg (CV =26%, 95% confidence interval (CI) = 318 571 – 862 814; Ta-ble 2).
Discussion
Arguably the most important immediate finding of ourstudy is that we have successfully demonstrated the feasibil-ity of conducting a meaningful assessment of cowcod usingvisual, nonextractive, habitat-specific survey methodologies.This is the only fishery-independent assessment of the cow-cod population and includes estimates of density, total abun-dance, and biomass with reasonably good measures ofprecision on each of eight major banks inside the CCAs. ThePFMC currently is using this information to improve theircowcod stock assessment and evaluate the rebuilding pro-gram for the depleted cowcod population. Our bank-specific
estimates should also inform decisions made by the PFMCand NMFS regarding proposals for modifications to theboundaries of the CCAs presented by the fishing communi-ties.
This is not the first demonstration of direct-observation sur-vey methods to estimate abundance of a demersal rockfishpopulation for management purposes. O’Connell and Carlile(1993) introduced the use of line-transect methods in conjunc-tion with habitat-specific survey design to estimate densityand abundance of yelloweye rockfish (Sebastes ruberrimus)over a large area of the eastern Gulf of Alaska (GOA), andthey have been using this approach since 1990 to survey quill-back (Sebastes maliger), tiger (Sebastes nigrocinctus), androsethorn (Sebastes helvomaculatus) rockfishes, in addition toyelloweye rockfishes. Recommendations of allowable biologi-cal catch for the entire demersal shelf rockfish assemblage inthe eastern GOA are based on abundance of adult yelloweyerockfishes as estimated from such visual surveys (see, for ex-ample, O’Connell et al. 2001).
Our survey methods build upon those of O’Connell andCarlile (1993) and provide critical evaluation of several fun-damental assumptions that underlie line-transect surveys. Inaddition, the similarities in behavior (sedentary, solitary),morphology (large, easily recognizable), and habitat associa-tions (irregular rock and boulders) of the targeted species
© 2007 NRC Canada
1800 Can. J. Fish. Aquat. Sci. Vol. 64, 2007
Fig. 3. Size distribution of cowcod (Sebastes levis; n = 219) ob-served from the Delta submersible during surveys on rockybanks within the Cowcod Conservation Areas in 2002 off south-ern California.
Fig. 4. (a) Distribution of perpendicular sighting distances (histo-gram) and half-normal fit (curve) for cowcod (Sebastes levis; n =207) surveyed from Delta submersible on offshore rocky banksin Southern California Bight in 2002. Distances were truncatedat 8 m prior to fitting the detection function. (b) Examples of es-timated detection functions for three values of the covariate fishsize (20, 50, and 60 cm total length).
(yelloweye rockfish and cowcod) in these two unique sur-veys might provide some insight into the interpretation ofour cowcod density and variance estimates. Although bothsurveys were conducted in prime habitats and depths, overallestimated mean density of cowcod (328 fish·km–2) off south-ern California was at least six times lower than that ofyelloweye rockfish in eastern GOA (1954–2217 fish·km–2;O’Connell and Carlile 1993). Coefficients of variation forfish were similar for both studies (20% for cowcod; 15%–25% for yelloweye), indicating a similar level of precision inthe estimated population density. From the stock assessmentmodel for cowcod in southern California (Butler et al.2003), cowcod population size was estimated to be about7% that of the unfished level 80 years ago. Considering thisestimated level of depletion and our current estimated den-sity, we might expect that original densities of cowcods ap-proached those of the healthy, yet fished population ofyelloweye rockfish in eastern GOA (O’Connell and Carlile
1993). This would be consistent with relatively unfisheddensities of cowcod that were estimated in Monterey Bay(Yoklavich et al. 2000). Although rebuilding the overfishedcowcod population to 40% of historic levels has been esti-mated to take 87 years (Butler et al. 2003), the relativelyhigh number of small cowcod in our survey hopefully repre-sents the nascent rebuilding of this population. Monitoringthis recovery will be critical as the results of protection aremanifested within the CCAs.
Why use direct-observation surveys?Like all survey methods, visually counting cowcod along
the track of a submersible has several advantages and somedisadvantages. First and foremost among the advantages isthat there is no other way to accurately estimate the abun-dance of this species (as well as several others), particularlynow that most of the continental shelf and upper slope havebeen closed to groundfishing off southern California, leavingfew sources of fish information from catches. More impor-tantly, conventional, extractive trawl surveys have proven tobe ineffective in assessing the abundance of rockfish speciesthat live in complex high-relief habitats (Jagielo et al. 2003;Zimmermann 2003; Wallace 2007). Cowcod, particularlyadults that occur exclusively in mixed boulder habitats, aregrossly underestimated in trawl surveys. In addition, thecomplex geological setting and resultant extreme topographyof the Southern California Bight, including a series of is-lands surrounded by marine terraces, exposed rock ridgesand banks, and deep sediment-filled basins and canyons,preclude effective trawl surveys and trawl fisheries in manyareas of the Bight.
Surface-based sampling gear, such as the fixed commer-cial longlines widely used on rock outcrops throughout theBight, also can be biased as an index of abundance fordemersal fishes. Catch per unit effort (CPUE) can overesti-mate population size especially for species of low actualabundance because of attraction to bait (Grimes et al. 1982).Conversely, CPUE can underestimate the population size in
© 2007 NRC Canada
Yoklavich et al. 1801
Fig. 5. (a) Density, (b) total abundance, and (c) biomass ofcowcod (Sebastes levis) as estimated from line-transect surveysconducted from the Delta submersible on eight rocky banks in-side the Cowcod Conservation Areas. In (a) and (b), verticallines indicate standard error. In (c), coefficient of variation forbiomass is reported in parentheses.
Statistic Estimate
Number of observed fish 207Total length of trackline (m) 132 363Density (number·km–2) 328Total area (km2) 1 326Abundance 435 366CV (density, abundance) 0.20Mean weight (kg) 1.93CV (mean weight) 0.14Biomass (kg) 524 278CV (biomass) 0.26Lower 95% CI (biomass) (kg) 318 571Upper 95% CI (biomass) (kg) 862 814
Note: Coefficient of variation, CV (abundance) is basedon Distance bootstrap; CV (biomass) is based on deltamethod. CI, confidence interval.
Table 2. Overall density, abundance, biomass, andrelated statistics for all cowcod (Sebastes levis) sur-veyed on eight offshore rocky banks within theCowcod Conservation Areas in Southern CaliforniaBight, October–November 2002.
areas of relatively high abundance because of hook satura-tion. It also is difficult to produce density estimates fromCPUEs because area swept is largely unknown in longlinesurveys. Additionally, CPUE may be especially misleadingas an index of population abundance for sedentary species,as catches can remain relatively high as fishermen moveaway from depleted areas seeking new, less exploited ones.
Hydroacoustics is a nonextractive survey method com-monly used to estimate numbers of aggregating fishes inmidwater, away from the seafloor. This method, however,has proven ineffective in identifying and accurately enumer-ating solitary rockfishes that occur on, under, or in complexrock habitats (Starr et al. 1996). Densities in strip transectssurveyed by direct observation from an occupied submers-ible were more than six times greater than those estimatedduring hydroacoustic surveys of fishes near the bottom(Starr et al. 1996).
Surveys of larval abundance also have been considered inthe estimation of biomass of some species of rockfish(Ralston et al. 2003). However, this type of fishery-independent survey is not useful in an assessment of thecowcod population because of the extremely rare occurrenceof their larvae in ichthyoplankton tows made within theCCAs off southern California (Moser et al. 2000).
Nonextractive, direct-observation techniques such as thosedescribed here are especially ideal when surveying fishes oflow abundance occurring in high-relief rock inside a marineprotected area such as the CCAs. Although extractive collec-tions can be advantageous in discerning size, age, and sex ofthe target species, they also can adversely affect the popula-tion parameters that are being estimated when species abun-dance is extremely low (e.g., cowcod). Nonextractivemethods also are required when trying to protect sensitivecomponents of habitats (e.g., structure-forming sessile inver-tebrates, such as the black coral (Antipathes dendrochristos)that is often co-located with cowcod (Tissot et al. 2006)),which can be disturbed when using some types of extractivegear to survey fish populations. Direct-observation surveysallow for habitat-specific assessments, which can result inmore accurate and precise estimates of associated fishes.These methods can be used in habitat-specific assessmentsof a number of economically and ecologically valuablesedentary benthic fish species (e.g., lingcod (Ophiodon elon-gatus), greenspotted (Sebastes chlorostictus) and green-blotched (Sebastes rosenblatti) rockfishes, and adultbocaccio (Sebastes paucispinis)).
Why use line-transect surveys?Strip transects typically have been used when quantifying
marine benthic fishes from an occupied submersible (Loveet al. 2000; Yoklavich et al. 2002; Jagielo et al. 2003). Thissampling method assumes 100% detectability of the targetspecies within the strip. To ensure that this assumption ismet, it has been necessary to use a relatively narrow stripwidth (usually 2 m) during these surveys. The result is thatmany individuals outside the strip are sighted but not in-cluded in the survey. This can be especially problematic forthose species of very low densities and can require consider-ably more samples (dives) to assess density with reasonablevariance over large areas.
Cowcod are large, sedentary, easily recognizable targetsthat also are rare and sparsely distributed in their environ-ment. Line-transect methods meet our need to maximize theefficient use of submersible time by increasing the probabil-ity of detecting the cowcod along the dive track line. Duringa line transect, the observer notes the perpendicular distancefrom the track line of each cowcod that is sighted. Ratherthan the proviso of 100% detectability within a strip of fixedwidth, the line-transect method requires 100% detectabilityon the track line (that is, at zero distance from the submers-ible), with decreasing probability of detection as distance tothe track line increases. Using the line-transect method, theeffective strip width in our survey of cowcod almost doubled(i.e., increasing from 2 m to an average of 3.5 m for strip-and line-transect methods, respectively) for the same amountof effort (number of dives).
The assumption of 100% detectability on the track line iseasily met for adult cowcod, considering their relativelylarge size and sedentary behavior, the lack of avoidance orattraction behavior relative to the submersible, and our useof a second video camera directed toward the area adjacentto the track line. In contrast, it is unlikely that 100% of thelarger juvenile cowcod (>20 cm TL) are seen on the trackline, because some individuals are likely out of view amongsmall boulders or in crevices (Love and Yoklavich 2007).The assumption of g(0) = 1 (that is, all individuals on thetrack line are detected) in this analysis is, therefore, ex-pected to result in an underestimation of the density of juve-nile cowcod by an unknown amount. Additional studies willbe required to estimate the true detection probability forjuvenile cowcod along the track line in high-relief habitats.
Several additional assumptions are required for unbiasedestimates of density and abundance during line-transect sur-veys. The short duration of both the dives and the surveyprovides little opportunity for immigration, emigration,births, and deaths of this sedentary species, satisfying theclosed-population requirement. The assumption that cowcodare distributed randomly relative to the track line was met byrandomizing the sample sites and traversing haphazardlyacross substratum types and across the depth gradient duringeach dive.
A third important assumption is that cowcod behavior isindependent of the observer and submersible (i.e., no avoid-ance or attraction). Based on over 30 years of collectiveexperience using the Delta submersible to survey fishes invarious rock habitats along the Pacific coast, there is broadconsensus that a submersible traveling at a constant andslow speed, as in the present study, creates little or no re-sponse (either avoidance or attraction) from solitary,demersal rockfishes (M.S. Love and M.M. Yoklavich, per-sonal observations; V. O’Connell, Alaska Department ofFish and Game, 304 Lake Street, Room 103, Sitka, AK99835, USA, personal communication). In our study, a third,forward-looking external video camera was positioned onthe front of the submersible primarily to document variousspecies of rockfishes occurring in midwater above the sub-mersible. There was no indication of movement of cowcodas the submersible approached on any of the three videocameras, which led to our conclusion that there was no biasintroduced by the survey method.
© 2007 NRC Canada
1802 Can. J. Fish. Aquat. Sci. Vol. 64, 2007
A final assumption for unbiased estimates of density andabundance is that measurements are exact. We attempted tominimize these sources of error and evaluate their influenceon abundance estimates. In a recent, separate study, we haveestimated the error associated with underwater measure-ments of fish size, distance to fish, and length of transect.Using paired lasers and the Delta submersible, five observ-ers measured fish replicas (n = 189–230) of known totallength placed at various distances from lines set on theseafloor. We generally underestimated fish size (meandeviation = –1.1 cm, SD = 1.2) and distance to fish (meandeviation = –0.10 m, SD = 0.10) but did not consider thesesmall amounts in our estimates of abundance. Underesti-mating fish size would result in an underestimate of bio-mass, and underestimating distance to fish would result in anoverestimate of density. In future studies, we intend to de-velop observer-specific correction factors for estimates ofdistance and size.
Additional sources of potential measurement error includethe estimation of the total length of transect surveyed andthe total area of each bank. We assumed that these variableswere known without error, although some amount of errorwas likely to have existed in their estimation. From a recentcomparison between two 100 m lines set on the seafloor andthe estimated track length from Delta navigation data, tracklength was overestimated by an average of 7% (n = 23),which would result in an underestimate of fish density(M.M. Yoklavich, unpublished data).
The combination of all potential sources of error in measure-ments could result in either an upwards or downwards bias indensities and total abundance, depending on the direction of es-timation error, and variances could be underestimated. The in-clusion of these potential sources of error, however, wouldnot be expected to change the precision of the overall abun-dance and biomass estimates substantially, because thevariances in encounter rate (19.1%) and in f(0) (5.5%) con-tributed the most towards overall precision.
Our estimated abundance and survey efficiency can befurther improved by incorporating more accurate estimatesof the size of the rocky banks into future monitoring of thecowcod population inside the CCAs. We recently completeda survey of seafloor habitats in several of our study sites us-ing high-resolution multibeam bathymetry (Goldfinger et al.2005). The results of this survey provide more accurateinterpretations and spatial estimates of the types of seafloorsubstrata available as fish habitats. Preliminary Distancemodels run with and without habitat stratification (rock andnonrock substrata) for five of our eight study sites (banks)resulted in similar estimates of cowcod abundance. AIC wasthe same for stratified (484.0) and unstratified (484.4) analy-ses with 8 m truncation. From these results, we determinedthat our survey design adequately sampled the habitats (rockand sand) and depths (shallow (75–150 m), medium (151–225 m), and deep (226–300 m)) in proportion to occurrencein the study areas. Therefore the unstratified analysis wasappropriate for our study sites. This information will be use-ful in the design of an efficient monitoring plan for theCCAs.
Our survey protocols and resulting estimates of density,abundance, and biomass of the cowcod population on the
major banks inside the CCAs will serve as the foundationfor long-term monitoring of these closed areas and have al-ready been incorporated into the most recent stock assess-ment of this species (Dick et al. 2007). From these initialestimates, we can now evaluate appropriate time intervalsand the distribution and magnitude of sampling effortneeded to assess trends in the cowcod population within and,if desired, beyond the CCAs.
Acknowledgements
Field surveys were successfully conducted with assistancefrom D. Schroeder, M. Nishimoto, L. Snook, T. Laidig,T. Anderson, R. Starr, B. Lea, C. Wahle, and the dedicatedcrews of the R/V Velero and R/V Delta. M. Amend,J. Harvey, and D. Watters assisted with analyses. This re-search and manuscript were improved by thoughtful com-ments from E. Dick, T. Laidig, A. MacCall, T. O’Connell,S. Ralston, S. Sogard, D. Watters, members of the CIE review(T. Gerrodette, M. Kingsley, D. Sampson) and PFMCCowcod STAR panels, and three anonymous reviewers.Underwater photographs were provided by J. Bright andM. McCrea. Partial funding was provided by NOAA’s NMFSOffices of Habitat Conservation and Protected Resources, Na-tional Undersea Research Program, Marine Protected AreaScience Center, and the David and Lucile Packard Founda-tion.
References
Buckland, S.T., Anderson, D.R., Burnham, K.P., Laake, J.L.,Borchers, D.L., and Thomas, L. 2001. Introduction to distancesampling: estimating abundance of biological populations. Ox-ford University Press, Inc., New York.
Buckland, S.T., Anderson, D.R., Burnham, K.P., Laake, J.L.,Borchers, D.L., and Thomas, L. (Editors). 2004. Advanced dis-tance sampling. Oxford University Press, Inc., New York.
Butler, J.L., Jacobson, L.D., Barnes, J.T., and Moser, H.G. 2003.Biology and population dynamics of cowcod (Sebastes levis) inthe Southern California Bight. Fish. Bull. U.S. 101: 260–280.
Dick, E.J., Ralston, S., and Pearson, D. 2007. Status of cowcod,Sebastes levis, in the Southern California Bight. In Status of thePacific Coast Groundfish Fishery through 2007, Stock Assess-ment and Fishery Evaluation: Stock Assessments and RebuildingAnalyses. Pacific Fishery Management Council, Portland, Ore-gon. www.pcouncil.org/bb/2007/E6_STARs_SAs.html.
Goldfinger, C., Romsos, C., Chaytor, J., Yoklavich, M., Amend,M., Wakefield, W., and Huffnagle, L. 2005. Multibeam sonarsurveys and habitat mapping of the sea floor within the CowcodConservation Areas (CCA), Southern California ContinentalBorderland. Final Report. Oregon State University, College Oce-anic Atmospheric Sciences, Corvallis, Oregon.
Goodman, L.A. 1960. On the exact variance of products. J. Amer.Stat. Assoc. 55: 708–713.
Greene, H.G., Bizzarro, J.J., Erdey, D.M., Lopez, H., Murai, L.,Watt, S., and Tilden, J. 2003. Essential fish habitat characteriza-tion and mapping of California continental margin. Moss Land-ing Marine Labs, 8272 Moss Landing Road, Moss Landing, CA95039, USA. Moss Landing Marine Laboratories Technical Pub-lication Series No. 2003-01 (2 CDs).
© 2007 NRC Canada
Yoklavich et al. 1803
Grimes, C.B., Able, K.W., and Turner, S.C. 1982. Direct observationfrom a submersible vessel of commercial longlines for tilefish.Trans. Am. Fish. Soc. 111: 94–98.
Jagielo, T., Hoffmann, A., Tagart, J., and Zimmermann, M. 2003.Demersal groundfish densities in trawlable and untrawlable hab-itats off Washington: implications for the estimation of habitatbias in trawl surveys. Fish. Bull. U.S. 101: 545–565.
Johnson, K.A., Yoklavich, M.M., and Cailliet, G.M. 2001. Recruit-ment of three species of juvenile rockfish (Sebastes spp.) on softbenthic habitats in Monterey Bay, California. Calif. Coop. Ocean.Fish. Invest. Rep. 42: 153–166.
Love, M.S., and Yoklavich, M.M. 2006. Deep rock habitats. In Theecology of marine fishes, California and adjacent waters. Editedby L.G. Allen, D.J. Pondella II, and M.H. Horn. University ofCalifornia Press, Berkeley, California. pp. 252–268.
Love, M.S., and Yoklavich, M.M. 2007. Habitat characteristics ofjuvenile cowcod, Sebastes levis (Scorpaenidae), in Southern Cali-fornia. Environ. Biol. Fishes. DOI:10.1007/s10641-007-9290-x.
Love, M.S., Morris, P., McCrae, M., and Collins, R. 1990. Life his-tory aspects of 19 rockfish species (Scorpaenidae: Sebastes) fromthe Southern California Bight. US Department of Commerce,NOAA Tech. Rep. NMFS 87.
Love, M.S., Caselle, J., and Snook, L. 2000. Fish assemblagesaround seven oil platforms in the Santa Barbara Channel area.Fish. Bull. U.S. 98: 96–117.
Moser, H.G., Charter, R.L., Watson, W., Ambrose, D.A., Butler,J.L., Charter, S.R., and Sandknop, E.M. 2000. Abundance anddistribution of rockfish in the Southern California Bight in rela-tion to environmental conditions and fishery exploitation. Calif.Coop. Ocean. Fish. Invest. Rep. 41: 132–147.
O’Connell, V.M., and Carlile, D.W. 1993. Habitat-specific densityof adult yelloweye rockfish Sebastes ruberrimus in the easternGulf of Alaska. Fish. Bull. U.S. 91: 304–309.
O’Connell, V., Carlile, D., and Brylinsky, C. 2001. Demersal shelfrockfish stock assessment and fishery evaluation report for 2002.Alaska Department of Fish and Game, Division Commercial Fish-eries, Juneau, Alaska, Regional Information Report No. 1J01-35.
Ralston, S., Bence, J.R., Eldridge, M.B., and Lenarz, W.H. 2003. Anapproach to estimating rockfish biomass based on larval produc-tion, with application to Sebastes jordani. Fish. Bull. U.S. 101:129–146.
Seber, G.A.F. 2002. The estimation of animal abundance and re-lated parameters. 2nd ed. The Blackburn Press, Caldwell, NewJersey.
Starr, R.M., Fox, D.S., Hixon, M.A., Tissot, B.N., Johnson, G.E.,and Barss, W.H. 1996. Comparison of submersible and acousticestimates of fish density on a rocky bank. Fish. Bull. U.S. 94:113–123.
Stein, D.L., Tissot, B.N., Hixon, M.A., and Barss, W. 1992. Fish–habitat associations on a deep reef at the edge of the Oregoncontinental shelf. Fish. Bull. U.S. 90: 540–551.
Thomas, L., Laake, J.L., Strindberg, S., Marques, F.F.C., Buckland,S.T., Borchers, D.L., Anderson, D.R., Burnham, K.P., Hedley, S.L.,Pollard, J.H., and Bishop, J.R.B. 2004. Distance 4.1. Release 2.Research Unit for Wildlife Population Assessment, UniversitySt. Andrews, St. Andrews, UK. www.ruwpa.st-and.ac.uk/distance.
Tissot, B.N., Yoklavich, M.M., Love, M.S., York, K., and Amend,M. 2006. Benthic invertebrates that form habitat on deep banksoff southern California, with special reference to deep sea coral.Fish. Bull. U.S. 104: 167–181.
US General Accounting Office. 2004. Pacific groundfish continuedefforts needed to improve reliability of stock assessments. USGeneral Accounting Office, Washington, D.C. Report to Con-gressional Requesters, GAO-04-606.
Wallace, J.R. 2007. Update on the status of yelloweye rockfish(Sebastes ruberrimus) off the U.S. West Coast in 2007. In Statusof the Pacific coast groundfish fishery through 2007, stock as-sessment and fishery evaluation: stock assessments and rebuild-ing analyses. Pacific Fishery Management Council, Portland,Oregon. www.pcouncil.org/bb/2007/E6_STARs_SAs.html.
Yoklavich, M.M., Greene, H.G., Cailliet, G.M., Sullivan, D.E.,Lea, R.N., and Love, M.S. 2000. Habitat associations of deep-water rockfishes in a submarine canyon: an example of a naturalrefuge. Fish. Bull. U.S. 98: 625–641.
Yoklavich, M.M., Cailliet, G.M., Lea, R.N., Greene, H.G., Starr,R., deMarignac, J., and Field, J. 2002. Deepwater habitat andfish resources associated with the Big Creek Ecological Re-serve. Calif. Coop. Oceanic Fish. Invest. Rep. 43: 120–140.
Zimmermann, M. 2003. Calculation of untrawlable areas withinthe boundaries of a bottom trawl survey. Can. J. Fish. Aquat.Sci. 60: 657–669.
© 2007 NRC Canada
1804 Can. J. Fish. Aquat. Sci. Vol. 64, 2007