Embed Size (px)
Citation preview

New York City Taxes—Trends, Impact and Priorities for Reform
A Fiscal Policy Institute Report www.fiscalpolicy.org
January 13, 2015

New York City Taxes—Trends, Impact and Priorities for Reform
Acknowledgments This report reflects an engagement with New York City and State tax policy over the course of several years, and draws from numerous discussions with countless individuals. Several FPI colleagues assisted in the preparation of this report, particularly Senior Economist Brent Kramer and Senior Fellow David Dyssegaard Kallick. With his vast insights and experience on state and local tax and budget policy, Frank Mauro, now FPI’s Executive Director Emeritus, has informed this report in many ways. Research Associate Michele Mattingly provided extensive edits. Director of Administration and Development Bryan LaVigne masterfully polished the final report. Interim Executive Director Ron Deutsch provided much encouragement in the home stretch when he joined the organization. This research and report draw extensively on the numerous reports on New York taxes prepared by the expert tax policy staffs of the New York City Department of Finance, the Mayor’s Office of Management and Budget, the City Council Finance Division, and the New York State Department of Taxation and Finance. The reports of the City’s Independent Budget Office have contributed greatly to improving public understanding of the problems with the City’s real property tax system, and IBO Deputy Director George Sweeting and Supervising Analyst Michael Jacobs, in particular, provided extensive assistance with data and policy questions. Colleagues at Good Jobs New York (GJNY), the Institute on Taxation and Economic Policy (ITEP), and the Center on Budget and Policy Priorities (CBPP) have greatly aided FPI’s tax policy work for many years. Elizabeth Bird, Project Coordinator at GJNY, and Bettina Damiani, former GJNY Project Director, have provided extensive assistance with City business economic development subsidy issues. FPI thanks the Robert Sterling Clark Foundation and its Acting Executive Director Laura Wolff for providing funding for this report. Funding over several years by the New York Community Trust has been indispensable in supporting FPI’s work on City budget and economic policy issues that provides an essential context for this tax policy report. FPI also thanks the Ford and Charles Stewart Mott Foundations for their support of FPI’s state fiscal analysis work, and the many organizations, including other foundations, labor unions, faith-based organizations, human service providers and advocates, community and good government groups, and public-spirited individuals that support FPI’s work and/or disseminate the results of FPI’s analyses. James Parrott, FPI Deputy Director and Chief Economist January 2015 The Fiscal Policy Institute (www.fiscalpolicy.org) is an independent, nonpartisan, nonprofit research and education organization committed to improving public policies and private practices to better the economic and social conditions of all New Yorkers. Founded in 1991, FPI works to create a strong economy in which prosperity is broadly shared.
FPI January 13, 2015 i
New York City Taxes—Trends, Impact and Priorities for Reform
Table of Contents Executive Summary ................................................................................................................... 1
1. Introduction ..................................................................................................................... 8
2. Principles for a high-quality tax system.......................................................................... 9
3. New York City’s local taxes ......................................................................................... 12 A. Real property tax ................................................................................................... 13 B. Personal income tax .............................................................................................. 15 C. Business income taxes ........................................................................................... 16 D. Sales tax ................................................................................................................. 17 E. Real property transfer tax (RPTT) ......................................................................... 18 F. Mortgage recording tax (MRT) ............................................................................. 18 G. Commercial rent tax (CRT) ................................................................................... 18 H. Hotel room occupancy tax (Hotel Tax) ................................................................. 19
4. New York State taxes.................................................................................................... 20 A. Personal income tax .............................................................................................. 20 B. Business income taxes ........................................................................................... 22 C. Sales tax ................................................................................................................. 23
5. New York State and City tax burden relative to other states and areas ........................ 24 A. Combined New York State and local taxes, relative to other states ...................... 24 B. New York State vs. local tax burden, 1995-2012 ................................................... 26 C. Intra-New York State tax burden comparisons using a broader tax capacity measure ......................................................................................................................... 27 D. New York City compared to the largest U.S. cities using a broad tax capacity measure ......................................................................................................................... 29
6. New York City household tax burdens relative to other cities and comparative burdens by income level .................................................................................................................... 31
A. Inter-city state and local tax comparison using representative household income levels .............................................................................................................................. 31 B. Comparison across representative New York City household income levels ........ 32 C. New York State and local tax burden by income quintiles .................................... 33
7. New York City’s highly regressive overall household tax burden ............................... 35
8. Economic context and implications of New York’s high taxes .................................... 38
9. Trends in New York City taxes and tax expenditures since 1980 ................................ 42 A. Increased reliance on local taxes compared to state and federal aid ................... 42 B. Shifts since 1980 among major local taxes ........................................................... 43 C. Increase in tax exempt property value ................................................................... 44 D. Increase in 421-a tax break for new multiple dwellings ....................................... 47 E. Increase in housing and business-related tax expenditures .................................. 47 F. Increase in business tax expenditures ................................................................... 50
10. Tax policy changes since 1977 ..................................................................................... 53 A. Koch administration, 1978-1989 ........................................................................... 54 B. Dinkins administration, 1990-1993 ....................................................................... 56 C. Giuliani administration, 1994-2001 ...................................................................... 56 D. Bloomberg administration, 2002-2013 .................................................................. 59
FPI January 13, 2015 ii

New York City Taxes—Trends, Impact and Priorities for Reform
11. New York City tax reform considerations .................................................................... 66 A. Priority principles to guide tax reform .................................................................. 66 B. Property tax inequities........................................................................................... 67 C. Personal Income Tax ............................................................................................. 72 D. Taxing commuters.................................................................................................. 74 E. Taxing high-value pied-à-terre residences ............................................................ 75 F. Issues related to business income taxes ................................................................. 76 G. Re-examine business tax expenditures .................................................................. 77 H. Real estate related taxes ........................................................................................ 78 I. Establish the capacity to analyze the distribution of taxes and tax changes ......... 79
12. Conclusion .................................................................................................................... 80
APPENDIX .......................................................................................................................... 81
FPI January 13, 2015 iii

New York City Taxes—Trends, Impact and Priorities for Reform
List of Figures FIGURE 1: New York City Local Tax collections, FY 2014.................................................. 12
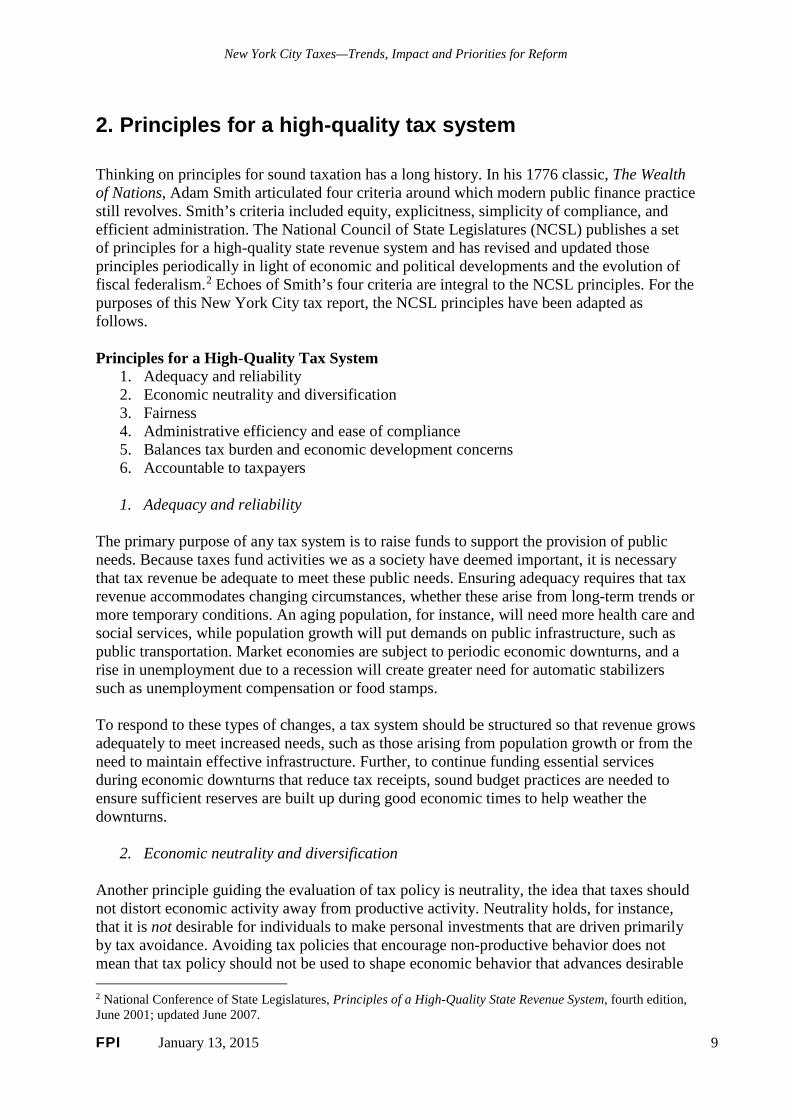
FIGURE 2: New York City local tax collections, FY 2014 .................................................... 13
FIGURE 3: New York State tax revenues by type, FY 2014 .................................................. 20
FIGURE 4: Top marginal tax rates on personal income, New York State & New York City, 1960-2014 ................................................................................................................................ 21
FIGURE 5: 10 states with greatest combined state and local burden (taxes relative to personal income), 2011 .......................................................................................................................... 25
FIGURE 6: New York State and Local Taxes per $100 of Personal Income, FY 1995, 2000, 2005, and 2012 ......................................................................................................................... 27
FIGURE 7: New York State and Local Government Tax Effort by Type of Government, 2004-2005 ................................................................................................................................ 29
FIGURE 8: NYC Tax Burdens for Representative Households at Different Income Levels Compared to Largest City in Each State, 2012 ........................................................................ 31
FIGURE 9: New York City Local Tax Burden, by Income for a Typical Four-person Household ................................................................................................................................ 32
FIGURE 10: New York State & Local Tax Burden by Income Quintiles and Top Incomes, 2015.......................................................................................................................................... 34
FIGURE 11: New York State & Local Tax Burden by Income Quintiles and Top Incomes, 2015.......................................................................................................................................... 34
FIGURE 12: NYC has a regressive local tax burden (income, sales, and property tax), with low- and middle-income households in 2011 paying a higher share of their incomes in NYC taxes than did the wealthiest 5%. ............................................................................................. 36
FIGURE 13: While the city's income tax is mildly progressive, residential property and sales taxes are regressive, resulting in the top 5% paying a smaller share of NYC taxes in 2011 than their share of all income. .................................................................................................. 37
FIGURE 14: The number of households with million dollar-plus incomes and their total incomes increased much faster between 2000 and 2011 in NYC than in the U.S. .................. 41
FIGURE 15: New York City budget: revenue sources, amounts, and shares by fiscal year ... 42
FIGURE 16: New York City major taxes: amounts and shares .............................................. 44
FIGURE 17: Rise in Private Property Tax Exemptions .......................................................... 45
FIGURE 18: Private property tax exemptions, FY 2014 ......................................................... 46
FIGURE 19: New York City Private Property Tax Exemptions ............................................. 47
FIGURE 20: Rapid growth in 421-a and Industrial and Commercial Incentive Program (ICIP) tax breaks, 1998-2014 .............................................................................................................. 48
FIGURE 21: New York City Tax Expenditures, FY 2014 ...................................................... 49
FIGURE 22: NYC Business Tax Expenditures, FY 2001 and 2014 ....................................... 51
FIGURE 23: Main areas of significant NYC tax policy changes since 1977, by mayoral administration .......................................................................................................................... 54
FPI January 13, 2015 iv

New York City Taxes—Trends, Impact and Priorities for Reform
FIGURE 24: New York City property class shares of market value and tax levy and effective tax rates, FY 2014 .................................................................................................................... 68
FIGURE 25: Net effective tax rates for selected property types, 1984 - 2007 ........................ 70
FIGURE 26: Effective tax rate dispersion by property type, FY 2013 ................................... 71
FIGURE 27: Top marginal tax rates, New York City personal income tax, 1966-2014 ......... 73
FPI January 13, 2015 v

New York City Taxes—Trends, Impact and Priorities for Reform
Executive Summary The New York City government provides services to over 8 million residents, 4 million jobs (including 900,000 held by commuters), and some of the largest corporations in the world. At $77 billion in 2014, the New York City budget is larger than that of any other locality, and larger than all state governments except those of California, Texas, Florida, and New York State. The city is overwhelmingly reliant on raising its own taxes to fund these services and has become increasingly so in recent decades. Federal and state governments have restricted their contributions to the city budget, with federal aid declining and state aid operating under sharply capped increases. As recently as 1980 city taxes financed about half (53 percent) of the city budget. Today, that share has grown to nearly two-thirds (64 percent). New York City has what may be the most diversified tax structure of any government in the United States, with a mixture of income taxes both on individuals and businesses, property and other real estate taxes, and sales tax. The mixture allows for a degree of stability through economic expansion and contraction. Taxes on income and real estate sales (property transfer and mortgage recording taxes) are highly cyclical, rising faster in a boom market and falling faster in a downturn. Balancing these, property, sales, and commercial rent taxes are more stable during downturns and account for nearly three-fifths of local taxes. This has served the city well in the context of a moderately growing economy. The city’s economic diversity and the sheer size of its economy adds resilience, helps the tax base weather cyclical ups and downs, and lessens its reliance on the fate of particular sectors or companies. New York City’s $775 billion GDP makes its economy larger than that of 45 states. Still, a high-quality tax system needs to serve multiple purposes and, given the dramatic changes in New York City’s economy since the mid-1970s fiscal crisis, there have been remarkably few improvements in the city’s tax structure over the past four decades. Building on principles first advanced by Adam Smith in The Wealth of Nations, the National Council of State Legislatures has articulated a set of six principles for a high-quality tax system, reflecting a changing political economy and evolving fiscal federalism: adequacy and reliability, economic neutrality and diversification, fairness, ease of administration and compliance, balancing tax burden and economic development concerns, and accountability to taxpayers. New York City’s tax system does well on the principles of adequacy and reliability, and on diversification, but it does not fare as well on the other criteria. Particularly worrisome in light of the pronounced polarization of income gains since the late 1970s, the city’s overall household tax structure—property, income and sales taxes—lacks fairness. It is regressive and most changes over the past two decades have made it more so. The property tax system is characterized by undue opaqueness and complexity, and its features foster inequities between renters and homeowners, and across neighborhoods. The local tax structure also does a poor job of balancing tax burden and economic development concerns, shifting the commercial property tax burden to smaller businesses and from large businesses and developers through city actions giving tax breaks in the name of “economic development.” The State’s elimination of the commuter tax unjustifiably relieved non-resident workers of a portion of the city tax burden, shifting it to others. The public is often at a loss to know who to hold accountable for these policies: Albany action is needed to change almost any aspect of the city’s tax system, letting local elected officials off the hook, and subjecting reforms to a state
FPI January 13, 2015 1

New York City Taxes—Trends, Impact and Priorities for Reform
legislative process in which many of the players are elected from districts far from New York City. This report assesses the structure of New York City’s tax system, examines trends in city taxes and tax exemptions and expenditures, and reviews the history of tax policy changes over the past four decades. Along the way, it considers the relationship of local taxes to the state’s taxes, and how the state divides up financing responsibility for financing public services. It explores different considerations in assessing the city’s tax burden relative to other cities and other parts of New York State, and the much-debated impact of taxes on the mobility of high-income households. Finally, the report identifies the most-pressing areas in need of tax reform and discusses several reform proposals. Key Findings In New York State, localities—including New York City—bear a higher share of government costs than in other states. Most non-federal government expenses around the country are funded through a combination of state and local taxes. On average across all states, local taxes represent about 40 percent of combined state and local taxes. But in New York, local governments bear more than half (53 percent) of all state and local taxes, the third-highest share among all fifty states. In part, this is due to the Empire State’s requirement that local governments bear a higher portion of the non-federal share of Medicaid costs and public assistance. New York State’s smaller share of these jointly-funded expenditures accounts for over half of the tax effort differential between New York City and large cities in other states, according to the city’s Independent Budget Office (IBO). New York State is also underfunding New York City schools. After a decades-long legal battle over the state responsibility for school financing that ended in 2007, New York State finally agreed to a funding formula in response to the State’s highest court’s finding in the Campaign for Fiscal Equity law suit. The state, however, has been very slow to honor the terms of that agreement, leading the City to substantially increase school funding out of local taxes. Together with the State elimination of the city’s commuter tax, these state actions on Medicaid and school aid have shifted about $10 billion in funding responsibility onto the City, close to one-fifth of total City taxes. (The State’s 2014 commitment to fund the expansion of universal pre-kindergarten and after-school programs is the rare departure from this pattern.) In relation to personal income—granted, an imprecise measure since it excludes the earnings of out-of-state commuters, corporate profits, and capital gains income—New York’s overall state and local tax burden rose marginally by two percent from 1995 to 2012. Over this period, both the state tax burden and the local tax burden outside of the city stayed relatively flat or declined, while the city’s local tax burden increased by eight percent. Though property taxes are a legitimate concern around the state, it may come as a surprise that, between 1995 and 2012, local property taxes elsewhere in the state declined by four percent relative to income. On a household level, both the combined New York state and local tax burden, and the New York City tax burden are regressive in their impact, with low- and middle-income households paying a higher share of their income in state and local taxes than high-income households. In
FPI January 13, 2015 2

New York City Taxes—Trends, Impact and Priorities for Reform
2015, the richest one percent paid 8.1 percent of their income in New York state and local taxes (after allowing for federal deductibility), while those in the middle paid 12.0 percent. In New York City, the top one percent paid 5.1 percent in local property, sales and income taxes in 2011, while those in the middle paid 8.9 percent, and those at the bottom paid 10 percent. Looked at another way, the top one percent in the city—tax filers with incomes over $600,000—received 35 percent of all income in 2011 but paid only 27 percent of local taxes. The first four income quintiles—the “bottom 80 percent” with incomes under $71,000—paid a greater share of city taxes than their share of income. This disparity reflects the regressivity of sales and property taxes and the fact that rental properties (lower-income households are much more likely to rent) bear a much higher effective property tax than do owner-occupied housing. (The analysis underlying these figures includes the City’s unincorporated business tax.) In recent years, much attention has been given to the question of whether high-income households will move away if New York City raises their taxes. Asked to look at this issue by the Solomon-McCall tax reform commission appointed by Governor Cuomo, the state’s tax policy staff concluded: “[Research on the impacts of taxes on the migration behavior] generally show that taxes have relatively little impact on cross-state migration.” State tax policy expert Michael Mazerov noted: “The vast majority of academic research using sophisticated statistical techniques concludes that differences in state tax systems and levels do not have a significant impact on interstate migration.” Rather than showing an exodus of wealthy households, tax data show that the number of New York City households with incomes of $1 million or more rose much faster between 2000 and 2011 than in the U.S. as a whole. Also, the total income of those high-earners rose much faster in New York City than in the U.S. overall over the decade. Wealthy residents seem to see taxes as akin to high real estate prices: the cost of being here. Looking at the city’s tax structure, the biggest shift since 1980 has been the increase in the personal income tax share relative to the property tax share. The property tax is still the single largest local tax, but its 42 percent share in 2014 is less than its 46 percent share in 1980. The personal income tax share rose from less than 13 percent to 21 percent over that period. Business income taxes have hovered around a 14 percent share of city taxes since the mid-1990s, despite the growth in corporate profits. The share accounted for by the real property transfer and mortgage recording taxes jumped from one to five percent. As is the case nationwide, the general sales tax has declined in importance as a local tax over the past three decades as consumer spending has shifted from goods, more of which are taxed, to services, fewer of which are subject to sales taxes. With the exception of the property tax and the hotel tax, there have been no major tax increases since the mid-1970s. Business taxes have been reduced repeatedly. Since 1996, carried interest, a form of income received by investment funds managers, has been exempt from business taxation. Since 1988, the capital tax base cap on the corporate tax has benefited only a handful of large companies. While the personal income tax share of city taxes is higher than it was in 1980 or 1990, it has remained around 20-21 percent over the past 20 years, with surges to 25 percent during peak years for capital gains and Wall Street bonuses (like 2001and 2008). This relative stability is surprising: if the local income tax were more progressive its share would be rising along with
FPI January 13, 2015 3

New York City Taxes—Trends, Impact and Priorities for Reform
the continued concentration of income. From 1995 to 2012, the share of total income going to the richest one percent in the city rose from a very high level of 20 percent to a dizzying 39 percent. At 3.88 percent, the current top city personal income tax rate is about one-tenth lower than its 1977 rate of 4.3 percent. The income tax structure is more compressed than it used to be, making it considerably less progressive. Currently, there are five brackets separated by less than one percentage point of tax liability, whereas from 1976 to 1986, there were 14 brackets and a 3.4 percentage point spread. Moreover, about 200,000 low-income households pay income tax to the City although they have no state or federal income tax liability. In response to a 1975 court decision finding that property tax assessment practices resulted in an uneven distribution of the property tax burden, the State Legislature partially revamped the City’s property tax system and added certain features to protect homeowners. However, by the mid-1980s, economist Matthew Drennan voiced a perspective repeated by many observers since then when he wrote, “Rather than reforming the property tax, the [1981] State law has made progress towards reform more difficult.” Inequities have mounted over the years. Despite repeated calls for remedial action from actors representing different interests over the last 30 years, no meaningful, politically-viable reform proposal has emerged from either City Hall or Albany. In the City Council’s response to the Mayor’s preliminary FY 2015 Executive Budget, a case was made for property tax reform: “Numerous studies have pointed out that the current system is rife with inequalities with properties of similar value and use having very different tax bills. The system is also inordinately complex, making it difficult to administer and nearly impossible for taxpayers to understand.” Other than an 18 percent rate increase in 2002, the one major property tax change since the early 1980s—the co-op/condo partial tax abatement—has narrowed inequities between condominiums and co-ops compared to owners of 1-3-family homes, but it further widened them with respect to rental properties. Since mid-20th century, a large share of real property in New York City has been exempt from property taxes, including government properties and property owned by one form or another of non-profit institutions, such as religious organizations or private colleges and universities. However, in recent years, properties owned by for-profit entities have increasingly benefited from property tax exemptions intended to spur investment in housing or commercial expansion. Moreover, the largest property tax break intended to promote housing development—421-a—has grown by leaps and bounds since 2000 although it has long been desperately in need of reform. When 421-a was established in 1971, its purpose was mainly to foster housing development but with no emphasis on affordability, an oversight that badly needs correcting. The 421-a share of all exemptions has jumped from 5.5 percent to 21 percent just since 2000, and the share of tax breaks provided under the Industrial and Commercial Incentive Program (ICIP) program rose from 8 to 13 percent. The city’s housing needs have changed markedly since 421-a was established, and the ICIP program and its successor, the Industrial and Commercial Abatement Program, are widely viewed as providing a tax break windfall for investments that would have taken place anyway.
FPI January 13, 2015 4

New York City Taxes—Trends, Impact and Priorities for Reform
The term “tax expenditures” includes exemptions, exclusions, abatements, credits or other benefits allowed against a range of city taxes, and that result from a specific City or State action. It does not include foregone taxes from a range of institutional properties (such as religious, medical, educational and charitable institutions) that have historically been exempted from the property tax. The Finance Department’s 2014 annual tax expenditure report identifies a total of $7.1 billion in property and non-property tax exemptions, abatements and credits—$3.4 billion is housing-related, $3 billion is business-related, and roughly $800 million benefits households. Most tax expenditures intended to induce business investment or employment or to retain businesses and jobs were put in place in the 1980s when the city’s economy was recovering from the 1970s out-migration of people and businesses. Routinely, these breaks have been extended without a thorough evaluation of their value. Business tax expenditures have more than tripled in value since 2001, increasing to nearly $3 billion annually, and have grown more than twice as fast as total city tax collections. In a similar vein, with no evidence of an economic justification, a major expansion of as-of-right property tax breaks for large commercial developments was launched in 2005 for the re-zoned Hudson Yards district. The magnitude of the Hudson Yards tax breaks only became widely understood when JPMorgan Chase sought an additional subsidy of $1 billion in October 2014 when considering constructing a new headquarters in the Hudson Yards district. In rebuffing the bank’s request, the de Blasio administration pointed out that the bank would already get about $600 million in tax breaks under the as-of-right Hudson Yards program established by Mayor Bloomberg. Tax Reform Considerations Property tax: There is a critical need to change the provisions of the State real property tax law that establish ceilings on increases in Class 1 (1-3 family homes) assessments and that require the use of an arcane rental property treatment for assessing co-ops and condos. Problems related to adjusting tax shares among different property categories should also be addressed. The main goal should be to equalize effective tax rates for all residential properties and neighborhoods. Since there would be short-term winners and losers, transitional assessments over an extended period would be appropriate to moderate necessary increases. Special provisions would be needed to ensure that renters benefitted from property tax reductions affecting their buildings. These changes would further both horizontal equity (among households at comparable income levels) and vertical equity (among households at different income levels) and go a long way in promoting administrative efficiency and accountability while reducing complexity. The 421-a property tax exemption has become the City’s costliest tax break at $1.1 billion, and it is of questionable value, particularly since in Manhattan there are more non-primary resident owners benefiting from 421-a tax breaks than primary residents. It expires in June 2015 and needs to be re-vamped to concentrate benefits on the construction of truly affordable housing units, helping the City address its ambitious affordable housing goal. Personal income tax: The main priority should be to enhance progressivity. This can be achieved through a combination of: changing the rate structure to increase the number of brackets below the current top rate; increasing the City’s Earned Income Tax Credit (EITC); extending the EITC to childless couples and workers ages 21-24 and 65-66; and possibly also
FPI January 13, 2015 5

New York City Taxes—Trends, Impact and Priorities for Reform
enhancing the city’s child and dependent care and household credits. The combined city and state top income tax rates are already relatively high so there is a limit on raising the City’s top rate. (However, this could change if the State does not continue the current 8.82 percent top rate when it expires at the end of 2017.) The current 23 percent credit on the personal income tax for unincorporated business tax liability should be re-visited since most of the benefits go to households with adjusted gross incomes of $1 million or more. These households receive about $100 million from this credit, an amount that could pay for a doubling of the City’s current 5 percent EITC. Before raising the top tax rate, consideration should be given to adding a rate benefit recapture provision as used at the state level. Any of these changes would enhance the fairness of the City’s overall tax structure. Taxing commuters: The State should redress the politically-dubious 1999 repeal of the City’s very modest non-resident earnings tax. There are approximately 900,000 commuters working in the city; they account for 35 percent of all New York City earnings, yet, except for those paying the unincorporated business tax, they currently do not help fund the public services on which they and their employers rely. The IBO estimates that restoration of the commuter tax at the same tax rates as before would generate $860 million annually. Restoration advances fairness and accountability. Taxing high-value pied-à-terre residences: There is a growing number of ultra-luxury residences in New York City that are being purchased by people who are not full-time residents, and, as such, are not paying the City’s personal income tax. Because some of these high-valued units benefit from tax breaks or the arcane method for assessing condominium properties, the effective property tax rate on many of these units likely is low. A modest, graduated pied-à-terre tax on units valued above $5 million could generate $250 million or more per year. A pied-à-terre tax advances fairness and accountability. Business taxes: While tax simplification and administration would be furthered by aligning the City’s corporate and bank income taxes with the recent State corporate tax reform, there is legitimate concern regarding the adverse revenue impacts. To help offset some of the potential tax loss, the City could close corporate tax loopholes, such as the $1 million cap on tax liability under the capital tax base measure, one of the three alternative methods corporations must use to calculate tax liability. For 2010, the Finance Department estimates that 24 corporations received a combined benefit of $319 million under this provision. Further, additional revenues likely would be needed from broadening the corporate tax base by implementing full unitary combined reporting and eliminating the separate treatment of subsidiary capital and income. Finally, as part of the measures conforming to the State’s corporate tax reform, the City should modify how “nexus” is determined in order to fairly tax the income of companies conducting business activity within the city, and it should significantly raise the current $5,000 fixed dollar minimum tax for large corporations. Business tax expenditures: In addition to the capital tax base limitation, other business tax breaks need to be re-visited to determine their economic value and adjusted as needed. At the top of this list is the Industrial and Commercial Abatement Program (ICAP) that is subsidizing hotel and other commercial developments, many of which likely would proceed even in the absence of ICAP benefits.
FPI January 13, 2015 6

New York City Taxes—Trends, Impact and Priorities for Reform
The City also should assess the need for property tax and other subsidies in Hudson Yards. Since the district has clearly demonstrated its commercial viability, there is absolutely no need for the City to provide tax breaks. The sooner it stops discounting taxes, the sooner the City will be able to repay the bonds sold to build the #7 subway extension. Most business tax breaks go disproportionately to large, wealthy corporations. The City’s current carried interest exemption under the unincorporated business tax is nothing more than a tax loophole introduced and maintained in order to minimize taxation on often well-connected investment funds. Eliminating the exemption would net the City approximately $200 million annually and promote fairness among payers of the unincorporated business tax. These changes will help level the economic development playing field for smaller businesses and improve accountability in the eyes of the average taxpayer. Resources could also be freed up to fund more promising economic development interventions. Real estate related taxes: The City’s mortgage recording tax (MRT) applies to all types of residential real estate except co-ops. Eliminating this exception would generate an estimated $98 million annually in 2016, according to the IBO, and $50 million more if the exception were eliminated for the State MRT, of which the City receives a portion. Another proposal would be to add a new bracket to the real property transfer tax (RPTT) for high-value residential properties. The top City RPTT rate of 1.425 percent now applies to transactions over $500,000. Establishing a 1.925 percent bracket for transactions of $5 million or more could yield about $39 million in 2016, according to the IBO. The main value of such changes is to generate resources to help the City address its affordable housing priorities. In addition to these specific measures, two additional changes are advisable. First: The City’s Executive branch should develop the capacity to analyze the distributional impact of local taxes across income classes, to guide its efforts as it approaches tax reform or entertains any tax proposals. An analytical capacity would help target tax changes to enhance progressivity and avoid unintended consequences in an era when income polarization takes center stage. As the state constitution permits, the state legislature and governor should give New York City greater authority to make adjustments to existing taxes within a defined range and to periodically extend or modify existing tax policies and programs.
FPI January 13, 2015 7

New York City Taxes—Trends, Impact and Priorities for Reform
1. Introduction New York City’s taxes—like those in all localities—are a major funding source for providing the public services and amenities all residents, visitors, and commuters enjoy. In New York City’s case, local taxes fund nearly two-thirds of the City’s $77 billion budget, the fifth largest government budget in the United States.1 Taxes are always a popular subject for complaint. Are tax rates adequate to provide needed services in a very dense, diverse and older city? Are city residents or businesses over-taxed? Do City taxes “chase away” higher-income residents or opportunities for economic development? What effect do City taxes have on residents’ quality of life or on income inequality? Section 2 begins with a review of six principles of a high-quality tax system that should inform any examination of tax policy. Sections 3 and 4 describe the major New York City taxes and their relative importance while discussing the relationship to New York State taxes. With the exception of setting the local property tax rate, the City of New York relies on State action to change almost any aspect of local taxes. It is also important to understand how the State looks to the City and other localities to bear a greater share of the non-Federal share of Medicaid and public assistance than do municipalities in most states. Section 5 reviews various approaches to analyzing the local tax burden. Perhaps the most common perception about New York City taxes is that they are “too high.” Indeed, taxes on New York City residents and businesses are among the highest in the nation. But there are special circumstances that help to explain this fact—and we should not be too quick to assume that these high taxes are particularly problematic. The sixth section begins looking at factors that affect relative household tax burdens, and section 7 presents the Fiscal Policy Institute’s estimates of New York City’s household tax burden. Section 8 takes up the literature on the effects of state and local taxes on high-income households. Trends in New York City taxes and tax expenditures, and how the City’s tax structure has changed over the past four decades, are the subject of section 9. Section 10 examines major tax policy changes over the last four mayoral administrations since 1977. Finally, section 11 provides a framework for understanding how to think about needed tax reforms so that this tax structure better serves residents and businesses.
1 New York City is tied for fifth with Florida. The four largest budgets are those of the U.S. government, California, New York State, and Texas.
FPI January 13, 2015 8
New York City Taxes—Trends, Impact and Priorities for Reform
2. Principles for a high-quality tax system Thinking on principles for sound taxation has a long history. In his 1776 classic, The Wealth of Nations, Adam Smith articulated four criteria around which modern public finance practice still revolves. Smith’s criteria included equity, explicitness, simplicity of compliance, and efficient administration. The National Council of State Legislatures (NCSL) publishes a set of principles for a high-quality state revenue system and has revised and updated those principles periodically in light of economic and political developments and the evolution of fiscal federalism.2 Echoes of Smith’s four criteria are integral to the NCSL principles. For the purposes of this New York City tax report, the NCSL principles have been adapted as follows. Principles for a High-Quality Tax System
1. Adequacy and reliability 2. Economic neutrality and diversification 3. Fairness 4. Administrative efficiency and ease of compliance 5. Balances tax burden and economic development concerns 6. Accountable to taxpayers
1. Adequacy and reliability
The primary purpose of any tax system is to raise funds to support the provision of public needs. Because taxes fund activities we as a society have deemed important, it is necessary that tax revenue be adequate to meet these public needs. Ensuring adequacy requires that tax revenue accommodates changing circumstances, whether these arise from long-term trends or more temporary conditions. An aging population, for instance, will need more health care and social services, while population growth will put demands on public infrastructure, such as public transportation. Market economies are subject to periodic economic downturns, and a rise in unemployment due to a recession will create greater need for automatic stabilizers such as unemployment compensation or food stamps. To respond to these types of changes, a tax system should be structured so that revenue grows adequately to meet increased needs, such as those arising from population growth or from the need to maintain effective infrastructure. Further, to continue funding essential services during economic downturns that reduce tax receipts, sound budget practices are needed to ensure sufficient reserves are built up during good economic times to help weather the downturns.
2. Economic neutrality and diversification Another principle guiding the evaluation of tax policy is neutrality, the idea that taxes should not distort economic activity away from productive activity. Neutrality holds, for instance, that it is not desirable for individuals to make personal investments that are driven primarily by tax avoidance. Avoiding tax policies that encourage non-productive behavior does not mean that tax policy should not be used to shape economic behavior that advances desirable
2 National Conference of State Legislatures, Principles of a High-Quality State Revenue System, fourth edition, June 2001; updated June 2007.
FPI January 13, 2015 9

New York City Taxes—Trends, Impact and Priorities for Reform
outcomes. Whether it is through tax credits for college tuition, high sales taxes on cigarettes, or tax credits for energy efficiency investments, taxes are regularly used to direct the behavior of individuals and businesses. It is valuable for economic neutrality as well as for dampening overall volatility across the business cycle to rely on a reasonable range of taxes. Excessive reliance on one or two taxes is more likely to affect taxpayer behavior, whereas a diversification of taxes helps prevent such distortion. Further, as the NCSL notes, if taxation is divided among numerous taxes and their bases are broad, rates can more readily be kept low in order to limit effects on behavior. Diversification also helps insulate tax collections from cyclical swings. Personal and business income taxes are inherently pro-cyclical, whereas sales and property taxes are more stable.
3. Fairness There is little controversy in saying that taxes should be applied fairly. While notions of fairness may differ, the NCSL notes that there is broad agreement that tax structures should minimize regressivity. While saying what constitutes fairness can be subjective, there are some broadly used concepts that can be employed to evaluate particular tax policies in this regard. The first is that people in similar circumstances with respect to their ability to pay should be taxed in a similar manner. This is known as horizontal equity. A tax policy that benefits homeowners but not those who rent their homes would violate this principle. Another example involves the sales tax: if one person buys a book in a shop and pays local sales tax and someone else purchases the book over the internet and does not pay tax, the purchases are being treated differently for a rather arbitrary reason. The counterpart to horizontal equity is vertical equity, the principle that tax policy should treat differently those with different abilities to pay. Vertical equity entails distinguishing between people both in terms of their income and their responsibilities. For instance, vertical equity would mean that someone earning $1,000,000 a year would pay a larger share of their income in taxes than would a person making $40,000. It would also mean that, all else equal, a childless adult earning $40,000 would pay a bigger percentage of income in taxes than would another adult earning the same amount but with a dependent child. If indeed someone with a higher income pays a larger share of their income in taxes than does a person with a lower income, the tax system is said to be progressive: as one’s ability to pay increases, so does the rate of tax one pays. On the other hand, if a lower income person pays a higher portion of income in tax than a higher-income person, the tax is regressive. Sales taxes are a regressive tax, since low-income people spend a higher portion of their income on consumption than do those with higher incomes and thus pay a greater share of income in sales tax. For example, $88 in sales tax paid on a $1,000 computer takes a bigger bite out of the income of someone earning $25,000 annually than that of someone earning $100,000. If, however, taxpayers pay the same share of their income in taxes regardless of the level of their income, the tax is called a proportional tax. Many taxes that appear proportional are in fact regressive; sales taxes and payroll taxes (FICA) are two prominent examples. The fairness principle also calls for a locality’s tax burden to be shared by those who benefit from publicly-funded services, resident and non-resident alike, including non-resident commuters who work in New York City. New York City has become increasingly desirable
FPI January 13, 2015 10

New York City Taxes—Trends, Impact and Priorities for Reform
to non-residents who buy a home or apartment in the city but who do not live here enough days of the year to be considered a resident for income tax purposes. It is important for the City to appropriately tax those non-resident property owners.
4. Administrative efficiency and ease of compliance Taxes should not be so complex that they are costly for government to administer or for taxpayers to comply with. Since New York City personal and corporate income and sales taxes overlap with those of New York State, it is important for the City to utilize wherever possible State tax definitions and tax filing requirements. The taxation of financial corporations has been a frequent area of concern given the significant changes in the last decade or more in the corporate structure and convergence of Wall Street firms and commercial banks. The State acted in early 2014 to eliminate its separate bank tax and cover all financial corporations under the general corporate tax. This has put pressure on the City to enact conforming legislation to facilitate compliance.
5. Balances tax burden and economic development concerns Sound tax policy should be developed with attention to its economic development consequences, though there is strong evidence that state and local taxes per se have little effect on business location decisions. Taxes must fund the services that a functioning and growing economy requires, including the public education, infrastructure, public safety and other services essential to economic development. There has been much attention given to the question of whether the combined City and State individual income tax burden induces high-income households to move away. There may be some level at which a locally-imposed tax burden would tip the balance against the overall desirability of living in New York City, but there is no evidence from considerable research on the general issue that the City has approached such a tipping point.
6. Accountable to taxpayers To promote housing investment, economic development and certain other taxpayer behavior, many state and local governments, including New York City, have made greater use of tax exemptions, abatements and credits in recent decades. As Harvard Law School tax law expert, Stanley Surrey, noted: “[tax expenditures] are departures from the normative tax structure [that] represent government spending for favored activities or groups, effected through the tax system rather than through direct grants, loans, or other forms of government assistance.”3 The extent and growth of tax expenditures in New York City is not well-understood and the practice of granting them lacks accountability. While New York City’s charter requires that such expenditures be catalogued in an annual tax expenditure report, the practice of granting tax expenditures would be more transparent and accountable to taxpayers if it were integrated into the budget-making process, and if there were periodic evaluation of the need for and impact of such expenditures.
3 Stanley S. Surrey and Paul R. McDaniel, Tax Expenditures, Cambridge, MA: Harvard University Press, 1985, p. 3.
FPI January 13, 2015 11

New York City Taxes—Trends, Impact and Priorities for Reform
3. New York City’s local taxes Taxes fund nearly two-thirds of New York City’s $77 billion budget, the fifth largest government budget in the United States. As Federal aid has declined, the City has become increasingly reliant on the local tax base, with the tax share of the budget rising from 53 percent in 1980 to 64 percent since 2013. The nearly $50 billion in taxes the City expects to collect in FY 2015 comes from a fairly diverse portfolio of taxes, including a property tax, personal and business income taxes, and a sales tax. The property tax heads the list, accounting for about 42 percent of the total, followed by the personal income tax, contributing 21 percent, and the business income taxes and taxes on real estate transactions and commercial rents making up another 20 percent. The sales tax and the hotel tax combine for almost 15 percent. (Section 9 below reviews the shifting shares of the major taxes over time.) FIGURE 1: New York City Local Tax collections, FY 2014
($ 000s) Share of total
Real estate taxes $20,202,022 41.8%Personal income tax $10,173,614 21.0%Business income taxes $6,673,815 13.8% General corporation tax $3,367,328 7.0% Banking corporation tax $1,352,349 2.8% Unincorporated business tax $1,954,138 4.0%
General sales taxes $6,508,814 13.5%Real property transfer $1,530,167 3.2%Mortgage recording $960,852 2.0%Commercial rent tax $771,186 1.6%Hotel room occupancy $541,293 1.1%Utility taxes $410,342 0.8%Other taxes $603,306 1.2%Total TAXES $48,375,411 100.0%
Source: Fiscal Policy Institute analysis of data from New York City Comptroller's Comprehensive Financial Report for FY 2014 , pp. 332-333.
FPI January 13, 2015 12
New York City Taxes—Trends, Impact and Priorities for Reform
FIGURE 2: New York City local tax collections, FY 2014
Real Estate Taxes $20.2 billion, 42%
Personal Income Tax $10.2 billion, 21%
Business Income Taxes $6.7 billion, 14%
General Sales Taxes $6.5 billion, 13%
Real Property Transfer $1.5 billion, 3%
Mortgage Recording$1.0 billion,
2%
Commercial Rent Tax$0.8 billion, 2%
Hotel Room Occupancy$0.5 billion, 1%
Utility Taxes$0.4 billion, 1%
Other Taxes $0.6 billion, 1%
Source: Fiscal Policy Institute's Analysis of data from NYC Comptroller's Report for FY 2014, pp. 332-333.
Total taxes$48.4 billion
The City has what may be the most diversified tax structure of any governmental unit in the United States. Unlike most state governments, New York City is able to tap into a large property tax base. Unlike most local governments, the City derives over one-third of its taxes from personal and business income taxes. While real-estate related taxes like the real property transfer and mortgage recording taxes are very cyclical, as are the income-based taxes, the property, commercial rent and sales taxes are more stable during downturns, and they account for 57 percent of local taxes. The volatile financial sector still exerts a big influence on the cyclical course of the local economy, yet the growth in the technology, corporate management, professional services, higher education, real estate, cultural, tourism, and media sectors provides a greater diversity to the local economy than in most large cities. This economic diversity helps the City’s tax base weather cyclical ups and downs. The sheer size of the city’s economy also adds resilience and lessens its reliance on the fate of particular companies—New York City’s $750 billion GDP makes its economy larger than that of 45 states. Brief descriptions of the City’s ten largest taxes, each accounting for more than $500 million in annual revenue, are provided below. Later sections will discuss various exemptions, abatements, and credits to these taxes, along with an overview of tax policy changes enacted since 1977.
A. Real property tax As with most local governments around the country, the property tax is the bedrock of the City’s tax base and the principal revenue source to fund local government. The property tax is the only tax over which the City has authority to set the rate without prior approval from the
FPI January 13, 2015 13
New York City Taxes—Trends, Impact and Priorities for Reform
State. This is so because of the unique role the property tax plays in balancing the City budget. When the budget is adopted, total budgeted expenditures and the forecasted revenue from all non-property taxes and non-tax revenue sources are determined. The difference between the budgeted expenditures and the forecasted revenues determines the property tax revenue needed to balance the budget. The City Council then fixes the property tax rate to generate the needed property tax revenue. In practice, the City strives to manage its planned expenditures such that the amount of needed property tax revenues reflects an increment over the prior year that is in close proportion to the assessment change from the prior year. But considering that many non-property taxes are economically sensitive, the City needs the latitude to adjust the property tax rate without waiting for the State legislature to act. Under New York State law, there are four real property classes in New York City. Class One is primarily 1-, 2-, and 3-family homes. Class Two is other residential property, including co-operative apartments, condominiums, and rental properties. Class Three is utility property, and Class Four is all other commercial property, including such properties as office buildings, stores, hotels, factories, warehouses, theaters, and parking garages. The City’s Department of Finance annually estimates the full market value of each parcel of real property. The actual assessed value of each property is derived by multiplying full market value by a target assessment ratio. Class 1 properties have a target assessment ratio of six percent of full market value, and properties in the other three classes are assessed at 45 percent of full market value. Actual assessed values are then adjusted to account for assessment caps that limit the annual increases for Class 1 and small Class 2 properties (rental, co-operative and condominium buildings with 10 or fewer units). Assessments for Class 1 properties are capped at six percent per year and 20 percent over five years. Small class 2 properties have their assessments capped at 8 percent a year and 30 percent over five years. The assessed values for larger Class 2 properties and for Class 4 properties are adjusted to account for phase-in requirements that spread out increases or decreases over five years to yield the billable assessed value. Under state law, each class is responsible for a specific share of the property tax levy, with the class shares updated annually to reflect full market value changes among the four classes as well as physical changes and changes in tax status. Class shares are also subject to a five percent cap in the change for any one class’s share, although from time to time, the City Council seeks to limit the class share changes to less than five percent. For example, in 2011 and 2012, the cap was set at 2.5 percent and in 2013 at 1.5 percent.4 The New York State Constitution limits the portion of the City’s property tax levy that can be used for operating expenses (generally figured as the total operating budget minus debt service—the principal, and interest on the City’s long-term debt.) The operating expense limit is equal to 2.5 percent of the average full value of taxable assessed value for the current and prior four years, less payments for short-term debt and business improvement district levies. While the State Constitution explicitly says that the City’s ability to levy a real property tax for the payment of principal and interest on long-term debt is unlimited, the Constitution does limit the amount of total debt the City can have outstanding to 10 percent of the five-year average full value of property in the City.
4 For a detailed explanation of the determination of class shares, the assessment roll and other factors that affect the property tax system, see the Real Property Tax section in New York City Office of Management and Budget, Tax Revenue Forecasting Documentation, Financial Plan Fiscal Years 2013-2017, July 2014, pp. 19-33.
FPI January 13, 2015 14

New York City Taxes—Trends, Impact and Priorities for Reform
Sections 9 and 10 below will discuss the significant growth in recent decades in property tax exemptions introduced ostensibly to spur housing and business development.
B. Personal income tax New York City’s Personal Income Tax (PIT) is imposed on residents and part-year residents of the City. It dates from1966 and is paid by City residents in addition to the State PIT.5 The City PIT is administered by the State, uses the same filing statuses as the State income tax, and the starting point is State taxable income. State legislative action is needed for the City to change the rates and brackets in the PIT. In FY 2014, the City raised $10.2 billion through the PIT, about half the amount generated by the real property tax, but much greater than the $6.5 billion raised by the sales tax, the next largest tax. The City allows three different credits on its PIT geared to low-income households. The largest is the City Earned Income Tax Credit (EITC), introduced in 2004 and equal to five percent of the Federal EITC (the State provides an EITC at 30 percent of the Federal EITC). Over 900,000 city household benefited from the City EITC in 2011, receiving an average of $107 per filer ($97.5 million in total). For joint filers with two children, the maximum credit is for earned income in the range of $12,750 to $21,800, at which point the credit declines and phases out at an income of $46,044 (2011 levels). The City EITC is a refundable credit, meaning that households with no net tax liability still receive a refund. The City’s Household Credit dates from 1987 and provides a small, nonrefundable maximum credit of $30 or less per household member based on household income levels up to $22,500. In 2011, the City Household Credit totaled $12.2 million—435,000 households received an average credit of $28. In 2007, the City introduced a refundable PIT credit for child care services necessary for gainful employment, applicable for expenses for dependents under the age of four, for tax filers with incomes under $30,000. In 2011, 18,000 filers claimed the City credit, with the average credit of $374 for a total citywide of $6.7 million. The other major credit allowable on the City PIT is for Unincorporated Business Tax (UBT) payments, a credit first introduced in 1997 but significantly enhanced in 2007. This credit is based on a sliding scale and ranges from a high of 100 percent of UBT liability for taxpayers with income of $42,000 or less to 23 percent for incomes of $142,000 or more. This credit was intended to provide relief to New York City residents who own or have an interest in a business subject to the UBT from the double taxation of income earned by the business.6 In practice, this is a high-income credit, with 85 percent of the $130 million annual benefit going to taxpayers with incomes over $500,000. There are 5,144 UBT payers with adjusted gross incomes of $1 million or more who receive $99 million in credits, an average of over $19,000. The UBT credit exceeds in value the total of the City’s three low-income credits combined ($116 million).
5 The next section on New York State taxes includes a chart showing the combined City and State top PIT rates. 6 Data on the four PIT credits discussed in this section are from New York City Department of Finance, Annual Report on Tax Expenditures, FY 2014, February 2014, pp. 115-119. In a similar vein to the UBT credit, beginning in 2014, certain taxpayers who are shareholders of New York State S corporations became eligible for a full or partial credit for their share of New York City General Corporation Taxes paid by their S corporations. When fully implemented in FY 2015, this new credit is estimated to provide $30 million in tax relief.
FPI January 13, 2015 15
New York City Taxes—Trends, Impact and Priorities for Reform
The City’s PIT has a graduated tax structure with five tax rates that range from 2.907 to 3.876 percent (these rates include the across-the-board 14 percent rate surcharge first enacted in 1991). This rate structure has many fewer brackets than it once had—there were nine brackets between 1966 and 1975 and 14 brackets between 1976 and 1986. The range of current rates is also much narrower than either the New York State or federal income tax.
C. Business income taxes
New York City has three main business income taxes—the General Corporation Tax (GCT), the Banking Corporation Tax (BCT), and the Unincorporated Business Tax (UBT). The State taxes insurance companies, but the City does not. The three City business income taxes all date from 1966. The City’s Finance Department administers the three taxes but the State must authorize most changes, including in the tax rate and tax base.7
General corporation tax (GCT) The City GCT is imposed on most foreign and domestic incorporated entities doing business, employing capital, owning or leasing property, or maintaining an office in New York City. The GCT generated $3.4 billion in revenues in FY 2014, half of the business income tax total. To determine tax liability, corporations are required to make three alternative tax calculations, compare these to a minimum tax (based on gross receipts), and pay the highest amount. The majority of the tax is paid on the City-allocated entire net income tax base at a rate of 8.85 percent. S corporations, which are pass-through entities at the Federal and State levels, are fully taxed under the GCT. In 2009, the City began phasing in a change in the allocation formula, moving away from a three-factor formula based on the NYC share of tangible property, receipts, and payroll, and transitioning toward a single sales factor allocation. The 10-year phase-in will be complete for tax years beginning after 2017. When fully phased-in, the City’s business income allocation formula will conform to the State’s allocation for corporations. Banking corporation tax (BCT) The BCT generated $1.4 billion in tax revenues in FY 2014. The BCT is imposed on all corporations authorized to operate a banking business in New York City, including commercial and savings banks, savings and loan associations, foreign banks, trust companies, and certain subsidiaries of banks which do business in the city. Like corporations under the GCT, banks are required to make three alternative tax calculations, and compare these to a minimum tax (in this case, a fixed dollar minimum of $125), and pay the highest amount. For banks the three alternative methods are: allocated entire net income taxed at a rate of 9 percent; alternative allocated entire net income at a rate of 3 percent; and a tax on assets at a general rate of one-tenth of a mill ($0.0001) per dollar of taxable assets allocated to the City. Banks allocate income to the city using a three-factor allocation formula, with the weights for assets, deposits and receipts variable depending on the tax calculation method. Beginning in
7 Except where noted, information on the City business income taxes is from New York City Office of Management and Budget, Tax Revenue Forecasting Documentation, Financial Plan Fiscal Years 2013-2017, July 2014, pp. 57-83; and New York State Department of Tax and Finance, Office of Tax Policy Analysis, Handbook of New York State and Local Taxes, October 2012, pp. 40-43.
FPI January 13, 2015 16

New York City Taxes—Trends, Impact and Priorities for Reform
2009, the City began phasing in over 10 years a single sales factor for banking corporations that provide management and administrative or distributive services to an investment company. In FY 2010, foreign banks accounted for half of BCT collections, and the large clearing house banks represented another one-third. BCT receipts are highly concentrated among a relatively small number of banks—95 banking corporations accounted for over 96 percent ($1.227 billion) of BCT taxes, an average of $12.9 million. Unincorporated business tax (UBT) The UBT generated nearly $2 billion in tax revenue for the City in FY 2014. The UBT applies to unincorporated businesses such as sole proprietorships and partnerships. The 4 percent tax rate is generally applied to the firm’s federal gross income from New York City operations based on an apportionment method that is phasing in single sales factor, with allowance of a $10,000 exemption. The tax applies equally to residents and non-residents alike. A credit eliminates the tax for businesses with taxable incomes of $85,000 or less and phases out for businesses with taxable incomes of $135,000 or more. In 2010, there were 196,075 partnerships and sole proprietorship tax filers, of which fewer than 12 percent (23,151) paid the UBT. With the provision of credits and exemptions, 88 percent of UBT filers were exempt from paying the tax in 2010. Legal, accounting, and other professional services accounted for 69 percent of UBT payers and 52 percent of tax liability. Finance and real estate represented about 18 percent of payers and 41 percent of UBT liability. Manufacturers, communications businesses, and wholesale and retail trade accounted for most of the balance. The City’s Finance Department identifies the three most costly business income tax expenditure items as the non-taxation of insurance corporation income (costing $394 million a year in foregone tax revenue, estimate for FY 2010), the business and investment capital tax limitation of $1 million ($319 million), and the Single Sales Factor ($83 million as of FY 2010 but rising each year as the 10-year phase-in progresses).8 To this list should be added the carried interest exemption under the UBT. Enacted in 1996, this exemption pertains to the portion of gains allocated to general partners as “carried interest,” but which, as with most other forms of performance-based income, should be treated as ordinary business income. The City’s Independent Budget Office (IBO) estimates that this tax exemption costs the City a net of $200 million in revenue annually.9
D. Sales tax The sales tax was first enacted in 1934 and is imposed on sales of tangible personal property and certain services. In FY 2014, the City sales tax generated $6.5 billion—it is the City’s third largest tax after the property and personal income taxes. It is administered by the State, and changes in the rate require State authorization but the City is allowed to impose its sales tax on a broader range of services that the State or other local governments. The City imposes a 4.5 percent sales tax rate, which, when combined with the State 4.0 percent rate and the 0.375 percent rate for the Metropolitan Transportation Authority (MTA), yields a combined rate in New York City of 8.875 percent.
8 New York City Department of Finance, Annual Report on Tax Expenditures, FY 2014, February, 2014, p. i. 9 New York City Independent Budget Office, Budget Options for New York City, November 2014, p. 69.
FPI January 13, 2015 17

New York City Taxes—Trends, Impact and Priorities for Reform
Exemptions are provided for clothing and footwear items costing under $110, food, rent, prescription and non-prescription drugs, college textbooks, public transportation, laundering and dry cleaning, and live theatrical performances and movie tickets. The City taxes some services not subject to the State sales tax, including personal services such as beauty, barbering, massage, and health salons. The City also imposes a higher sales tax rate on motor vehicle parking.
E. Real property transfer tax (RPTT) The RPTT, which dates from 1959, generated $1.5 billion in FY 2014. The tax is determined by State law and administered by the City Department of Finance. The RPTT is imposed on the seller of real estate with the applicable rate depending on the value of the transaction and whether it is a residential or commercial property. Residential property sales, including sales of shares of stock in co-operative housing corporations (i.e., co-ops) for $500,000 or less, are taxed at 1.0 percent and at 1.425 percent above $500,000. Commercial property sales at $500,000 or less are taxed at 1.425 percent, while transactions above that amount are taxed at 1.625 percent. Residential buildings sold in their entirety are taxed as commercial transactions. The State also levies its own Real Estate Transfer Tax, and there is a special “RPTT Urban Tax” of 1.0 percent levied on New York City commercial sales over $500,000 that goes to the MTA since it is dedicated to New York City Transit, paratransit services, and the MTA Bus Company.
F. Mortgage recording tax (MRT) The State MRT was established in 1906. In FY 2014, the City MRT produced nearly $1 billion in tax revenue. The City tax is imposed on all mortgages of real property recorded with the New York City Register of Deeds (or, in the case of Staten Island, with the Richmond County Clerk). Residential transactions subject to the MRT include Class 1 and Class 2 properties sold as individual units. However, there is no MRT on the purchase of a co-operative apartment. Refinancing a mortgage, in most cases, triggers an MRT liability. Under the City MRT, a 1.0 percent rate is applied to all mortgages under $500,000 and a 1.125 percent rate to all mortgages of $500,000 or more. In addition, a portion of the State-levied MRT goes to the City, which receives 0.5 percent on all mortgages. The MTA and the State of New York Mortgage Agency also receive portions of the State-levied MRT, and an additional MRT tax of 0.625 percent is levied by the City with the proceeds dedicated as part of the MTA Urban Tax.
G. Commercial rent tax (CRT) The City’s CRT dates from 1963 and generated $770 million in FY 2014. It is imposed on tenants of premises that are used to operate businesses, professions, or commercial activities
FPI January 13, 2015 18
New York City Taxes—Trends, Impact and Priorities for Reform
in Manhattan south of 96th Street at an effective rate of 3.9 percent.10 Tenants whose annual gross rent is less than $250,000 are not subject to the CRT. The CRT had a top rate as high as 7.5 percent from 1970 to 1977, and was reduced to 6 percent by 1981. It also used to apply citywide, but from 1989 to 2001, the City acted several times to narrow the geographic scope of the tax, to reduce the effective tax rate, and to raise the exemption level.
H. Hotel room occupancy tax (Hotel Tax) The City’s Hotel Tax dates from 1970, and in FY 2014 it produced about $540 million in revenues. The current City hotel tax is a 5.875 percent rate on the room occupancy rent with an additional $2 per room fee (less if the daily room rental rate is under $40). The hotel tax is imposed in addition to the City-State-MTA sales tax of 8.875 percent. Thus, the combined hotel room occupancy and sales taxes on a hotel room rental in the city is 14.75 percent, plus the $2 per room charge. In addition, the State administers as part of the sales tax a $1.50 hotel room unit fee that is dedicated to retire bonds sold in 2005 to finance the expansion and renovation of the Jacob Javits Convention Center. This tax, by definition, falls almost entirely on non-residents. The current 5.875 percent hotel tax includes a 0.875 percent portion that was initially added on a two-year temporary basis in 2009 but has since been extended twice and is now authorized through 2015. During this period, New York City has experienced record levels of tourism and a hotel building boom so the slightly higher hotel tax rate has not limited hotel stays.
10 The statutory CRT rate of 6.0 percent has been reduced by 35 percent since 1998 to yield an effective rate of 3.9 percent.
FPI January 13, 2015 19
New York City Taxes—Trends, Impact and Priorities for Reform
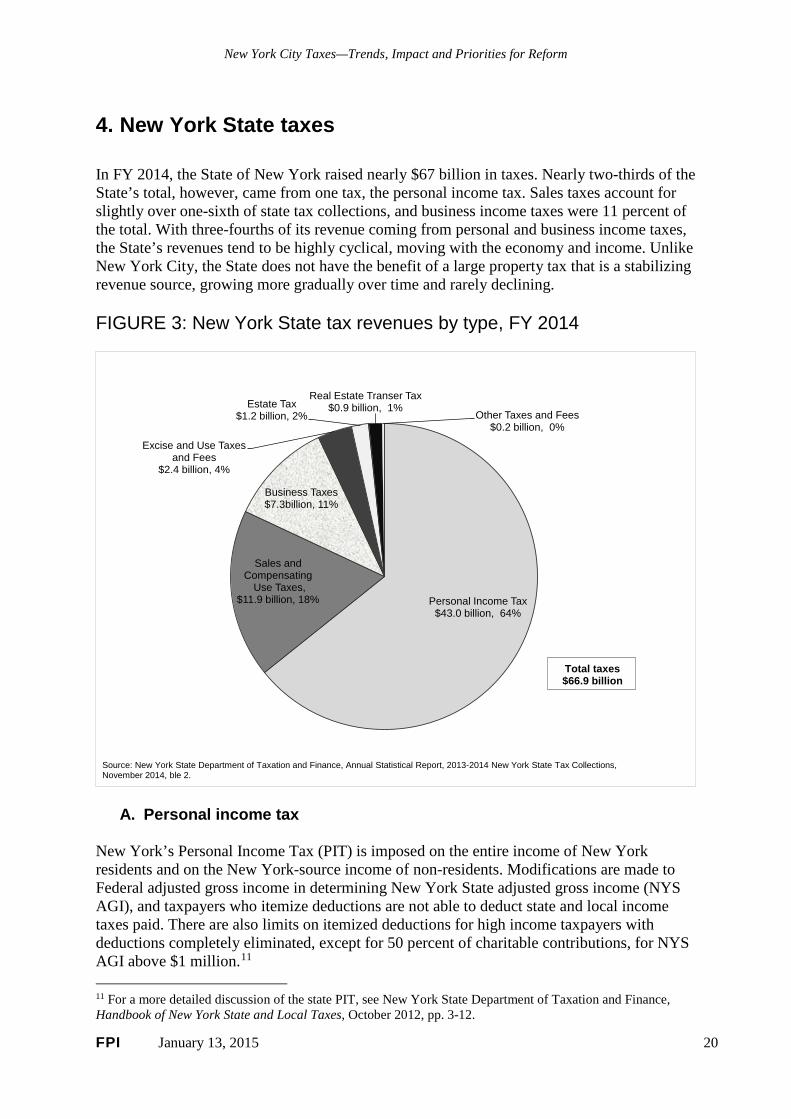
4. New York State taxes In FY 2014, the State of New York raised nearly $67 billion in taxes. Nearly two-thirds of the State’s total, however, came from one tax, the personal income tax. Sales taxes account for slightly over one-sixth of state tax collections, and business income taxes were 11 percent of the total. With three-fourths of its revenue coming from personal and business income taxes, the State’s revenues tend to be highly cyclical, moving with the economy and income. Unlike New York City, the State does not have the benefit of a large property tax that is a stabilizing revenue source, growing more gradually over time and rarely declining. FIGURE 3: New York State tax revenues by type, FY 2014
Personal Income Tax$43.0 billion, 64%
Sales and Compensating
Use Taxes,$11.9 billion, 18%
Business Taxes$7.3billion, 11%
Excise and Use Taxes and Fees
$2.4 billion, 4%
Estate Tax$1.2 billion, 2%
Real Estate Transer Tax$0.9 billion, 1%
Other Taxes and Fees$0.2 billion, 0%
Source: New York State Department of Taxation and Finance, Annual Statistical Report, 2013-2014 New York State Tax Collections, November 2014, ble 2.
Total taxes$66.9 billion
A. Personal income tax New York’s Personal Income Tax (PIT) is imposed on the entire income of New York residents and on the New York-source income of non-residents. Modifications are made to Federal adjusted gross income in determining New York State adjusted gross income (NYS AGI), and taxpayers who itemize deductions are not able to deduct state and local income taxes paid. There are also limits on itemized deductions for high income taxpayers with deductions completely eliminated, except for 50 percent of charitable contributions, for NYS AGI above $1 million.11
11 For a more detailed discussion of the state PIT, see New York State Department of Taxation and Finance, Handbook of New York State and Local Taxes, October 2012, pp. 3-12.
FPI January 13, 2015 20
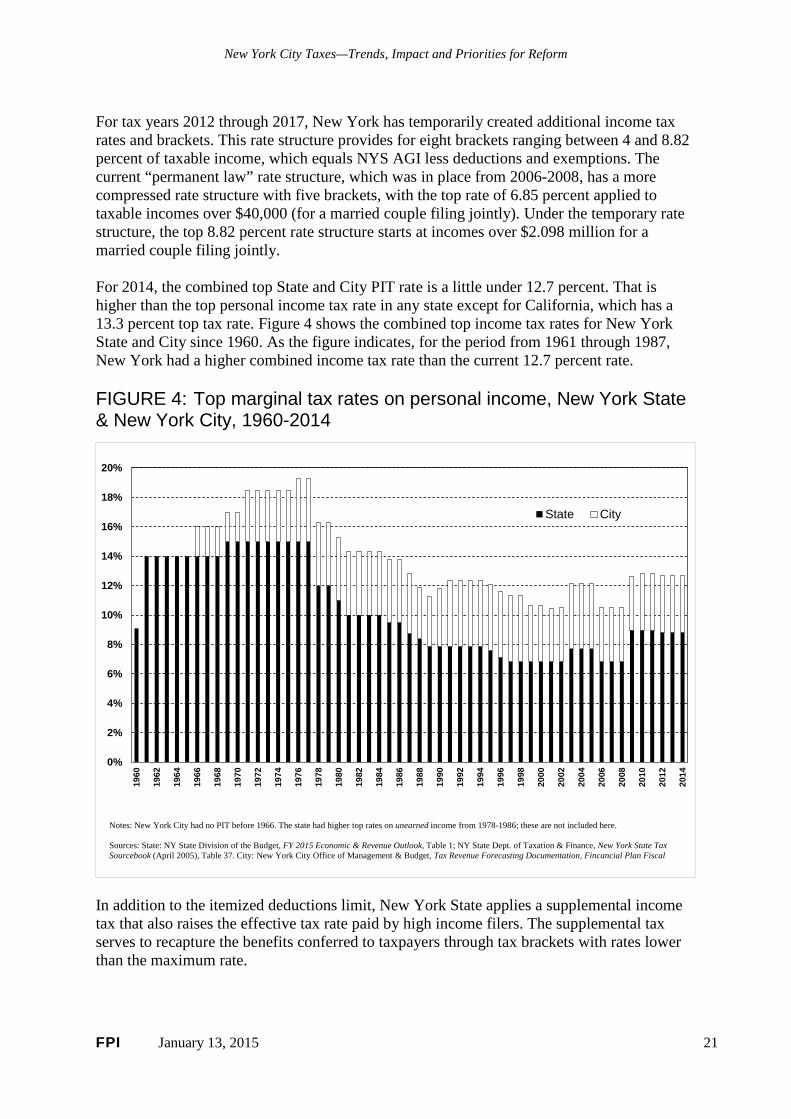
New York City Taxes—Trends, Impact and Priorities for Reform
For tax years 2012 through 2017, New York has temporarily created additional income tax rates and brackets. This rate structure provides for eight brackets ranging between 4 and 8.82 percent of taxable income, which equals NYS AGI less deductions and exemptions. The current “permanent law” rate structure, which was in place from 2006-2008, has a more compressed rate structure with five brackets, with the top rate of 6.85 percent applied to taxable incomes over $40,000 (for a married couple filing jointly). Under the temporary rate structure, the top 8.82 percent rate structure starts at incomes over $2.098 million for a married couple filing jointly. For 2014, the combined top State and City PIT rate is a little under 12.7 percent. That is higher than the top personal income tax rate in any state except for California, which has a 13.3 percent top tax rate. Figure 4 shows the combined top income tax rates for New York State and City since 1960. As the figure indicates, for the period from 1961 through 1987, New York had a higher combined income tax rate than the current 12.7 percent rate. FIGURE 4: Top marginal tax rates on personal income, New York State & New York City, 1960-2014
0%
2%
4%
6%
8%
10%
12%
14%
16%
18%
20%
1960
1962
1964
1966
1968
1970
1972
1974
1976
1978
1980
1982
1984
1986
1988
1990
1992
1994
1996
1998
2000
2002
2004
2006
2008
2010
2012
2014
State City
Notes: New York City had no PIT before 1966. The state had higher top rates on unearned income from 1978-1986; these are not included here.
Sources: State: NY State Division of the Budget, FY 2015 Economic & Revenue Outlook, Table 1; NY State Dept. of Taxation & Finance, New York State Tax Sourcebook (April 2005), Table 37. City: New York City Office of Management & Budget, Tax Revenue Forecasting Documentation, Fincancial Plan Fiscal
In addition to the itemized deductions limit, New York State applies a supplemental income tax that also raises the effective tax rate paid by high income filers. The supplemental tax serves to recapture the benefits conferred to taxpayers through tax brackets with rates lower than the maximum rate.
FPI January 13, 2015 21

New York City Taxes—Trends, Impact and Priorities for Reform
New York State allows an Earned Income Tax Credit equal to 30 percent of the corresponding federal credit. About 1.6 million New York State households with more than 2 million children receive the state EITC. The State has several other income tax credits, including a real property tax circuit breaker credit that provides a modest amount of relief for households paying high property taxes relative to their income.12 The State has various other personal income tax credits, including some that are business tax credits for taxpayers whose income includes business income. Unlike New York City, the state does not tax unincorporated businesses. However, the State does charge an annual Limited Liability Company/Limited Liability Partnership (LLC/LLP) and general partnership filing fee that ranges from $25 for small LLCs/LLPs to $4,500 for LLCs and partnerships with New York source gross income greater than $25 million.
B. Business income taxes New York State has a corporate franchise tax that applies to general business corporations; separate taxes for insurance companies, utility and related corporations; and a gross receipts tax for petroleum businesses.13 In March 2014, the State enacted a corporate tax reform package that repeals a separate bank tax and includes banks under the corporate franchise tax, while reducing the corporate income tax for manufacturers to zero percent. The 2014 corporate tax reform also reduced the corporate income tax rate for all other corporate taxpayers from 7.1 to 6.5 percent beginning in 2016.14 Even before the recent tax reform, which reduced corporate taxes, the corporate tax share of total state tax revenues declined from an average of 14.5 percent during the 1980-98 period to 9.3 percent in 2014.15 The corporate share of New York taxes has dropped sharply in recent years as the annual cost of a rapidly growing number of state business tax credits tripled between 2005 and 2014. For 2014, business tax credits cost the State over $1.8 billion or 20 percent of what corporate tax collections would have been without the credits. An in-depth analysis of New York’s state business tax credits, prepared by economists Marilyn Rubin and Don Boyd for Governor Cuomo’s Solomon-McCall Tax Reform and Fairness Commission, found that the tax credits are highly concentrated among a small number of tax filers, and that lower taxes for some businesses mean higher effective tax rates for the vast majority of businesses. Rubin and Boyd noted that, despite the high and growing cost, New York’s tax credits are “rarely evaluated rigorously and independently against their goals.” Moreover, in 2013, refundable
12 The amount of the permanent circuit breaker credit has been capped for years at $75 for a non-elderly household, although many organizations, including the Fiscal Policy Institute, have suggested that the circuit breaker be enhanced as the most effective way to provide property tax relief targeted to those households paying high property taxes relative to their income. In 2014, as a counterpart measure for New York City to a temporary property tax credit (the “freeze credit”) applied outside of New York City, a refundable circuit breaker credit against the City’s PIT was established on a two-year basis (tax years 2014 and 2015) for both homeowners and renters. Eligibility for the New York City circuit breaker provision was limited to households with incomes below $200,000 and the formula structured to reduce the credit rate as incomes increase above $100,000. New York State Department of Taxation and Finance, Summary of Tax Provisions in SFY 2014-15 Budget, April 2014, p. 10. 13 For a description of the various business taxes, see Handbook of New York State and Local Taxes, pp.13-24. 14 For a summary of the 2014 state corporate tax reform, see New York State Department of Taxation and Finance, Summary of Tax Provisions in SFY 2014-15 Budget, April 2014, pp. 5-8. 15 Calculated from Tables 1 and 5 in New York State Department of Taxation and Finance, 2013-2014 New York State Tax Collections, August 2014, and the 2012-2014 volume for 1980-1984 data.
FPI January 13, 2015 22

New York City Taxes—Trends, Impact and Priorities for Reform
credits accounted for 92 percent of all credits.16 With a refundable credit, businesses receive the difference if the benefit exceeds the business’s tax liability. (See Appendix Figure 1 for the growth in New York State business tax credits, 1994-2014.) Under State law, the Metropolitan Transportation Authority (MTA) applies a surcharge to business taxes in the 12-county downstate MTA district that generates roughly $1 billion annually to support MTA subway, commuter rail, and bus operations.
C. Sales tax New York State imposes a 4 percent sales tax on retail sales of tangible personal property (unless specifically exempted) and to certain services. The sales tax applies to food and beverages sold by restaurants, to utility services including telephone services, and to hotel occupancy. Several categories of services are exempt from the sales tax, including medical care, education, and personal and professional services. Cable television and internet services are not subject to the sales tax. Cities and counties are authorized to impose a local sales tax. The State also imposes an additional sales tax rate of 0.375 percent in the 12-county downstate MTA district. The state sales tax on gasoline and highway use of diesel fuel is imposed at a fixed rate of 8 cents per gallon (8.75 cents per gallon in the MTA district). The State also taxes estates and has a real estate transfer tax.
16 Marilyn M. Rubin and Donald J. Boyd, New York State Business Tax Credits: Analysis and Evaluation, A Report Prepared for the New York State Tax Reform and Fairness Commission, H. Carl McCall and Peter J. Solomon, co-chairpersons, November 2013.
FPI January 13, 2015 23

New York City Taxes—Trends, Impact and Priorities for Reform
5. New York State and City tax burden relative to other
states and areas Tax burden reflects the magnitude of tax payments relative to tax capacity. Tax burden provides an indication of the gross impact of taxation on an individual or a given taxing jurisdiction. Tax capacity is usually measured by income or ability to pay. Tax burden comparisons can be made in a range of ways, e.g., on an overall basis across tax jurisdictions such as states or cities. Comparisons also can be made among households, either across income levels or income groups (e.g., income quintiles) in a given tax jurisdiction or across jurisdictions. Finally, comparisons can be made over time at the aggregate level or across income brackets or groups. This section will consider overall tax burden comparisons for New York State and New York City. Section 6 will consider tax burden comparisons across income levels and groups in the state and the city. The tax capacity measure that is most often used in inter-state tax burden comparisons is personal income, likely because of the ready availability of annual state personal income data from the U.S. Bureau of Economic Analysis. However, given important features of New York’s state and local tax structure, personal income is, in many respects, of limited value in providing a good indication of relative tax burden. First, hundreds of thousands of out-of-state commuters work in New York, and yet their personal income derived from work in New York (on which they pay New York State personal income tax) is not included in the tax burden calculation. Secondly, both the state and the city tax corporate profits, and yet corporate profits are not included in personal income. And third, while net capital gains realizations are taxed by both the state and the city, capital gains are not counted as part of personal income. Keeping these limitations in mind, Subsections A and B will discuss tax burden comparisons using total personal income as the tax capacity gauge. New York City’s Independent Budget Office (IBO) has developed a Gross Taxable Resources (GTR) measure that makes adjustments for these, and other methodological limits to the personal income measure. Subsections C and D below discuss tax burden comparisons developed by the IBO using Gross Taxable Resources as the tax capacity measure.
A. Combined New York State and local taxes, relative to other states
Most state and local government expenses around the country are funded through a combination of state and local taxes, with local taxes bearing an average of 38 percent of combined state and local taxes for all states. However, in New York, partly because the state requires local governments to pay a significant share of Medicaid costs, local governments bear more than half (53 percent) of total state and local taxes. In fact, local governments in New York provide the third-highest share of state and local taxation among all 50 states.17 Because of New York’s greater reliance on local taxes, total local taxes in New York State relative to personal income rank highest among all 50 states. Overall, combining both state
17 Only Colorado (57 percent) and New Hampshire (56 percent) have a higher local share of state and local taxes than New York State. Among neighboring states, the local share ranges from a low of 14 percent in Vermont, to 49 percent in New Jersey. FPI calculations based on Table 6b, p.151 in New York State Division of the Budget, FY 2015 Economic and Revenue Outlook, January 2014.
FPI January 13, 2015 24

New York City Taxes—Trends, Impact and Priorities for Reform
and local taxes, New York State ranks third highest among states, with $14.30 in taxes for each $100 in state personal income. The average for the 50 states is $10.20 in state and local taxes per $100 of income. Of New York’s $14.30 combined total, $7.58 is from local taxes and $6.71 from state taxes. While New York’s local tax burden is the highest in the nation, New York’s state taxes rank 15th in the nation. From the table below, it is clear that most ($3.71) of the amount by which New York state and local taxes exceed the 50-state average ($4.10) is due to local taxes—in fact, New York’s great reliance on local taxation accounts for 90 percent of the differential. FIGURE 5: 10 states with greatest combined state and local burden (taxes relative to personal income), 2011
Taxes per $100 personal income
Rank among 50 states
Taxes per $100 personal income
Rank among 50 states
Taxes per $100 personal income
Rank among 50 states
Average, 50 states 6.32 3.88 10.20
Alaska 15.90 1 5.04 5 20.94 1
North Dakota 11.82 2 2.74 46 14.57 2
New York 6.71 15 7.58 1 14.30 3Wyoming 8.82 16 4.34 15 13.16 4
Maine 7.12 10 4.60 8 11.72 5
Vermont* 10.00 3 1.68 50 11.68 6
New Jersey 5.77 27 5.51 2 11.28 7
West Virginia 8.31 6 2.81 45 11.12 8
Minnesota 7.85 9 3.26 37 11.11 9
Wisconsin 6.61 16 4.42 13 11.03 10
NY difference from the 50-state avg. 0.39 3.71 4.10
State taxes Local taxes Total state and local taxes
Source: New York State Division of the Budget, FY 2015 Economic and Revenue Outlook , January 2014, Tables 3, 5 and 6b (based on U.S. Census of State and Local Government Finances, and Div. of the Budget staff estimates).
* Vermont's state tax burden is high and its local tax burden low largely because the state imposes a property tax to finance public schools.
Contrary to popular perception, New York’s combined state and local tax burden today is less than what it was in 1977. In that year, New York’s state tax burden relative to $100 in personal income was $7.39, 10 percent greater than in 2011, and the local tax burden was $8.09, nearly seven percent higher than in 2011. Overall, the state’s combined state and local taxes relative to personal income was second highest in the nation. Alaska had the highest tax burden then, and Massachusetts was third highest among the states in 1977.18 Looking back over the past 50 years, New York’s state taxes peaked as a share of personal income in 1973, when the share was slightly higher than in 1977. From 1973 to 2012, personal income in New York grew by 6.1 percent a year on average while state taxes rose 5.7 percent annually.19
18 New York State Division of the Budget, FY 2015 Economic and Revenue Outlook, January 2014, Table 6a. 19 Fiscal Policy Institute, New York State Economic and Fiscal Outlook, 2014-2015, February, 2014, p. 7. New York State government grew rapidly from the mid-1960s to the mid-1970s as the number of state university facilities dramatically increased and the federal Medicaid program was established which required at least 50 percent matching state funding (with New York State initially requiring local governments to pay half of the non-federal share).
FPI January 13, 2015 25

New York City Taxes—Trends, Impact and Priorities for Reform
B. New York State vs. local tax burden, 1995-2012
Census Bureau data on state and local government finances and data on New York City taxes from the City Comptroller’s annual financial report allow one to examine comparative trends in taxes relative to personal income for New York State, New York City and for all other local governments in New York as a group. Data in figure 6 show that while there has been only a very slight (two percent) increase in the total state and local tax burden in New York from 1995 to 2012, New York City’s local tax burden has increased by 8 percent over that period, while the overall state tax burden has been flat and the local tax burden outside of New York City declined slightly. New York City property taxes increased by 10 percent from 1995 to 2012, whereas total property taxes at the local level elsewhere in the state declined by four percent. Figure 6 shows that local taxes for the rest of the state outside of New York City are much lower than for the city. Business income taxes in the city account for much of this difference. However, it should be kept in mind that local taxes generally are much higher in the five New York City suburban counties—Nassau, Suffolk, Westchester, Putnam, and Rockland—than in the 52 upstate counties. An analysis by the Fiscal Policy Institute using 2002 data showed that local taxes were $3,086 per capita in the five suburban counties, but a little over half that, $1,571 per capita, in the 52 upstate counties.20 This general relationship likely continues in 2015. State business income taxes relative to personal income fell by 22 percent between 1995 and 2012, while New York City’s business income tax burden rose by one-quarter. One of the things that has helped offset the relative decline in state business income taxes has been the increase in taxes dedicated to the Metropolitan Transportation Authority, included in the “Other taxes” category in the figure.
20 Fiscal Policy Institute, Balancing New York State’s 2006-2007 Budget in an Economically Sensible Manner, January 2006, p. 40.
FPI January 13, 2015 26

New York City Taxes—Trends, Impact and Priorities for Reform
FIGURE 6: New York State and Local Taxes per $100 of Personal Income, FY 1995, 2000, 2005, and 2012
FY 1995 FY 2000 FY 2005 FY 2012 1995-2000 2000-2005 2005-2012 1995-2012TOTAL State and Local Taxes $14.72 $13.84 $14.86 $14.98 -6% 7% 1% 2%
State taxes $7.08 $6.65 $6.82 $7.06 -6% 3% 4% 0% Personal income tax $3.63 $3.70 $3.73 $3.83 2% 1% 3% 5% Business income taxes $0.58 $0.44 $0.37 $0.45 -24% -16% 22% -22% General sales tax $1.41 $1.36 $1.46 $1.18 -3% 7% -20% -17% Other taxes $1.45 $1.15 $1.25 $1.61 -21% 9% 28% 11%
All local taxes $7.64 $7.19 $8.05 $7.92 -6% 12% -2% 4% Property tax $4.70 $4.02 $4.54 $4.70 -15% 13% 4% 0% Personal income tax $0.75 $0.87 $0.90 $0.86 15% 3% -4% 15% Business income taxes $0.45 $0.52 $0.56 $0.59 17% 7% 5% 31% General sales tax $1.23 $1.26 $1.34 $1.29 2% 6% -4% 4% Other taxes $0.51 $0.53 $0.71 $0.48 4% 35% -32% -5%
New York City taxes $8.51 $8.08 $9.38 $9.20 -5% 16% -2% 8% General property tax $3.62 $2.87 $3.56 $3.98 -21% 24% 12% 10% Personal income tax $1.73 $1.95 $2.02 $1.87 13% 4% -8% 8% Business income taxes $1.04 $1.19 $1.28 $1.30 14% 7% 2% 25% General sales tax $1.26 $1.28 $1.33 $1.27 2% 4% -4% 1% Other taxes $0.86 $0.79 $1.19 $0.78 -8% 50% -34% -9%
Local taxes outside of NYC $6.98 $6.49 $7.01 $6.86 -7% 8% -2% -2% General property tax $5.52 $4.91 $5.30 $5.29 -11% 8% 0% -4% General sales tax $1.21 $1.24 $1.35 $1.30 3% 9% -4% 7% Other taxes $0.26 $0.34 $0.36 $0.27 31% 6% -25% 4%
All local taxes as a share of total 52% 52% 54% 53%
Sources: U.S. Census Bureau, Census of Governments: State and Local Government Finances, U.S. Bureau of Economic Analysis, State and Local Area Personal Income (for the prior calendar year); New York City Comptroller, Comprehensive Annual Financial Reports, FY 2001, 2014 (NYC Comprehensive Annual Financial Reports include annual tax data for prior 10 years).
Taxes per $100 personal income Percent change
C. Intra-New York State tax burden comparisons using a broader tax capacity measure
In 2011, the New York City IBO published a report that used a Gross Taxable Resources (GTR) measure of tax capacity to gauge relative total state and local tax effort for New York City and other regions in the state. The IBO defined GTR for each area as personal income plus “business income.”21 The IBO included all state and local taxes collected within a county or region but excluded “exported” taxes wholly or largely paid by out-of-state visitors and commuters, including hotel taxes and non-resident personal income taxes. Considering refundable personal income tax credits as a form of government spending for income support payments, the IBO’s accounting added those back to both the tax side and the spending side. Dedicated taxes to support the MTA, such as the business income tax surcharge, were counted as local taxes.
21 The IBO referred to “business income” as “the surpluses generated by businesses in the region” (or “business capital value added”). New York City Independent Budget Office, Tax Effort and Spending Effort Across New York State, December 2011.
FPI January 13, 2015 27

New York City Taxes—Trends, Impact and Priorities for Reform
The IBO report used state and local tax data for 2004-2005. With the adjustments indicated above, and a few other minor adjustments, the IBO estimated that New York’s total state and local taxes were $108.1 billion in 2004-05, with $45.9 billion in state taxes and $62.2 billion in local taxes. This made the local share 58 percent of the total, compared to 54 percent on a reported basis without IBO’s adjustments. On the taxable resources side, including business income considerably augmented the tax base measure. For the 2004-2005 period IBO considered, total resident personal income in New York State was $792.3 billion, and total business income was $319.5 billion. Overall, New York’s Gross Taxable Resources totaled $1,111.8 billion ($1.1 trillion). Because New York City’s economy is a major part of the state’s, New York City accounted for 57.8 percent of all business income, while it had a 42.6 percent share of total state personal income. Statewide, business income represented nearly 29 percent of GTR. However, New York City’s business income was 35 percent of GTR, while for the rest of the state business income was only 23 percent of GTR.22 On a combined basis, the IBO estimated that state and local taxes were $10.05 per every $100 of GTR in New York City in 2004-2005. For the rest of the state, state and local taxes were $9.45 per $100 of GTR. Local taxes were estimated to be $6.28 in New York City, considerably higher than the $4.99 for the rest of the state, while state taxes represented $3.76 per $100 GTR in New York City and $4.46 for the rest of the state. Because of generally high property taxes, and the fact that the state’s personal income tax is the single largest tax source in the state and has a mildly progressive rate structure, the high-income suburban “Downstate” area (comprised of the five suburban downstate counties) has a higher combined state and local tax effort than New York City, $10.32 per $100 GTR versus $10.05.
22 IBO, Tax Effort and Spending Effort Across New York State, p. 4.
FPI January 13, 2015 28
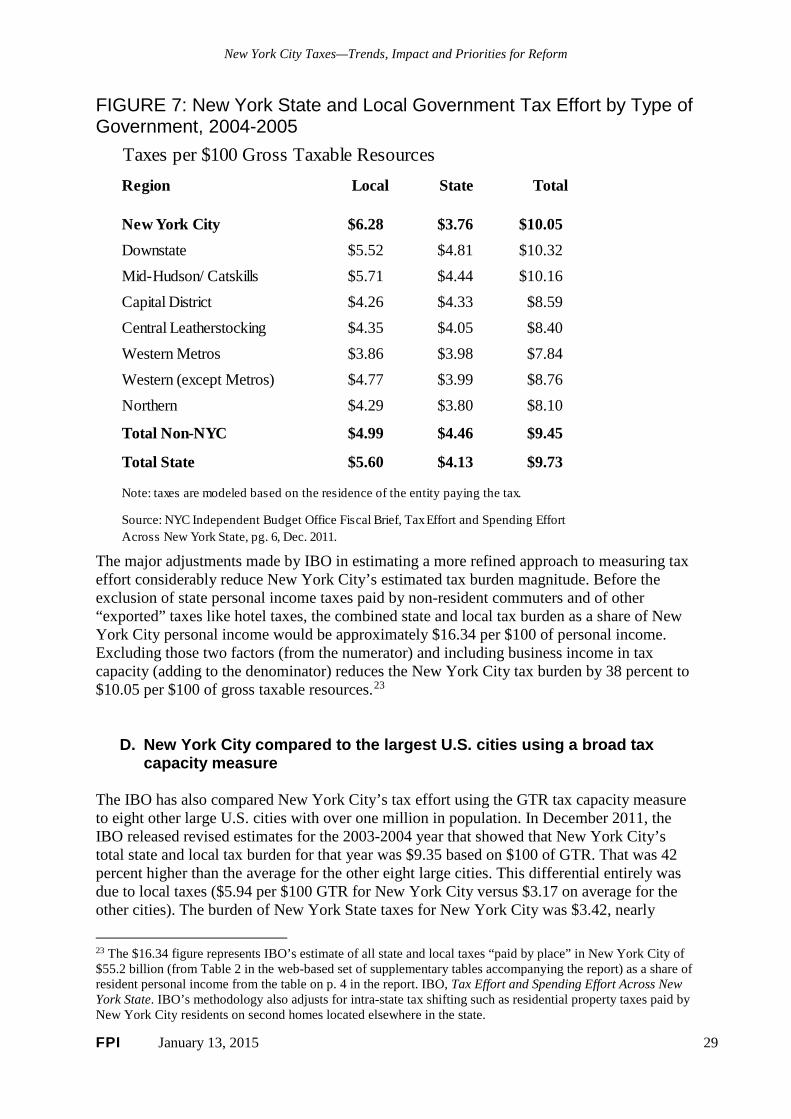
New York City Taxes—Trends, Impact and Priorities for Reform
FIGURE 7: New York State and Local Government Tax Effort by Type of Government, 2004-2005
Taxes per $100 Gross Taxable ResourcesRegion Local State Total
New York City $6.28 $3.76 $10.05Downstate $5.52 $4.81 $10.32Mid-Hudson/ Catskills $5.71 $4.44 $10.16Capital District $4.26 $4.33 $8.59Central Leatherstocking $4.35 $4.05 $8.40Western Metros $3.86 $3.98 $7.84Western (except Metros) $4.77 $3.99 $8.76Northern $4.29 $3.80 $8.10
Total Non-NYC $4.99 $4.46 $9.45
Total State $5.60 $4.13 $9.73
Note: taxes are modeled based on the residence of the entity paying the tax.
Source: NYC Independent Budget Office Fiscal Brief, Tax Effort and Spending Effort Across New York State, pg. 6, Dec. 2011.
The major adjustments made by IBO in estimating a more refined approach to measuring tax effort considerably reduce New York City’s estimated tax burden magnitude. Before the exclusion of state personal income taxes paid by non-resident commuters and of other “exported” taxes like hotel taxes, the combined state and local tax burden as a share of New York City personal income would be approximately $16.34 per $100 of personal income. Excluding those two factors (from the numerator) and including business income in tax capacity (adding to the denominator) reduces the New York City tax burden by 38 percent to $10.05 per $100 of gross taxable resources.23
D. New York City compared to the largest U.S. cities using a broad tax capacity measure
The IBO has also compared New York City’s tax effort using the GTR tax capacity measure to eight other large U.S. cities with over one million in population. In December 2011, the IBO released revised estimates for the 2003-2004 year that showed that New York City’s total state and local tax burden for that year was $9.35 based on $100 of GTR. That was 42 percent higher than the average for the other eight large cities. This differential entirely was due to local taxes ($5.94 per $100 GTR for New York City versus $3.17 on average for the other cities). The burden of New York State taxes for New York City was $3.42, nearly
23 The $16.34 figure represents IBO’s estimate of all state and local taxes “paid by place” in New York City of $55.2 billion (from Table 2 in the web-based set of supplementary tables accompanying the report) as a share of resident personal income from the table on p. 4 in the report. IBO, Tax Effort and Spending Effort Across New York State. IBO’s methodology also adjusts for intra-state tax shifting such as residential property taxes paid by New York City residents on second homes located elsewhere in the state.
FPI January 13, 2015 29

New York City Taxes—Trends, Impact and Priorities for Reform
identical to the $3.41 average for the other cities. This echoes the earlier finding that the overall state and local tax burden in New York is largely due to local taxes, since state taxes are fairly close to the fifty-state average. In fact, for Los Angeles and San Diego, the state tax burden relative to GTR is $4.16 and $4.06, respectively, greater than for New York City. Houston’s state tax burden ($3.52) is also higher than New York City’s state tax burden.24 In its 2007 report, Comparing State and Local Taxes in Large U.S. Cities, the IBO looked at the impact of New York State’s requirement that local governments share in the cost of Medicaid, public assistance and other income transfer programs. Most states fund such expenses entirely or largely through state taxation. The IBO concluded that the local cost-sharing requirement for Medicaid and other programs accounted for over half of the tax effort differential between New York City and the other large cities.25
24 Appendix Table A-1 in the online supplementary tables accompanying the Dec. 2011 report, IBO Tax Effort and Spending Across New York State. The link to the supplementary tables is on p. 22: http://www.ibo.nyc.ny.us/iboreports/tnydec2011.pdf. 25 New York City Independent Budget Office, Comparing State and Local Taxes in Large U.S. Cities, February, 2007, pp. 7-10.
FPI January 13, 2015 30
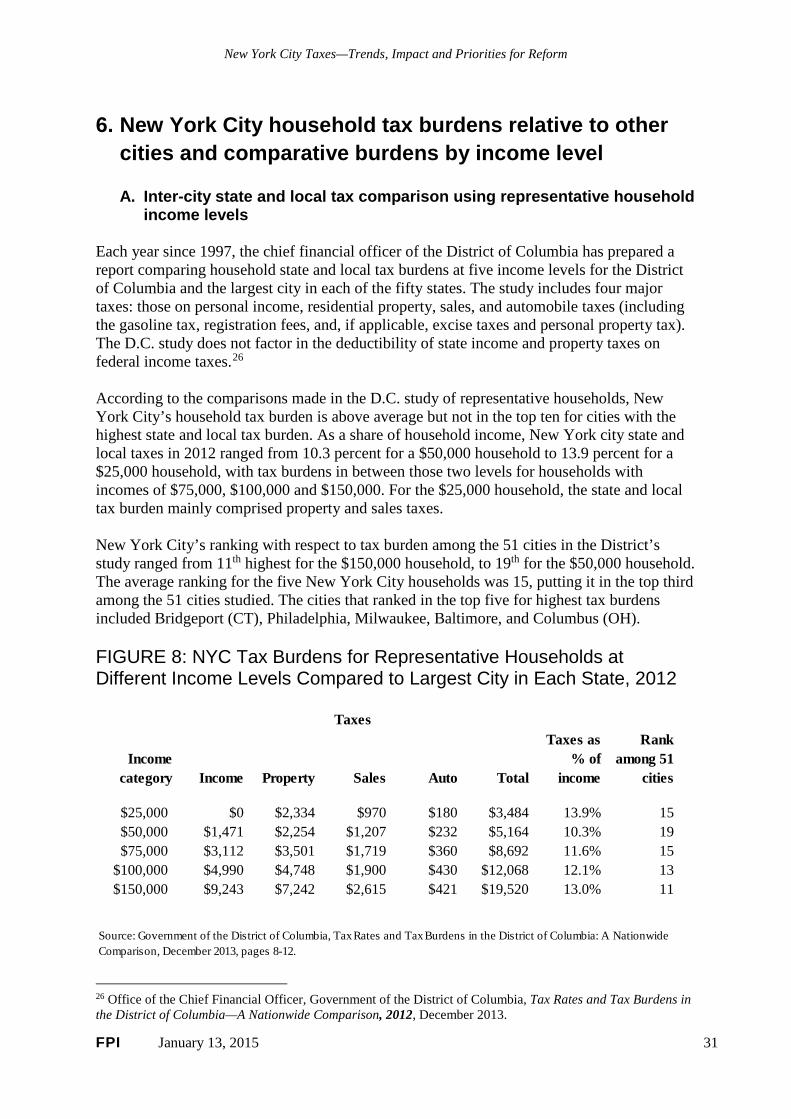
New York City Taxes—Trends, Impact and Priorities for Reform
6. New York City household tax burdens relative to other
cities and comparative burdens by income level
A. Inter-city state and local tax comparison using representative household income levels
Each year since 1997, the chief financial officer of the District of Columbia has prepared a report comparing household state and local tax burdens at five income levels for the District of Columbia and the largest city in each of the fifty states. The study includes four major taxes: those on personal income, residential property, sales, and automobile taxes (including the gasoline tax, registration fees, and, if applicable, excise taxes and personal property tax). The D.C. study does not factor in the deductibility of state income and property taxes on federal income taxes.26 According to the comparisons made in the D.C. study of representative households, New York City’s household tax burden is above average but not in the top ten for cities with the highest state and local tax burden. As a share of household income, New York city state and local taxes in 2012 ranged from 10.3 percent for a $50,000 household to 13.9 percent for a $25,000 household, with tax burdens in between those two levels for households with incomes of $75,000, $100,000 and $150,000. For the $25,000 household, the state and local tax burden mainly comprised property and sales taxes. New York City’s ranking with respect to tax burden among the 51 cities in the District’s study ranged from 11th highest for the $150,000 household, to 19th for the $50,000 household. The average ranking for the five New York City households was 15, putting it in the top third among the 51 cities studied. The cities that ranked in the top five for highest tax burdens included Bridgeport (CT), Philadelphia, Milwaukee, Baltimore, and Columbus (OH). FIGURE 8: NYC Tax Burdens for Representative Households at Different Income Levels Compared to Largest City in Each State, 2012
Income category Income Property Sales Auto Total
Taxes as % of
income
Rank among 51
cities
$25,000 $0 $2,334 $970 $180 $3,484 13.9% 15$50,000 $1,471 $2,254 $1,207 $232 $5,164 10.3% 19$75,000 $3,112 $3,501 $1,719 $360 $8,692 11.6% 15
$100,000 $4,990 $4,748 $1,900 $430 $12,068 12.1% 13$150,000 $9,243 $7,242 $2,615 $421 $19,520 13.0% 11
Taxes
Source: Government of the District of Columbia, Tax Rates and Tax Burdens in the District of Columbia: A Nationwide Comparison, December 2013, pages 8-12.
26 Office of the Chief Financial Officer, Government of the District of Columbia, Tax Rates and Tax Burdens in the District of Columbia—A Nationwide Comparison, 2012, December 2013.
FPI January 13, 2015 31

New York City Taxes—Trends, Impact and Priorities for Reform
B. Comparison across representative New York City household income levels
In early 2013, the Tax Policy Staff at the New York State Department of Taxation and Finance prepared an assessment of the New York City local tax burden for several representative household income levels (assuming a four-person household with two dependents). Overall, the analysis found that the City’s local tax structure is regressive, with low-income households paying a higher share of their income in New York City personal income, property, and sales taxes than did high-income households. For example, a $25,000 household paid 10.3 percent of income in local taxes, while a wealthy household with $5 million in annual income paid slightly more than half that, 5.3 percent of income. While the City’s personal income tax is mildly progressive, with refundable tax credits for low-income households and slightly progressive income tax rates, the local sales tax is regressive, and the City’s property tax is highly regressive.27 FIGURE 9: New York City Local Tax Burden, by Income for a Typical Four-person Household
IncomePersonal
income taxLocal
sales taxReal
property tax TOTAL
$25,000 -0.6% 2.1% 8.8% 10.3%$50,000 1.8% 1.7% 4.6% 8.1%$75,000 2.4% 1.5% 3.5% 7.4%
$100,000 2.5% 1.3% 2.9% 6.7%$250,000 3.1% 0.8% 2.1% 6.0%$500,000 3.2% 0.7% 2.7% 6.6%
$1,000,000 3.5% 0.6% 2.1% 6.2%$2,000,000 3.7% 0.5% 1.6% 5.8%$5,000,000 3.8% 0.4% 1.1% 5.3%
Percent of Income
Note: Typical four-person household including two adults and two dependents. Property tax is only for owner-occupied housing, i.e., no assumption is made about the share of property taxes included in rent.
Source: New York State Office of Tax Policy, New York State Tax Burden Study , Prepared for the New York State Tax Reform and Fairness Commision, Final Report, Nov. 2013, pg. A-18.
27 Office of Tax Policy, New York State Department of Taxation and Finance, New York State Tax Burden Study, Prepared for the New York State Tax Reform and Fairness Commission, April 2013, published in the New York State tax Reform and Fairness Commission, Final Report, November 2013, Appendix pp. A-1 to A-18. The study included a representative household with $15,000 in income but excluded any estimate of property taxes paid for such households.
FPI January 13, 2015 32
New York City Taxes—Trends, Impact and Priorities for Reform
C. New York State and local tax burden by income quintiles
The two preceding subsections have considered the tax burden for representative household income levels. The Washington, D.C.-based Institute on Taxation and Economic Policy (ITEP) analyzed the total incidence of all state and local taxes for each of the fifty states by income quintile, that is, by considering all households in the income distribution. Because of the pronounced polarization of income in recent years, the top quintile was divided into three subsets (the richest one percent, the next four percent, and the next 15 percent). ITEP’s analysis not only looked at the taxes directly borne by households but also considers the incidence on households of sales and excise, property, and corporate income taxes paid by businesses. ITEP factored in low-income tax credits such as the Earned Income Tax Credit and the Child Care and Dependent Credit, as well as considering the offset for the deductibility of state and local property and income taxes on federal income taxes. ITEP also factored in an estimate of the property taxes borne by renters. Based on ITEP’s analysis, the incidence of New York’s overall state and local taxation is regressive, with the top one percent of households paying a smaller share of their income in state and local taxes (8.1 percent including an offset for federal deductibility) than those in the lowest income quintile (who pay 10.4 percent). The middle quintile, those with incomes from $35,000 to $58,000), pay the greatest share of income (12 percent) in state and local taxes. Figure 10 below provides ITEP’s estimates for each of three categories of taxes (sales and excise, property, and income) by quintile and top percentiles. Figure 11 compares the total burdens. Again, as in the tax burden analysis of representative households by the State tax policy staff, ITEP’s study shows that the progressivity of the income tax is more than offset by the regressivity of sales and property taxes.
FPI January 13, 2015 33

New York City Taxes—Trends, Impact and Priorities for Reform
FIGURE 10: New York State & Local Tax Burden by Income Quintiles and Top Incomes, 2015
Income Lowest Second Middle FourthGroup 20% 20% 20% 20% Next 15% Next 4% TOP 1%
Income Less than $18,000 – $35,000 – $58,000 – $99,000 – $214,000 – $604,000Range $18,000 $35,000 $58,000 $99,000 $214,000 $604,000 or more
Average Income in Group $10,500 $26,400 $46,300 $76,300 $137,400 $337,700 $2,720,980
Sales & Excise Taxes 7.6% 6.3% 5.0% 3.8% 2.9% 1.7% 0.9% General Sales—Individuals 3.7% 3.5% 2.9% 2.4% 1.9% 1.2% 0.6% Other Sales & Excise—Ind. 1.6% 0.9% 0.6% 0.4% 0.3% 0.1% 0.0% Sales & Excise on Business 2.3% 1.9% 1.4% 1.1% 0.8% 0.4% 0.2%
Property Taxes 6.3% 4.3% 4.2% 4.1% 4.3% 3.5% 2.0% Property Taxes on Families 5.6% 3.7% 3.6% 3.5% 3.7% 2.7% 0.7% Other Property Taxes 0.6% 0.6% 0.6% 0.6% 0.6% 0.8% 1.3%
Income Taxes -3.5% 0.4% 3.3% 4.5% 5.5% 6.6% 8.3% Personal Income Tax –3.5% 0.4% 3.3% 4.4% 5.5% 6.5% 8.0% Corporate Income Tax 0.0% 0.0% 0.0% 0.0% 0.0% 0.1% 0.3%
Total Taxes 10.4% 11.0% 12.4% 12.4% 12.8% 11.9% 11.1% Federal Deduction Offset –0.0% –0.1% –0.4% –1.0% –1.9% –1.1% –3.0%
OVERALL TOTAL 10.4% 11.0% 12.0% 11.4% 10.9% 10.8% 8.1%
Note: Based on taxes enacted in 2013 and 2014, including temporary personal income tax rates through 2017.
Source: Institute on Taxation and Economic Policy (ITEP), January 2015.
Top 20%
FIGURE 11: New York State & Local Tax Burden by Income Quintiles and Top Incomes, 2015
10.4% 11.0%
12.0% 11.4%
10.9% 10.8%
8.1%
0%
2%
4%
6%
8%
10%
12%
14%
Lowest 20%Less than$18,000
Second 20%$18,000 -$35,000
Middle 20%$35,000 -$58,000
Fourth 20%$58,000 -$99,000
Next 15%$99,000 -$214,000
Next 4%$214,000 -$604,000
Top 1%$604,000 or
more
Top 20%
Note: Shares of family income for non-elderly taxpayers.
Source: Institute on Taxation and Economic Policy (ITEP), January 2015.
FPI January 13, 2015 34
New York City Taxes—Trends, Impact and Priorities for Reform
7. New York City’s highly regressive overall household tax
burden No entity within the City of New York prepares an overall analysis of who pays New York City taxes. Former Mayor Bloomberg often pointed out that a relatively small number of very high-income taxpayers paid a large share of New York City income taxes. While that is correct, it is a little misleading if the point was to convey that high-income households are the main contributors to the support of City budget. Residential property taxes and sales taxes paid by city residents totaled over $10 billion in FY 2011 and were greater than the $7.2 billion paid in local personal income taxes.28 While the City’s personal income tax is mildly progressive, the City’s sales and property taxes are fairly regressive. Updated estimates made for this report conclude that the City taxes directly borne by City residents, including landlords’ property taxes paid indirectly by renters, have a regressive impact overall. This analysis includes the portion (about one-third) of the City’s Unincorporated Business Tax paid by City residents.29 Lower- and middle-income residents pay a much greater share of their income in City taxes than do the highest-income 5 percent of households. Figure 12 below shows that the bottom 60 percent of households (the lowest, second, and middle income quintiles) pay from 8.9 percent to 11 percent of their income in New York City taxes, roughly twice the share paid by the top five percent (indicated on the figure by the two bars on the right). Using the same tax burden analysis, the shares of New York City taxes borne by households of different income groups can be compared to each group’s share of income. Figure 13 below compares, for each of seven income groups, the share of total city income to the share of total city taxes. For example, the top one percent—tax filers with incomes over $600,000—received 35.3 percent of all income in 2011 but paid only 27 percent of local taxes in FY 2011. The next richest four percent—tax filers with incomes from roughly $175,000 to $600,000—had 15.5 percent of income and paid 13.7 percent of city taxes. The first four income quintiles—the “bottom 80 percent,” with incomes under $71,000—paid a greater share of City taxes than their share of city income. For the middle three quintiles, their tax shares exceeded their income shares by 2.6 to 2.8 percentage points. The relative disparity was greatest for the lowest income quintile, which paid a tax share two-and-a-half times their income share. This disparity at the bottom of the income ladder reflects the regressivity of the
28 The property and sales taxes paid by residents, including estimates of the property tax paid by renters, were estimated by the Fiscal Policy Institute using a range of government data sources, including tax incidence studies by the NYS Department of Tax and Finance and the Institute on Taxation and Economic Policy, data on property taxes paid by homeowners, and estimates of rental payments for New York City residents from the American Community Survey. For purposes of this analysis, drawing from data compiled by the Rent Guidelines Board, it was assumed that, on average, 25 percent of rent is for property taxes and that renters bear 20 percent of property tax burden on rental properties. The 20 percent assumption is drawn from the property tax incidence literature. The figure for City personal income taxes paid in 2011 is from an analysis by the Independent Budget Office. 29 The portion of the UBT paid by city residents was estimated from the UBT credit on the personal income tax. A portion of the UBT is paid by non-residents who operate businesses subject to the UBT in New York City, and a portion is paid by corporations that own LLCs, LLPs, or other business entities subject to the UBT. The City Finance Department’s annual tax expenditure report provides data by income range for the UBT credit on the personal income tax. The incidence of the UBT paid by residents is very progressive; in FY 2011, the top one percent of City income tax filers paid 84 percent of UBT taxes paid by residents.
FPI January 13, 2015 35

New York City Taxes—Trends, Impact and Priorities for Reform
sales tax and the fact that rental properties bear a much higher effective property tax than do owner-occupied housing. FIGURE 12: NYC has a regressive local tax burden (income, sales, and property tax), with low- and middle-income households in 2011 paying a higher share of their incomes in NYC taxes than did the wealthiest 5%.
10.5%11.0%
8.9%
7.8%
6.5%5.8%
5.1%
0%
2%
4%
6%
8%
10%
12%
Lowest 20%(up to $9,211)
Second 20%($9,212 to$20,627)
Middle 20 %($20,628 to
$38,340)
Fourth 20%($38,341 to
$71,014)
Next 15%($71,015 to$174,399)
Next 4%($174,400 to
$598,412)
Top 1%($598,413 and
above)
NYC
taxe
s as
sha
re o
f hou
seho
ld in
com
e
Household income groups
Source: Fiscal Policy Institute estimates based on NYS and NYC tax data for NYC residents, 2011. Includes Unincorporated Business Tax
FPI January 13, 2015 36
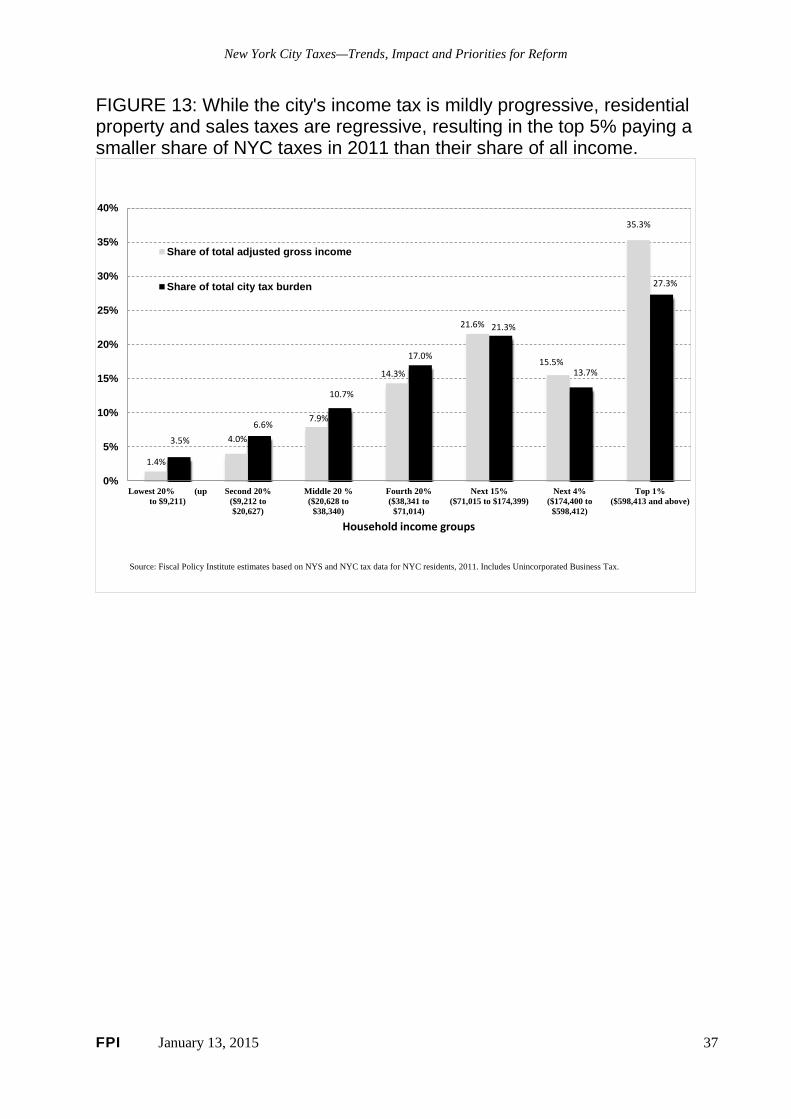
New York City Taxes—Trends, Impact and Priorities for Reform
FIGURE 13: While the city's income tax is mildly progressive, residential property and sales taxes are regressive, resulting in the top 5% paying a smaller share of NYC taxes in 2011 than their share of all income.
1.4%
4.0%
7.9%
14.3%
21.6%
15.5%
35.3%
3.5%
6.6%
10.7%
17.0%
21.3%
13.7%
27.3%
0%
5%
10%
15%
20%
25%
30%
35%
40%
Lowest 20% (upto $9,211)
Second 20%($9,212 to$20,627)
Middle 20 %($20,628 to
$38,340)
Fourth 20%($38,341 to
$71,014)
Next 15%($71,015 to $174,399)
Next 4%($174,400 to
$598,412)
Top 1%($598,413 and above)
Household income groups
Share of total adjusted gross income
Share of total city tax burden
Source: Fiscal Policy Institute estimates based on NYS and NYC tax data for NYC residents, 2011. Includes Unincorporated Business Tax.
FPI January 13, 2015 37

New York City Taxes—Trends, Impact and Priorities for Reform
8. Economic context and implications of New York’s high
taxes As has been discussed, several factors help account for New York City’s high local tax burden relative to other large U.S. cities. Some of these factors relate to peculiarities of New York State’s approach to sharing financial responsibilities with local governments, and some relate to more comprehensive approaches to gauging relative tax capacity. Compared to other states, New York’s state taxes fund a much smaller share of combined state and local spending, particularly for Medicaid and public assistance. New York State has been very slow to honor a commitment made in 2007 in response to the court’s finding in the Campaign for Fiscal Equity law suit that New York State was underfunding state school aid to New York City. In light of that continued underfunding, the City has substantially increased school funding out of local taxes. In addition, despite strenuous City Hall objections, the State eliminated the City’s commuter income tax in 1999. Taken together, these state actions have placed at least $10 billion in additional funding responsibility onto the shoulders of City taxpayers. The $10 billion includes $6.3 billion for Medicaid, $600 million for public assistance, $2 billion in school aid, and $860 million from the loss of the commuter tax.30 Total New York City taxes were $48.4 billion in 2014. Since businesses pay roughly 40 percent of New York City local taxes, it is important to include business income when gauging the city’s tax capacity and to factor out from the tax burden calculation taxes such as the hotel tax that are largely paid by domestic and foreign visitors. Another factor to keep in mind is that capital gains realizations, which are subject to the City’s personal income tax and which can be significant in New York City in years when financial markets soar, are not included in the U. S. Commerce Department’s estimates of personal income. In light of these considerations, crudely measuring local taxes relative to the city’s personal income provides a poor indication of the capacity of New York City’s households and businesses to shoulder the City’s local tax burden. However, even with all of these qualifications in mind, the fact remains that the local tax burden is high. Are these higher taxes a problem? As the nation’s major cultural and political link to the world, New York City has unique security expenses and tax-base exclusions; foreign consulates and the United Nations headquarters itself are not taxed. And New York City provides amenities—world-class parks, museums, and libraries, for example—that its residents seem to appreciate enough to “bear” these tax burdens. High taxes such as those in New York City pay for extensive, quality services— police and fire protection, recreation, cultural offerings, transportation and education—that may not be available as public services elsewhere. Vast numbers of businesses and households alike apparently choose to take advantage of these services in New York City despite their higher tax costs, rather than move to lower-tax, lower-service locations. The concentration of
30 NYC Office of Management and Budget, Adopted FY 2015 Budget Function Analysis, June 27, 2014 (Medicaid and Public Assistance); Mayor’s January 27, 2014 State Budget Testimony, January 27, 2014 (school aid shortfall); and NYC IBO, Budget Options for New York City, November 2014 (commuter tax estimate).
FPI January 13, 2015 38

New York City Taxes—Trends, Impact and Priorities for Reform
highly-rated public and private colleges in the city leads to an annual influx of highly- educated young people that businesses find attractive. 31 As to the argument that the city’s high tax burden discourages businesses from locating here, a recent report pointed out that
... those areas that have or are better able to attract a more highly educated and trained labor force may have a competitive advantage for economic activities requiring more highly skilled labor. Amenities and quality of life are important because there is increasing evidence that highly educated people who are residentially mobile and have a variety of job options favor areas with a high quality of life.32
It is not just local taxes that are high in New York City. Commercial rents and real estate prices are high, too, relative to most other areas, and that is widely seen as a function of the fact that the city’s dense concentration of economic activity makes possible a high level of business productivity.33 Regional economists refer to “agglomeration economies” that flow from dense concentrations of economic activity that bring together in a single area a diverse range of business customers, suppliers, and competitors. In turn, this dense concentration together with an extensive regional mass transit system creates a broad and deep labor market where highly-educated and skilled workers can command above-average compensation. Rather than signaling a problem, high taxes, high real estate prices, and high salaries characterize a highly productive location affording greater business and personal opportunities. Recognizing that a higher level of taxation is to be expected in a major international commercial and cultural capital is certainly not to explain away any concern with local taxation. It is just to urge more attention to relatives rather than absolutes. The previous section presented an analysis showing that the overall New York City local household tax burden is regressive; that is, lower- and middle-income households pay a higher share of their income in city taxes than do high-income households. The final section will outline various tax reform possibilities, including some that involve making the local income tax system more progressive, and measures to make property taxes less regressive. If one of the results of local tax reform is to make the overall local tax system more progressive, assuming no reduction in total tax collections, that would mean that some higher-income households would pay more. Some of the property tax reforms would involve shifting the property tax burden among middle-income households, but some of these same reforms will involve increasing taxes on some higher-income households.
31 Private colleges themselves benefit tremendously from public services, yet despite the fact that some are among the city’s largest landowners, they pay no property taxes on their educational facilities. 32 Hal Woman, Alice Levy, Garry Young, and Pamela Blumenthal (George Washington University), Economic Competitiveness and the Determinants of Sub-National Area Economic Growth” report for the Office of Revenue Analysis, District of Columbia Office of the Chief Financial Officer, September 30, 2008, p. 41. 33 See, for example, the New York City Independent Budget Office’s comparison of business gross operating surplus per capita for New York City and other large U.S. cities, Comparing State and Local Taxes in Large U.S. Cities, February, 2007, Table 1, p. 2.
FPI January 13, 2015 39

New York City Taxes—Trends, Impact and Priorities for Reform
In recent years, a lot of attention has been given to the issue of whether high-income households will move away if New York City raises income or other taxes on this group. In a report prepared for the Tax Reform and Fairness Commission appointed by Governor Andrew Cuomo and co-chaired by Peter Solomon and H. Carl McCall, the state’s tax policy staff observed: “There are a number of studies that explore the impacts of taxes on the migration behavior of households in the United States. These papers generally show that taxes have relatively little impact on cross-state migration . . . .34” In his recent review of the literature on the relationship of state and local taxes to inter-state migration, state tax policy expert Michael Mazerov noted:
The vast majority of academic research using sophisticated statistical techniques concludes that differences in state tax systems and levels do not have a significant impact on interstate migration. Seven economists (or groups of economists) have published studies on state taxes and migration in peer-review economics journals since 2000. Six of the seven studies concluded that taxes do not drive interstate moves. Eight additional studies... that were not published in academic journals have been released in the same period; six of the eight found either that state income taxes had no effect on migration or that the effect was small and inconsistent.35
Based on his extensive review of the latest literature and his own analysis of IRS data on interstate migration, Mazerov concluded:
Differences in tax levels among states have little to no effect on whether and where people move, contrary to claims by some conservative economists and elected officials. For decades, Americans have been moving away from the Northeast, the industrial Midwest, and the Great Plains to most of the southern and southwestern states regardless of overall tax levels or the presence of an income tax in any of these states. They’ve moved in large part for employment opportunities in the Sunbelt states and, secondarily, for less expensive housing, and, for many retirees, a warmer, snow-free climate.36
Even though New York City’s top earners have the second highest combined state and local income tax rates in the United States (after California), the number of New York City households with incomes of $1 million or more rose much faster between 2000 and 2011 than in the U.S. as a whole. Also, as Figure 14 indicates, the total income of those high-earners rose much faster in New York City than in the U.S. overall over the decade.
34 Office of Tax Policy Analysis, New York State Department of Taxation and Finance, “New York State Estate Tax Issues and Policy Options,” Appendix D, New York State Tax Reform and Fairness Commission, Final Report, November 2013, p. D-4. 35 Michael Mazerov, State Taxes Have a Negligible Impact on Americans’ Interstate Moves, Center on Budget and Policy Priorities, Updated May 21, 2014, p. 3. 36 Mazerov, Ibid., p. 1
FPI January 13, 2015 40

New York City Taxes—Trends, Impact and Priorities for Reform
FIGURE 14: The number of households with million dollar-plus incomes and their total incomes increased much faster between 2000 and 2011 in NYC than in the U.S.
41.5% 41.5%
26.2%24.4%
0%
5%
10%
15%
20%
25%
30%
35%
40%
45%
Change in number of returns of $1 million and up Change in aggregate AGI of returns of $1 million andup
New York CityUnited States
Note: AGI: NYS for NYC residents, Federal for U.S.
Source: New York City Independent Budget Office and IRS.
FPI January 13, 2015 41

New York City Taxes—Trends, Impact and Priorities for Reform
9. Trends in New York City taxes and tax expenditures
since 1980 It is important to keep in mind several key trends characterizing how city taxes have changed over the past three decades. Some of the trends reflect changes in the city’s economy and in consumer spending, while others have been determined to varying degree by City policy actions. Some of the trends result from City policies set in place years ago while others reflect more recent policy choices. The next section will provide an overview of explicit tax policy changes made since 1977.
A. Increased reliance on local taxes compared to state and federal aid Since 1980, local taxes have become more significant as the main funding source for the New York City budget. Between 1980 and 2010, the local tax share of City budget revenues increased from 53 percent to 59 percent, while the federal categorical grant share dropped sharply. The state categorical grant share of the City budget was 20 percent in 2010 compared to 17 percent in 1980, but it had hovered around 20 percent through most of the 1990s and the 2000s. The “Other local revenue” category is largely made up of miscellaneous revenues such as fees and fines, but it also includes the proceeds of asset sales and non-governmental grants. The share of budget revenues from the Other local revenue category has trended down over those three decades from 14 percent to 11 percent. The local tax share tends to rise during times of economic recovery and growth, and in FYs 2013 and 2014 it tied the previous all-time 64 percent peak share. FIGURE 15: New York City budget: revenue sources, amounts, and shares by fiscal year
($ billions) 1980 1990 2000 2010 2011 2012 2013 2014
Local taxes $6,959 $15,015 $22,229 $35,873 $40,350 $42,111 $45,722 $48,293Other local revenues * $1,814 $3,087 $4,417 $6,708 $6,529 $7,310 $6,397 $7,170Federal grants $2,234 $2,873 $4,417 $5,941 $7,747 $6,998 $8,421 $8,298State grants $2,185 $5,172 $7,062 $12,124 $11,255 $11,114 $11,027 $11,725
Total revenues $13,192 $26,147 $38,125 $60,646 $65,881 $67,533 $71,567 $75,486
Local taxes 53% 57% 58% 59% 61% 62% 64% 64%Other local revenues * 14% 12% 12% 11% 10% 11% 9% 9%Federal grants 17% 11% 12% 10% 12% 10% 12% 11%State grants 17% 20% 19% 20% 17% 16% 15% 16%
Total revenues 100% 100% 100% 100% 100% 100% 100% 100%
* Other local revenues include miscellaneous revenues, non-governmental grants, and fund transfers.
Source: 1980-2013: Comprehensive Annual Financial Reports of the Comptroller, compiled by the NYC Independent Budget Office; 2014: FY 2015 Adopted Budget.
Share of total NYC revenues
FPI January 13, 2015 42

New York City Taxes—Trends, Impact and Priorities for Reform
B. Shifts since 1980 among major local taxes In terms of the major local taxes, the biggest shift since 1980 has been the increase in the personal income tax share relative to the property tax share. The property tax is still the single largest local tax, but its 2014 share of 41.8 percent is less than it was in 1980 when it was 45.9 percent.37 The personal income tax share has been greater than 20 percent for every year since 1995, except for 2003, and it has been as high as 25 percent in fiscal years when capital gains and Wall Street bonuses were very high (1999, 2001, and 2008). Business income taxes are fairly cyclical and have hovered around a 14 percent share of city taxes (generally plus or minus two percent) since the mid-1990s. As is the case in most jurisdictions with a sales tax, the general sales tax has declined slightly in importance as a New York City tax over the past three decades as consumer spending continues to shift from goods, more of which are taxed, to services, fewer of which are subject to sales taxes. The main reason for the big falloff in the share of “other taxes” between 1980 and 1990 is the ending of the City’s stock transfer tax, which generated $293 million in 1980 and accounted for 4.2 percent of city taxes, the last year before it was phased-out and repealed by the State.38 Section 9 will discuss various tax policy changes and when they occurred to help account for some of the trends in Figure 16 below. For example, an 18.5 percent increase in property tax rates in fiscal year 2003 boosted the property tax share from its low-point in 2000.
37 The property tax share of all city taxes was 57.3 percent in 1971, the first year for which city tax collections are reported in OMB’s tax forecasting documentation. The property tax share fell below 50 percent for the first time in 1978 and has remained below that level in the years since. 38 Following its complete phase-out in 1981, the State substituted an annual appropriation that initially approximated $118 million, but that was reduced to half that or less from 1989 to 1991, and was set at $114 million from 1992 until being eliminated entirely in 2000. Because the Stock Transfer Tax was one of the taxes pledged to service bonds issued by the Municipal Assistance Corporation, the tax has remained on the books but has been rebated in part or in full since 1980.
FPI January 13, 2015 43

New York City Taxes—Trends, Impact and Priorities for Reform
FIGURE 16: New York City major taxes: amounts and shares 1980 1990 2000 2010 2014
Amounts ($ millions)Real property $3,196 $6,543 $7,850 $16,369 $20,202Personal income $879 $2,538 $5,365 $7,593 $10,174General sales $1,142 $2,431 $3,526 $5,076 $6,509Business income $821 $1,675 $3,276 $5,179 $6,674Real-estate related * $70 $370 $890 $983 $2,491Commercial rent $219 $685 $375 $618 $771Other taxes (hotel, utility, auto-related, other) $632 $774 $947 $1,363 $1,555TOTAL NYC TAXES $6,960 $15,015 $22,229 $37,201 $48,375
Share of NYC taxesReal property 45.9% 43.6% 35.3% 44.0% 41.8%Personal income 12.6% 16.9% 24.1% 20.4% 21.0%General sales 16.4% 16.2% 15.9% 13.6% 13.5%Business income 11.8% 11.2% 14.7% 13.9% 13.8%Real-estate related * 1.0% 2.5% 4.0% 2.6% 5.1%Commercial rent 3.1% 4.6% 1.7% 1.7% 1.6%Other taxes (hotel, utility, auto-related, other) 9.1% 5.2% 4.3% 3.7% 3.2%TOTAL NYC TAXES 100.0% 100.0% 100.0% 100.0% 100.0%
* Real estate-related includes mortgage recording and real property transfer taxes.
Source: Comprehensive Annual Financial Reports of the Comptroller, 1980-2013 compiled by the NYC Independent Budget Office.
C. Increase in tax exempt property value
Since about 1960. a large share of real property in New York City has been exempt from property taxes. All property owned by governments—whether local, state, federal, foreign, or city or state public authorities—is exempt from New York City taxation. And property owned by religious, charitable or educational institutions has long been and remains exempt. However, in recent years, a growing share of exemptions has been for property privately owned for residential, commercial, or industrial purposes. Those exemptions have been intended to spur investment in housing or commercial expansion. The total property tax levy was $21.3 billion in FY 2014. Tax-exempt properties had a total value of two-thirds that amount, with governments accounting for $9.2 billion in exempt tax value, and various private property owners making up another $5.1 billion in exempt tax value. As Figure 17 shows, the tax-exempt government share peaked in 1980 and has since dropped from 36 percent of the value of all real property in the city to a little under 26 percent, while the tax-exempt privately-owned share doubled from about seven percent in 1980 to over 14 percent in 2014.
FPI January 13, 2015 44

New York City Taxes—Trends, Impact and Priorities for Reform
FIGURE 17: Rise in Private Property Tax Exemptions share of NYC property tax base that is taxable or tax-exempt *
1950 1980 2000 2009 2014Taxable property 73.8% 57.0% 54.9% 58.3% 59.8%
Tax-exempt government property 22.2% 36.1% 33.0% 27.4% 25.7%
Tax-exempt private property 4.0% 6.9% 12.1% 14.3% 14.4%
TOTAL NYC real property 100.0% 100.0% 100.0% 100.0% 100.0%
Source: New York City Dept. of Finance, Annual Report on the New York City Real Property Tax, FY 2000, 2009, 2014.
* Note: Exemptions here do not include property tax abatements; in 2014, abatements were valued at $733 million, of which the largest is the co-op/condo abatement ($412 million).
Among the categories of privately owned property receiving tax exemptions, residential properties receive about the same value of exemptions as institutional properties, a category that includes religious, medical care, educational, charitable, and cultural institutions. The single largest category in terms of the value of property tax exemptions is new multi-family housing units receiving the 421-a tax breaks. The second largest category is commercial and industrial properties receiving ICIP or ICAP tax breaks.
FPI January 13, 2015 45
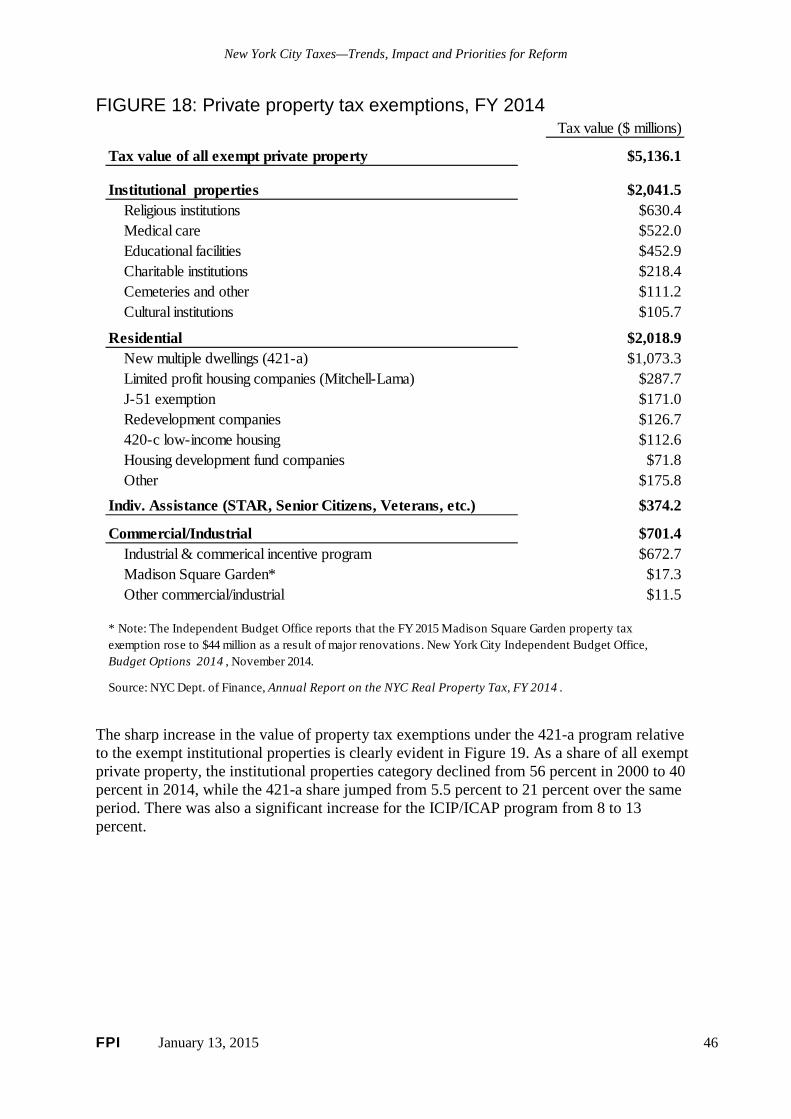
New York City Taxes—Trends, Impact and Priorities for Reform
FIGURE 18: Private property tax exemptions, FY 2014 Tax value ($ millions)
Tax value of all exempt private property $5,136.1
Institutional properties $2,041.5 Religious institutions $630.4 Medical care $522.0 Educational facilities $452.9 Charitable institutions $218.4 Cemeteries and other $111.2 Cultural institutions $105.7
Residential $2,018.9 New multiple dwellings (421-a) $1,073.3 Limited profit housing companies (Mitchell-Lama) $287.7 J-51 exemption $171.0 Redevelopment companies $126.7 420-c low-income housing $112.6 Housing development fund companies $71.8 Other $175.8Indiv. Assistance (STAR, Senior Citizens, Veterans, etc.) $374.2
Commercial/Industrial $701.4 Industrial & commerical incentive program $672.7 Madison Square Garden* $17.3 Other commercial/industrial $11.5
Source: NYC Dept. of Finance, Annual Report on the NYC Real Property Tax, FY 2014 .
* Note: The Independent Budget Office reports that the FY 2015 Madison Square Garden property tax exemption rose to $44 million as a result of major renovations. New York City Independent Budget Office, Budget Options 2014 , November 2014.
The sharp increase in the value of property tax exemptions under the 421-a program relative to the exempt institutional properties is clearly evident in Figure 19. As a share of all exempt private property, the institutional properties category declined from 56 percent in 2000 to 40 percent in 2014, while the 421-a share jumped from 5.5 percent to 21 percent over the same period. There was also a significant increase for the ICIP/ICAP program from 8 to 13 percent.
FPI January 13, 2015 46

New York City Taxes—Trends, Impact and Priorities for Reform
FIGURE 19: New York City Private Property Tax Exemptions Shares of all exempt private property 2000 2014
Exempt value--private property 100.0% 100.0%
Institutional properties 56.3% 39.7% Religious institutions 18.2% 12.3% Medical care 16.9% 10.2% Educational facilities 10.6% 8.8% Charitable institutions 4.6% 4.3% Cultural institutions 2.8% 2.2% Cemeteries and other 3.3% 2.1%
Residential 28.6% 39.3% New multiple dwellings (421-a) 5.5% 20.9% Limited profit housing companies (Mitchell-Lama) 11.9% 5.6% J-51 exemption 2.9% 3.3% Redevelopment companies 2.9% 2.5% Housing development fund companies 2.0% 1.4% Other 3.4% 5.6%
Indiv. Assistance (STAR, Senior Citizens, Veterans, etc.) 5.9% 7.3%
Commercial/Industrial 9.2% 13.7% Industrial & commerical incentive program 7.8% 13.1% Madison Square Garden* 0.5% 0.3% Other commercial/industrial 1.0% 0.2%
Source: NYC Dept. of Finance, Annual Report on the NYC Real Property Tax, FY 2000, 2014 .
D. Increase in 421-a tax break for new multiple dwellings
In 1971, the 421-a property tax exemption program was established to enhance the supply of housing in New York City through a tax subsidy for the construction of multi-family residential buildings. Over the past 15 years, the City has liberally granted 421-a property tax exemptions to developers of multiple-unit residential buildings despite the program’s fairly limited affordable housing requirements. Although some restrictions were put in place with reforms begun in 2006, the program still grants exemptions in many parts of the City without any affordable housing requirement and provides reduced benefits in exchange for a commitment of only 20 percent affordable units in high-demand neighborhoods in Manhattan and in parts of the other boroughs.39 Thus, 421-a tax breaks end up subsidizing thousands of luxury residential units. The $1.1 billion annual cost of the 421-a tax breaks has soared by over 1100 percent since 1998, more than six times the growth in the City’s property tax collections over that 16-year period.
E. Increase in housing and business-related tax expenditures Up to this point, the discussion has been about properties that are tax exempt in whole or part. A related and overlapping concept is that of tax expenditures. Tax expenditures include exemptions, exclusions, abatements, credits, or other benefits allowed against City tax
39 New York City Office of Management and Budget, Tax Revenue Forecasting Documentation, Financial Plan FYs 2013-2017, August, 2014, pp. I-21 to I-22. See also New York City Department of Housing Preservation & Development, 421-a Legislation Overview and FAQ, Updated Feb. 7, 2013.
FPI January 13, 2015 47
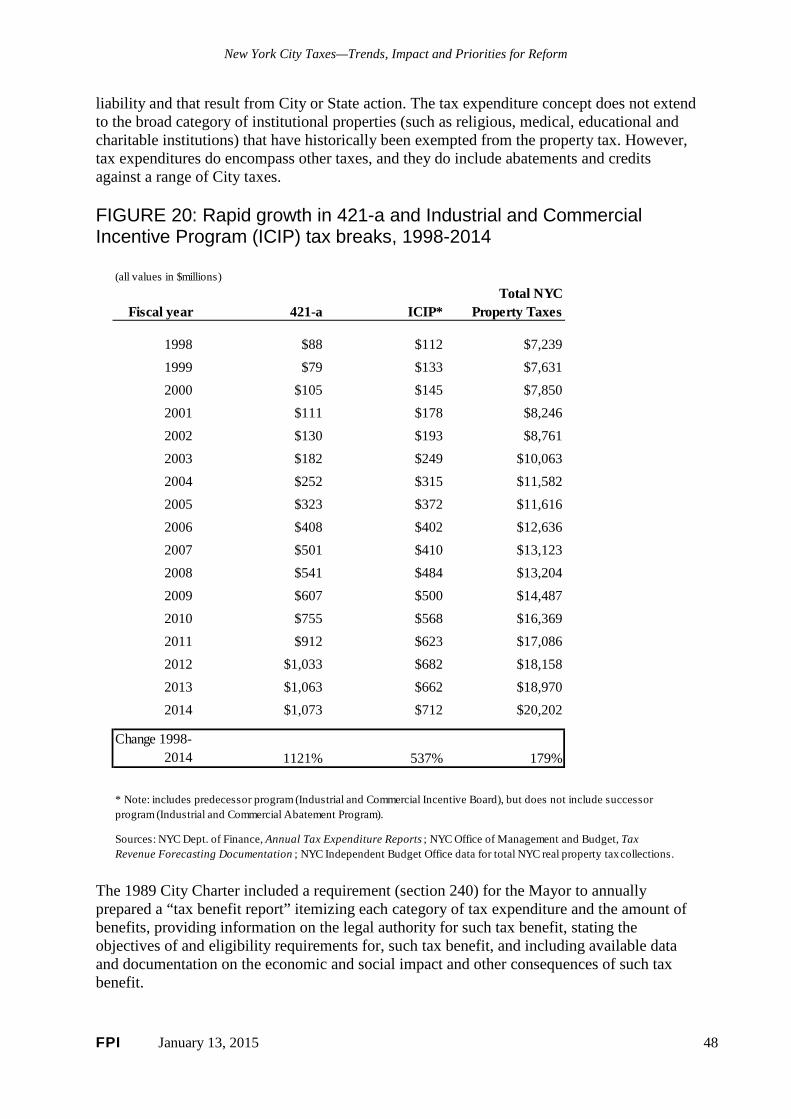
New York City Taxes—Trends, Impact and Priorities for Reform
liability and that result from City or State action. The tax expenditure concept does not extend to the broad category of institutional properties (such as religious, medical, educational and charitable institutions) that have historically been exempted from the property tax. However, tax expenditures do encompass other taxes, and they do include abatements and credits against a range of City taxes. FIGURE 20: Rapid growth in 421-a and Industrial and Commercial Incentive Program (ICIP) tax breaks, 1998-2014
(all values in $millions)
Fiscal year 421-a ICIP*Total NYC
Property Taxes
1998 $88 $112 $7,2391999 $79 $133 $7,6312000 $105 $145 $7,8502001 $111 $178 $8,2462002 $130 $193 $8,7612003 $182 $249 $10,0632004 $252 $315 $11,5822005 $323 $372 $11,6162006 $408 $402 $12,6362007 $501 $410 $13,1232008 $541 $484 $13,2042009 $607 $500 $14,4872010 $755 $568 $16,3692011 $912 $623 $17,0862012 $1,033 $682 $18,1582013 $1,063 $662 $18,9702014 $1,073 $712 $20,202
Change 1998-2014 1121% 537% 179%
Sources: NYC Dept. of Finance, Annual Tax Expenditure Reports ; NYC Office of Management and Budget, Tax Revenue Forecasting Documentation ; NYC Independent Budget Office data for total NYC real property tax collections.
* Note: includes predecessor program (Industrial and Commercial Incentive Board), but does not include successor program (Industrial and Commercial Abatement Program).
The 1989 City Charter included a requirement (section 240) for the Mayor to annually prepared a “tax benefit report” itemizing each category of tax expenditure and the amount of benefits, providing information on the legal authority for such tax benefit, stating the objectives of and eligibility requirements for, such tax benefit, and including available data and documentation on the economic and social impact and other consequences of such tax benefit.
FPI January 13, 2015 48

New York City Taxes—Trends, Impact and Priorities for Reform
Since 1991, the City Department of Finance has prepared an annual tax expenditure report. For FY 2014, the tax expenditure report identifies a total of $7.1 billion in various property and non-property tax exemptions, abatements, and credits. Figure 21 provides a modified list of these tax expenditures; it excludes the $272 million STAR school tax credit since that is State-funded. It also includes two items that are not included in the tax expenditure report but should be since they meet the requirements of section 240: $16 million in non-property tax benefits provided by the City’s Industrial Development Agency, and $200 million for the carried interest exemption on the Unincorporated Business Tax. The two largest individual tax expenditures are 421-a and the ICIP/ICAP program. FIGURE 21: New York City Tax Expenditures, FY 2014
(only individual tax expenditures with value of $100 million or more listed) ($ millions)
All NYC Tax Expenditures $7,106
Real property tax $4,748 421-a, new multiple dwellings exemption $1,073 Industrial & Commerical Incentive and Abatement Programs $680 Co-op/Condo abatement $412 Industrial Development Agency & Economic Dev. Corp. $343 J-51 exemption and abatement $259 Senior citizen homeowner and rent increase exemptions $254 Limited profit housing companies (Mitchel-Lama) $219 Urban Development Corporation--commercial $200 Battery Park City Authority $172 420-c, low-income housing $113
Business Income taxes $1,255 Insurance Corporation non-taxation $394 Business and investment capital tax limitation $319 Carried interest exemption on Unincorporated Business Tax $200
Sales tax $840 Clothing and footwear $394 Aviation fuel sold to airlines $153 Cable television $116
NYC Personal Income Tax $247 Unincorporated Business Tax credit $130 Earned Income tax + household + child & dependent care credits $117
NYC Industrial Development Agency Non-Property Tax Expenditures $16
Sources: Data from NYC Finance Department, Annual Report on Tax Expenditures, FY 2014 , except NYC IDA non-property tax expenditures from NYC Economic Development Corp., Annual Investments Projects Report Pursuant to Local Law 62, FY 2013, Vol. 1 , Jan. 7, 2014; carried interest estimate from NYC Independent Budget Office, Budget Options 2014 , Nov. 2014. Excludes $272 million STAR school tax credit since that is state-funded.
FPI January 13, 2015 49
New York City Taxes—Trends, Impact and Priorities for Reform
F. Increase in business tax expenditures In 2014, various business tax expenditures granted by New York City totaled nearly $3 billion, an amount that represented over six percent of total City tax collections and that roughly equals the combined budgets of the Parks, Transportation, and Youth and Community Development departments and the City’s contributions to public libraries and CUNY. Three billion dollars is also close to the amount the City received in collections and audits from the General Corporation Tax and more than was received from the real property transfer, mortgage recording, commercial rent, and hotel taxes combined. Business tax expenditures are made for the purpose of inducing business investment and employment or to further the city’s ability to retain businesses and jobs. However, many of these tax breaks were put in place decades ago when New York City’s economy was facing significantly different challenges.40 Despite there never having been a thorough evaluation of the value of these programs, they often are routinely continued when they come up for renewal. Worse, as will be discussed further in next section, a major expansion of as-of-right property tax breaks for large commercial developments was launched in 2005 for the Hudson Yards district. The justification for establishing significant tax breaks for up to 99 years was based on the City’s then-unexamined practice of granting property tax breaks for major developments and corporations elsewhere in Manhattan. The City’s current offering of business tax breaks includes, in addition to various as-of-right property and other tax breaks, subsidies granted as part of New York City Industrial Development Authority (IDA) discretionary deals. The retention deals with large finance and media companies account for most of the IDA tax expenditures. Total business tax expenditures have more than tripled in value since FY 2001, increasing from $918 million to nearly $3 billion annually, and have grown more than twice as fast as total city tax collections.41 (See Figure 22.) Had the growth in business tax expenditures tracked the growth in total tax collections from FY2001 to FY2014, the City would have spent $1 billion less in 2014 on business tax breaks of various kinds.
40 The decision to not replace the taxation of insurance premiums on risks located or resident in New York City when that tax was ended dates from 1974, and the decision to provide as-of-right property tax breaks under the Industrial and Commercial Incentive Program dates from 1984. While the program was changed from an exemption to an abatement in 2008, the extent of tax breaks provided was only slightly reduced. 41 In Figure 22, business-related property tax expenditures are for FY 2014. Because there is a lag in the availability of estimates for non-property taxes, the City’s FY 2014 tax expenditure report includes estimates for the latest years available. These earlier years are indicated in Figure 22.
FPI January 13, 2015 50

New York City Taxes—Trends, Impact and Priorities for Reform
FIGURE 22: NYC Business Tax Expenditures, FY 2001 and 2014
FY 2001 FY 2014 % changeTotal NYC Business Tax Expenditures $918 $2,912 217%
Real Property Tax Expenditures $434 $1,359 213%$178 $680 283%
$39 $42 10%$66 $241 265%$4 $102 2515%
$104 $200 93%$44 $93 112%
TY 1998 TY 2010$430 $1,055 145%
$32 $319 897%$193 $394 104%
$0 $83 n.m. $11 $38 245%$5 $28 460%
$29 $26 -10%$160 $167 4%
TY 1998 TY 2010$30 $153 410%
Personal Income Tax Expenditures TY 1997 TY 2011$24 $130 442%
FY 2013NYC Industrial Dev. Agency Non-Property Tax Expenditures n.a. $16 n.m.
Exemption for Carried Interest, NYC UBT n.a. $200 n.m.
$23,248 $47,455 104%
Note: The time period for percent change varies for non-property taxes and is for the time indicated by the tax years for the data cited.
Industrial & Commercial Incentive Program (and new ICAP program) Other Commercial & Industrial Exemptions
($ millions)
Industrial Development Agency Economic Development Corporation Urban Development Corporation -- Commercial Battery Park City Authority -- Commercial
Fuel sold to airlines
Business Income Tax Expenditures Business and Investment Capital Tax Limitation Insurance Corporation Non-Taxation
Other (Relocation & Employment Assistance, Film Production, etc.)
Sales Tax Expenditures
Commercial Revitalization Program Relocation & Employment Assistance Program Energy Cost Savings Program Credit
Single Sales Factor
NYC Total Tax Collections, including audits
Uninc. Business Tax (UBT) Credit on NYC Personal Income Tax
Sources: Unless noted separately, data are from NYC Finance Department, Annual Report on Tax Expenditures, FY 2001 and FY 2014 ; tax collections from NYC Comptroller, Comprehensive Annual Financial Reports, FY 2001 and FY 2014 ; IDA non-property tax expenditures from NYC Economic Development Corp., Annual Investments Projects Report Pursuant to Local Law 62, FY 2013, Vol. 1 , January 7, 2014; carried interest estimate from NYC Independent Budget Office, Budget Options 2014 , Nov. 2014.
The City Charter-mandated annual tax expenditure report details most, but not all, business tax expenditures. While it includes as-of-right property tax breaks provided by the IDA or the Economic Development Corporation, it does not include various other business tax expenditures, including IDA authorized mortgage recording, sales and energy tax breaks, and the exemption on the taxation of carried interest under the city’s Unincorporated Business Tax. In other reports, the IDA does provide the annual value of non-property tax breaks. In recent years, the IBO has provided estimates of the cost of the carried interest exemption.42
42 See New York City Independent Budget Office, Budget Options for New York City, November 2014, p. 69.
FPI January 13, 2015 51
New York City Taxes—Trends, Impact and Priorities for Reform
The public finance literature indicates that, from a budgeting perspective, tax expenditures are the same as budget outlays and for all intents and purposes should be treated like budget outlays in terms of transparency and accountability.43 One prominent exception to the “automatic pilot” practice applied to business tax breaks (under which most exemptions have been extended without significant modification) came in 2007. At that time, staff at the city’s Economic Development Corporation, drawing on the advice of a panel of outside economists, developed a sophisticated economic model to assess whether or not tax benefits provided under the Industrial and Commercial Incentive Program (ICIP) were necessary to induce the investments that triggered the tax break. Real-world income and expense data for individual companies, compiled in connection with the city property tax, were used for the analysis. The study concluded that in cases representing 80 percent of the value of ICIP tax expenditures, the profitability of the investment would have justified proceeding with the investment even in the absence of the tax break. That is, 80 percent of the annual cost of ICIP tax expenditures was unnecessary from an investment decision perspective.44 Initially, the study was used to support a proposal to significantly scale-back the ICIP program. However, real estate interests successfully lobbied to limit the extent of program changes.
43 Stanley S. Surrey and Paul R. McDaniel, Tax Expenditures (Cambridge, MA; Harvard University Press, 1985), p. 3. 44 Francesco Brindisi and David Ehrenberg, New York City Economic Development Corporation, The New York City Real Property Tax Industrial and Commercial Incentive program (ICIP): Description and Analysis, Presentation at 2008 Revenue Estimation and Tax Research Conference, Portland, Maine, September 16, 2008.
FPI January 13, 2015 52
New York City Taxes—Trends, Impact and Priorities for Reform
10. Tax policy changes since 1977 Given the dramatic changes in New York City’s economy since the mid-1970s fiscal crisis and the pronounced polarization of income gains that began around 1980, there have been remarkably few changes in the city’s tax structure over the past four decades. No significant new local taxes have been added since 1970. The hotel tax is the most recent, and it dates from 1970. Two major taxes have been eliminated—the Stock Transfer Tax and the Non-resident earnings (Commuter) Tax—while the Commercial Rent Tax has been reduced by half since the mid-1990s. With the exception of the real property tax and the hotel tax, there have been no major tax increases since the mid-1970s. Business taxes have been reduced by a number of actions over that period, and in 1996 the City exempted carried interest received by private equity and hedge funds from taxation under the Unincorporated Business Tax. The current top personal income tax rate (3.88 percent) is about one-tenth lower than it was in 1977 (4.3 percent), yet 200,000 low-income households pay a City income tax (after any EITC credit) although they have no state or federal income tax liability. In addition to enacting several changes that have lowered business taxes over the past forty years, the City has put in place two major programs to provide property tax breaks and has negotiated several discretionary tax subsidy deals with large corporations in the name of promoting business development. As noted in the previous section, business tax breaks now total about $3 billion a year, over six percent of the City’s total tax base, and they have grown twice as fast as total tax collections since 2001. Although the City’s economic situation has vastly improved since the bleak days of the late 1970s, the City continues to dispense business tax breaks as if nothing had changed over the past three decades. Meanwhile, the State saw fit to eliminate the City’s Stock Transfer Tax beginning in 1978 and repeal the commuter tax in 1999, depriving the City of two significant revenue sources. In response to widespread concerns about the fairness of the property tax system, the State adopted legislation restructuring the City’s property tax in 1981. However, the system put in place failed to address most of the problems, and additional assessment limits enacted later in the 1980s have only intensified various inequities. The one major property tax change since the early 1980s—the co-op/condo partial tax abatement—has narrowed inequities among owners of 1-, 2- and 3-family homes, but further widened them with respect to rental properties. Moreover, the largest property tax break intended to promote housing development—421-a—has grown by leaps and bounds since 2000 although it is badly in need of reform. When 421-a was established, its purpose was mainly to foster housing development, with no emphasis on affordability, an oversight that badly needs correcting. A review of tax policy changes since the late 1970s highlights the missed opportunities and the need to broadly reassess the City’s tax system. The following review is organized by mayoral administration and is summarized in Figure 23, with more details provided in Appendix Figure 2.
FPI January 13, 2015 53

New York City Taxes—Trends, Impact and Priorities for Reform
FIGURE 23: Main areas of significant NYC tax policy changes since 1977, by mayoral administration
Koch Administration, 1978-1989● Established several business development subsidy programs, including two of the most costly programs:
ICIP, and the cap on the business and investment capital base alternative for calculating business income tax liability.
● Modest reduction in business income tax rates.● Granted $200 million subsidy package to Chase Manhattan Bank in 1989 to locate in Metro Tech,
Brooklyn, setting a precedent for very costly discretionary subsidy deals for other large corporations.
Dinkins Administration, 1990-1993● Raised personal income tax rates in a mildly progressive manner with two surcharges, with a portion
dedicated to policing.
● Modestly raised property tax rate, with a portion dedicated to policing.● Granted several costly retention deals to large financial service and media firms.
Giuliani Administration, 1994-2001● Several business tax reductions, especially for the Commercial Rent Tax and the Unincorporated
Business Tax, including exempting carried interest from taxation under the UBT.● City Council initiated two major tax reductions: eliminating the 12.5% personal income tax surcharge and
establishing the co-op/condo property tax abatement.● NYS eliminated the non-resident earnings ("commuter") tax.● Continued granting several costly retention deals, including one for the New York Stock Exchange.
Bloomberg Administration, 2002-2013● Increased property tax rates in 2003 by 18.49% to fill the revenue hole made by several tax reductions
under the previous administration, and when economy recovered, provided temporary homeowner rebate and 7% rate reduction. However, did not attempt to reform property tax system despite mounting inequities.
● Missed opportunities to reform ICIP and 421-a tax tax breaks—the two most costly NYC tax breaks.● Increased regressive sales tax rate by 0.5%, but did establish modest low-income personal income tax
credits (EITC and child care credit).● By limiting the STAR rate cut and limiting itemized deductions in 2010, the State modestly increased
income taxes on high-income households.● While fewer individual large retention deals negotiated, approved generous subsidy deals for Yankees
and Mets costing $1 billion-plus over the life of those agreeements. Also established massive property tax breaks in the Hudson Yards district that have the potential to cost the City a billion dollars or more.
Source: See Appendix Table, Significant NYC Tax Policy Changes Since 1977 .
A. Koch administration, 1978-1989
The Koch administration began after the 1975 fiscal crisis and following a period, 1969-1977, when the city had lost 600,000 jobs, about 16 percent of its total. In the early and mid-1970s, many corporate headquarters relocated to the suburbs or the Sunbelt, the city
FPI January 13, 2015 54

New York City Taxes—Trends, Impact and Priorities for Reform
continued to lose manufacturing jobs, and tens of thousands of middle class households moved to the suburbs. Much of the focus for tax policy during the 1980s was on retaining businesses and, in particular, manufacturing operations, that provided many middle-income job opportunities for less-educated workers. Within the span of a few years in the mid-1980s, the Koch administration introduced the Industrial and Commercial Incentive Program (ICIP), the Energy Cost Savings Program (ECSP), and the Relocation and Employment Assistance Program (REAP). As manufacturing and port-related businesses declined in Manhattan, commercial real estate development activity intensified the pressure on most of the remaining industrial districts, particularly the Midtown Manhattan Garment District and the Hudson Square Printing District. The City sought to retain industrial businesses by encouraging relocation to the boroughs outside of Manhattan, and it initially shaped its economic development subsidy programs toward that end. In subsequent years, these programs were often modified in ways that significantly diluted the original purpose and broadened eligibility to other areas. For example, by the 2000s, the ICIP program was mainly subsidizing commercial activities in Manhattan. The far-reaching 1986 federal tax reform that broadened the base and reduced tax rates for both individual and corporate income taxes led both New York City and New York State to lower their income tax rates, since their taxes relied on the IRS’s specification of taxable income. In reducing its top personal income tax rate from 4.3 percent to 3.4 percent, the City also opted to reduce the number of tax brackets from 14 to 5 and to substantially narrow the range, especially between middle and the top brackets. This truncated rate structure continues to the present time, with the middle (net income $45,000-$90,000 for joint filers) of the five tax brackets having a 3.591 percent marginal rate and the top bracket (over $500,000) having a rate of 3.876 percent. One of the most far-reaching legacies of the Koch mayoralty was the decision in 1988 to grant Chase Manhattan Bank a package of property and other tax subsidies valued over the duration of the agreement at $235 million as part of an agreement under which the bank would relocate certain back office operations to the Metro Tech development in downtown Brooklyn.45 The Chase subsidy package set a precedent for several very costly discretionary subsidy deals the City would enter into in subsequent years. By the end of 1988, the City agreed to provide NBC $72 million in tax breaks to renew its lease at Rockefeller Center. The City’s Industrial Development Agency also agreed to issue $800 million in double tax exempt bonds to help finance the renovation of NBC’s television studios.46 In 1989, the last year of the Koch administration, Citicorp qualified for up to $90 million in as-of-right tax incentives to build an office tower in Long Island City, Queens. 47 The decision to lavish tax breaks on some of the largest and most successful businesses in the financial and media sectors in the United States represented a sharp departure from an earlier economic development focus on retaining industrial activities. Under the next three administrations in the following two decades, the City continued down the road of significantly reducing property taxes for large corporations and real estate developers well past the time when New York City had recovered from the economic despair of the 1970s.
45 Good Jobs New York, Before the Bailout of 2008: New York City’s Experience with Tax Giveaways to Financial Giants, February 2009, p. 11. 46 Good Jobs New York, Database of Deals, accessed December 5, 2014. 47 Good Jobs New York, Before the Bailout of 2008, p. 10.
FPI January 13, 2015 55
New York City Taxes—Trends, Impact and Priorities for Reform
B. Dinkins administration, 1990-1993 The four years of the Dinkins administration coincided with the most severe drop in the City’s economy in the 35 years since the crisis years of the 1970s. The 10 percent drop in the private employment between 1989 and 1992 far exceeded the job losses the city sustained in either the 2001-2003 recession or during the 2008 Wall Street collapse and its aftermath. The Dinkins administration responded to the sharp falloff in tax revenues in 1990 and 1991 by imposing two City personal income tax surcharges and two property tax rate increases. A portion of the income tax and property tax increases enacted in 1990 were dedicated to expanding the police force under the “Safe Streets, Safe City” initiative in response to a crack-fueled crime wave. (” Safe Streets, Safe City” was widely seen as producing a turn-around in the City’s efforts to reduce crime.) The Dinkins-era income tax increases yielded some of the highest top marginal rates in the half-century history of the City personal income tax. The two property tax rate increases adopted during this period amounted to roughly a nine percent increase, about half of the increase that occurred at the beginning of the Bloomberg Administration, also in the wake of large, recession-induced City budget gaps. In order to address the continuing concerns about inequities and undue complexity in the City’s property tax system in the wake of the 1981 State law, Mayor Dinkins and the Speaker of the City Council, Peter Vallone, appointed a property tax reform commission chaired by former Deputy Mayor Stanley Grayson. However, the commission’s report was issued on the last day of 1993, also the last day of the Dinkins Administration, and its recommendations were put aside for the first several years of the Giuliani Administration. Continuing the trend established in the last two years of the Koch administration, the City’s Economic Development Corporation under the Dinkins administration awarded several costly business subsidies to very large finance and media companies. These deals included taxpayer subsidies to Bear Stearns in 1991; Prudential Securities and Morgan Stanley in 1992; and CBS, Bank of America, Kidder Peabody, and the New York Times in 1993. The total value of just these seven large deals amounted to $294 million over the life of the agreements,48 although two of these agreements (Bank of America and Kidder Peabody) were later terminated when the companies laid off large numbers of employees.
C. Giuliani administration, 1994-2001
The Giuliani administration coincided with a period of economic growth and expansion up until the onset of the national recession in early 2001. According to estimates by the City’s Office of Management and Budget, inflation-adjusted gross city product gained an average of 5.3 percent a year between 1994 and 2000, and personal income grew by 6.1 percent annually.49 While the City enjoyed record budget surpluses during Giuliani’s second term, the benefits of the extended 1990s expansion were concentrated at the top of the income
48 Good Jobs New York, Issue Brief #2, November 2000. 49 Calculated from the historical time series data for gross city project and city personal income regularly updated in the Monthly Report on Current Economic Conditions, prepared by the City’s Office of Management and Budget. The particular data used in these 1994-2000 growth rates are from the March 15, 2007 issue.
FPI January 13, 2015 56

New York City Taxes—Trends, Impact and Priorities for Reform
distribution. Wall Street bonuses and capital gains soared, but poverty rose, and real median wages and median family income fell.50 During the two Giuliani terms, the Mayor focused on cutting business income taxes and the commercial rent tax, while the City Council proposed and achieved co-op/condo property tax relief, and Speaker Peter Vallone of the City Council championed letting the Dinkins-era 12.5 percent personal income tax surcharge expire in 1998 as he prepared to run for Governor.51 Through a series of changes to the commercial rent tax, Mayor Giuliani reduced the rate, raised the exemption level, and narrowed the geographic scope of the tax to Manhattan south of 96th Street. By fiscal 2002, the last budget largely determined by the out-going mayor, these changes had effectively halved, by $400 million, the amount collected from the tax on commercial rents.52 In 1995, New York State allowed the formation of limited liability partnerships (LLPs) and limited liability companies (LLCs), changing the tax treatment for many businesses from corporations to partnerships. Several thousand companies around the State and in the City did change their legal status to reduce their tax liability. In the City, the business income of LLPs and LLCs is taxed under the Unincorporated Business Tax (UBT) at a four percent rate. Various City business tax changes and credits made in Mayor Giuliani’s first term reduced business-related tax collections by at least an estimated $240 million by 2002.53 Included in this total is the creation in 1997 of a credit on resident personal income tax returns for taxes paid under the UBT. The year before, the exemption under the UBT for income from self-trading was expanded to encompass all carried interest received by general partners of private equity and hedge funds.54 The IBO estimates that this broadened carried interest exemption currently costs the City approximately $200 million a year.55 Following the introduction of twice-yearly “tax-free” weeks in the late 1990s, where the State and City repealed sales taxes on clothing and footwear purchases (usually under $500, one time under $100), the State permanently repealed its 4 percent sales tax on clothing and footwear purchases under $110, effective March 1, 2000, and gave local governments the option to match the repeal. The City chose to follow the State with the same March 1, 2000, effective date. The clothing sales tax repeal initially cost the City about $200 million in foregone taxes.56
50 James Parrott and David Dyssegaard Kallick, “Balance,” in America’s Mayor, America’s President? The Strange Career of Rudy Giuliani, Revised and Expanded, edited by Rob Polner, Brooklyn: Soft Skull Press, 2007, pp. 141-148. 51 On Speaker Vallone’s campaign to eliminate the 12.5 percent income tax surcharge, see: “Dueling Campaign Speeches,” Editorial, The New York Times, January 8, 1998; and Norimitsu Onishi, “Council Sees More Revenue For the City Than Giuliani,” The New York Times, March 27, 1998. 52 City estimates of the costs associated with tax cuts or the additional revenue associated with tax increases cited in this section are generally from the Tax Program sections of the Forecast Documentation report issued at the time of each City budget update. This report is prepared by the New York City Office of Management and Budget, Tax Policy, Revenue Forecasting and Economic Analysis Task Force. The commercial rent tax reduction estimates are from issues of this report prepared for FY 1995-2002. 53 Ibid. 54 New York City Office of Management and Budget, Tax Revenue Forecasting Documentation, Financial Plan Years 2013-2017, July 2014, p. 83. 55 New York City Independent Budget Office, Budget Options for New York City, November 2014, p. 69. 56 New York City Office of Management and Budget, Tax Revenue Forecasting Documentation, Financial Plan Years 2013-2017, July 2014, p. III-21.
FPI January 13, 2015 57
New York City Taxes—Trends, Impact and Priorities for Reform
The two tax cuts primarily favored by the City Council cost the City more in foregone tax revenue than those proposed by Mayor Giuliani. By fiscal 2002, the expiration of the Dinkins-era 12.5 percent personal income tax surcharge reduced tax collections by $800 million. The co-op/condo property tax abatement reduced taxes by about $180 million in that year.57 Although the Grayson Property Tax Reform Commission that reported at the very end of the Dinkins Administration, had called attention to the fact that some co-ops and condos paid higher effective property taxes than Class 1 properties, among other inequities it highlighted, this is the only area from the Grayson Commission report that has been addressed in the twenty-one years since the Commission’s report. Despite a steadily improving City economy during most of the first seven years of his tenure, Mayor Giuliani substantially accelerated the practice of awarding lucrative multi-year tax breaks to large and profitable Wall Street and media corporations. Wall Street enjoyed a tech-related boom period in the late 1990s, with total New York City securities industry employment reaching an all-time high of 195,000 in 2000, up by nearly 30 percent from 1993. Wall Street profits more than doubled from 1993 to $21 billion in 2000, and bonuses paid to traders and investment bankers more than tripled from 1993 to 2000, reaching nearly $20 billion.58 Yet, the City handed out more rich retention deals than ever before. Many observers noted that, once a few prominent banks and media companies had received multi-million dollar subsidies, other major corporations in those two sectors began lining up for their own turn at the taxpayer spigot.59 Writing in a retrospective book about the Giuliani administration, New York Times real estate reporter Charles Bagli summed up Mayor Giuliani’s approach to corporate subsidies:
Certainly Giuliani could have used his bully pulpit to prod Congress to impose sanctions against states and municipalities that used tax breaks to lure companies from one location to another. With the city entering a period of robust growth, the mayor had leverage to stem corporate tax breaks. Dinkins, who presided during a shrinking economy, a crack epidemic, and rampant violence, did not have the same freedom to operate. Far from playing hardball with the city’s corporate citizens, Giuliani forgave more than $1 billion in taxes to the likes of Merrill Lynch and fifty other corporations that threatened to walk. 60
As Bagli notes, Mayor Giuliani also was determined to make a $1.1 billion-plus subsidy to the New York Stock Exchange the crowning glory of his two terms in office, but the World Trade Center attacks in September 2001 tremendously complicated an already complex transaction. Despite the mayor spending the last days of his term “desperately trying to close the deal,” a final subsidy agreement did not come together before time ran out, although the City had spent $109 million to entice a developer to build an office tower above a new trading complex across the street from the Stock Exchange’s long-standing location. In
57 New York City Office of Management and Budget, Tax Revenue Forecasting Documentation, FY 2005-2009. 58 Wall Street employment data from NYS Department of Labor; profits data from Securities Industry and Financial Markets Association; Wall Street bonus data estimated by Office of the State Deputy Comptroller. 59 For a list of the largest corporate subsidy deals negotiated through 1999, see Good Jobs New York, Issue Brief #2, November 2000, p. 2. 60 Charles Bagli, “Generosity,” in America’s Mayor, America’s President? The Strange Career of Rudy Giuliani, Revised and Expanded, edited by Rob Polner, Brooklyn: Soft Skull Press, 2007, pp. 79-90.
FPI January 13, 2015 58

New York City Taxes—Trends, Impact and Priorities for Reform
addition to providing $160 million in tax breaks, Giuliani was willing to commit the City to spend $800 million in cash to buy an entire City block and to outfit the trading floors.61 During the late 1990s, the State also got into the act of making ill-advised decisions regarding the City’s tax revenue base. In a move that Mayor Giuliani aptly called “a triumph of politics over common sense,” the state legislature repealed the City’s commuter tax during a heated campaign over an off-year election for a suburban Rockland County state senate seat.62 Under the tax, non-residents paid New York City 0.45 percent on their wage earnings from employment in New York City and 0.65 percent on self-employment earnings in the city. These rates were only a fraction of the personal income tax rates paid by city residents, and most commuters received salaries from their employment in the city that were about twice that received by the average city resident. Repeal cost the City $360 million in lost taxes initially; the IBO estimates that the same rates would generate about $860 million in 2016.63
D. Bloomberg administration, 2002-2013 Tax policy actions during the Bloomberg administration’s first term were heavily shaped by the recession underway when Mayor Michael Bloomberg first took office. In the second term (2006-2009), tax policy choices were affected by a financial boom in 2006 and 2007 and then by the financial crash of 2008 and 2009. There were no major tax policy changes initiated by the Mayor during his third term. Along the way, however, the Bloomberg administration was enormously generous in the 2005-2007 period with taxpayer dollars in agreeing to over $1 billion in subsidies to professional baseball teams and in putting in place steep property tax discounts for the Hudson Yards area that will ultimately cost the City billions in lost taxes. The City lost slightly over six percent of total employment from the onset of the national recession in 2001 until the low-point was reached in mid-2003. While the job toll taken by the 2008-09 Great Recession was far more severe at a national level than that during the early 2000s downturn, New York City fared much better than the nation in the wake of the September 2008 financial crash and better than it had during the early 2000s recession. Thanks to the unprecedented nature and magnitude of the financial sector bailout by the Treasury Department and the Federal Reserve, Wall Street job and financial losses were moderated and the nation’s largest banking institutions, most of which are based in New York City, quickly returned to profitability in 2009 and further increased their market share. New York City’s 2008-09 job loss was less than four percent of the pre-downturn total. As during the Giuliani years, the 12 Bloomberg years saw considerable job and total income growth in New York City but a pronounced polarization in the distribution of those gains. Even with a nine percent real decline in 2008 and 2009, gross city product rose by an average of 2.3 percent a year from 2002 to 2013.64 However, median family incomes faltered and real median wages declined by 4.3 percent from 2002 to 2013. Wages fell even more for college-educated workers on average (5.4 percent) and for low-wage workers (6.6 percent).65 The net gain in jobs in the city during the Bloomberg era was very heavily concentrated among
61 Bagli, “Generosity,” pp. 88-90. 62 Tracey Tully and Lisa Rein, “Commuter Tax Repealed,” New York Daily News, May 18, 1999. 63 New York City Independent Budget Office, Budget Options for New York City, November 2014, p. 44. 64 New York City Office of Management and Budget, Monthly Report on Current Economic Conditions, July 8, 2014, and Forecast Documentation, November 2014 Plan, FY 2015-2019, November 2014. 65 FPI analysis of Current Population Survey data.
FPI January 13, 2015 59
New York City Taxes—Trends, Impact and Priorities for Reform
industries falling in the lower-third of the wage distribution, with restaurants, home care and retail trade far out-pacing the job growth occurring in better-paying sectors, where job gains have been mainly in private education and professional and technical jobs.66 Bloomberg was first sworn into office in January 2002, not long after the September 11th attacks, while the local economy was still reeling from economic aftershocks, as well as enduring the continuing fallout from the bursting of the dot-com stock market bubble and the national recession that had begun in early 2001. Facing a yawning budget deficit, Bloomberg sought a 25 percent property tax increase and settled with the Council for an 18.49 percent hike effective January 1, 2003. On an annual basis, the property tax increase yielded $1.8 billion. Because of both budgetary and deeply-held public health concerns, Bloomberg also pushed through a substantial increase in the City’s cigarette tax. Facing continued tax revenue shortfalls, in early 2003 the State took a series of actions to shore up State and local government budgets alike. The State enacted a temporary 3-year increase in its personal income tax and a similar temporary hike for New York City. The increase took the form of two new tax brackets at the top that raised the top City tax rate to 4.45 percent. The temporary change also included a tax table benefit recapture provision for the years 2003-2005. The temporary income tax increase generated roughly $600 million annually. The State also temporarily repealed the clothing and footwear sales tax exemption at both the City and the State level and temporarily increased the City sales tax rate from 4.0 to 4.125 percent. The two sales tax actions raised about $300 million more for City coffers for each of the two years they were in effect.67 Altogether, the permanent property and cigarette tax increases and the temporary increases in the income and sales taxes netted the City an additional $2.8 billion in FYs 2004 and 2005. That amount was roughly equivalent to the annualized value in 2002 of the business, income, property, and sales tax cuts enacted while Rudy Giuliani was mayor.68 This does not take into account the cost of the corporate retention deals entered into by Giuliani or his two predecessors. When the City’s revenue situation improved as the economy began to recover, Mayor Bloomberg opted in the spring of 2004 to provide a temporary $400 homeowner property tax rebate that cost about $250 million a year. The rebate did not apply to renters or to owners of rental or commercial properties. The Mayor made it clear that the rebate would be provided only so long as the City budget could “afford” the cost. It remained in place for five years through June 2009. In 2007, when tax revenues were still benefiting from the Wall Street boom, the Mayor and the Council acted to reduce the property tax rate by seven percent, also on a temporary basis. The rate reduction was across-the-board, so all commercial and residential properties benefited. It was in place from July 2007 through the end of calendar 2008 when, as with the rebate, it was ended due to plummeting tax collections. The rate reduction cost a little over $1 billion a year in foregone tax collections.69
66 FPI analysis of NYS Labor Department’s Quarterly Census of Employment and Wage data. 67 New York City Office of Management and Budget, Forecast Documentation, November 2014 Plan, FY 2015-2019, November 2014. 68 New York City Office of Management and Budget, Tax Revenue Forecasting Documentation, FY 2005-2009. 69 This paragraph and the following one are based on New York City Office of Management and Budget, Tax Revenue Forecasting Documentation, Financial Plan Years 2013-2017, July 2014.
FPI January 13, 2015 60

New York City Taxes—Trends, Impact and Priorities for Reform
The clothing and footwear sales tax exemption for items costing under $110 was reinstated on September 1, 2006, and extended to all clothing and footwear beginning September 1, 2007, for nearly two years. Then, also due to recession-induced fiscal pressures, the exemption was narrowed again beginning August 1, 2009, to items costing under $110. During his 12 years in office, Mayor Bloomberg never sought to permanently change the City’s personal income tax rates or to otherwise undertake significant changes in the income tax. The City Council initiated a refundable credit against the City’s personal income tax equaling five percent of the federal Earned Income Tax Credit that became effective January 1, 2004. The Council also proposed and enacted a refundable City personal income tax credit for child care expenses for children up to the age of four with an effective date of January 1, 2007. Only households with incomes below $30,000 are eligible for this credit. For FY 2014, the City EITC provided roughly $100 million in tax relief, and the child care credit about $11 million, to low-income families.70 The Council also initiated measures in 2006 and 2007 to raise the income eligibility threshold for property tax reductions under the long-established rent increase and homeowner exemptions for senior citizens (SCRIE and SCHE, respectively) and acted to establish a new rent increase benefit program for disabled persons (DRIE). Besides the property tax, the only major tax that Mayor Bloomberg acted to increase was to permanently raise the City portion of the sales tax from 4.0 to 4.5 percent in 2009. Additional revenues were sought to help close budget gaps that had worsened in the aftermath of the financial crash. This was the first permanent increase in the sales tax since 1974. In FY 2011, the first full year the increase was in effect, it generated $580 million.71 While business taxes were not cut steeply during the Bloomberg Administration, three significant tax reductions were enacted. The first of these was a 2007 action to reduce by 50 percent the income-plus compensation alternative tax base for the corporate tax. This reduction was phased in with a full-year foregone tax amount of $110 million in FY 2011. (It is likely that this cost will grow over time even though current budget office forecasts show the cost of this tax cut as remaining at $110 million since such forecasts often are not adjusted for future economic growth.) The second significant business tax cut was pursued partly in response to the concerns of “freelancers” regarding their tax liability under the Unincorporated Business Tax (UBT). In response, the Mayor and the Council acted to raise the credit against the personal income tax for UBT tax payment, effective for tax year 2007. However, income eligibility for this tax reduction was not limited, with the UBT credit against the personal income tax rising from 15 to 23 percent for taxpayers with taxable income over $142,000. The effect of not limiting the credit increase was that the bulk of the added credit went to the UBT payers with the highest unincorporated business incomes. Thus, between tax year 2005 (before the 2007 credit increase) and tax year 2007 (the first year of the credit increase), approximately 8,000 UBT payers with adjusted gross income under $150,000 received approximately $2 million in additional UBT credits against their City personal income tax. However, the 5,000 UBT
70 New York City Office of Management and Budget, Forecast Documentation, November 2014 Plan, FY 2015-2019, November 2014. 71 Ibid.
FPI January 13, 2015 61

New York City Taxes—Trends, Impact and Priorities for Reform
payers with adjusted gross incomes of $1 million or more, received a credit boost of $60 million.72 The third significant business tax break had to do with the adoption in 2009 of a series of business tax changes to move toward conformity with New York State’s business tax regime, which had recently switched from a three-factor business allocation formula to a single-factor formula utilizing only receipts. Along with other changes, some of which increased revenues in the near-term, the City acted to phase in over 10 years the single sales factor (SSF) appor-tionment method. This affected all three of the City’s business taxes. The City estimates that the transition to SSF reduced business taxes by $83 million as of FY 2011. The IBO estimates that the last five years of SSF phase-in will cost the City $265 million in business taxes.73 While the City did not act during the Bloomberg era to permanently raise taxes on high income households, the State has made changes in recent years that have produced that result. Effective with tax year 2009, for taxpayers with incomes over $1 million, the state limited allowable deductions to 50 percent of a taxpayer’s charitable contributions. This change flowed through to the City’s income tax as well. Effective the following year, for taxpayers with incomes over $10 million, the state limited allowable deductions to 25 percent of a taxpayer’s charitable contributions, again with this change having a similar effect on the City income tax. Together, these two deduction limitations raised approximately $80 million in revenue in FY 2014.74 In 1997, the State enacted the STAR (School Tax Relief) program to provide education aid and tax relief to localities. STAR enables localities to reduce taxes and provides an offsetting amount of State STAR aid. In New York City, STAR allows reductions in the property tax for primary residences and reductions in personal income tax liability through both a rate cut and a refundable credit. In FY 2014, State STAR aid reduced property taxes by $225 million and City personal income taxes by $613 million. In 2008, the State eliminated the STAR income tax credit for taxpayers with incomes above $250,000, and in 2010, the state eliminated the STAR rate cut on income tax for filers with taxable income over $500,000, raising the City’s top personal income tax rate slightly to 3.876 percent. In 2012, the State eliminated STAR property tax relief for homeowners with incomes over $500,000.75 At an estimated value of $175 million, the STAR income tax rate cut was by far the most significant component of the STAR-related changes affecting high-income households.76 Since most property tax breaks—the Madison Square Garden tax break appears to be the exception—come up for renewal every few years, there are ready-made opportunities for City leaders to seek reforms in Albany. The three most costly property tax expenditures—421-a,
72 New York City Office of Management and Budget, Tax Revenue Forecasting Documentation, Financial Plan Years 2013-2017, July 2014; and New York City Department of Finance, Annual Report on Tax Expenditures, reports for 2009 (PIT tax year 2005) and 2010 (PIT tax year 2007). 73 New York City Department of Finance, Annual Report on Tax Expenditures, FY 2014, February, 2014, p. 73; New York City Independent Budget Office, Budget Options for New York City, November 2014, p. 64. 74 New York City Office of Management and Budget, Tax Revenue Forecasting Documentation, Financial Plan Years 2013-2017, July 2014, pp. II-49-50; and New York City Office of Management and Budget, Forecast Documentation, November 2014 Plan, FY 2015-2019, November 2014. 75 New York City Office of Management and Budget, Tax Revenue Forecasting Documentation, Financial Plan Years 2013-2017, July 2014, pp. I-25, II-38, II-49-50. 76 New York City Office of Management and Budget, Forecast Documentation, November 2014 Plan, FY 2015-2019, November 2014.
FPI January 13, 2015 62
New York City Taxes—Trends, Impact and Priorities for Reform
ICIP, and the co-op/condo abatement—have come up for renewal multiple times in recent years, and despite criticisms, the Bloomberg Administration failed to win, or even to seriously seek, meaningful changes. In 2008, relatively minor changes were made in the 421-a program, while the ICIP program was made into a property tax abatement instead of an exemption and was renamed the Industrial and Commercial Abatement Program (ICAP). There were slight changes to eligibility for benefits, and the duration of some benefits was shortened under ICAP. An important implication of the change to an abatement was that the dollar amount of a particular property’s ICAP tax break would not rise in subsequent years along with property assessments. Both programs were again renewed in 2011 with very slight changes. A more significant change was made when the co-op/condo abatement was extended for three more years in January 2013. Action was taken by the legislature at that time to phase out the benefits of the partial abatement for co-ops and condos that were not the primary residence of the owner. Subsequently, the Finance Department has found that nearly 89,000 co-ops and condos are owned by non-primary residents of New York City and that phasing out benefits for these units will increase property taxes by $94 million in FY 2015.77 Still, given the growing criticism of inequities in the property tax system and the fact that the co-op/condo abatement arguably has only made certain disparities worse, a more far-reaching reform should be pursued. In a similar vein, there are widespread concerns that the extremely high cost of 421-a does little to further the goal of improving the affordability of New York City housing. Also, as the most costly as-of-right business tax break, ICAP still appears to be providing significant tax benefits to projects, such as hotels, that very likely would proceed in the areas where they are being built even without the tax benefits. All three programs expire in 2015: ICAP on March 1, 421-a on June 15, and the co-op/condo abatement on June 20. In the last few years of the Giuliani administration the mayor was announcing costly retention deals almost monthly. Upon taking office, Mayor Bloomberg rejected with great fanfare the City’s offer of a retention deal for his financial information company, Bloomberg LLP, which at the time was preparing to build a 55-story headquarters building in Midtown Manhattan. While Mayor Bloomberg sharply curtailed the Giuliani administration practice of handing out retention packages to dozens of large corporations, he did support a few very costly tax subsidy agreements involving the Bank of America building near Bryant Park and the Goldman Sachs headquarters in Battery Park City. Together with Governor George Pataki, Mayor Bloomberg approved a 2005 incentives package for Goldman Sachs consisting of property, sales, and utility tax breaks as well as cash grants and tax-exempt bonds. All told, the package was worth an estimated $650 million to the Wall Street powerhouse.78 After stating early on in his first term that the City could not afford to subsidize new stadiums for the New York Yankees and New York Mets professional baseball teams, in his second term, former Mayor Bloomberg agreed to very lucrative subsidy arrangements for both teams. These deals will cost City taxpayers more than $1 billion over the life of the
77 New York City Department of Finance, The New York City Property Tax, FY 2014, June 2014, pp. 35-36. 78 Charles V. Bagli, “Chase Says It Will Move To Stamford If City Balks,” The New York Times, April 25, 2007.
FPI January 13, 2015 63
New York City Taxes—Trends, Impact and Priorities for Reform
agreements, including nearly $670 million in reduced property taxes and $63 million in savings on sales and mortgage recording taxes.79 However, the step Bloomberg took that had the most far-reaching repercussions for the City’s practice of subsidizing real estate development was his decision in 2005 to lock the City into massive property tax breaks in the Hudson Yards district. This move constituted by far the largest and most egregious tax giveaway in the city’s history. Over the next several decades, Bloomberg’s Hudson Yards tax giveaways will cost the city billions in tax revenues. In 2005, the City re-zoned the Hudson Yards district for high density residential and commercial development. Rather than rely on the Metropolitan Transportation Authority, which is controlled by the governor of New York State and not the New York City mayor, the City agreed to pay for extension of the #7 subway line through the heart of the district and to make several other infrastructure improvements. The general Hudson Yards area extends west of Eighth Avenue to Eleventh Avenue between West 30th and West 42nd Streets.80 In deciding to finance the #7 extension itself, the City could have used general obligation bonds but instead chose to set up a public benefit corporation, the Hudson Yards Infrastructure Corporation (HYIC). The plan was for the HYIC to sell bonds with the debt service covered by payments-in-lieu of taxes (PILOTs) and various development fees from real estate projects undertaken in the district. To the casual observer this may seem reasonable: dedicate property taxes and development fees from the area to pay for the infrastructure investments that help make the area attractive for development. However, the PILOT payments stemmed from agreements in which the City was committing to steeply discount property taxes, and to provide a three percent annual cap on the growth in property tax liability from the fifth through the nineteenth year.81 The three percent cap amounts to insurance against any property value appreciation above that level—a feature that could prove extremely costly to the City. It is a cap that will almost certainly become a source of contention with other central business district commercial property owners who will see their effective tax rates climb much faster in periods when property values appreciate rapidly. (Property tax caps of six percent on 1-3 family homes, or 20 percent over five years, have been the source of much consternation and considerable inequities since they were first allowed in the early 1980s, a topic that is discussed further in the following section.) The magnitude of the Hudson Yards tax breaks only became widely understood when JPMorgan Chase sought an additional subsidy of $1 billion in October 2014 when considering constructing a new headquarters in the Hudson Yards district. In rebuffing the
79 See the extensive documentation on these subsidies compiled by Good Jobs New York, Yankee Stadium and Mets’ Citifield, January 2014. http://www.goodjobsny.org/economic-development/yankee-stadium-and-mets-citifield. 80 For purposes of the City’s Hudson Yards tax exemption policy, the Hudson Yards area includes the Madison Square Garden site between 7th and 8th Avenues and West 31st and West 33rd Streets. New York City Industrial Development Agency, First Amendment to the Third Amended and Restated Uniform Tax Exemption Policy of the New York City Industrial Development Agency (NYC IDA UTEP, for short), as approved on August 3, 2010 by the Board of Directors of the New York City Industrial Development Agency. 81 Property tax discounts are specified in a complex arrangement that provides steeper discounts (up to 40 percent) to early projects in the Hudson Yards area west of Tenth Avenue and for development between Eighth and Tenth Avenues until certain development milestones (5 million square feet [msf], 10 msf, 15 msf, and 20msf) are reached for the area west of Tenth Avenue. The Madison Square Gardens site will benefit from the three percent growth cap for years 5-19. NYC IDA UTEP, Appendix F, “Tax Exemption Policy for the Hudson Yards UTEP Area.”
FPI January 13, 2015 64
New York City Taxes—Trends, Impact and Priorities for Reform
bank’s request, the de Blasio administration pointed out that the bank would already get about $600 million in tax breaks under the as-of-right program established under Mayor Bloomberg.82 While there are no official estimates of the ultimate likely cost of the property tax breaks the previous mayor granted for Hudson Yards, they likely will run into the billions of dollars over the next four decades or longer.83 Senator Charles Schumer, an outspoken proponent of expanding commercial development in the Hudson Yards area, believed the infrastructure investment the City was making in the area was sufficient to attract development. Schumer told an audience at the Partnership for New York City in the summer of 2005: “I do not believe we need to give developers tax breaks to get them to the West Side. …Traditionally in this city, infrastructure alone is sufficient to induce development.”84 Some people have referred to the Hudson Yards PILOTs as a form of Tax Increment Financing (TIF). However, the PILOTs might more properly be called “tax decrement financing,” since they are premised on steep and long-duration property tax breaks that will make it more difficult for the City and the HYIC to retire the Hudson Yards debt.85 After reviewing the Hudson Yards tax breaks and the financing method linked to those property tax breaks in 2007, the Committee on New York City Affairs of the New York City Bar Association concluded:
The need to grant the subsidies [tax breaks] could have been avoided if the financing method selected had been general obligation debt. If that alternative had been chosen and approved, PILOTs would not have been necessary, the properties would have remained on the tax rolls, and non-discounted real estate tax revenues would have flowed to the City’s general fund.86
As anticipated by the Bar Association Committee, Midtown property owners have cited the Hudson Yards tax breaks in seeking to extend their own tax breaks or to create new tax breaks so that they can “compete” with the West Side.
82 Charles V. Bagli, “JPMorgan Chase Seeks Incentives to Build New Headquarters in Manhattan,” The New York Times, October 17, 2014. 83 The NYC IDA UTEP specifies that the duration of the Hudson Yards property tax breaks will run for “a minimum period of 35 years and a maximum period of 99 years from the PILOT Commencement Date, as determined by the Staff and approved by the Board.” NYC IDA UTEP, Appendix F-2. 84 Cited in James A. Parrott, Fiscal Policy Institute, Hudson Yards Tax Breaks, Unwarranted and Fiscally Irresponsible, October 27, 2005. 85 TIFs were conceived as a method of capturing the taxes related to property value increases that result from a project investment and using those taxes to pay for the project investment. The idea behind a TIF is to use the incremental taxes that stem from an investment to pay for that investment. The Hudson Yards PILOTs, however, are discounted property taxes, not incremental property taxes. In a manner of speaking, the HYIC financing is an upside down TIF. It would have been much better for the city tax base to finance the #7 extension through the use of General Obligation bonds and to forego the use of tax breaks in an area where the city was making substantial infrastructure improvements. 86 Committee on New York City Affairs of the New York City Bar Association, Report on the Financing of the Hudson Yards Infrastructure Project, May 16, 2007, p. 15.
FPI January 13, 2015 65

New York City Taxes—Trends, Impact and Priorities for Reform
11. New York City tax reform considerations Every few years, interest builds in taking a serious look at reforming parts of New York City’s tax structure. There was a tax study commission at the end of Mayor Koch’s third term in 1988-1989. A real property tax reform task force, appointed by Mayor Dinkins and City Council Speaker Peter Vallone, Sr., issued a report at the very end of 1993. Deputy Mayor John Dyson chaired a tax reform committee under Mayor Giuliani that reported in October 1999, although most of its recommendations got sidelined when the State Legislature repealed the city’s commuter tax in the middle of its deliberations. Significant tax changes have also been proposed at various points by mayors or the City Council acting on their own initiative. With a new mayor and new leadership in the City Council, there is renewed interest in reforming New York City taxes. In its response to the mayor’s preliminary FY 2015 budget, the City Council recently advanced a tax reform agenda that included proposals for two tax reform-related commissions: one on property tax reform and one on tax expenditures.87 In testimony before the Council in early June, Finance Commissioner Jacques Jiha also voiced interest in undertaking significant property tax changes.88 The FY 2015 City budget adopted on June 26, 2014, includes a $424,000 appropriation to fund the work of a Tax Commission that would be established by the City Council. The adopted budget describes the commission’s purpose: “The temporary commission will be charged with the task of evaluating and recommending reforms that would improve the equity, efficiency, and transparency of New York City’s property tax system. In addition, it will examine the City’s tax expenditures on economic development and on housing also in an effort to increase their transparency and efficiency.”89 At this writing, it appears the Council will convene a Task Force on Economic Development Tax Expenditures, but it is not clear how the Council will approach reform of the property tax system. This section provides the Fiscal Policy Institute’s suggestions for needed local tax reforms. It begins with a discussion of the specific tax principles that should guide tax reform.
A. Priority principles to guide tax reform In thinking about the principles for a high-quality tax system discussed in Section 2, New York City generally is doing reasonably well in terms of adequacy and reliability, and diversification. The biggest challenges its tax system faces has to do with fairness, or equity, particularly in regard to the property tax, but also more broadly given the overall regressivity of local taxes. The extensive recourse to business tax breaks undermines accountability, violates economic neutrality in generally favoring large corporations, and reflects a lack of balance between tax burden and economic development. The tax-favored treatment of carried interest violates horizontal equity among businesses that pay the Unincorporated Business
87 The City Council’s Response to the Mayor’s FY 2015 Preliminary Budget and FY 2014 Preliminary Mayor’s Management Report, April 23, 2014, pp. 11-12. 88 Testimony of Finance Commissioner Jacques Jiha, City Council Hearing Regarding FY 2015 Executive Budget Briefing, June 6, 2014. 89 The Council of the City of New York, FY 2015 Adopted Expense Budget, Adjustment Summary/Schedule C, June 25, 2014, p. 76.
FPI January 13, 2015 66

New York City Taxes—Trends, Impact and Priorities for Reform
Tax. Finally, tax-reporting compliance is complicated for financial corporations that face different tax regimes at the City and State levels, particularly in light of the State’s repeal of the bank tax in the spring of 2014. However, the changes enacted at the State level appear to favor very large multi-state and multi-national banks and other financial firms, so it may not be desirable for the City to conform to the new State approach in taxing financial corporations, unless other reforms are made that provide offsetting revenues. The sub-sections that follow will delve more deeply into some of the particular areas that should be considered for reform.
B. Property tax inequities
In response to a Court of Appeals decision in 1975 finding that property tax assessment practices resulted in an uneven distribution of the property tax burden, the State Legislature enacted legislation in 1981 that created a property classification system in New York City and sanctioned different effective property tax rates for the different classes (Class 1, one- to three-family homes; Class 2, co-ops/condos and residential rentals; Class 3, utilities; and Class 4, commercial properties). Other provisions of the 1981 law exacerbated intra-class differences in effective tax rates. The 1981 legislation resulted, in part, because homeowners opposed the elimination of inter-class inequities, and the City resisted the rapid elimination of intra-class inequities because it would have required tax increases for many homeowners. In the mid-1980s, economist Matthew Drennan voiced a typical perspective shared by many observers since: “Rather than reforming the property tax, the [1981] State law has made progress towards reform more difficult.”90 Both horizontal and vertical inequities have mounted over the years since 1981, and despite repeated calls for remedial action from a variety of interest perspectives, no meaningful, politically-viable reform proposal has emerged from either City Hall or Albany. In its recent call for property tax reform, the City Council stated: “Numerous studies have pointed out that the current system is rife with inequalities with properties of similar value and use having very different tax bills. The system is also inordinately complex, making it difficult to administer and nearly impossible for taxpayers to understand.”91 An extensive IBO report in 2006 on the 25th anniversary of the 1981 state law documented how the major inequities had worsened since the early 1980s and explained how various provisions of state law had contributed to that result.92 Class shares: At the time the 1981 legislation was enacted, effective property tax rates were much lower for 1-3 family homes than for commercial or other residential properties. A key element of the 1981 law was to establish class shares of the overall property tax levy based on the 1981 levies that existed pre-enactment. This had the effect of both building in the existing disparities and, in light of subsequent developments, contributing to the further widening in disparities. The class shares are adjusted each year for physical changes resulting
90 Matthew Drennan, “Local Economy and Local Revenues,” in Setting Municipal Priorities, 1986, edited by Charles Brecher and Raymond D. Horton, New York: New York University Press, 1985. 91 The City Council’s Response to the Mayor’s FY 2015 Preliminary Budget and FY 2014 Preliminary Mayor’s Management Report, April 23, 2014, p. 11. 92 New York City Independent Budget Office, Twenty-Five Years After S7000A: How Property Tax Burdens Have Shifted in New York City, December 5, 2006.
FPI January 13, 2015 67

New York City Taxes—Trends, Impact and Priorities for Reform
from new construction and were intended to be modified periodically in relation to changes in market value shares. A 2006 IBO report notes the combination of subsequent state legislation and actions by the Mayor and the City Council that have thwarted any significant market value-based adjustment in the share of the tax levy paid by Class 1 properties. The IBO estimated that, had class shares been adjusted for relative market value changes between 1984 and 2007, the Class 1 levy share would have been 25.4 percent rather than 15.2 percent.93 Figure 24 below shows the continuing disparity in effective property tax burdens between Class 1 and the other classes. However, these precise comparisons are inexact since effective tax rates are measured relative to market values determined using different methods for different classes. For FY 2014, the Finance Department data show that Class 1 accounts for 46 percent of the total market value of taxable New York City real property but only 15 percent of the taxes levied. Class 4, on the other hand, accounts for 27 percent of market value but 41 percent of the tax levy. Classes 2 and 4 have effective tax rates roughly four-and-a-half times that of the 0.83 percent effective tax rate for Class 1. However, as noted below, the Class 2 tax levy falls disproportionately on rental as opposed to co-op and condo properties because of the under-valuation of co-ops and condos. FIGURE 24: New York City property class shares of market value and tax levy and effective tax rates, FY 2014
FY 2014Market Value
($ millions)Share of
market valueTax levy
($ millions)Share of tax levy
Effective tax rate
Class 1 $396,854.7 46.2% $3,297.0 15.5% 0.83%Class 2 * $202,479.4 23.6% $7,822.8 36.8% 3.86%Class 3 $28,192.8 3.3% $1,457.4 6.8% 5.17%Class 4 $230,575.5 26.9% $8,708.1 40.9% 3.78%
New York City total $858,102.4 100.0% $21,285.3 100.0% 2.48%
Source: NYC Dept. of Finance, The New York City Property Tax FY 2014 , June 2014, p. i.
* Note: Finance Department market value data reflect the valuation of co-op and condo buildings as rental properties.
Assessment caps and phase-ins: Another feature of the 1981 law was to cap assessment increases for Class 1 properties (including buildings with 3 or fewer condos) at 6 percent in a single year and 20 percent over five years, regardless of market value growth. From 1986 to 1994, legislation was passed to extend modified assessment caps to subcategories of small apartment buildings (co-op, condo, and rental buildings with fewer than 11 units). Assessment phase-ins were established for Class 2 buildings with more than 10 units and for Class 4 properties, under which any assessment increase due to market conditions is phased in by 20 percent a year for five years. Under the Class 2- large building and Class 4 assessment phase-ins, the City eventually captures all of the market value appreciation, while under the Class 1 and Class 2-small building assessment caps, the City might never see some of the market value rise reflected in assessed property taxes.94
93 Ibid., pp. 20-21. 94 Ibid., p. 16.
FPI January 13, 2015 68
New York City Taxes—Trends, Impact and Priorities for Reform
Co-op and condo undervaluation: One of the most perverse aspects of the 1981 property tax law was a requirement (section 581) that the City value co-ops and condos as if they were rental buildings. Whereas Class 1 properties are valued based on comparable sales, Class 2 rental properties are valued based on a capitalized net income method. In order to estimate a market value for co-ops and condos, City assessors must impute an income for co-ops and condos using information from “comparable” nearby rental buildings. In reality, since most rental buildings of similar age and location to co-ops and condos are rent-regulated buildings, the “rental comparable” income valuation approach typically understates the market value of co-ops and condos. This disparity in the market valuation of co-ops and condos has dramatically widened in periods when residential real estate prices have risen rapidly. The City’s IBO estimated that by 2007d the official Finance Department valuation method under section 581 lowered market values for co-ops and condos by 78 percent compared to a sales-based market value.95 In recent years, due to improvements in assessment procedures at the Finance Department, the 581 discount has been lowered, although it is still substantial. Co-op/condo abatement: With provisions of the 1981 law disproportionately helping Class 1 properties (1-3 family homes), co-op and condo effective tax rates rose faster than Class 1 rates in the 1980s and early 1990s. One of the main recommendations of the 1993 Property Tax Reform Commission was to bring co-op and condo taxes more into line with Class 1 taxes. This culminated in the 1997 passage of a co-op/condo abatement program to reduce the differential in half. The abatement provided most co-op and condo owners with a 17.5 percent tax reduction. Initially meant to be a temporary three-year abatement while a more permanent solution was developed, the abatement has been regularly extended several times, most recently in January 2013.96 By 2013, the IBO noted that, even without the abatement, many co-op and condo owners had effective tax rates on a par with Class 1 owners, and about 60 percent of the tax break in 2012 was in excess of what was needed to equalize tax burdens with homeowners. Moreover, the IBO noted that much of the excess abatement went to (presumably higher-income) apartment owners on the Upper East and Upper West Sides.97 Resulting inequities: Figure 24 presented the effective tax rate inequities in the class shares. There are also substantial intra-class disparities in the City’s current property tax system. The operation of the assessment caps has also resulted in wide disparities in Class 1 effective tax rates across neighborhoods. According to the IBO, in 1984, the Brooklyn Heights-Ft. Greene neighborhood and Flatbush, also in Brooklyn, had roughly similar effective tax rates (1.359 and 1.348, respectively). Class 1 market values rose considerably in every New York City neighborhood between 1984 and 2007 and reduced effective tax rates everywhere. But, because market values rose about 3 percent faster annually, on average, in Brooklyn Heights-Ft. Greene than in Flatbush, the effective tax rate for the former dropped much further, to 0.257 percent in 2007, compared to 0.462 percent in Flatbush.98 The most pronounced form of intra-class inequity is that between rental buildings and co-ops and condos within Class 2. This results mainly from undervaluation of co-ops and condos
95 Ibid., p. 33. 96 Ibid., p. 34; and New York City Independent Budget Office, The Co-op & Condo Tax Break Has Expired, Giving Albany Chance for Long-Promised Fix, January 2013. 97 IBO, The Co-op & Condo Tax Break Has Expired, Giving Albany Change for Long-Promised Fix, p. 1 98 New York City Independent Budget Office, Twenty-Five Years After S7000A: How Property Tax Burdens Have Shifted in New York City, December 5, 2006, Table 6, p. 31.
FPI January 13, 2015 69

New York City Taxes—Trends, Impact and Priorities for Reform
relative to rental buildings. Given that property taxes are levied on a class share basis, this means that when the Class 2 share is allocated, rental buildings bear a higher proportion of the Class 2 tax levy. Large rental buildings are further disadvantaged since their assessments are not capped as are the assessments of small co-op, condo, and rental buildings; while condos in large buildings share this disadvantage, the effective tax rate for all co-ops and condos is much lower than for large rentals. The co-op/condo abatement has exacerbated the intra-class inequity between rental buildings and co-ops and condos. Figure 25 illustrates the disparities in effective tax rates across the different categories of residential properties. Drawn from IBO estimates, Figure 25 shows the lower effective tax rate enjoyed by 1-3 family homes and how the intra-class disparities between co-ops and condos on the one hand, and rental apartments on the other (indicated in the table below by type of rental building, “walkups” or “elevators”), widened in the decade (1997-2007) following the enactment of the co-op/condo tax abatement. FIGURE 25: Net effective tax rates for selected property types, 1984 - 2007
per $100 of market value
Fiscal year 1-3 Family Co-ops Condos Walkups Elevators 2A/2B Class 3 Class 41984 1.32 0.96 0.94 4.54 3.64 2.22 4.58 4.331987 0.88 0.97 0.79 3.22 2.60 1.63 4.55 3.241997 0.77 1.86 1.63 4.03 3.38 2.12 3.48 3.812007 0.46 0.68 0.68 4.21 3.72 0.78 5.15 3.56
Source: NYC Independent Budget Office, Twenty-Five Years After S7000A: How Property Tax Burdens Have Shifted in New York City (December 2006), Table 2.
To illustrate the severity of the undervaluation of co-ops and condos using the “comparable rental” basis method, the Furman Center at New York University in 2012 compiled a list of 50 individual co-op/condo unit sales where the sales price of each unit exceeded the Department of Finance’s estimated market value for the entire building containing each co-op or condo that was sold. Included in the list were 15 sales on the Upper East Side in buildings that average 18 units each. As in the case of one Upper East Side sale for $54 million where the entire building was valued by Finance at $41 million, the sale price for individual units often well-exceeded the estimated value for the entire building. Thus, for the sales identified in the Furman Center analysis, many Upper East Side co-op buildings are valued for New York City tax purposes at a fraction of their true market value.99 In a report published in December 2013 by the Citizens Budget Commission, law professor and economist Andrew Hayashi estimated effective tax rates for various property types using a comparable sales approach to determine market values for co-op and condos. See Figure 26. As noted earlier, improvements in Finance Department valuation methods in recent years have acted to increase market valuations for co-ops and condos and have narrowed the effective tax rate differential between 1-3 family homes and co-ops and condos. Hayahsi introduced the data shown in Figure 26 as follows: “Caps, phase-ins, and the undervaluation of condos and co-ops result in a property tax regime with pervasive intra-class inequities.” He
99 Furman Center for Real Estate & Urban Policy, New York University, Shifting the Burden: Examining the Undertaxation of Some of the Most Valuable Properties in New York City, July 2013.
FPI January 13, 2015 70
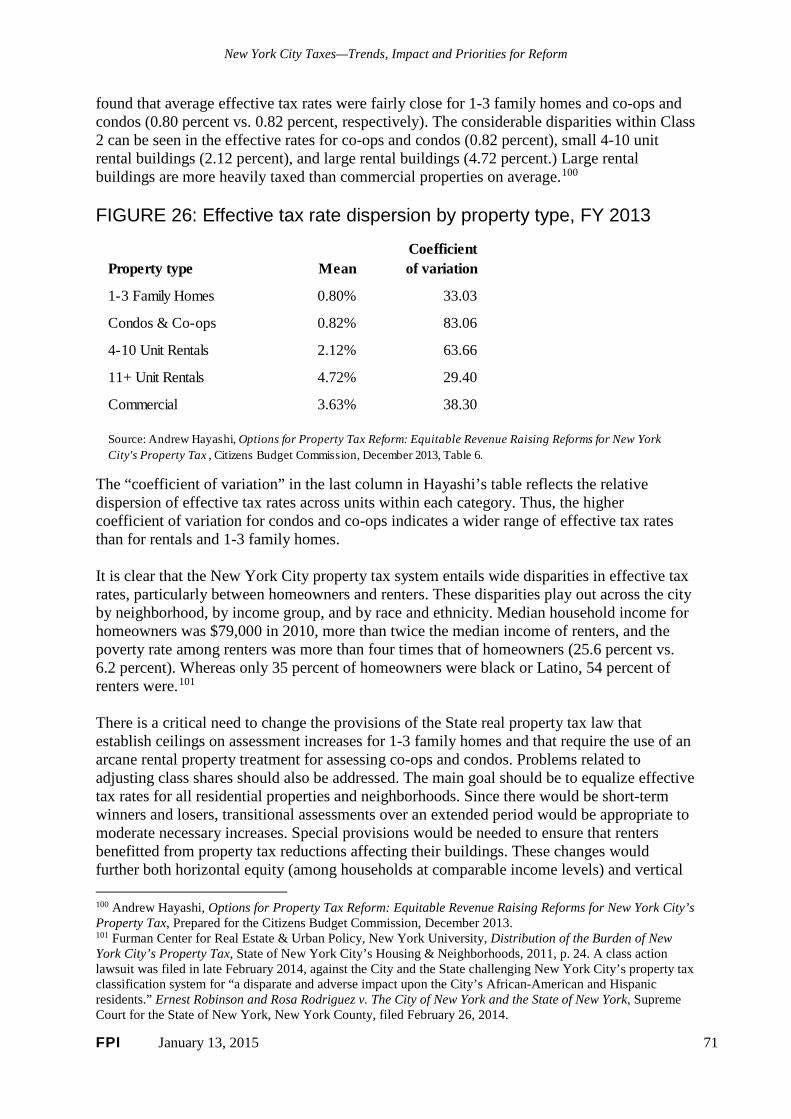
New York City Taxes—Trends, Impact and Priorities for Reform
found that average effective tax rates were fairly close for 1-3 family homes and co-ops and condos (0.80 percent vs. 0.82 percent, respectively). The considerable disparities within Class 2 can be seen in the effective rates for co-ops and condos (0.82 percent), small 4-10 unit rental buildings (2.12 percent), and large rental buildings (4.72 percent.) Large rental buildings are more heavily taxed than commercial properties on average.100 FIGURE 26: Effective tax rate dispersion by property type, FY 2013
Property type MeanCoefficient of variation
1-3 Family Homes 0.80% 33.03
Condos & Co-ops 0.82% 83.06
4-10 Unit Rentals 2.12% 63.66
11+ Unit Rentals 4.72% 29.40
Commercial 3.63% 38.30
Source: Andrew Hayashi, Options for Property Tax Reform: Equitable Revenue Raising Reforms for New York City's Property Tax , Citizens Budget Commission, December 2013, Table 6.
The “coefficient of variation” in the last column in Hayashi’s table reflects the relative dispersion of effective tax rates across units within each category. Thus, the higher coefficient of variation for condos and co-ops indicates a wider range of effective tax rates than for rentals and 1-3 family homes. It is clear that the New York City property tax system entails wide disparities in effective tax rates, particularly between homeowners and renters. These disparities play out across the city by neighborhood, by income group, and by race and ethnicity. Median household income for homeowners was $79,000 in 2010, more than twice the median income of renters, and the poverty rate among renters was more than four times that of homeowners (25.6 percent vs. 6.2 percent). Whereas only 35 percent of homeowners were black or Latino, 54 percent of renters were.101 There is a critical need to change the provisions of the State real property tax law that establish ceilings on assessment increases for 1-3 family homes and that require the use of an arcane rental property treatment for assessing co-ops and condos. Problems related to adjusting class shares should also be addressed. The main goal should be to equalize effective tax rates for all residential properties and neighborhoods. Since there would be short-term winners and losers, transitional assessments over an extended period would be appropriate to moderate necessary increases. Special provisions would be needed to ensure that renters benefitted from property tax reductions affecting their buildings. These changes would further both horizontal equity (among households at comparable income levels) and vertical
100 Andrew Hayashi, Options for Property Tax Reform: Equitable Revenue Raising Reforms for New York City’s Property Tax, Prepared for the Citizens Budget Commission, December 2013. 101 Furman Center for Real Estate & Urban Policy, New York University, Distribution of the Burden of New York City’s Property Tax, State of New York City’s Housing & Neighborhoods, 2011, p. 24. A class action lawsuit was filed in late February 2014, against the City and the State challenging New York City’s property tax classification system for “a disparate and adverse impact upon the City’s African-American and Hispanic residents.” Ernest Robinson and Rosa Rodriguez v. The City of New York and the State of New York, Supreme Court for the State of New York, New York County, filed February 26, 2014.
FPI January 13, 2015 71

New York City Taxes—Trends, Impact and Priorities for Reform
equity (among households at different income levels) and go a long way in promoting administrative efficiency and accountability and reducing complexity. Commercial property taxation: The fact that the Class 4 commercial property tax share is greater than its market value share is also an issue that should be examined. The Lincoln Institute of Land Policy estimates that among the largest cities in each state, New York City has the highest ratio of commercial property to homeowner taxation, which the Institute considers as a summary measure of the degree to which homeowner property taxes are subsidized by commercial property owners.102 However, the usefulness of such a comparison is limited in New York City’s case since few large cities rely, as does New York City, on a local personal income tax to moderate property taxes. In FY 2014, commercial property tax expenditures provided for economic development purposes totaled $1.36 billion, about one-sixth of the total $8.71 billion class 4 tax levy. Under the fixed class share system, a property tax break for a relative handful of favored property owners increases the tax burden on all other class 4 properties. Given the Bloomberg administration’s decision to provide steep property tax breaks to the extensive commercial development taking place within the Hudson Yards District, this problem will grow in coming years. Finally, the 421-a property tax exemption has become the City’s costliest tax break at $1.1 billion, and it is of questionable value since it overwhelmingly benefits market-value housing. It expires in June 2015 and needs to be restructured to concentrate benefits on the construction of truly affordable housing units. This would help the City address its ambitious affordable housing goal.
C. Personal Income Tax
The City’s personal income tax is mildly progressive but not progressive enough to offset the regressive impacts of the sales and property taxes. The current top rate is 3.876 percent, but when combined with the top state income tax rate of 8.82 percent, the top state and local income tax rate in New York is 12.696 percent. That was higher in 2014 than any state except California, which has a top income tax rate of 13.3 percent. At present, New York State’s top rate is authorized through 2017 and unless extended will revert to a top rate of 6.85 percent. While the personal income tax share of city taxes is higher than it was in 1980 or 1990, it has remained around 20-21 percent over the past 20 years, with surges to 25 percent in 2001 and 2008 during peak years for capital gains and Wall Street bonuses. This relative stability is surprising, since if the local income tax were more robustly progressive, its share would be rising along with the continued concentration of income at the top. From 1995 to 2012, the share of total income going to the richest one percent in New York City rose from a very high level of 20 percent to nearly twice that, an estimated 39 percent, reflecting a pronounced degree of income polarization.103 According to the IBO, the richest one percent of New York
102 Minnesota Center for Fiscal Excellence and Lincoln Institute of Land Policy, 50-state Property Tax Comparison Study, March 2014. 103 FPI estimates for New York City, January 2014. National data from Emmanuel Saez at the University of California at Berkeley indicate that the share of income received by the top 1 percent in the United States rose from 19.7 percent in 2011 to 22.5 percent in 2012. http://eml.berkeley.edu/~saez/.
FPI January 13, 2015 72
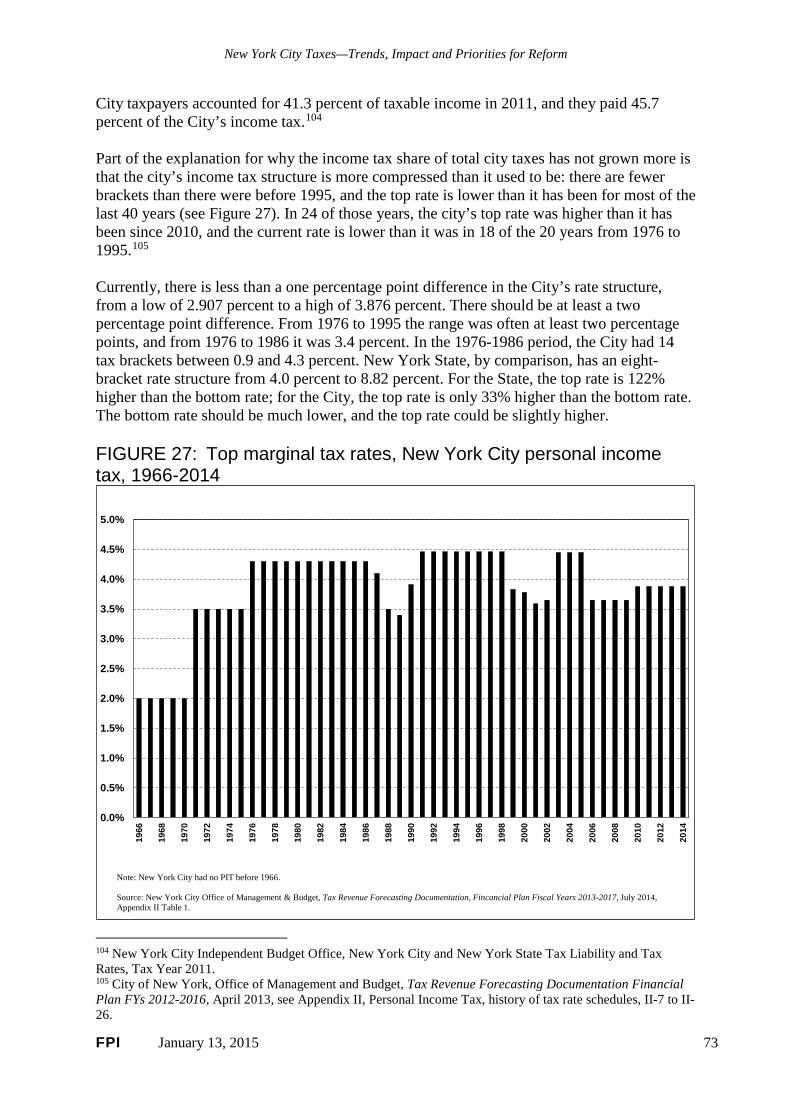
New York City Taxes—Trends, Impact and Priorities for Reform
City taxpayers accounted for 41.3 percent of taxable income in 2011, and they paid 45.7 percent of the City’s income tax.104 Part of the explanation for why the income tax share of total city taxes has not grown more is that the city’s income tax structure is more compressed than it used to be: there are fewer brackets than there were before 1995, and the top rate is lower than it has been for most of the last 40 years (see Figure 27). In 24 of those years, the city’s top rate was higher than it has been since 2010, and the current rate is lower than it was in 18 of the 20 years from 1976 to 1995.105 Currently, there is less than a one percentage point difference in the City’s rate structure, from a low of 2.907 percent to a high of 3.876 percent. There should be at least a two percentage point difference. From 1976 to 1995 the range was often at least two percentage points, and from 1976 to 1986 it was 3.4 percent. In the 1976-1986 period, the City had 14 tax brackets between 0.9 and 4.3 percent. New York State, by comparison, has an eight-bracket rate structure from 4.0 percent to 8.82 percent. For the State, the top rate is 122% higher than the bottom rate; for the City, the top rate is only 33% higher than the bottom rate. The bottom rate should be much lower, and the top rate could be slightly higher. FIGURE 27: Top marginal tax rates, New York City personal income tax, 1966-2014
0.0%
0.5%
1.0%
1.5%
2.0%
2.5%
3.0%
3.5%
4.0%
4.5%
5.0%
1966
1968
1970
1972
1974
1976
1978
1980
1982
1984
1986
1988
1990
1992
1994
1996
1998
2000
2002
2004
2006
2008
2010
2012
2014
Note: New York City had no PIT before 1966.
Source: New York City Office of Management & Budget, Tax Revenue Forecasting Documentation, Fincancial Plan Fiscal Years 2013-2017, July 2014, Appendix II Table 1.
104 New York City Independent Budget Office, New York City and New York State Tax Liability and Tax Rates, Tax Year 2011. 105 City of New York, Office of Management and Budget, Tax Revenue Forecasting Documentation Financial Plan FYs 2012-2016, April 2013, see Appendix II, Personal Income Tax, history of tax rate schedules, II-7 to II-26.
FPI January 13, 2015 73

New York City Taxes—Trends, Impact and Priorities for Reform
There is also a particularly anomalous result that should be a high priority for any local tax reform effort. According to analysis by the IBO, there are approximately 200,000 low-income New York City households that do not have a positive income tax liability at the federal or state level yet do have to pay New York City personal income taxes. The more generous federal and state Earned Income Tax Credits (EITC) offset the income tax liability. New York City should either raise the income threshold below which no tax is owed, increase its EITC, or undertake some combination of the two to eliminate a local income tax liability for these households. Currently, the state EITC is 30 percent of the federal EITC, and the City EITC is five percent of the federal EITC. In early 2014, President Obama proposed enhancing the federal EITC and extending it to more childless households and to low-income workers aged 21-24 and those aged 65 and 66. Extending EITC eligibility along these lines, even in the absence of federal action, would assist tens of thousands of low-income New York City households. In 2011, over 910,000 city low-income households benefited from the city’s EITC. Seventy percent of the EITC households had adjusted gross income of less than $20,000. The total amount of the EITC credits in that year was $97.5 million, providing an average of $107 per household. However, in a peculiarly ironic twist, the City provides 5,144 households with adjusted gross incomes of $1 million or more an average credit of $19,261 against the City’s personal income tax for unincorporated business tax payments. The total cost of this city credit for 5,000-plus millionaires is $99 million dollars, slightly more than what the City provides through the EITC to 910,000 low-income households.106 Since the personal income tax is the one local tax that helps offset the regressivity of the sales and property taxes, the main priority should be to further enhance the income tax’s progressivity. This can be achieved through a combination of changing the rate structure to increase the number of brackets below the current top rate; enhancing the City’s EITC and extending it to childless couples, and workers 21-24 and 65-66; and possibly also enhancing the city’s child and dependent care and household credits. The combined city and state top income tax rates are already relatively high so there is a limit on raising the City’s top rate. (However, this could change if the State does not continue the current 8.82 percent top rate when it expires at the end of 2017.) Modifying the credit on the personal income tax for unincorporated business tax payments for those with high incomes will increase progressivity. Before raising the City’s top tax rate, consideration should be given to adding a rate benefit recapture provision as used at the state level.
D. Taxing commuters From 1971 until 1999, New York City taxed those who worked in the city but lived in the suburbs. The tax (0.45 percent of wages and salaries earned in the city by commuters and 0.65 percent of proprietors’ income) was repealed by the state legislature in 1999, over the objections of city officials. Commuters make extensive use of the city’s infrastructure; they are protected by the city’s public safety, fire-fighting and emergency services; and they certainly benefit from the city’s position as a major international business center. It would be neither unfair nor unusual to require them to pay a portion of their earnings for these benefits.
106 City of New York, Department of Finance, Annual Report on Tax Expenditures, FY 2014, February 2014, pp. 115, 118.
FPI January 13, 2015 74
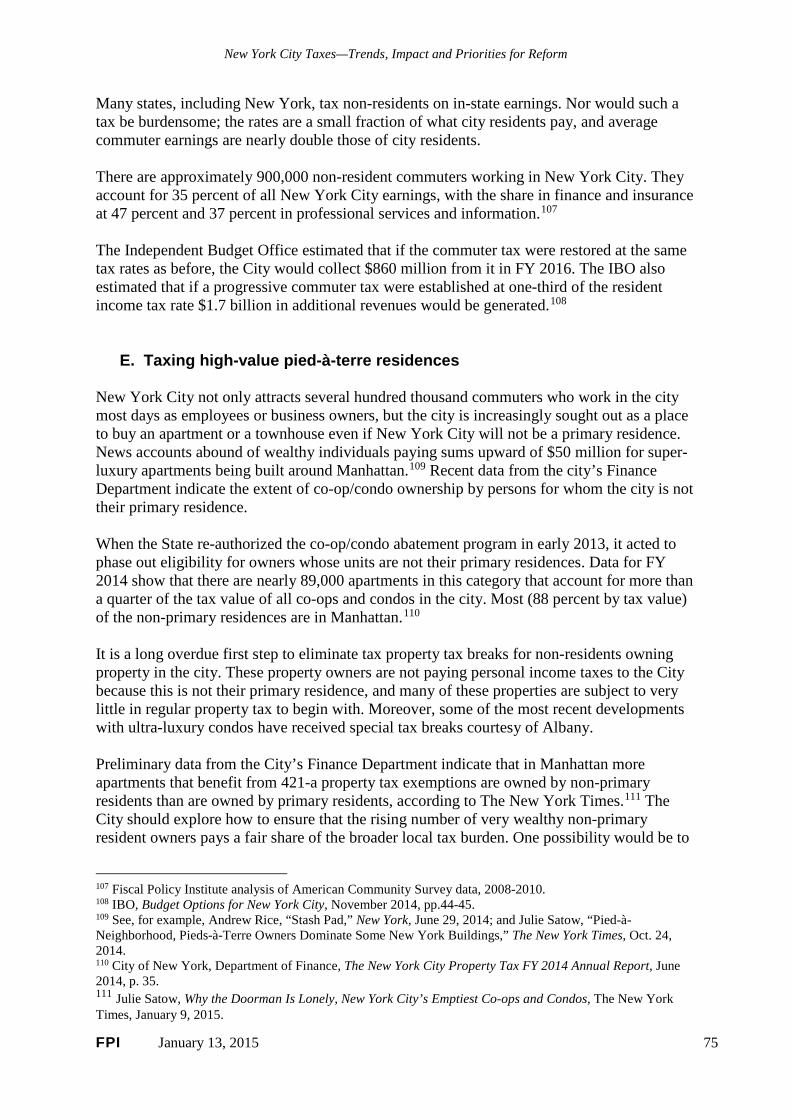
New York City Taxes—Trends, Impact and Priorities for Reform
Many states, including New York, tax non-residents on in-state earnings. Nor would such a tax be burdensome; the rates are a small fraction of what city residents pay, and average commuter earnings are nearly double those of city residents. There are approximately 900,000 non-resident commuters working in New York City. They account for 35 percent of all New York City earnings, with the share in finance and insurance at 47 percent and 37 percent in professional services and information.107 The Independent Budget Office estimated that if the commuter tax were restored at the same tax rates as before, the City would collect $860 million from it in FY 2016. The IBO also estimated that if a progressive commuter tax were established at one-third of the resident income tax rate $1.7 billion in additional revenues would be generated.108
E. Taxing high-value pied-à-terre residences New York City not only attracts several hundred thousand commuters who work in the city most days as employees or business owners, but the city is increasingly sought out as a place to buy an apartment or a townhouse even if New York City will not be a primary residence. News accounts abound of wealthy individuals paying sums upward of $50 million for super-luxury apartments being built around Manhattan.109 Recent data from the city’s Finance Department indicate the extent of co-op/condo ownership by persons for whom the city is not their primary residence. When the State re-authorized the co-op/condo abatement program in early 2013, it acted to phase out eligibility for owners whose units are not their primary residences. Data for FY 2014 show that there are nearly 89,000 apartments in this category that account for more than a quarter of the tax value of all co-ops and condos in the city. Most (88 percent by tax value) of the non-primary residences are in Manhattan.110 It is a long overdue first step to eliminate tax property tax breaks for non-residents owning property in the city. These property owners are not paying personal income taxes to the City because this is not their primary residence, and many of these properties are subject to very little in regular property tax to begin with. Moreover, some of the most recent developments with ultra-luxury condos have received special tax breaks courtesy of Albany. Preliminary data from the City’s Finance Department indicate that in Manhattan more apartments that benefit from 421-a property tax exemptions are owned by non-primary residents than are owned by primary residents, according to The New York Times.111 The City should explore how to ensure that the rising number of very wealthy non-primary resident owners pays a fair share of the broader local tax burden. One possibility would be to
107 Fiscal Policy Institute analysis of American Community Survey data, 2008-2010. 108 IBO, Budget Options for New York City, November 2014, pp.44-45. 109 See, for example, Andrew Rice, “Stash Pad,” New York, June 29, 2014; and Julie Satow, “Pied-à-Neighborhood, Pieds-à-Terre Owners Dominate Some New York Buildings,” The New York Times, Oct. 24, 2014. 110 City of New York, Department of Finance, The New York City Property Tax FY 2014 Annual Report, June 2014, p. 35. 111 Julie Satow, Why the Doorman Is Lonely, New York City’s Emptiest Co-ops and Condos, The New York Times, January 9, 2015.
FPI January 13, 2015 75

New York City Taxes—Trends, Impact and Priorities for Reform
apply an effective property tax rate of four percent to apartments and homes owned by non-primary residents, and to value such housing units on a true market value basis. Four percent would approximate an average Class 4 effective property tax rate. If this pied-à-terre tax were applied on a graduated basis to the market value above $5 million, it could generate roughly $250 million annually.112
F. Issues related to business income taxes
• Implications for New York City of the state’s recent corporate tax reform Both the State and the City tax general corporation income and bank income. Corporations and banks operating in New York City understandably press the City and the State to harmonize their corporate tax regimes in the interests of administrative efficiency and ease of compliance. But, not surprisingly, they also press for tax changes to lighten their tax liability. The State recently enacted legislation that modified how it taxed corporations under Article 9-A, and it eliminated a separate bank tax by placing the remaining financial institutions covered by the bank tax under the Article 9A corporate tax. Without delving into the details of the State’s corporate tax reform here, suffice to say that the City will be pressed to follow the State in eliminating the separate bank tax.113 The challenge for New York City will be to conform to the State’s tax regime where advisable but to do so in a way that avoids a revenue loss. The City could ensure that conforming to the State does not reduce business tax collections by enacting other measures that help offset some of the projected tax loss.
• Eliminate cap on the capital tax base in the General Corporation Tax Corporations subject to the General Corporation Tax (GCT) must pay the highest of four calculations of tax liability, including one that figures the tax at 0.15 percent of business and investment capital allocated to New York City, subject to a cap of $1 million in liability. Because net operating losses from prior years can be carried forward, there is the potential for corporations to report fairly low net income in a given year such that the capital base measure would come into play. For a large corporation with considerable capital, the $1 million liability cap may be unwarranted. The IBO estimates that eliminating the cap could generate an additional $319 million annually.114
• Broaden the corporate tax base As the State did in its 2014 corporate tax reform, New York City should broaden the corporate tax base by implementing full unitary combined reporting and eliminating the separate treatment of subsidiary capital and income. Unitary reporting is necessary to prevent the shifting of business income and expenses among related entities.
112 This is lower than an earlier estimate by the Fiscal Policy Institute released in September 2014. The earlier estimate was developed using outdated sec. 581 property tax discount data from the IBO. More recent data indicate that the sec. 581 discount has been significantly reduced due to improved market valuation methods at the City’s Department of Finance. 113 Liz Malm, “Is New York City Eyeing Corporate Tax Reform?” Tax Foundation blogpost, October 2, 2014, http://taxfoundation.org/blog/new-york-city-eyeing-corporate-tax-reform. 114 IBO, Budget Options for New York City, November 2014, p. 59.
FPI January 13, 2015 76

New York City Taxes—Trends, Impact and Priorities for Reform
• Expand corporate “nexus” and raise the minimum tax for large
companies As part of the measures conforming to the State’s corporate tax reform, the City should also modify how “nexus” is determined in order to fairly tax the income of companies conducting business activity within the city, and it should significantly raise the current $5,000 fixed dollar minimum tax for large corporations.
• Freeze phase-in of Single Sales Factor (SSF) Since there is no evidence that adoption of SSF apportionment provides the promised economic benefits of spurring investment and local hiring, there is an argument for freezing the phase-in of SSF for companies paying into either the General Corporation Tax or the Unincorporated Business Tax. The City is half way through the 10-year SSF phase-in. The IBO estimates that halting the phase-in would save $61 million in FY 2015 and $265 million in FY 2019.115 This would be a departure from conformance with the State, but it is important for the City to ensure that the combined business share of local taxes does not decline, particularly given the fact that corporate profits as a share of national income has risen considerably in recent years. This is also a case where a proposed tax change should have been carefully examined since questions were raised about the extent to which SSF would result in any positive economic impact in the state or the city.
G. Re-examine business tax expenditures The City’s panoply of costly business tax breaks needs to be re-visited to determine their economic value and adjusted as appropriate. The City should undertake a thorough re-examination of all of its business tax breaks that, in the aggregate have grown at twice the rate of the City’s tax base since 2001. Many of these date from decades ago when the City’s economy was in a much less favorable position than it is today. The City’s economic development priorities have changed, with diversification away from finance and promoting investments in technology-based development and worker skills taking center stage.116 Economists Marilyn Rubin and Donald Boyd prepared an extensive assessment of New York State business tax credits at the request of the Governor Cuomo-appointed Solomon-McCall Tax Reform and Fairness Commission.117 The City would certainly benefit from a similar analysis of the various tax breaks New York City provides in the name of economic and business development.
115 IBO, Budget Options for New York City, November 2014, p. 64. 116 Under the leadership of Deputy Mayor Alicia Glen, the de Blasio administration released a workforce development strategy on November 21, 2014, Career Pathways. One City Working Together. According to the press release accompanying the report, “the administration will invest in middle-skill job training for up to 30,000 people each year, prioritize good-paying, full-time job placement at workforce agencies, and require companies doing business with the City to move New Yorkers to the front of the hiring line.” See http://www1.nyc.gov/site/careerpathways/index.page. 117 Marilyn M. Rubin and Donald J. Boyd, New York State Business Tax Credits: Analysis and Evaluation. A Report Prepared for the New York State Tax Reform and Fairness Commission, November 2013. The report is available on the Capital New York website: http://www.capitalnewyork.com/sites/default/files/131115__Incentive_Study_Final_0.pdf; and on the website of the Peter J. Solomon Company, http://www.pjsolomon.com/news/media/2013-11-13-Tax_Incentive_Study_Final.pdf.
FPI January 13, 2015 77
New York City Taxes—Trends, Impact and Priorities for Reform
• Reform ICAP
At the top of the list for immediate reform is the Industrial and Commercial Abatement Program (ICAP) that is subsidizing hotel and other commercial developments, many of which likely would proceed even in the absence of ICAP benefits. Current authorization for ICAP expires on March 1, 2015. At a minimum, the City should replicate the sort of analysis undertaken in 2007 when ICIP, the earlier incarnation of ICAP, was expiring.
• Revisit Hudson Yards property tax breaks The City also should assess the need for property tax and other subsidies in Hudson Yards. Since the district has clearly demonstrated its commercial viability, there is absolutely no need for the City to provide tax breaks. The sooner it stops discounting taxes, the sooner the City will be able to repay the bonds sold to build the #7 subway extension. As long as they are in place, the steep Hudson Yards tax breaks will create pressure for the City to provide tax breaks for the rest of Midtown.
• Eliminate the carried interest exemption for the Unincorporated Business Tax
Hedge funds, private equity funds, and real estate investment trusts are often organized as partnerships that come under the City’s Unincorporated Business Tax (UBT). Used in its strictest sense, carried interest refers to the gains from assets held for investment purposes. The term is also used to apply to a form of income received by the general partners in an investment fund that constitutes the general partners’ share of gains the fund generates. In this sense, “carried interest” is clearly a form of business income related to the services provided by the general partners. At present, the City exempts carried interest received by general partners from taxation under the UBT. This is nothing more than a tax loophole introduced and maintained in order to minimize taxation on often well-connected investment funds of one form or another. The IBO estimates that the City could see a net UBT gain (after allowing for the UBT credit against the city’s personal income tax) of approximately $200 million annually.118 Most business tax breaks disproportionately go to large, wealthy corporations. Moving away from this backward-looking practice of subsidizing massive commercial development and large corporations will help level the economic development playing field for smaller businesses and improve accountability in the eyes of the average taxpayer. Moreover, savings would free up resources to fund promising economic development interventions.
H. Real estate related taxes The City’s mortgage recording tax (MRT) applies to all types of residential real estate except co-ops. Eliminating this exception would generate an estimated $98 million annually in 2016, according to the IBO, and $50 million more if the exception were eliminated for the State
118 Ibid., p. 69. See also, Fiscal Policy Institute, Re-thinking the New York City Business Tax Treatment of Private Equity Fund and Hedge Fund “Carried Interest,” April 15, 2008.
FPI January 13, 2015 78

New York City Taxes—Trends, Impact and Priorities for Reform
MRT.119 Another proposal would be to add a new real property transfer tax (RPTT) bracket for high-value residential properties. The top City RPTT rate of 1.425 percent now applies to transactions over $500,000. Establishing a 1.925 percent bracket for transactions of $5 million or more could yield about $39 million in 2016, according to the IBO.120 The main value of such changes is to generate resources to help the City address its housing priorities.
I. Establish the capacity to analyze the distribution of taxes and tax changes
The City’s Executive branch should develop the capacity to analyze the distributional impact of local taxes across income classes in order to guide its efforts as it approaches tax reform or entertains any tax proposals. It would also be advisable to for the City’s Independent Budget Office and/or the City Council to have its own capacity to analyze the distributional impact of local taxes by income class and of proposed tax changes. New York City has been well-served in the budget area by having outside monitors and the IBO regularly review the City budget. An analytical capacity in the tax area would help target tax changes to enhance progressivity and avoid unintended consequences. This is particularly needed given the pronounced income polarization of recent years.121 The Office of Tax Policy Analysis of the New York State Department of Taxation and Finance has done considerable work in analyzing the distributional impact of state taxes and published an overview of its work as an appendix to the report of the Peter Solomon-Carl McCall Tax Reform and Fairness Commission.122
119 IBO, Budget Options for New York City, November 2014, p. 53. 120 Ibid., p. 49. 121 For an extensive discussion of the value of such a capacity, see Michael Mazerov, Developing the Capacity to Analyze the Distributional Impact of State and Local Taxes, Center on Budget and Policy Priorities, January 15, 2002. 122 Office of Tax Policy Analysis, New York State Department of Taxation and Finance, “New York State Tax Burden Study,” Appendix A, New York State Tax Reform and Fairness Commission, Final Report, November 2013.
FPI January 13, 2015 79
New York City Taxes—Trends, Impact and Priorities for Reform
12. Conclusion
New York City’s tax system is diverse and has served the city well in the context of a moderately growing economy. However, given the vastly improved attractiveness of the city to real estate development and to a range of dynamic economic sectors, there is a pressing need to re-think several tax breaks initially intended to foster business and housing development. Moreover, considering the persistence of serious property tax inequities and a regressive overall local tax burden in the context of a pronounced polarization of income since 1980s, it is important for the City to reform its property and personal income tax systems to increase fairness. The State legislature and governor should give New York City greater authority to make adjustments to existing taxes within a defined range, and to periodically extend or modify existing tax policies and programs. The State constitution allows the legislature to enact laws “which delegate the taxing power [provided such laws] shall specify the types of taxes which may be imposed thereunder and provide for their review.”123 The State already allows cities and counties the option of whether to conform to certain sales tax exemptions and provides New York City unique authorization to impose its sales tax on a broader range of services than the State or other local governments.124
123 New York State Constitution, Article XVI, section 1. Also, see Erin Adele Scharff, “Taxes as Regulatory Tools: An Argument for Expanding New York City’s Taxing Authority,” New York University Law Review, Vol. 86, 1556-1589. 124 New York State Department of Taxation and Finance, Office of Tax Policy Analysis, An Evaluation of New York State’s Sales and Compensating Use Tax, Prepared for the New York State Tax Reform and Fairness Commission, June 2013, C-5.
FPI January 13, 2015 80

New York City Taxes—Trends, Impact and Priorities for Reform
APPENDIX Appendix Figure 1: The taxpayer cost of NYS business tax credits has tripled since 2005, and now exceeds $1.8 billion.
$0
$200
$400
$600
$800
$1,000
$1,200
$1,400
$1,600
$1,800
$2,000
1994
1995
1996
1997
1998
1999
2000
2001
2002
2003
2004
2005
2006
2007
2008
2009
2010
2011
2012
2013
2014
Note: Actual data 1994-2010, New York State Department of Tax and Finance; 2011 to 2014 estimated jointly by the NYS Department of Tax and Finance and the New York State Division of the Budget, subject to revision.
Source: Marilyn M. Rubin and Donald J. Boyd, New York State Business Tax Credits: Analysis and Evaluation, A Report Prepared for the New York State Tax Reform and Fairness Commission, November 2013. Updated by Fiscal Policy Instiitute based on 2014-2015 NYS Tax Expenditure Report.
Mill
ions
FPI January 13, 2015 81
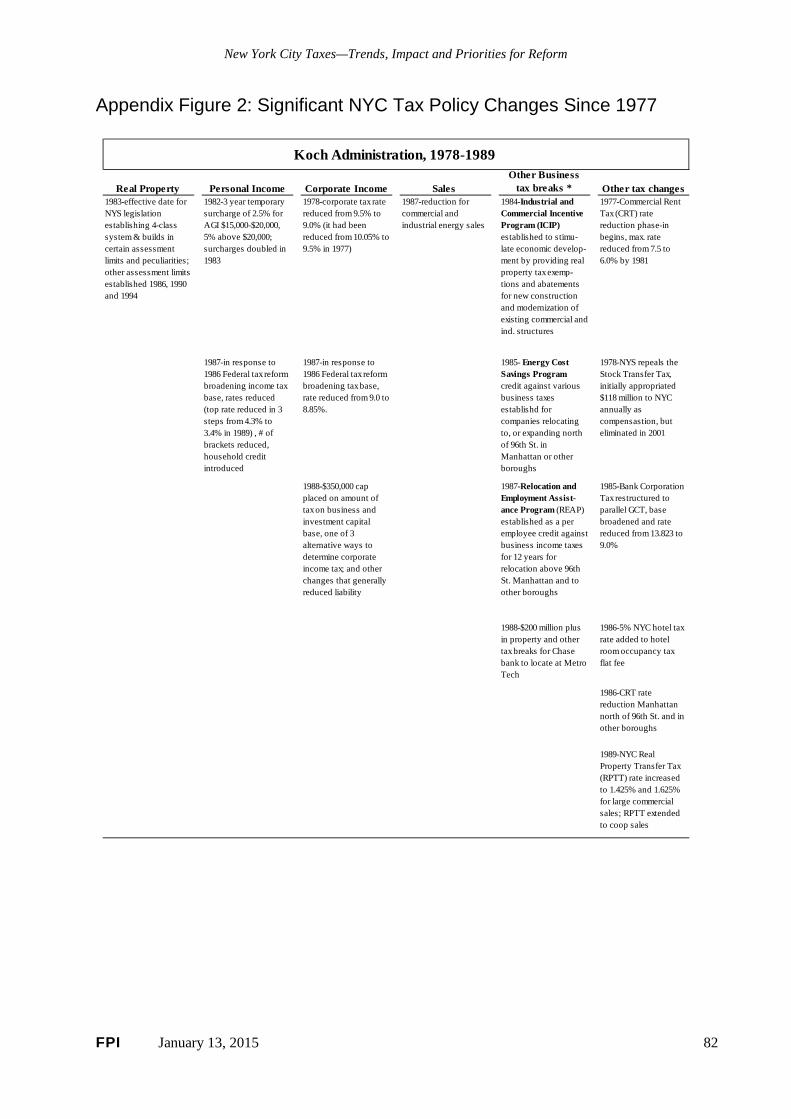
New York City Taxes—Trends, Impact and Priorities for Reform
Appendix Figure 2: Significant NYC Tax Policy Changes Since 1977
Real Property Personal Income Corporate Income Sales Other Business
tax breaks * Other tax changes1983-effective date for NYS legislation establishing 4-class system & builds in certain assessment limits and peculiarities; other assessment limits established 1986, 1990 and 1994
1982-3 year temporary surcharge of 2.5% for AGI $15,000-$20,000, 5% above $20,000; surcharges doubled in 1983
1978-corporate tax rate reduced from 9.5% to 9.0% (it had been reduced from 10.05% to 9.5% in 1977)
1987-reduction for commercial and industrial energy sales
1984-Industrial and Commercial Incentive Program (ICIP) established to stimu-late economic develop- ment by providing real property tax exemp-tions and abatements for new construction and modernization of existing commercial and ind. structures
1977-Commercial Rent Tax (CRT) rate reduction phase-in begins, max. rate reduced from 7.5 to 6.0% by 1981
1987-in response to 1986 Federal tax reform broadening income tax base, rates reduced (top rate reduced in 3 steps from 4.3% to 3.4% in 1989) , # of brackets reduced, household credit introduced
1987-in response to 1986 Federal tax reform broadening tax base, rate reduced from 9.0 to 8.85%.
1985- Energy Cost Savings Program credit against various business taxes establishd for companies relocating to, or expanding north of 96th St. in Manhattan or other boroughs
1978-NYS repeals the Stock Transfer Tax, initially appropriated $118 million to NYC annually as compensastion, but eliminated in 2001
1988-$350,000 cap placed on amount of tax on business and investment capital base, one of 3 alternative ways to determine corporate income tax; and other changes that generally reduced liability
1987-Relocation and Employment Assist- ance Program (REAP) established as a per employee credit against business income taxes for 12 years for relocation above 96th St. Manhattan and to other boroughs
1985-Bank Corporation Tax restructured to parallel GCT, base broadened and rate reduced from 13.823 to 9.0%
1988-$200 million plus in property and other tax breaks for Chase bank to locate at Metro Tech
1986-5% NYC hotel tax rate added to hotel room occupancy tax flat fee
1986-CRT rate reduction Manhattan north of 96th St. and in other boroughs
1989-NYC Real Property Transfer Tax (RPTT) rate increased to 1.425% and 1.625% for large commercial sales; RPTT extended to coop sales
Koch Administration, 1978-1989
FPI January 13, 2015 82
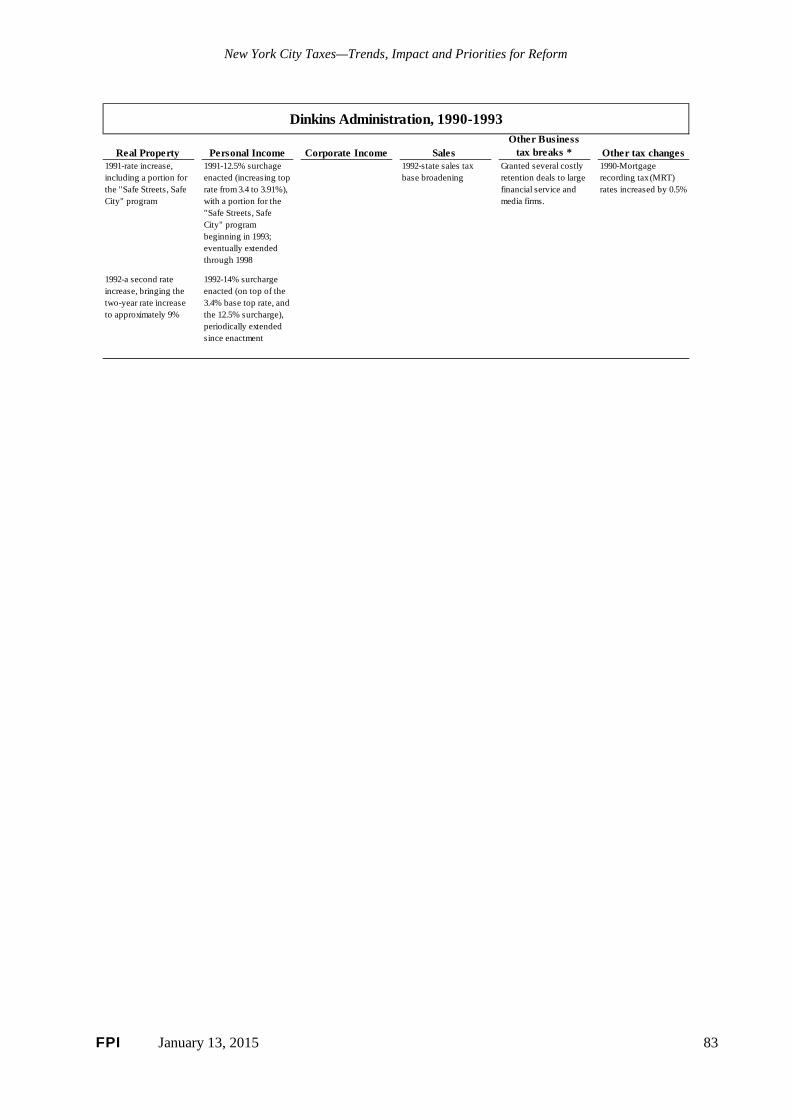
New York City Taxes—Trends, Impact and Priorities for Reform
Real Property Personal Income Corporate Income Sales Other Business
tax breaks * Other tax changes1991-rate increase, including a portion for the "Safe Streets, Safe City" program
1991-12.5% surchage enacted (increasing top rate from 3.4 to 3.91%), with a portion for the "Safe Streets, Safe City" program beginning in 1993; eventually extended through 1998
1992-state sales tax base broadening
Granted several costly retention deals to large financial service and media firms.
1990-Mortgage recording tax (MRT) rates increased by 0.5%
1992-a second rate increase, bringing the two-year rate increase to approximately 9%
1992-14% surcharge enacted (on top of the 3.4% base top rate, and the 12.5% surcharge), periodically extended since enactment
Dinkins Administration, 1990-1993
FPI January 13, 2015 83

New York City Taxes—Trends, Impact and Priorities for Reform
Real Property Personal Income Corporate Income Sales Other Business
tax breaks * Other tax changes1997-coop/condo tax abatement enacted; benefits increased the following year, and further enhanced the year after that
1998-City enacts proposal by City Council Speaker Peter Vallone to end the 12.5% surcharge
1995-NYS allows formation of limited liability partnerships (LLPs) or companies (LLCs), changing tax treatment from corporations to partnerships, taxed at lower rate under NYC Unincorporated Business Tax (UBT)
2000-effective 3-1-00, exemption for items of clothing and footwear costing under $110 (exemption suspended 6-1-03; reinstatement effective 9-1-05)
Continued granting several costly retention deals to financial firms, including one for the New York Stock Exchange
1994-50% reduction in RPTT for certain transfers to newly organized Real Estate Investment Trusts (REITs)
1999-State-funded STAR PIT rate cut reduced the top rate of 3.88% (including the 14% surcharge) to 3.83% in 1999, 3.78% in 2000, and 3.59% in 2001 (the 3.59% rate for 2001 also reflected a temporary lowering of the 14% surcharge for that year)
1997-corporate tax reductions, including double-weighting of receipts factor for manufacturing firms, repeal of "place of business" require- ment, and phasing-out of compensation paid to corporate officers from income-plus-compensation tax computation
1995-Commercial Revitalization Program established, providing real property tax abatements and CRT and energy tax reductions to encourage conversion of pre-1975 lower Manhattan buildings to residential uses
1995-Commercial Rent Tax (CRT) eliminated for Manhattan north of 96th St. and in other four boroughs; effective CRT rate reductions phased-in and base rent exemption increased over 1996-2001 period
1997- UBT credit on resident PIT returns
1996-REAP per employee credit increased from $500 to $1000, and in 2000, increased to $3000
1994-several partial exemptions for certain UBT payers; many of these were further enhanced in 1996; increases in UBT credit in 1996 and 1997; UBT changes in 1997 paralleling some of those for corporate tax
1996-UBT provisions exempting income from self-trading activiies broadened to exclude carried interest from UBT taxation; and UBT credit increased, acclerated in 1997
1999-City non-resident earnings tax (the "commuter tax") repealed by state legislature and governor
Giuliani Administration, 1994-2001
FPI January 13, 2015 84

New York City Taxes—Trends, Impact and Priorities for Reform
Real Property Personal Income Corporate Income Sales Other Business
tax breaks * Other tax changes2003-tax rate increased 18.49%
2003-for tax years 2003-05, 2 new high income brackets and rates establised along with a tax table benefit recapture provision (under these temporary changes the top tax rate was 4.45%)
2006-film production credit established on a temporary basis, initially with global cap of $12.5 million annually, later raised to $30 million; in effect 2006-2013 (in 2010 the state raised its aggregate annual cap to $420 million, most of this credit is used in NYC)
2003-sales tax rate temporarily increased from 4.0 to 4.125%, effective 6-4-03 to 5-31-05
2006-While fewer large retention deals were negotiated, massive property tax breaks for up to 99 years were provided in the Hudson Yards district that have the potential to cost the City hundreds of millions of dollars.
2003-NYC cigarette tax increased from 8 cents to $1.50 per pack (expected to reduce sales tax collections by about 1/4 of the additional amount expected from the cigarette tax increase)
2005-$400 home- owner tax rebate enacted for owners of Class 1 properties and Class 2 coops/condos, where properties are owners' primary residence, initially enacted for 3 years, extended for 3 more, repealed for FY 2010
2004-refundable EITC established at 5% of the federal EITC benefit
2007-50% phase-out of income-plus compensation alternative tax base
2003-exemption for clothing and footwear under $110 temporarily suspended (exemption reinstated 9-1-05)
2009-ICIP replaced by Industrial and Commercial Abatement Program (ICAP) with slight narrowing of benefits and exclusion of utility properties (in 2011, new power plants were made eligible)
2007-partnership deduction under UBT doubled to $10,000 per active member
2006-Disability Rent Increase Exemption (DRIE) established, and income limit raised under Senior Citizen Rent Increase Exemp-tion (SCRIE)
2007-child care credit established for low-income households
2009-firms owned by bank holding com-panies that had been "grandfathered" and continued filing under the General Corpora-tion Tax will now have to file under the Bank Corporation Tax
2007-exemption for clothing and footwear costing $110 and above, but repealed in 2009 (exemption in effect 9-1-07 to 7-31-09)
2007-UBT credit against PIT increased (for filers with AGI > $142,000, credit increased from 15 to 23%)
2007-income limit raised under Senior Citizen Homeowner Exemption (SCHE) Program
2009-for filers with incomes $1 million-plus, itemized deduct- ions limited to 50% for charitable contribu- tions; in 2010, chari -table contributions limited to 25% for $10 million-plus incomes
2009-allocation for multi-jurisdiction firms switched from three-factor allocation to single sales factor, phased in over 10 years (the state had earlier switched to single sales factor)
2009-sales tax rate increased from 4 to 4.5% (first permanent rate increase since 1974)
2009-Hotel tax rate increased from 5 to 5.875%; and hotel room marketers required to collect NYC hotel tax
2008-tax rate reduced by 7%, later rescinded in 2009 (effective dates for the 7% reduction 7-1-07 to 1-1-09)
2010-STAR rate cut on NYC PIT eliminated for taxable income > $500,000 (new top NYC PIT rate is 3.876%)
2009-tax cap on business and investment capital alternative base raised from $350,000 to $1 million
2009-base broadening, including on internet sales; bus, limousine and black car services; and gas & electric distribution when bought from a comany other than the gas or electric vendor
2013-Coop/condo abatement increased for many owners, non-primary resident owners phased out
2013-Albany indexes both NYS and NYC personal income standard deduction for inflation
Sources: NYC Office of Management and Budget (OMB), Tax Revenue Documentation, Financial Plan FYs 2013-2017 , July 2014; NYC OMB Forecast Documentation , April 1995, April 1998, and November 2014.
Bloomberg Administration, 2002-2013
* Some of the tax rate reductions or other changes for various taxes listed elsewhere in this table also were enacted for the purpose of aiding business development.
FPI January 13, 2015 85


![Volunteer Income Tax Assistance “VITA” Earned Income Tax ... · Volunteer Income Tax Assistance “VITA” Earned Income Tax Credit “EITC” Revised 1/28/19 [DOCUMENT TITLE]](https://img.pdfslide.us/doc/110x75/5fa5a5c85aa0bb13122ce462/volunteer-income-tax-assistance-aoevitaa-earned-income-tax-volunteer-income.jpg)