Embed Size (px)
Citation preview

Energy Fuels Inc. NYSE American: UUUU TSX: EFR November 2017
A First-Tier Leverage Play Ready for the Next Uranium Super Cycle

IMPORTANT INFORMATION
2
• Please carefully review important information about this presentation – Forward looking statements, page 24 – Notice regarding technical disclosure, page 25 – Cautionary statements for US investors concerning mineral resources, page 26
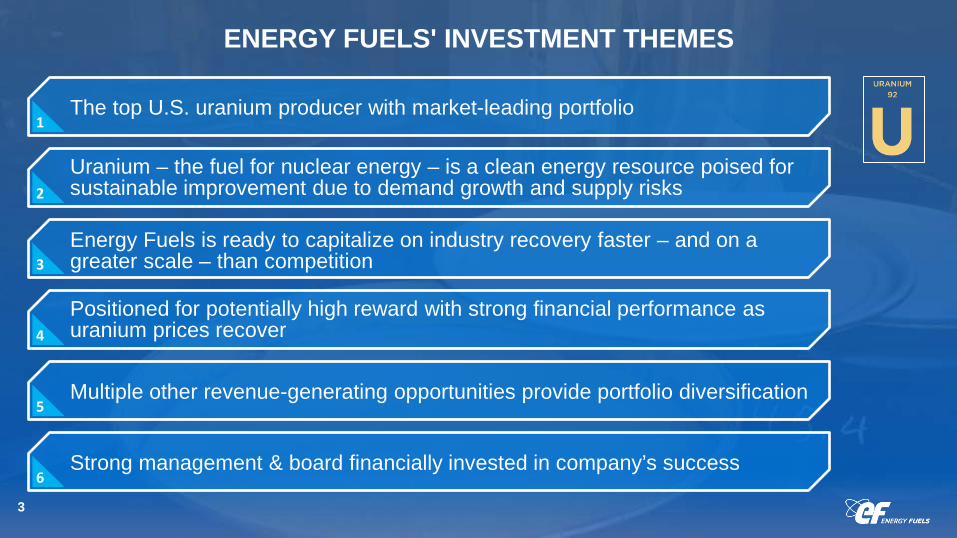
ENERGY FUELS' INVESTMENT THEMES
3
1 The top U.S. uranium producer with market-leading portfolio
2 Uranium – the fuel for nuclear energy – is a clean energy resource poised for sustainable improvement due to demand growth and supply risks
3 Energy Fuels is ready to capitalize on industry recovery faster – and on a greater scale – than competition
4 Positioned for potentially high reward with strong financial performance as uranium prices recover
5 Multiple other revenue-generating opportunities provide portfolio diversification
6 Strong management & board financially invested in company’s success

MARKET-LEADING PORTFOLIO OF U.S. URANIUM ASSETS
4
Energy Fuels’ Production Rank in U.S. • Track record of sustained market leadership
• Ability to significantly increase production
• Only U.S. uranium supplier with both conventional & in-situ recovery (ISR) – Low-cost facilities in Utah, Arizona, Wyoming & Texas
• Owner of the only fully-permitted & operational conventional uranium mill in the U.S.
– White Mesa Mill Processes: Ore from Energy Fuels’ mines; Ore from mines owned by others; & Alternate feed materials
– White Mesa Mill offers broad revenue-generating opportunities
2017 2016
#1 2015
#2 #3
(forecasted)

STRATEGIC POSITIONING IN THE U.S. WORLD’S LARGEST NUCLEAR MARKET
49M Lbs. 2017 U.S. uranium requirements(1)
1.6M Lbs. 2017 U.S. uranium mine production(2)
5
Conventional mill ISR plant and mine Major mine/project Existing nuclear power plant Nuclear power plant under construction
Sheep Mountain
Nichols Ranch ISR
Canyon Roca Honda
Alta Mesa ISR
Henry Mountains
Daneros
White Mesa Mill
Whirlwind La Sal
1 World Nuclear Association 2 Company estimate based on announced guidance
PRODUCTION FACILITY: Alta Mesa ISR Plant Nichols Ranch ISR Plant
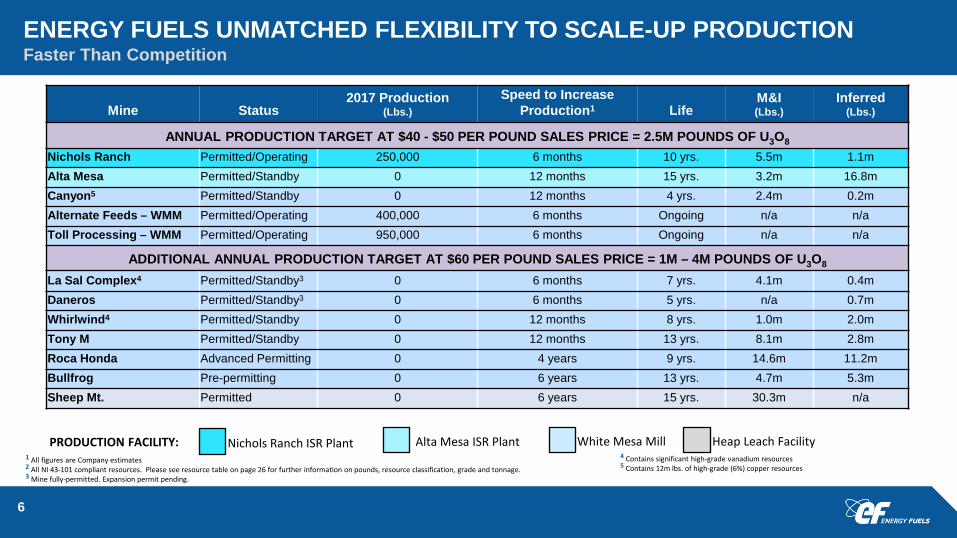
ENERGY FUELS UNMATCHED FLEXIBILITY TO SCALE-UP PRODUCTION Faster Than Competition
6
10 yr.
20 yr. Mine Status
2017 Production (Lbs.)
Speed to Increase Production1 Life
M&I (Lbs.)
Inferred (Lbs.)
ANNUAL PRODUCTION TARGET AT $40 - $50 PER POUND SALES PRICE = 2.5M POUNDS OF U3O8 Nichols Ranch Permitted/Operating 250,000 6 months 10 yrs. 5.5m 1.1m Alta Mesa Permitted/Standby 0 12 months 15 yrs. 3.2m 16.8m Canyon5 Permitted/Standby 0 12 months 4 yrs. 2.4m 0.2m Alternate Feeds – WMM Permitted/Operating 400,000 6 months Ongoing n/a n/a Toll Processing – WMM Permitted/Operating 950,000 6 months Ongoing n/a n/a
ADDITIONAL ANNUAL PRODUCTION TARGET AT $60 PER POUND SALES PRICE = 1M – 4M POUNDS OF U3O8 La Sal Complex4 Permitted/Standby3 0 6 months 7 yrs. 4.1m 0.4m Daneros Permitted/Standby3 0 6 months 5 yrs. n/a 0.7m Whirlwind4 Permitted/Standby 0 12 months 8 yrs. 1.0m 2.0m Tony M Permitted/Standby 0 12 months 13 yrs. 8.1m 2.8m Roca Honda Advanced Permitting 0 4 years 9 yrs. 14.6m 11.2m Bullfrog Pre-permitting 0 6 years 13 yrs. 4.7m 5.3m Sheep Mt. Permitted 0 6 years 15 yrs. 30.3m n/a
1 All figures are Company estimates 2 All NI 43-101 compliant resources. Please see resource table on page 26 for further information on pounds, resource classification, grade and tonnage. 3 Mine fully-permitted. Expansion permit pending.
4 Contains significant high-grade vanadium resources 5 Contains 12m lbs. of high-grade (6%) copper resources
White Mesa Mill Heap Leach Facility
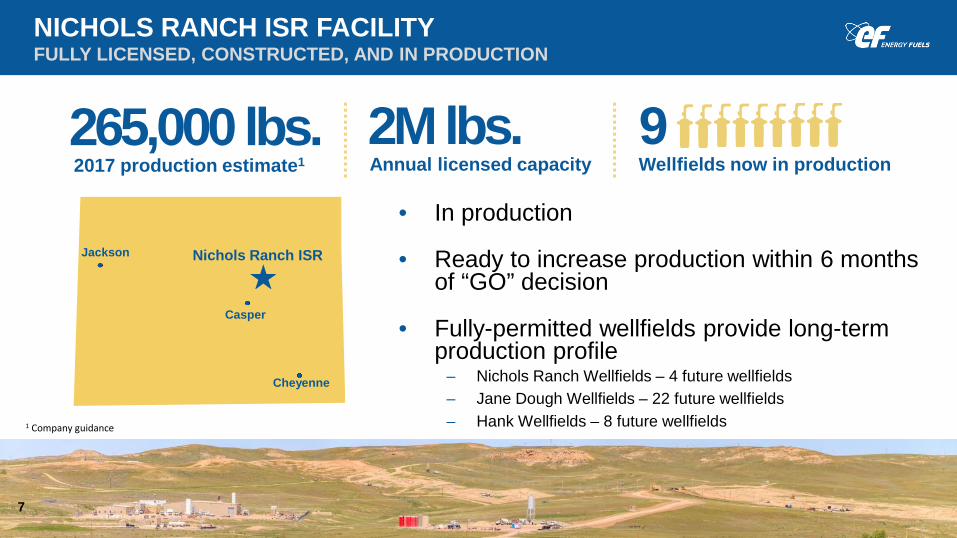
NICHOLS RANCH ISR FACILITY FULLY LICENSED, CONSTRUCTED, AND IN PRODUCTION
2017 production estimate1
• In production
• Ready to increase production within 6 months of “GO” decision
• Fully-permitted wellfields provide long-term production profile
– Nichols Ranch Wellfields – 4 future wellfields – Jane Dough Wellfields – 22 future wellfields – Hank Wellfields – 8 future wellfields
7
265,000 lbs. Annual licensed capacity 2M lbs.
Wellfields now in production 9
Jackson
Casper
Nichols Ranch ISR
Cheyenne
1 Company guidance
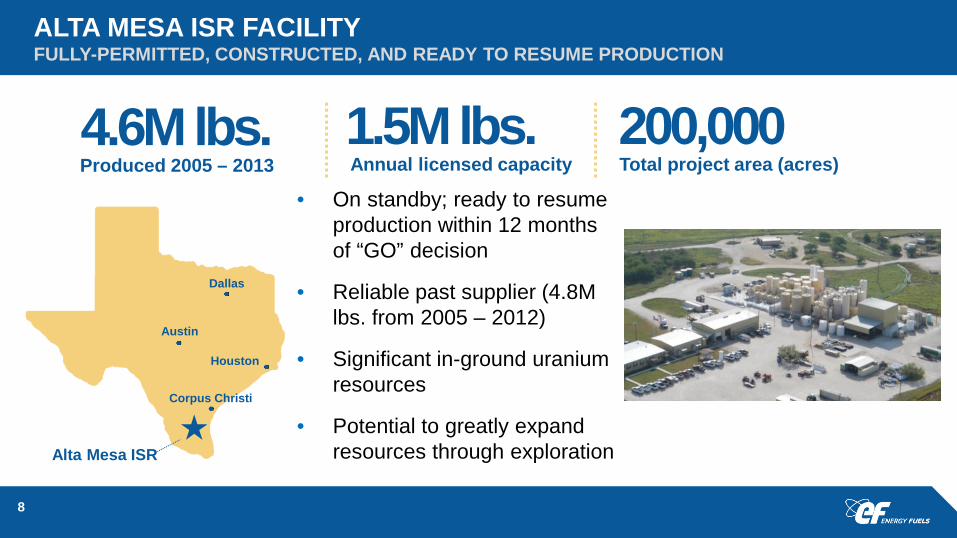
ALTA MESA ISR FACILITY FULLY-PERMITTED, CONSTRUCTED, AND READY TO RESUME PRODUCTION
Produced 2005 – 2013
• On standby; ready to resume production within 12 months of “GO” decision
• Reliable past supplier (4.8M lbs. from 2005 – 2012)
• Significant in-ground uranium resources
• Potential to greatly expand resources through exploration
8
4.6M lbs. Annual licensed capacity 1.5M lbs.
Total project area (acres) 200,000
Corpus Christi
Alta Mesa ISR
Austin
Houston
Dallas
Salt Lake City
White Mesa Mill
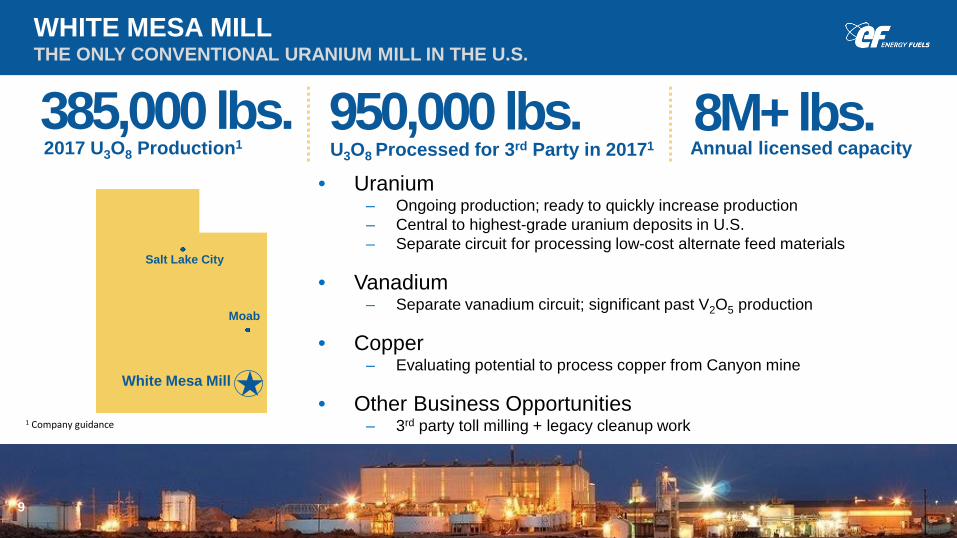
WHITE MESA MILL THE ONLY CONVENTIONAL URANIUM MILL IN THE U.S.
2017 U3O8 Production1
• Uranium – Ongoing production; ready to quickly increase production – Central to highest-grade uranium deposits in U.S. – Separate circuit for processing low-cost alternate feed materials
• Vanadium – Separate vanadium circuit; significant past V2O5 production
• Copper – Evaluating potential to process copper from Canyon mine
• Other Business Opportunities – 3rd party toll milling + legacy cleanup work
9
385,000 lbs. Annual licensed capacity 8M+ lbs.
1 Company guidance
Moab
950,000 lbs. U3O8 Processed for 3rd Party in 20171
• Copper: 11.9M lbs. of Cu – 5.9% grade(1)
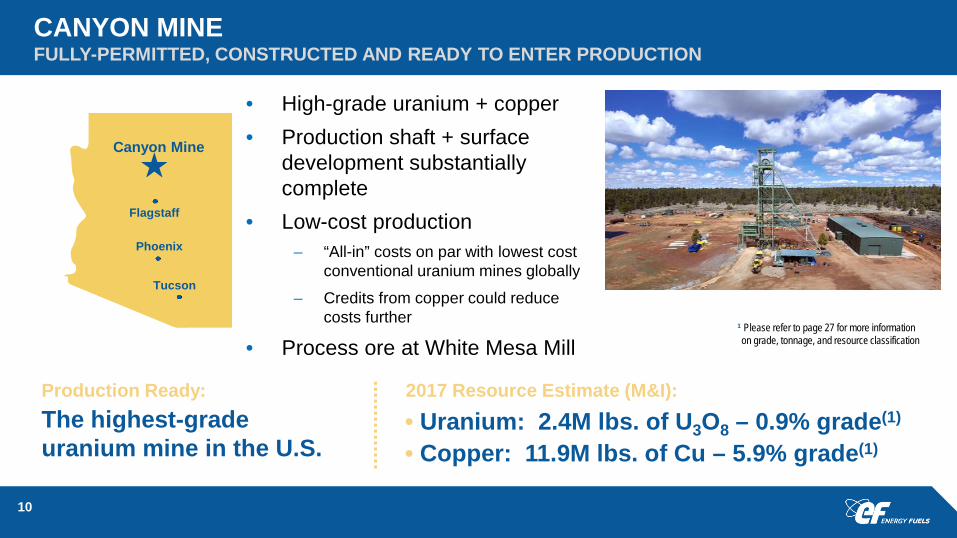
CANYON MINE FULLY-PERMITTED, CONSTRUCTED AND READY TO ENTER PRODUCTION
• High-grade uranium + copper • Production shaft + surface
development substantially complete
• Low-cost production – “All-in” costs on par with lowest cost
conventional uranium mines globally
– Credits from copper could reduce costs further
• Process ore at White Mesa Mill
10
2017 Resource Estimate (M&I):
• Uranium: 2.4M lbs. of U3O8 – 0.9% grade(1)
1 Please refer to page 27 for more information on grade, tonnage, and resource classification
Phoenix
Tucson
Canyon Mine
The highest-grade uranium mine in the U.S.
Production Ready:
Flagstaff
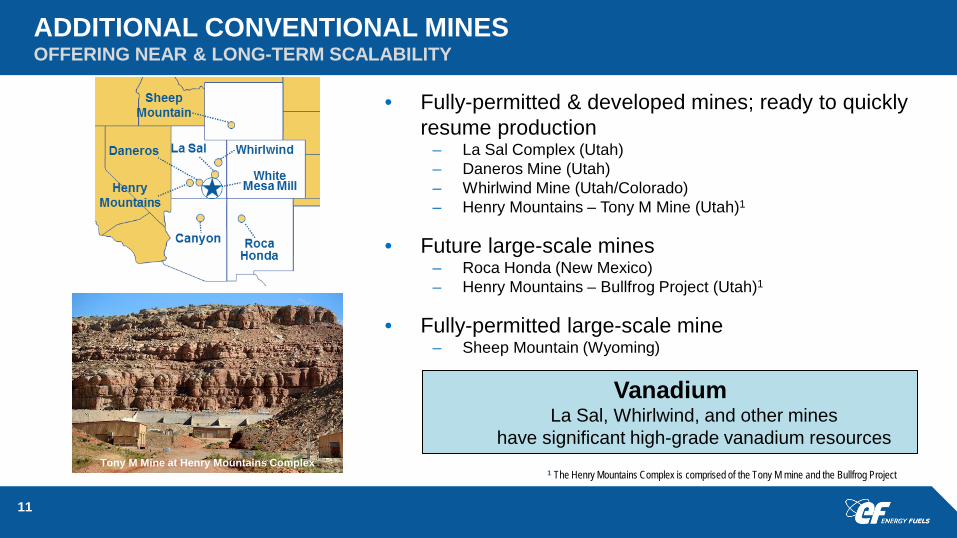
ADDITIONAL CONVENTIONAL MINES OFFERING NEAR & LONG-TERM SCALABILITY
• Fully-permitted & developed mines; ready to quickly resume production
– La Sal Complex (Utah) – Daneros Mine (Utah) – Whirlwind Mine (Utah/Colorado) – Henry Mountains – Tony M Mine (Utah)1
• Future large-scale mines – Roca Honda (New Mexico) – Henry Mountains – Bullfrog Project (Utah)1
• Fully-permitted large-scale mine – Sheep Mountain (Wyoming)
11
1 The Henry Mountains Complex is comprised of the Tony M mine and the Bullfrog Project Tony M Mine at Henry Mountains Complex
Vanadium La Sal, Whirlwind, and other mines
have significant high-grade vanadium resources
STRONG CUSTOMER BASE MAJOR NUCLEAR UTILITIES
12
• Excellent relationships with U.S. utilities
• Favorable industry reputation, including perfect track record of on-time deliveries
• Low risk of non-payment due to customer profile and strength
• Near-term focus on U.S. with expansion potential in global growth markets
• Aggressive global marketing program providing baseline for market recovery
620,000 LBS
OF SALES IN 2016
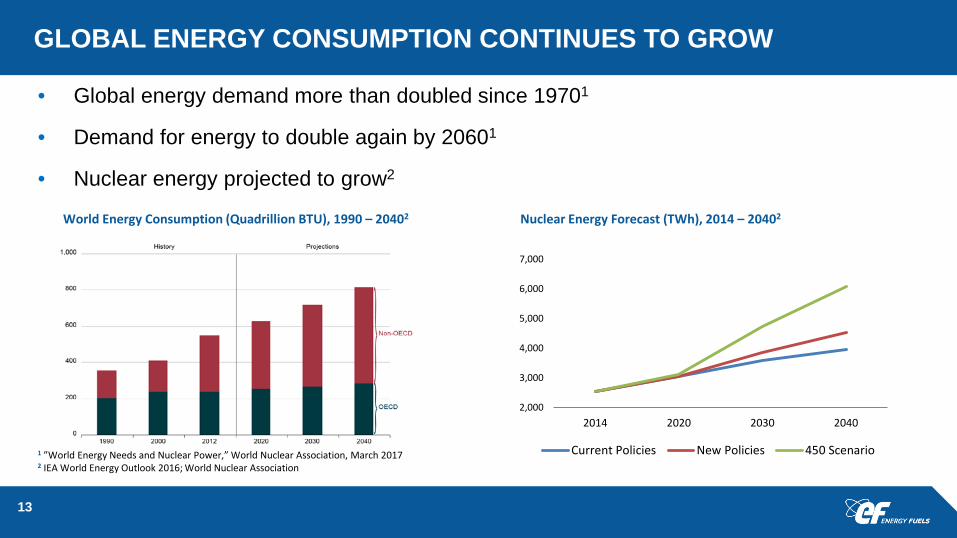
GLOBAL ENERGY CONSUMPTION CONTINUES TO GROW
• Global energy demand more than doubled since 19701
• Demand for energy to double again by 20601
• Nuclear energy projected to grow2
13
1 ”World Energy Needs and Nuclear Power,” World Nuclear Association, March 2017 2 IEA World Energy Outlook 2016; World Nuclear Association
Nuclear Energy Forecast (TWh), 2014 – 20402 World Energy Consumption (Quadrillion BTU), 1990 – 20402
2,000
3,000
4,000
5,000
6,000
7,000
2014 2020 2030 2040
Current Policies New Policies 450 Scenario
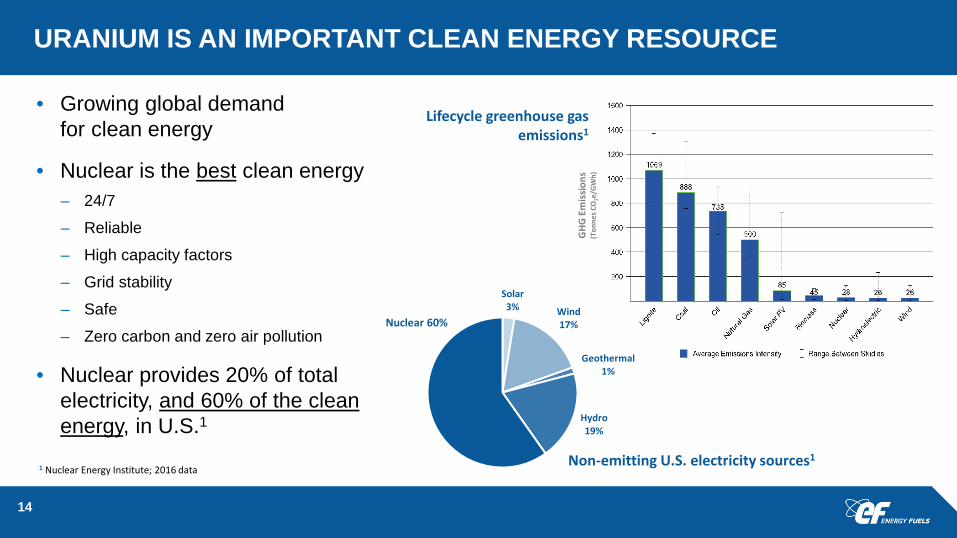
URANIUM IS AN IMPORTANT CLEAN ENERGY RESOURCE
14
• Growing global demand for clean energy
• Nuclear is the best clean energy – 24/7
– Reliable
– High capacity factors
– Grid stability
– Safe
– Zero carbon and zero air pollution
• Nuclear provides 20% of total electricity, and 60% of the clean energy, in U.S.1
Lifecycle greenhouse gas emissions1
Solar 3% Wind
17%
Geothermal 1%
Hydro 19%
Nuclear 60%
Non-emitting U.S. electricity sources1 1 Nuclear Energy Institute; 2016 data
GHG
Em
issi
ons
(Ton
nes C
O2e
/GW
h)
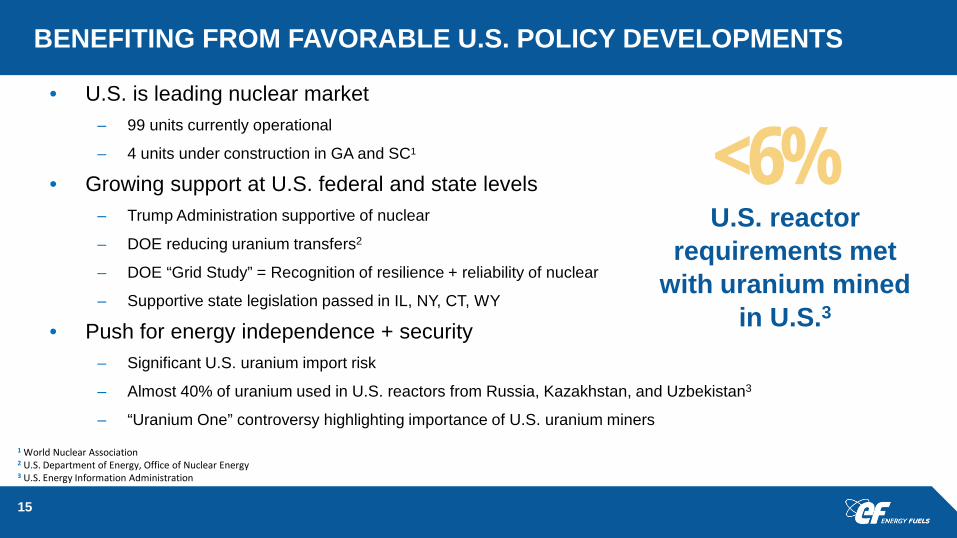
BENEFITING FROM FAVORABLE U.S. POLICY DEVELOPMENTS
• U.S. is leading nuclear market – 99 units currently operational
– 4 units under construction in GA and SC1
• Growing support at U.S. federal and state levels – Trump Administration supportive of nuclear
– DOE reducing uranium transfers2
– DOE “Grid Study” = Recognition of resilience + reliability of nuclear
– Supportive state legislation passed in IL, NY, CT, WY
• Push for energy independence + security – Significant U.S. uranium import risk
– Almost 40% of uranium used in U.S. reactors from Russia, Kazakhstan, and Uzbekistan3
– “Uranium One” controversy highlighting importance of U.S. uranium miners
U.S. reactor requirements met
with uranium mined in U.S.3
<6%
1 World Nuclear Association 2 U.S. Department of Energy, Office of Nuclear Energy 3 U.S. Energy Information Administration
15
URANIUM SUPPLY RISKS PROVIDING OPPORTUNITY FOR PROVEN PRODUCERS LIKE ENERGY FUELS
• Low prices beginning to cause major supply reductions; setting the stage for next uranium price recovery ─ Kazakhstan reducing production by 10% in 2017 & 2018
─ Cameco suspending production from McArthur River – the World’s biggest uranium mine
─ Areva reducing production in Niger
─ Langer Heinrich (Namibia) & Ranger (Australia) have stopped mining
─ Rossing (Namibia) – a key uranium mine for the last 40 years – planning shutdown in mid-2020’s
─ Husab – a new mine in Namibia that is majority-owned by a major Chinese nuclear utility – not meeting expectations
─ U.S. production dropping to historic lows
─ No new “Kazakhstans” on the horizon
─ Many new mines fail to meet expectations – or fail altogether
─ New, large-scale uranium projects typically take 10+ years to enter production
16

OTHER SIGNS THE INDUSTRY IS APPROACHING AN INFLECTION POINT
• Strong growth in China with 20 new reactors under construction1
– Additional reactors under construction in Russia (7), India (6), U.S. (4), and UAE (4)
• Steadily increasing demand for uranium – Over 40% increase in total global nuclear energy generation between 2014 and 20302 – Significant uncovered utility demand for uranium
• 2017 – 2026 = 750+ million lbs. of U3O83
• Japan reactor restarts – 5 operating + 3 more to potentially restart in the next several months – 18 additional reactors approved or under review1
– Pro-nuclear Prime Minister Shinzo Abe recently re-elected
17
1 World Nuclear Association 2 IEA World Energy Outlook, 2016 3 TradeTech

WHAT INDUSTRY THOUGHT LEADERS ARE SAYING
“If Americans are dead serious about climate change, they will need to find and utilize all major forms of non-carbon energy. Instead of talking about renewables versus nuclear, they need to talk about renewables plus nuclear.”
— Scott L. Montgomery, University of Washington
“Energy Fuels is well positioned to take advantage of the confluence in metal demand and metal price appreciation, with its strategic holdings.” — Colin Healey, Haywood
Speaking about nuclear: “If you really care about the environment we live in – and I think the vast majority of the people in the country and the world do – then you need to be a supporter of this amazingly clean, resilient, safe, reliable source of energy.“ — Rick Perry, U.S. Energy Secretary
“Energy Fuels is one of our favorite names. It’s the best leverage to the uranium price... they have the capability to produce anywhere between 3 to 7 million pounds…Energy Fuels has many assets on standby that can turn on. So when the prices go up they will be in a good position to capitalize.” — Rob Chang, Cantor Fitzgerald
18
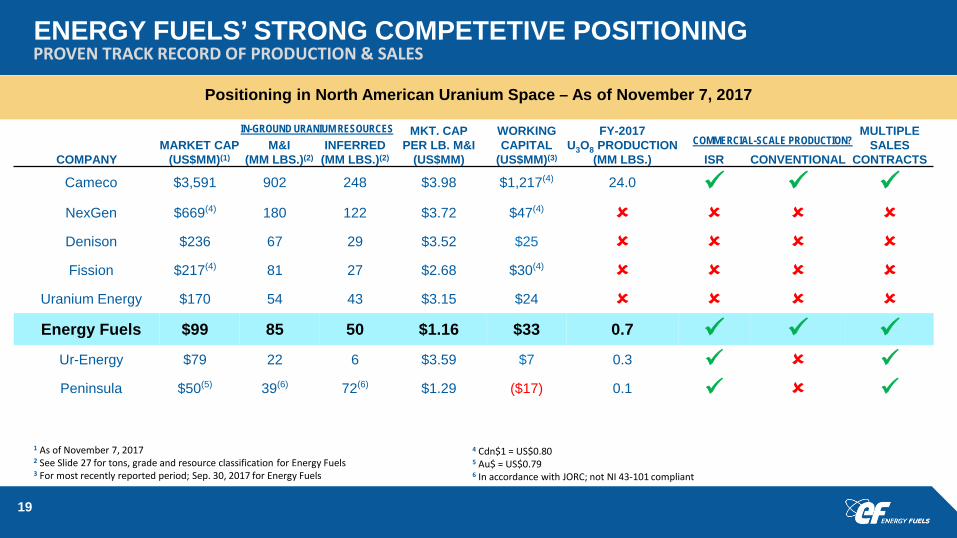
ENERGY FUELS’ STRONG COMPETETIVE POSITIONING PROVEN TRACK RECORD OF PRODUCTION & SALES
19
MARKET CAP (US$MM)(1)
M&I (MM LBS.)(2)
INFERRED (MM LBS.)(2) COMPANY
MKT. CAP PER LB. M&I
(US$MM)
WORKING CAPITAL
(US$MM)(3)
FY-2017 U3O8 PRODUCTION
(MM LBS.) ISR CONVENTIONAL
MULTIPLE SALES
CONTRACTS
Cameco $3,591 902 248 $3.98 $1,217(4) 24.0 NexGen $669(4) 180 122 $3.72 $47(4) Denison $236 67 29 $3.52 $25 Fission $217(4) 81 27 $2.68 $30(4)
Uranium Energy $170 54 43 $3.15 $24 Energy Fuels $99 85 50 $1.16 $33 0.7
Ur-Energy $79 22 6 $3.59 $7 0.3 Peninsula $50(5) 39(6) 72(6) $1.29 ($17) 0.1
IN-GROUND URANIUM RESOURCES COMMERCIAL-SCALE PRODUCTION?
Positioning in North American Uranium Space – As of November 7, 2017
1 As of November 7, 2017 2 See Slide 27 for tons, grade and resource classification for Energy Fuels 3 For most recently reported period; Sep. 30, 2017 for Energy Fuels
4 Cdn$1 = US$0.80 5 Au$ = US$0.79 6 In accordance with JORC; not NI 43-101 compliant
DE-RISKED AND DIVERSIFIED PORTFOLIO
• Multiple proven + permitted production sources secure Energy Fuels’ uranium supply
• Vanadium + copper provide non-uranium upside – Vanadium batteries now being commercialized for renewable energy applications
– White Mesa Mill produced 1.5 million lbs. of vanadium as recently as 2013
– Making progress toward the potential recovery and processing of copper resources from Canyon Mine
– Vanadium and copper prices have risen recently
• Potential to earn revenue from clean-up of historic uranium mines – U.S. government has announced settlements of $1.5 billion to fund clean-up activities on Navajo Nation1
– Other companies have legacy cleanup obligations
– White Mesa Mill within close trucking distance, fully-permitted, and the only facility in the U.S. that can recycle material from the cleanups into usable uranium product
20
1 U.S. Environmental Protection Agency; Navajo Nation: Cleaning Up Abandoned Uranium Mines
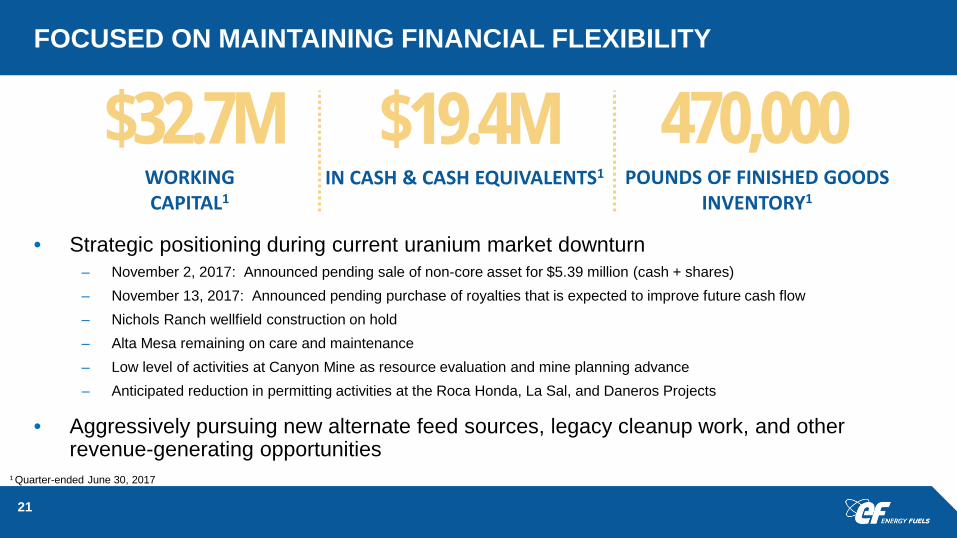
FOCUSED ON MAINTAINING FINANCIAL FLEXIBILITY
• Strategic positioning during current uranium market downturn – November 2, 2017: Announced pending sale of non-core asset for $5.39 million (cash + shares) – November 13, 2017: Announced pending purchase of royalties that is expected to improve future cash flow – Nichols Ranch wellfield construction on hold – Alta Mesa remaining on care and maintenance – Low level of activities at Canyon Mine as resource evaluation and mine planning advance – Anticipated reduction in permitting activities at the Roca Honda, La Sal, and Daneros Projects
• Aggressively pursuing new alternate feed sources, legacy cleanup work, and other revenue-generating opportunities
21
470,000 POUNDS OF FINISHED GOODS
INVENTORY1
$19.4M IN CASH & CASH EQUIVALENTS1
$32.7M WORKING CAPITAL1
1 Quarter-ended June 30, 2017
FOCUSED ON MAINTAINING FINANCIAL FLEXIBILITY
• Company-wide focus on cash conservation and new business in 2017 + 2018
• Strong working capital position
• Prudently managing cash, production, and costs through current down market
• Long-term contracts and toll processing offering some protection from low uranium prices
• Committed to maintaining average cost of capital as low as possible
• Discipline to limit capital investments only to highly accretive opportunities
• Selling certain non-core assets to generate cash and reduce holding costs
22
STRONG MANAGEMENT & BOARD FINANCIALLY INVESTED IN ENERGY FUELS’ SUCCESS
• Extensive experience in U.S. and global mining industries – Successful track record of mine development, mine production, and uranium sales
• Top management significantly invested in business – Among the highest levels of insider representation in the sector
23
9.2% of outstanding shares
Board and Management own or represent
11 Insiders purchased common stock in 2017

FORWARD LOOKING STATEMENTS
Certain of the information contained in this presentation constitutes "forward-looking information" (as defined in the Securities Act (Ontario)) and "forward-looking statements" (as defined in the U.S. Private Securities Litigation Reform Act of 1995) that are based on expectations, estimates and projections of management of Energy Fuels Inc. ("Energy Fuels“) as of today's date. Such forward-looking information and forward-looking statements include but are not limited to: the business strategy for Energy Fuels; Energy Fuels expectations with regard to current and future uranium market conditions, including prices, production and lags; the uranium industry’s ability to respond to higher demand; the impacts of recent market developments; business plans; outlook; objectives; expectations as to the prices of U3O8, V2O5, and Cu; expectations as to reserves, resources, results of exploration and related expenses; estimated future production and costs; changes in project parameters; the expected permitting and production time lines; the Company’s belief that it has significant organic production growth potential, unmatched scalability, the results of drilling at the Canyon Mine; the potential for additional business opportunities including the cleanup of historic mines in the Four Corners Region of the U.S.; the potential for optimizing mining and processing; the Company’s belief in its readiness to capitalize on improving markets; the potential to joint venture, sell, trade or pursue other opportunities on its non-core projects; and expected worldwide uranium supply and demand. All statements contained herein which are not historical facts are forward-looking statements that involve risks, uncertainties and other factors that could cause actual results to differ materially from those expressed or implied by such forward-looking information and forward-looking statements. Factors that could cause such differences, without limiting the generality of the foregoing include: risks that the synergies and effects on value described herein may not be achieved; risks inherent in exploration, development and production activities; volatility in market prices for uranium and vanadium; the impact of the sales volume of uranium and vanadium; the ability to sustain production from mines and the mill; competition; the impact of change in foreign currency exchange; imprecision in mineral resource and reserve estimates; environmental and safety risks including increased regulatory burdens; changes to reclamation requirements; unexpected geological or hydrological conditions; a possible deterioration in political support for nuclear energy; changes in government regulations and policies, including trade laws and policies; demand for nuclear power; replacement of production and failure to obtain necessary permits and approvals from government authorities; weather and other natural phenomena; ability to maintain and further improve positive labour relations; operating performance of the facilities; success of planned development projects; and other development and operating risks. Should one or more of these risks or uncertainties materialize, or should underlying assumptions prove incorrect, actual results may vary materially from those anticipated, believed, estimated or expected. Although Energy Fuels believes that the assumptions inherent in the forward-looking statements are reasonable, undue reliance should not be placed on these statements, which only apply as of the date of this presentation. Energy Fuels does not undertake any obligation to publicly update or revise any forward-looking information or forward looking statements after the date of this presentation to conform such information to actual results or to changes in Energy Fuels’ expectations except as otherwise required by applicable legislation. Additional information about the material factors or assumptions on which forward looking information is based or the material risk factors that may affect results is contained under “Risk Factors” in Energy Fuels' annual report on Form 10-K for the year ended December 31, 2016 which was filed with the SEC on March 10, 2017. These documents are available on SEDAR at www.sedar.com and on EDGAR at www.sec.gov.
24
NOTICE REGARDING TECHNICAL DISCLOSURE
All of the technical information in this presentation concerning Energy Fuels’ properties was prepared in accordance with the Canadian regulatory requirements set out in National Instrument 43-101 - Standards of Disclosure for Mineral Projects of the Canadian Securities Administrators (“NI 43-101”). The technical information on each of the properties which are currently material to Energy Fuels is based on independent technical reports prepared in accordance with NI 43-101, as detailed below. The following technical reports are available for viewing at www.sedar.com under Energy Fuels’ SEDAR profile: Technical information regarding Energy Fuels’ Colorado Plateau properties is based on the following technical reports: (i) “Technical Report on the Henry Mountains Complex Uranium Property, Utah, U.S.A.” dated June 27, 2012 authored by William E. Roscoe, Ph.D., P.Eng., Douglas H. Underhill, Ph.D., C.P.G., and Thomas C. Pool, P.E. of Roscoe Postle Associates Inc.; (ii) "The Daneros Mine Project, San Juan County, Utah, U.S.A.“ dated July 18, 2012 authored by Douglas C. Peters, C.P.G., of Peters Geosciences; (iii) “Updated Technical Report on Sage Plain Project (Including the Calliham Mine), San Juan County, Utah, USA” dated March 18, 2015 authored by Douglas C. Peters, C.P.G., of Peters Geosciences; (iv) “Updated Technical Report on Energy Fuels Resources Corporation’s Whirlwind Property (Including Whirlwind, Far West, and Crosswind Claim Groups and Utah State Metalliferous Minerals Lease ML-49312), Mesa County, Colorado and Grand County, Utah” dated March 15, 2011 authored by Douglas C. Peters, C.P.G., of Peters Geosciences. Technical information regarding Energy Fuels’ Arizona Strip properties is based on the following technical reports: (i) "Technical Report on the Arizona Strip Uranium Project, Arizona, U.S.A.“ dated June 27, 2012 and authored by Thomas C. Pool, P.E. and David A. Ross, M. Sc., P.Geo. of Roscoe Postle Associates Inc.; (ii) "Technical Report on the EZ1 and EZ2 Breccia Pipes, Arizona Strip District, U.S.A.“ dated June 27, 2012 and authored by David A. Ross, M.Sc., P.Geo. and Christopher Moreton, Ph.D., P.Geo., of Roscoe Postle Associates Inc. and (iii) “NI 43-101 Technical Report on Resources Wate Uranium Breccia Pipe – Northern Arizona, USA” dated March 10, 2015 and authored by Allan Moran, CPG AIPG and Frank A. Daviess, MAusIM, RM SME of SRK Consulting (US), Inc. The technical information in this presentation regarding the Sheep Mountain Project is based on the technical report entitled “Sheep Mountain Uranium Project Fremont County, Wyoming USA – Updated Preliminary Feasibility Study – National Instrument 43-101 Technical Report” dated April 13, 2012 authored by Douglas L. Beahm P.E., P.G. The technical information in this presentation regarding the Roca Honda Project is based on the technical report entitled “Technical Report on the Roca Honda Project, McKinley County, New Mexico, U.S.A.” dated October 27, 2016 authored by Robert Michaud, P.Eng; Stuart E. Collins, P.E.; Mark B. Mathisen, CPG, of RPA (USA) Ltd. and Harold R. Roberts, P.E. and COO of Energy Fuels. The technical information in this presentation regarding the La Sal project is based on a technical report entitled “Technical Report on La Sal District Project (Including the Pandora, Beaver and Energy Queen Projects), San Juan County, Utah, U.S.A.” dated March 26, 2014 authored by Douglas C. Peters, CPG. The technical information in this presentation regarding the Alta Mesa ISR Project is based on a technical report entitled “Alta Mesa Uranium Project, Alta Mesa and Mesteña Grande Mineral Resources and Exploration Target, Technical Report National Instrument 43-101”, dated July 19, 2016 authored by Douglas L. Beahm, P.E., P.G. of BRS Engineering. The following technical reports are available for viewing at www.sedar.com under Uranerz’ SEDAR profile: The technical information in this presentation regarding the Nichols Ranch, Jane Dough, and Hank properties is based on the technical report entitled “Nichols Ranch Uranium Project 43-101 Technical Report – Preliminary Economic Assessment - Campbell and Johnson Counties, Wyoming" dated February 25, 2015” authored by Douglas L. Beahm, P.E., P.G. of BRS and Paul Goranson, P.E. of Uranerz Energy Corporation. The technical information in this presentation regarding the Reno Creek Property is based on the technical report entitled “Reno Creek Property: "Technical Report - Reno Creek Property- Campbell County, Wyoming, U.S.A." dated October 13, 2010” authored by Douglass H. Graves, P.E. of TREC, Inc. The technical information in this presentation regarding Uranerz’ West North Butte Properties is based on the technical report entitled “West North Butte Properties: "Technical Report - West North Butte Satellite Properties - Campbell County, Wyoming, U.S.A." dated December 9, 2008” Douglass H. Graves, P.E. of TREC, Inc. The technical information in this presentation regarding Uranerz’ North Rolling Pin Property is based on the technical report entitled " North Rolling Pin Property: "Technical Report - North Rolling Pin Property - Campbell County, Wyoming, U.S.A." dated June 4, 2010” authored by Douglass H. Graves, P.E. of TREC, Inc. Stephen P. Antony, P.E., President & CEO of Energy Fuels is a Qualified Person as defined by NI 43-101 and has reviewed and approved the technical disclosure contained in this document.
25

CAUTIONARY STATEMENTS FOR US INVESTORS CONCERNING MINERAL RESOURCES
This presentation may use the terms "Measured", "Indicated“ and "Inferred" Resources. U.S. investors are advised that, while such terms are recognized and required by Canadian regulations, the United States Securities and Exchange Commission (“SEC”) does not recognize them. "Inferred Resources" have a great amount of uncertainty as to their existence, and great uncertainty as to their economic feasibility. It cannot be assumed that all or any part of an Inferred Resource will ever be upgraded to a higher category. Under Canadian rules, estimates of Inferred Resources may not form the basis of feasibility or pre-feasibility studies. U.S. investors are cautioned not to assume that all or any part of Measured or Indicated Mineral Resources will ever be converted into Mineral Reserves. Accordingly, U.S. investors are advised that information regarding Mineral Resources contained in this presentation may not be comparable to similar information made public by United States companies. Mineral resources disclosed in this presentation and in the NI 43-101 technical reports referenced herein have been estimated in accordance with the definition standards on mineral resources and mineral reserves of the Canadian Institute of Mining, Metallurgy and Petroleum referred to in National Instrument 43-101, commonly referred to as "NI 43-101". The NI 43-101 technical reports may include estimations of potential mineral resources for further targeted exploration by Energy Fuels, disclosed pursuant to the applicable provisions of NI 43-101.The NI 43-101 technical reports referenced herein are a requirement of NI 43-101 and includes estimations of mineral resources and potential mineral resources for further targeted exploration by the issuer disclosed pursuant to the applicable provisions of NI 43-101. As a company listed on the TSX, Energy Fuels is required by Canadian law to provide disclosure in accordance with NI 43-101. US reporting requirements for disclosure of mineral properties are governed by the SEC and included in the SEC's Securities Act Industry Guide 7 entitled "Description of Property by Issuers Engaged or to be Engaged in Significant Mining Operations" ("Guide 7"). NI 43-101 and Guide 7 standards are substantially different. For example, the terms "mineral reserve", "proven mineral reserve" and "probable mineral reserve" are Canadian mining terms as defined in accordance with NI 43-101. These definitions differ from the definitions in Guide 7. The NI 43-101 technical reports and this presentation use or may use the terms “probable mineral reserve”, "mineral resource“, “measured mineral resource”, “indicated mineral resource”, “Inferred mineral resource”, "potential uranium exploration target", "potential mineral resource", "potential mineral deposit" and "potential target mineral resource". US Investors are advised that these terms and concepts are set out in and required to be disclosed by NI 43-101 as information material to the issuer; however, these terms and concepts are not recognized by the SEC or included in Guide 7, and these terms and concepts are normally not permitted to be used in reports and registration statements filed with the SEC. US Investors should be aware that Energy Fuels has no "reserves" as defined by Guide 7 and are cautioned not to assume that any part or all of an inferred mineral resource or potential target mineral resources will ever be upgraded to a higher category or confirmed or converted into Guide 7 compliant "reserves". US Investors are cautioned not to assume that all or any part of a potential mineral resource exists, or is economically or legally mineable.
26
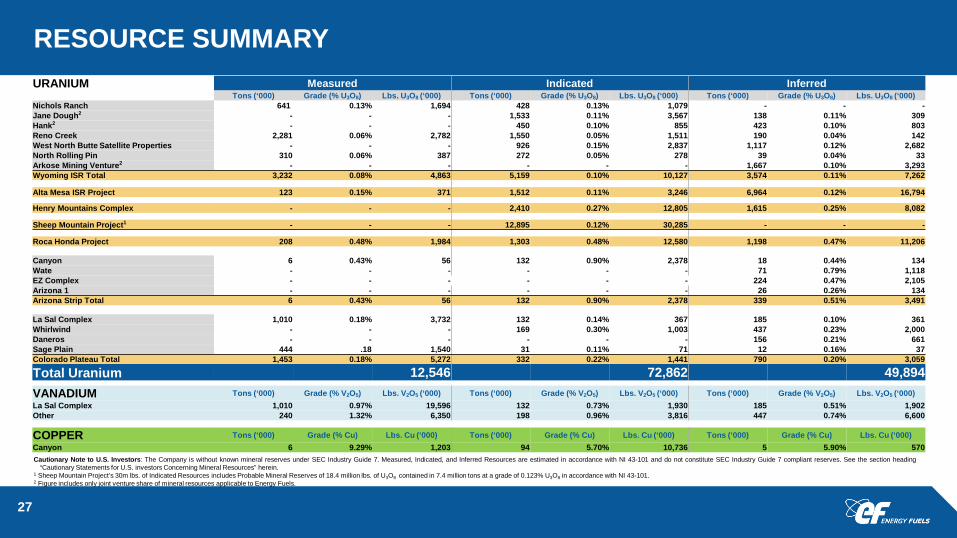
RESOURCE SUMMARY URANIUM Measured Indicated Inferred
Tons (‘000) Grade (% U3O8) Lbs. U3O8 (‘000) Tons (‘000) Grade (% U3O8) Lbs. U3O8 (‘000) Tons (‘000) Grade (% U3O8) Lbs. U3O8 (‘000) Nichols Ranch 641 0.13% 1,694 428 0.13% 1,079 - - - Jane Dough2 - - - 1,533 0.11% 3,567 138 0.11% 309 Hank2 - - - 450 0.10% 855 423 0.10% 803 Reno Creek 2,281 0.06% 2,782 1,550 0.05% 1,511 190 0.04% 142 West North Butte Satellite Properties - - - 926 0.15% 2,837 1,117 0.12% 2,682 North Rolling Pin 310 0.06% 387 272 0.05% 278 39 0.04% 33 Arkose Mining Venture2 - - - - - - 1,667 0.10% 3,293 Wyoming ISR Total 3,232 0.08% 4,863 5,159 0.10% 10,127 3,574 0.11% 7,262
Alta Mesa ISR Project 123 0.15% 371 1,512 0.11% 3,246 6,964 0.12% 16,794
Henry Mountains Complex - - - 2,410 0.27% 12,805 1,615 0.25% 8,082
Sheep Mountain Project1 - - - 12,895 0.12% 30,285 - - -
Roca Honda Project 208 0.48% 1,984 1,303 0.48% 12,580 1,198 0.47% 11,206
Canyon 6 0.43% 56 132 0.90% 2,378 18 0.44% 134 Wate - - - - - - 71 0.79% 1,118 EZ Complex - - - - - - 224 0.47% 2,105 Arizona 1 - - - - - - 26 0.26% 134 Arizona Strip Total 6 0.43% 56 132 0.90% 2,378 339 0.51% 3,491
La Sal Complex 1,010 0.18% 3,732 132 0.14% 367 185 0.10% 361 Whirlwind - - - 169 0.30% 1,003 437 0.23% 2,000 Daneros - - - - - - 156 0.21% 661 Sage Plain 444 .18 1,540 31 0.11% 71 12 0.16% 37 Colorado Plateau Total 1,453 0.18% 5,272 332 0.22% 1,441 790 0.20% 3,059
Total Uranium 12,546 72,862 49,894
Cautionary Note to U.S. Investors: The Company is without known mineral reserves under SEC Industry Guide 7. Measured, Indicated, and Inferred Resources are estimated in accordance with NI 43-101 and do not constitute SEC Industry Guide 7 compliant reserves. See the section heading “Cautionary Statements for U.S. investors Concerning Mineral Resources” herein.
1 Sheep Mountain Project’s 30m lbs. of Indicated Resources includes Probable Mineral Reserves of 18.4 million lbs. of U3O8 contained in 7.4 million tons at a grade of 0.123% U3O8 in accordance with NI 43-101. 2 Figure includes only joint venture share of mineral resources applicable to Energy Fuels.
27
VANADIUM Tons (‘000) Grade (% V2O5) Lbs. V2O5 (‘000) Tons (‘000) Grade (% V2O5) Lbs. V2O5 (‘000) Tons (‘000) Grade (% V2O5) Lbs. V2O5 (‘000) La Sal Complex 1,010 0.97% 19,596 132 0.73% 1,930 185 0.51% 1,902 Other 240 1.32% 6,350 198 0.96% 3,816 447 0.74% 6,600
COPPER Tons (‘000) Grade (% Cu) Lbs. Cu (‘000) Tons (‘000) Grade (% Cu) Lbs. Cu (‘000) Tons (‘000) Grade (% Cu) Lbs. Cu (‘000) Canyon 6 9.29% 1,203 94 5.70% 10,736 5 5.90% 570


![Western Uranium Corporation [Type text]western-uranium.com/media/Western Uranium Corp...2015, Western Uranium acquired Black Range Minerals Ltd to acquire additional uranium assets](https://img.pdfslide.us/doc/110x75/5e9e2fdc39245c320521c248/western-uranium-corporation-type-textwestern-uranium-corp-2015-western-uranium.jpg)