Embed Size (px)
Citation preview
A FIRST LOOK AT STATE RESPONSES TO ESSA AND LOW‑PERFORMING SCHOOLSCenter on School Turnaround Survey of State Supports for School Turnaround
Prepared by Education Northwest: Caitlin Scott Nora Ostler
http://centeronschoolturnaround.org/ http://educationnorthwest.org/
About Education Northwest: Founded as a nonprofit corporation in 1966, Education Northwest builds capacity in schools, families, and communities through applied research and development. Education Northwest has submitted this report as part of the ongoing formative evaluation of the Center on School Turnaround. The report was reviewed through Education Northwest’s quality assurance process.
Contact: Education Northwest 101 SW Main Street, Suite 500 Portland, OR 97204 503.275.9500
Authors: Caitlin Scott, PhD, Practice Expert—Education Policy, Research, and Evaluation Nora Ostler, Research and Data Advisor
Suggested citation: Scott, C. & Ostler, N. (2016). A first look at state responses to ESSA and low-performing schools: Center on School Turnaround survey of state supports for school turnaround. Portland, OR: Education Northwest.
THE CENTER ON
SCHOOLTURNAROUND
ContentsState Responses to ESSA and Low-Performing Schools 1
States Are Already Making Plans for Turnaround Based on ESSA 2SEAs Need Assistance Supporting School Turnaround Practices and Policies Related to ESSA 3SEAs Await Guidance, But ESSA-Related Changes in Accountability and Flexibility Seem Promising 4Implications for Strengthening Capacity for School Turnaround 5
List of FiguresFigure 1: Percentages of SEAs planning to make overall changes to policies or practices due to ESSA (n = 49) 2Figure 2: Percentages of SEAs planning to change specific policies or practices due to ESSA 3Figure 3: Percentages of SEAs “agreeing” or “strongly agreeing” that their state could benefit from assistance supporting turnaround policies and practices related to ESSA 4
1
State Responses to ESSA and Low‑Performing Schools
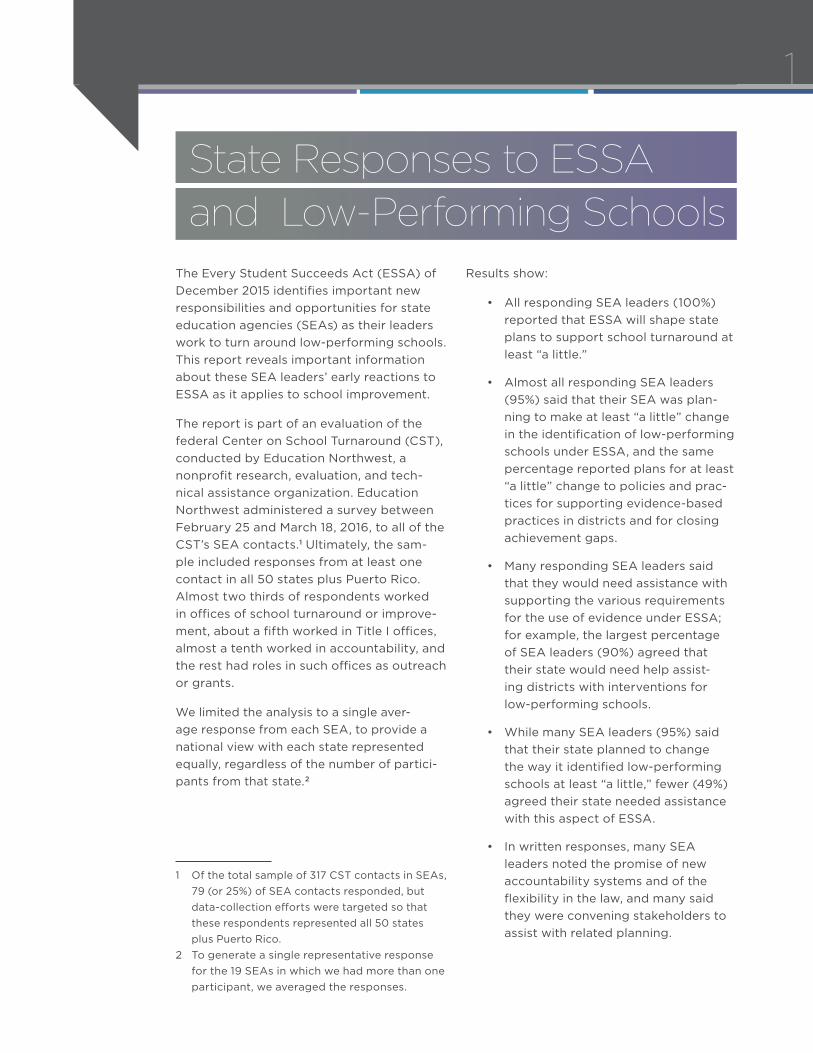
The Every Student Succeeds Act (ESSA) of December 2015 identifies important new responsibilities and opportunities for state education agencies (SEAs) as their leaders work to turn around low-performing schools. This report reveals important information about these SEA leaders’ early reactions to ESSA as it applies to school improvement.
The report is part of an evaluation of the federal Center on School Turnaround (CST), conducted by Education Northwest, a nonprofit research, evaluation, and tech-nical assistance organization. Education Northwest administered a survey between February 25 and March 18, 2016, to all of the CST’s SEA contacts.1 Ultimately, the sam-ple included responses from at least one contact in all 50 states plus Puerto Rico. Almost two thirds of respondents worked in offices of school turnaround or improve-ment, about a fifth worked in Title I offices, almost a tenth worked in accountability, and the rest had roles in such offices as outreach or grants.
We limited the analysis to a single aver-age response from each SEA, to provide a national view with each state represented equally, regardless of the number of partici-pants from that state.2
1 Of the total sample of 317 CST contacts in SEAs, 79 (or 25%) of SEA contacts responded, but data-collection efforts were targeted so that these respondents represented all 50 states plus Puerto Rico.
2 To generate a single representative response for the 19 SEAs in which we had more than one participant, we averaged the responses.
Results show:
• All responding SEA leaders (100%) reported that ESSA will shape state plans to support school turnaround at least “a little.”
• Almost all responding SEA leaders (95%) said that their SEA was plan-ning to make at least “a little” change in the identification of low-performing schools under ESSA, and the same percentage reported plans for at least “a little” change to policies and prac-tices for supporting evidence-based practices in districts and for closing achievement gaps.
• Many responding SEA leaders said that they would need assistance with supporting the various requirements for the use of evidence under ESSA; for example, the largest percentage of SEA leaders (90%) agreed that their state would need help assist-ing districts with interventions for low-performing schools.
• While many SEA leaders (95%) said that their state planned to change the way it identified low-performing schools at least “a little,” fewer (49%) agreed their state needed assistance with this aspect of ESSA.
• In written responses, many SEA leaders noted the promise of new accountability systems and of the flexibility in the law, and many said they were convening stakeholders to assist with related planning.
2
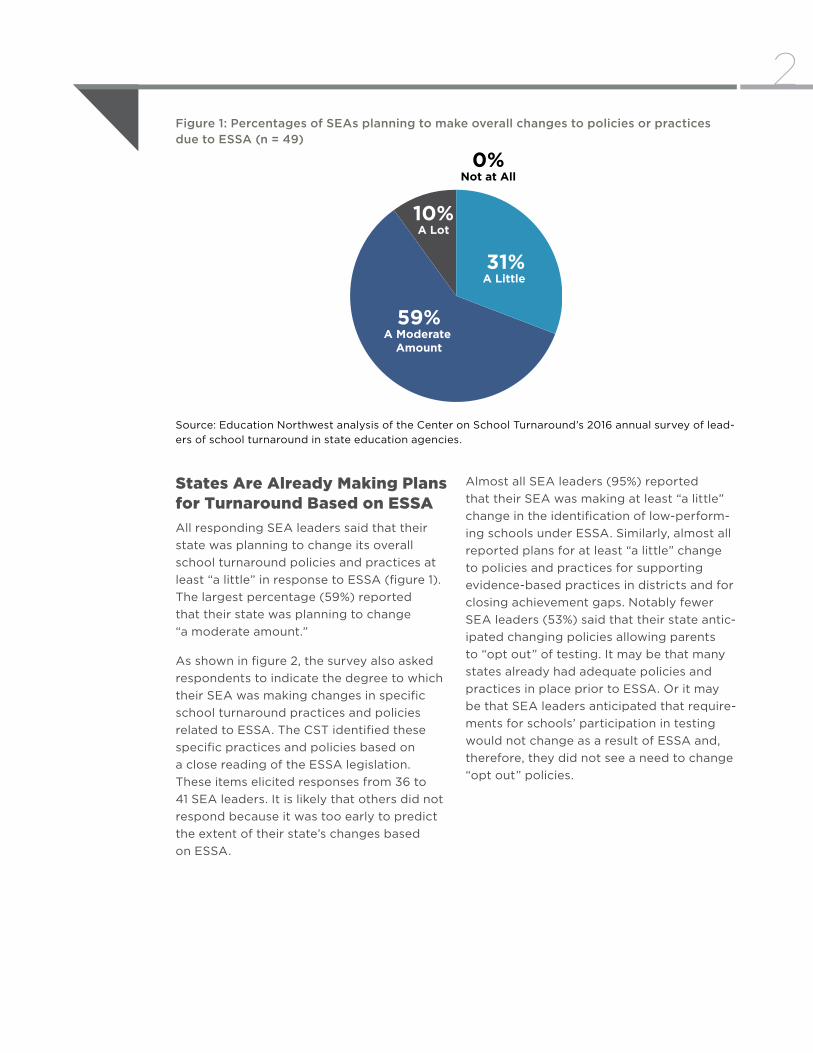
States Are Already Making Plans for Turnaround Based on ESSA All responding SEA leaders said that their state was planning to change its overall school turnaround policies and practices at least “a little” in response to ESSA (figure 1). The largest percentage (59%) reported that their state was planning to change “a moderate amount.”
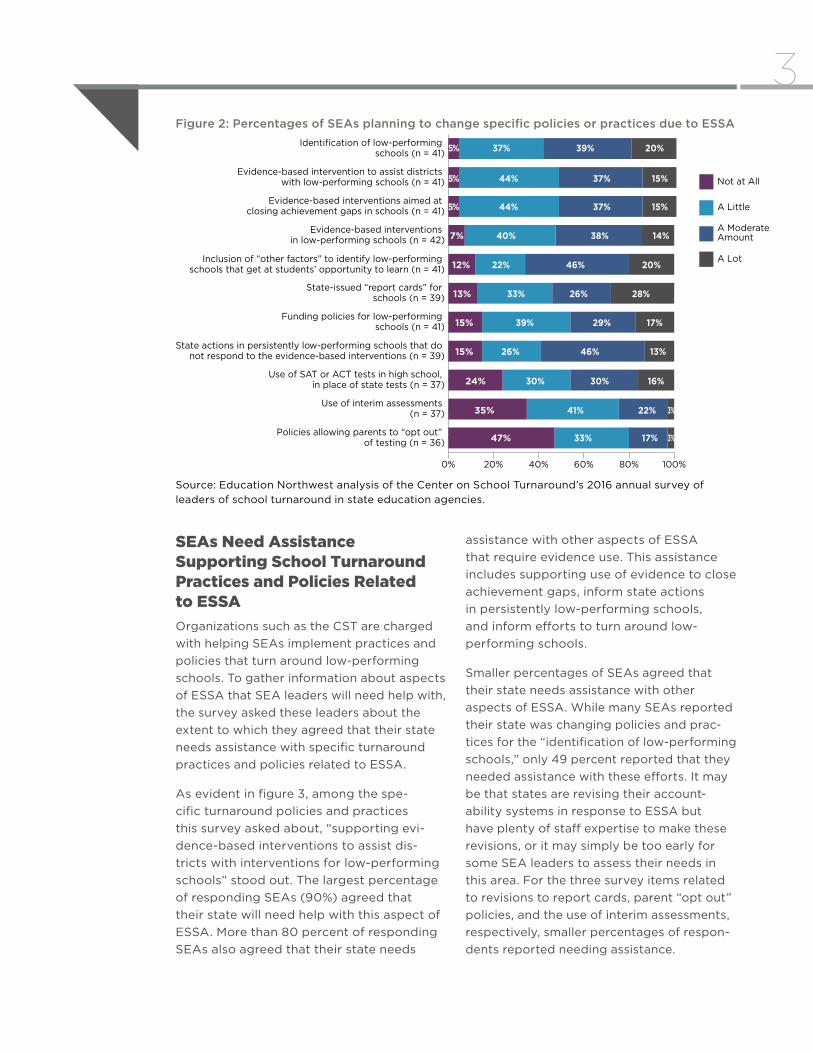
As shown in figure 2, the survey also asked respondents to indicate the degree to which their SEA was making changes in specific school turnaround practices and policies related to ESSA. The CST identified these specific practices and policies based on a close reading of the ESSA legislation. These items elicited responses from 36 to 41 SEA leaders. It is likely that others did not respond because it was too early to predict the extent of their state’s changes based on ESSA.
Almost all SEA leaders (95%) reported that their SEA was making at least “a little” change in the identification of low-perform-ing schools under ESSA. Similarly, almost all reported plans for at least “a little” change to policies and practices for supporting evidence-based practices in districts and for closing achievement gaps. Notably fewer SEA leaders (53%) said that their state antic-ipated changing policies allowing parents to “opt out” of testing. It may be that many states already had adequate policies and practices in place prior to ESSA. Or it may be that SEA leaders anticipated that require-ments for schools’ participation in testing would not change as a result of ESSA and, therefore, they did not see a need to change “opt out” policies.
Figure 1: Percentages of SEAs planning to make overall changes to policies or practices due to ESSA (n = 49)
10%A Lot
59%A Moderate
Amount
31%A Little
0%Not at All
Source: Education Northwest analysis of the Center on School Turnaround’s 2016 annual survey of lead-ers of school turnaround in state education agencies.
3
SEAs Need Assistance Supporting School Turnaround Practices and Policies Related to ESSA Organizations such as the CST are charged with helping SEAs implement practices and policies that turn around low-performing schools. To gather information about aspects of ESSA that SEA leaders will need help with, the survey asked these leaders about the extent to which they agreed that their state needs assistance with specific turnaround practices and policies related to ESSA.
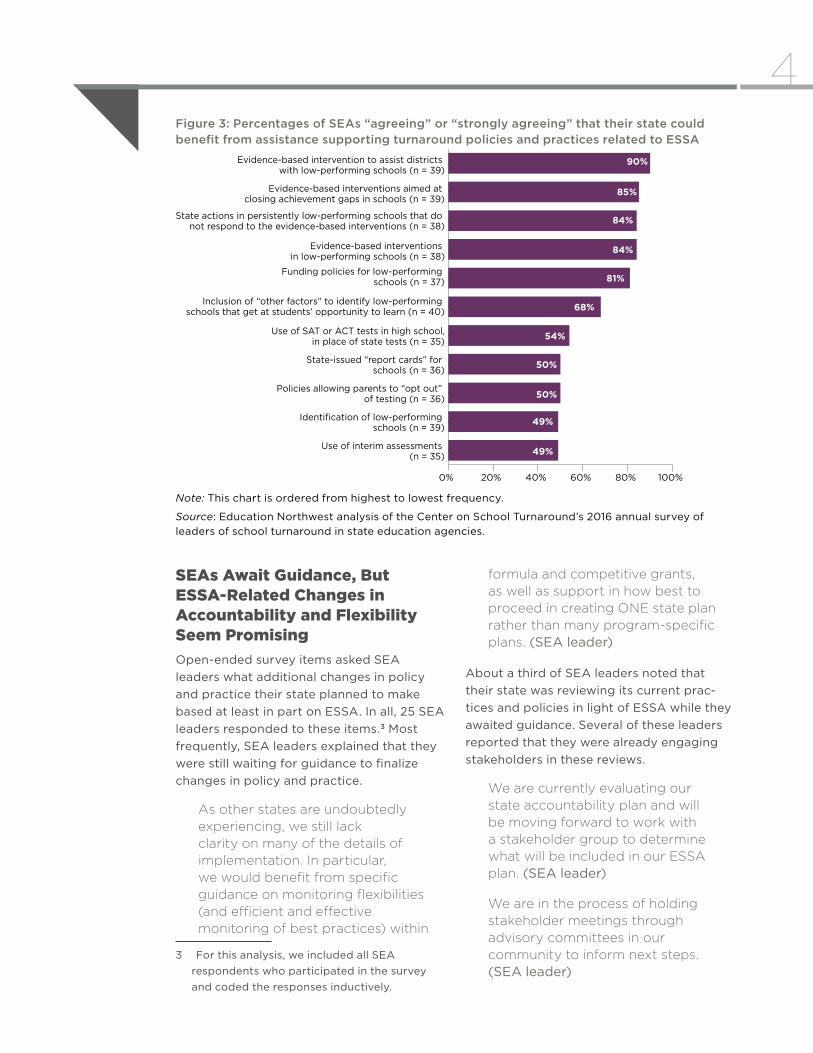
As evident in figure 3, among the spe-cific turnaround policies and practices this survey asked about, “supporting evi-dence-based interventions to assist dis-tricts with interventions for low- performing schools” stood out. The largest percentage of responding SEAs (90%) agreed that their state will need help with this aspect of ESSA. More than 80 percent of responding SEAs also agreed that their state needs
assistance with other aspects of ESSA that require evidence use. This assistance includes supporting use of evidence to close achievement gaps, inform state actions in persistently low-performing schools, and inform efforts to turn around low- performing schools.
Smaller percentages of SEAs agreed that their state needs assistance with other aspects of ESSA. While many SEAs reported their state was changing policies and prac-tices for the “identification of low-performing schools,” only 49 percent reported that they needed assistance with these efforts. It may be that states are revising their account-ability systems in response to ESSA but have plenty of staff expertise to make these revisions, or it may simply be too early for some SEA leaders to assess their needs in this area. For the three survey items related to revisions to report cards, parent “opt out” policies, and the use of interim assessments, respectively, smaller percentages of respon-dents reported needing assistance.
Figure 2: Percentages of SEAs planning to change specific policies or practices due to ESSA
0% 20% 40% 60% 80% 100%
A Lot
A Moderate Amount
A Little
Not at All
Policies allowing parents to “opt out” of testing (n = 36)
Use of interim assessments (n = 37)
Use of SAT or ACT tests in high school, in place of state tests (n = 37)
State actions in persistently low-performing schools that do not respond to the evidence-based interventions (n = 39)
Funding policies for low-performing schools (n = 41)
State-issued “report cards” for schools (n = 39)
Inclusion of “other factors” to identify low-performing schools that get at students’ opportunity to learn (n = 41)
Evidence-based interventions in low-performing schools (n = 42)
Evidence-based interventions aimed at closing achievement gaps in schools (n = 41)
Evidence-based intervention to assist districts with low-performing schools (n = 41)
Identification of low-performing schools (n = 41) 37% 20%39%5%
44% 15%37%5%
44% 15%37%5%
40% 14%38%7%
22% 20%46%12%
33% 28%26%13%
39% 17%29%15%
26% 13%46%15%
30% 16%30%24%
41% 3%22%35%
33% 3%17%47%
Source: Education Northwest analysis of the Center on School Turnaround’s 2016 annual survey of l eaders of school turnaround in state education agencies.
4
SEAs Await Guidance, But ESSA-Related Changes in Accountability and Flexibility Seem PromisingOpen-ended survey items asked SEA leaders what additional changes in policy and practice their state planned to make based at least in part on ESSA. In all, 25 SEA leaders responded to these items.3 Most frequently, SEA leaders explained that they were still waiting for guidance to finalize changes in policy and practice.
As other states are undoubtedly experiencing, we still lack clarity on many of the details of implementation. In particular, we would benefit from specific guidance on monitoring flexibilities (and efficient and effective monitoring of best practices) within
3 For this analysis, we included all SEA respondents who participated in the survey and coded the responses inductively.
formula and competitive grants, as well as support in how best to proceed in creating ONE state plan rather than many program-specific plans. (SEA leader)
About a third of SEA leaders noted that their state was reviewing its current prac-tices and policies in light of ESSA while they awaited guidance. Several of these leaders reported that they were already engaging stakeholders in these reviews.
We are currently evaluating our state accountability plan and will be moving forward to work with a stakeholder group to determine what will be included in our ESSA plan. (SEA leader)
We are in the process of holding stakeholder meetings through advisory committees in our community to inform next steps. (SEA leader)
Figure 3: Percentages of SEAs “agreeing” or “strongly agreeing” that their state could benefit from assistance supporting turnaround policies and practices related to ESSA
0% 20% 40% 60% 80% 100%
Use of interim assessments (n = 35)
Identification of low-performing schools (n = 39)
Policies allowing parents to “opt out” of testing (n = 36)
State-issued “report cards” for schools (n = 36)
Use of SAT or ACT tests in high school, in place of state tests (n = 35)
Inclusion of “other factors” to identify low-performing schools that get at students’ opportunity to learn (n = 40)
Funding policies for low-performing schools (n = 37)
Evidence-based interventions in low-performing schools (n = 38)
State actions in persistently low-performing schools that do not respond to the evidence-based interventions (n = 38)
Evidence-based interventions aimed at closing achievement gaps in schools (n = 39)
Evidence-based intervention to assist districts with low-performing schools (n = 39)
90%
85%
84%
84%
81%
68%
54%
50%
50%
49%
49%
Note: This chart is ordered from highest to lowest frequency.
Source: Education Northwest analysis of the Center on School Turnaround’s 2016 annual survey of leaders of school turnaround in state education agencies.
5The survey also asked what aspects of ESSA would be most impactful, and 29 SEA leaders responded to this open-ended item. About a third believed changes to account-ability systems under ESSA would have the largest impact and viewed this impact as either positive or neutral.
From my perspective, how we choose to identify schools eligible for Comprehensive Support and Improvement will be much improved. We are working with stakeholder groups to build a metric that uses more than just state assessment data to identify additional challenges. There will always be a lowest five percent of schools, even if every school in our state improves, so we are intentionally taking steps to change the conversation. Instead of having schools “On Improvement,” we will have schools who are “Eligible for Comprehensive Support and Improvement.” How we identify those schools, how we measure their growth, and the exit criteria we establish will be very important moving forward. (SEA leader)
The revised thresholds for identifying the lowest-performing schools will be the most impactful (e.g., multiple high schools that would have exited priority or equivalent status will no longer be eligible to exit). Many of the other required provisions were in place, or in process, before the passage of ESSA. (SEA leader)
For about a third of SEA leaders, the new flexibility under ESSA promises to have the most impact. Several of these leaders said that the flexibility of being able to choose from among a variety of interventions for low-performing schools was most promising.
I am hopeful that our approach will be more about building capacity and supporting districts and schools than it currently is. I would like to see fewer requirements and more district freedom to choose interventions to support their schools. In order for this to work, the SEA should be providing guidance and support around those evidence-based practices that have the potential for improving student achievement. (SEA leader)
I think expanding thinking around supports for low-performing systems to include both districts and schools will be essential. I think determining how to leverage resources for low-performing schools based on turnaround lessons learned would be great. (SEA leader)
Implications for Strengthening Capacity for School Turnaround Survey results indicate that SEA leaders are already rethinking their state’s policies and practices for turning around low-performing schools based on ESSA. Furthermore, in the survey, many SEA leaders said that their state needs help with these changes. Simply put, SEAs cannot do all of this important work alone.
Therefore, national centers, such as the CST, will play an essential role in supporting SEAs with ESSA. This support might begin with convening conversations, disseminating resources, and offering assistance. ESSA has the potential to have a strong impact on many aspects of state policy and prac-tice for low-performing schools. Supporting organizations can work with SEAs to ensure that this impact is positive.

A FIRST LOOK AT STATE RESPONSES TO ESSA AND LOW‑PERFORMING SCHOOLSCenter on School Turnaround Survey of State Supports for School Turnaround
Caitlin Scott Nora Ostler
THE CENTER ON
SCHOOLTURNAROUND