Embed Size (px)
Citation preview
RESEARCH Open Access
A first genome assembly of the barley fungalpathogen Pyrenophora teres f. teresSimon R Ellwood1*, Zhaohui Liu2, Rob A Syme1, Zhibing Lai2, James K Hane3, Felicity Keiper4, Caroline S Moffat5,Richard P Oliver1, Timothy L Friesen2,6
Abstract
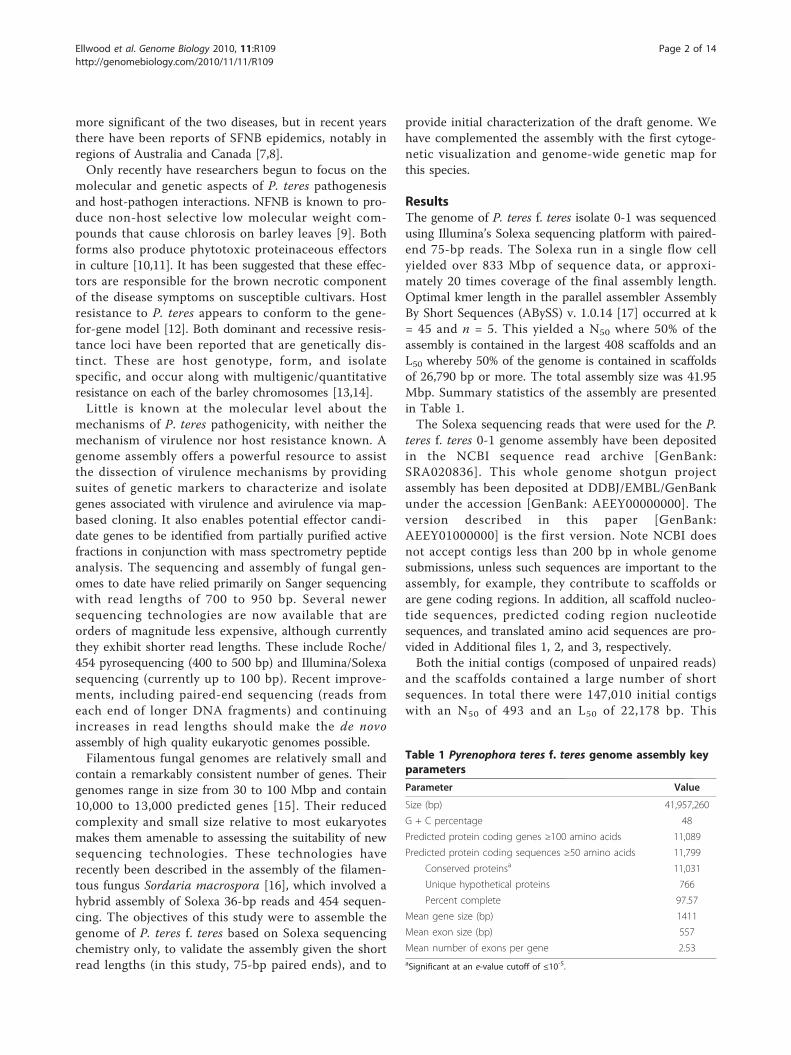
Background: Pyrenophora teres f. teres is a necrotrophic fungal pathogen and the cause of one of barley’s mostimportant diseases, net form of net blotch. Here we report the first genome assembly for this species based solelyon short Solexa sequencing reads of isolate 0-1. The assembly was validated by comparison to BAC sequences,ESTs, orthologous genes and by PCR, and complemented by cytogenetic karyotyping and the first genome-widegenetic map for P. teres f. teres.
Results: The total assembly was 41.95 Mbp and contains 11,799 gene models of 50 amino acids or more.Comparison against two sequenced BACs showed that complex regions with a high GC content assembledeffectively. Electrophoretic karyotyping showed distinct chromosomal polymorphisms between isolates 0-1 and15A, and cytological karyotyping confirmed the presence of at least nine chromosomes. The genetic map spans2477.7 cM and is composed of 243 markers in 25 linkage groups, and incorporates simple sequence repeatmarkers developed from the assembly. Among predicted genes, non-ribosomal peptide synthetases and effluxpumps in particular appear to have undergone a P. teres f. teres-specific expansion of non-orthologous genefamilies.
Conclusions: This study demonstrates that paired-end Solexa sequencing can successfully capture coding regionsof a filamentous fungal genome. The assembly contains a plethora of predicted genes that have been implicatedin a necrotrophic lifestyle and pathogenicity and presents a significant resource for examining the bases for P. teresf. teres pathogenicity.
BackgroundNet blotch of barley (Hordeum vulgare) is caused byPyrenophora teres Drechsler (anamorph Drechslera teres[Sacc.] Shoem.). P. teres is an ascomycete within theclass Dothideomycetes and order Pleosporales. Thisorder contains plant pathogens responsible for manynecrotrophic diseases in crops, including members ofthe genera Ascochyta, Cochliobolus, Pyrenophora, Lepto-sphaeria and Stagonospora. Net blotch is a major diseaseworldwide that causes barley yield losses of 10 to 40%,although complete loss can occur with susceptible culti-vars in the absence of fungicide treatment [1]. In Aus-tralia the value of disease control is estimated at $246million annually with average direct costs of $62 million
annually, making it the country’s most significant barleydisease [2].Net blotch exists in two morphologically indistinguish-
able but genetically differentiated forms: P. teres f. teres(net form of net blotch, NFNB) and P. teres f. maculata(spot form of net blotch, SFNB) [3,4]. These forms havebeen proposed as distinct species based on the diver-gence of MAT sequences in comparison to Pyrenophoragraminea [4]. Additionally, it has been suggested thatlimited gene flow may occur between the two forms[5,6]. As their names indicate, the two forms show dif-ferent disease symptoms. NFNB produces lattice-likesymptoms, in which necrosis develops along leaf veinswith occasional transverse striations. SFNB displaysmore discrete, rounded lesions, often surrounded by achlorotic zone. NFNB and SFNB may both be present inthe same region but with one form prevailing in indivi-dual locales. NFNB has historically been regarded as the
* Correspondence: [email protected] of Environment and Agriculture, Curtin University, Kent Street,Bentley, Perth, Western Australia 6102, AustraliaFull list of author information is available at the end of the article
Ellwood et al. Genome Biology 2010, 11:R109http://genomebiology.com/2010/11/11/R109
© 2010 Ellwood et al.; licensee BioMed Central Ltd. This is an open access article distributed under the terms of the Creative CommonsAttribution License (http://creativecommons.org/licenses/by/2.0), which permits unrestricted use, distribution, and reproduction inany medium, provided the original work is properly cited.
more significant of the two diseases, but in recent yearsthere have been reports of SFNB epidemics, notably inregions of Australia and Canada [7,8].Only recently have researchers begun to focus on the
molecular and genetic aspects of P. teres pathogenesisand host-pathogen interactions. NFNB is known to pro-duce non-host selective low molecular weight com-pounds that cause chlorosis on barley leaves [9]. Bothforms also produce phytotoxic proteinaceous effectorsin culture [10,11]. It has been suggested that these effec-tors are responsible for the brown necrotic componentof the disease symptoms on susceptible cultivars. Hostresistance to P. teres appears to conform to the gene-for-gene model [12]. Both dominant and recessive resis-tance loci have been reported that are genetically dis-tinct. These are host genotype, form, and isolatespecific, and occur along with multigenic/quantitativeresistance on each of the barley chromosomes [13,14].Little is known at the molecular level about the
mechanisms of P. teres pathogenicity, with neither themechanism of virulence nor host resistance known. Agenome assembly offers a powerful resource to assistthe dissection of virulence mechanisms by providingsuites of genetic markers to characterize and isolategenes associated with virulence and avirulence via map-based cloning. It also enables potential effector candi-date genes to be identified from partially purified activefractions in conjunction with mass spectrometry peptideanalysis. The sequencing and assembly of fungal gen-omes to date have relied primarily on Sanger sequencingwith read lengths of 700 to 950 bp. Several newersequencing technologies are now available that areorders of magnitude less expensive, although currentlythey exhibit shorter read lengths. These include Roche/454 pyrosequencing (400 to 500 bp) and Illumina/Solexasequencing (currently up to 100 bp). Recent improve-ments, including paired-end sequencing (reads fromeach end of longer DNA fragments) and continuingincreases in read lengths should make the de novoassembly of high quality eukaryotic genomes possible.Filamentous fungal genomes are relatively small and
contain a remarkably consistent number of genes. Theirgenomes range in size from 30 to 100 Mbp and contain10,000 to 13,000 predicted genes [15]. Their reducedcomplexity and small size relative to most eukaryotesmakes them amenable to assessing the suitability of newsequencing technologies. These technologies haverecently been described in the assembly of the filamen-tous fungus Sordaria macrospora [16], which involved ahybrid assembly of Solexa 36-bp reads and 454 sequen-cing. The objectives of this study were to assemble thegenome of P. teres f. teres based on Solexa sequencingchemistry only, to validate the assembly given the shortread lengths (in this study, 75-bp paired ends), and to
provide initial characterization of the draft genome. Wehave complemented the assembly with the first cytoge-netic visualization and genome-wide genetic map forthis species.
ResultsThe genome of P. teres f. teres isolate 0-1 was sequencedusing Illumina’s Solexa sequencing platform with paired-end 75-bp reads. The Solexa run in a single flow cellyielded over 833 Mbp of sequence data, or approxi-mately 20 times coverage of the final assembly length.Optimal kmer length in the parallel assembler AssemblyBy Short Sequences (ABySS) v. 1.0.14 [17] occurred at k= 45 and n = 5. This yielded a N50 where 50% of theassembly is contained in the largest 408 scaffolds and anL50 whereby 50% of the genome is contained in scaffoldsof 26,790 bp or more. The total assembly size was 41.95Mbp. Summary statistics of the assembly are presentedin Table 1.The Solexa sequencing reads that were used for the P.
teres f. teres 0-1 genome assembly have been depositedin the NCBI sequence read archive [GenBank:SRA020836]. This whole genome shotgun projectassembly has been deposited at DDBJ/EMBL/GenBankunder the accession [GenBank: AEEY00000000]. Theversion described in this paper [GenBank:AEEY01000000] is the first version. Note NCBI doesnot accept contigs less than 200 bp in whole genomesubmissions, unless such sequences are important to theassembly, for example, they contribute to scaffolds orare gene coding regions. In addition, all scaffold nucleo-tide sequences, predicted coding region nucleotidesequences, and translated amino acid sequences are pro-vided in Additional files 1, 2, and 3, respectively.Both the initial contigs (composed of unpaired reads)
and the scaffolds contained a large number of shortsequences. In total there were 147,010 initial contigswith an N50 of 493 and an L50 of 22,178 bp. This
Table 1 Pyrenophora teres f. teres genome assembly keyparameters
Parameter Value
Size (bp) 41,957,260
G + C percentage 48
Predicted protein coding genes ≥100 amino acids 11,089
Predicted protein coding sequences ≥50 amino acids 11,799
Conserved proteinsa 11,031
Unique hypothetical proteins 766
Percent complete 97.57
Mean gene size (bp) 1411
Mean exon size (bp) 557
Mean number of exons per gene 2.53aSignificant at an e-value cutoff of ≤10-5.
Ellwood et al. Genome Biology 2010, 11:R109http://genomebiology.com/2010/11/11/R109
Page 2 of 14
compared with a total of 146,737 scaffolds. The majorityof initial contigs (140,326 of 147,010) were 200 bp orless, and were shared with the scaffold file. Such shortcontigs are a result of reads from repetitive regions. InAbySS, where highly similar repetitive regions occur, a‘bubble’ removal algorithm simplifies the repeats to asingle sequence. Thus, short isolated ‘singletons’ occurthat were not assembled into scaffolds. Gene rich, morecomplex regions of the genome were represented by6,684 scaffolds containing over 80% of the assembledsequences.The assembly contains 11,799 predicted gene models
of 50 amino acids or more. Most of the predicted genes(93.5%) were conserved within other species and ofthese conserved genes, 45.2% showed very high homol-ogy with a BLASTP e-value of 0. As a further confirma-tion of the success in capturing gene-rich regions, thepercentage of complete genes (genes with defined startand stop codons) was 97.57%.To validate the assembly over relatively large dis-
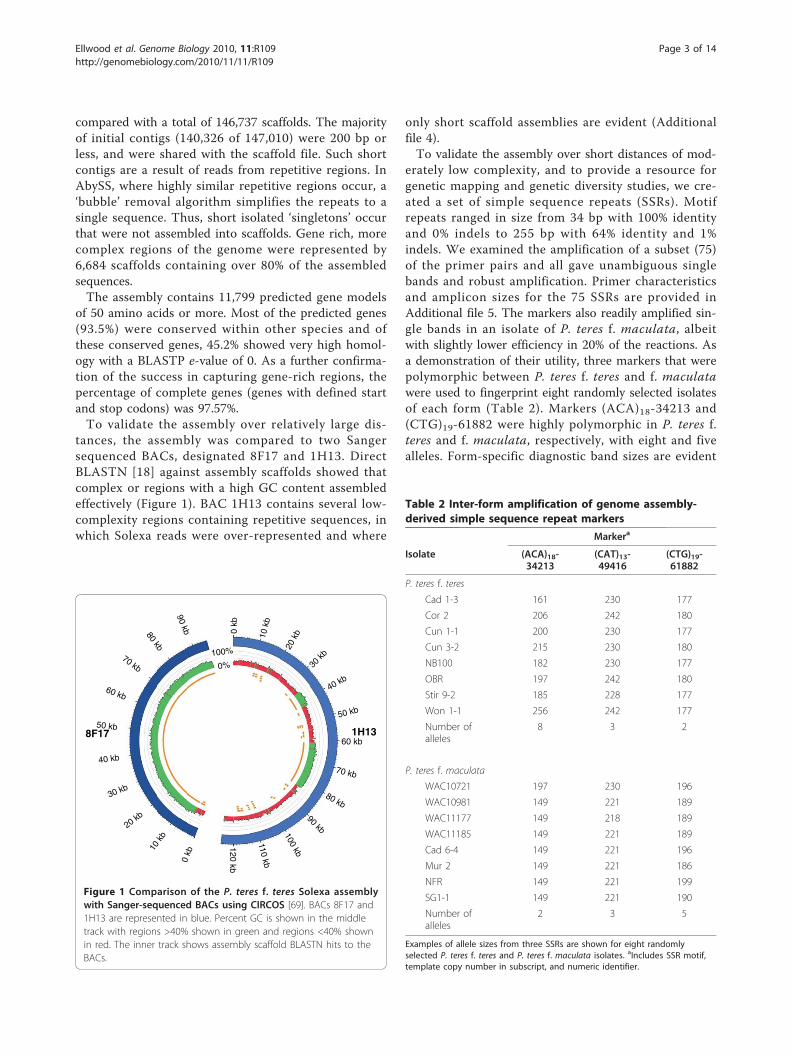
tances, the assembly was compared to two Sangersequenced BACs, designated 8F17 and 1H13. DirectBLASTN [18] against assembly scaffolds showed thatcomplex or regions with a high GC content assembledeffectively (Figure 1). BAC 1H13 contains several low-complexity regions containing repetitive sequences, inwhich Solexa reads were over-represented and where
only short scaffold assemblies are evident (Additionalfile 4).To validate the assembly over short distances of mod-
erately low complexity, and to provide a resource forgenetic mapping and genetic diversity studies, we cre-ated a set of simple sequence repeats (SSRs). Motifrepeats ranged in size from 34 bp with 100% identityand 0% indels to 255 bp with 64% identity and 1%indels. We examined the amplification of a subset (75)of the primer pairs and all gave unambiguous singlebands and robust amplification. Primer characteristicsand amplicon sizes for the 75 SSRs are provided inAdditional file 5. The markers also readily amplified sin-gle bands in an isolate of P. teres f. maculata, albeitwith slightly lower efficiency in 20% of the reactions. Asa demonstration of their utility, three markers that werepolymorphic between P. teres f. teres and f. maculatawere used to fingerprint eight randomly selected isolatesof each form (Table 2). Markers (ACA)18-34213 and(CTG)19-61882 were highly polymorphic in P. teres f.teres and f. maculata, respectively, with eight and fivealleles. Form-specific diagnostic band sizes are evident
Figure 1 Comparison of the P. teres f. teres Solexa assemblywith Sanger-sequenced BACs using CIRCOS [69]. BACs 8F17 and1H13 are represented in blue. Percent GC is shown in the middletrack with regions >40% shown in green and regions <40% shownin red. The inner track shows assembly scaffold BLASTN hits to theBACs.
Table 2 Inter-form amplification of genome assembly-derived simple sequence repeat markers
Markera
Isolate (ACA)18-34213
(CAT)13-49416
(CTG)19-61882
P. teres f. teres
Cad 1-3 161 230 177
Cor 2 206 242 180
Cun 1-1 200 230 177
Cun 3-2 215 230 180
NB100 182 230 177
OBR 197 242 180
Stir 9-2 185 228 177
Won 1-1 256 242 177
Number ofalleles
8 3 2
P. teres f. maculata
WAC10721 197 230 196
WAC10981 149 221 189
WAC11177 149 218 189
WAC11185 149 221 189
Cad 6-4 149 221 196
Mur 2 149 221 186
NFR 149 221 199
SG1-1 149 221 190
Number ofalleles
2 3 5
Examples of allele sizes from three SSRs are shown for eight randomlyselected P. teres f. teres and P. teres f. maculata isolates. aIncludes SSR motif,template copy number in subscript, and numeric identifier.
Ellwood et al. Genome Biology 2010, 11:R109http://genomebiology.com/2010/11/11/R109
Page 3 of 14
from the data, but with overlap in the ranges of allelesizes of each form for (CAT)13-49416, and for (ACA)18-34213 at 197 bp.In addition to the above assembly validations, we
compared 50 randomly selected non-homologous ESTsagainst the assembly to determine their presence; 49gave unambiguous matches, with the highest e-valuecutoff <10-80, and one gave no hit. This orphan ESTshowed no BLASTX similarity to any sequence in Gen-Bank and might be regarded as a library contaminant.Forty-seven (96%) of the remaining ESTs were predictedby GeneMark.
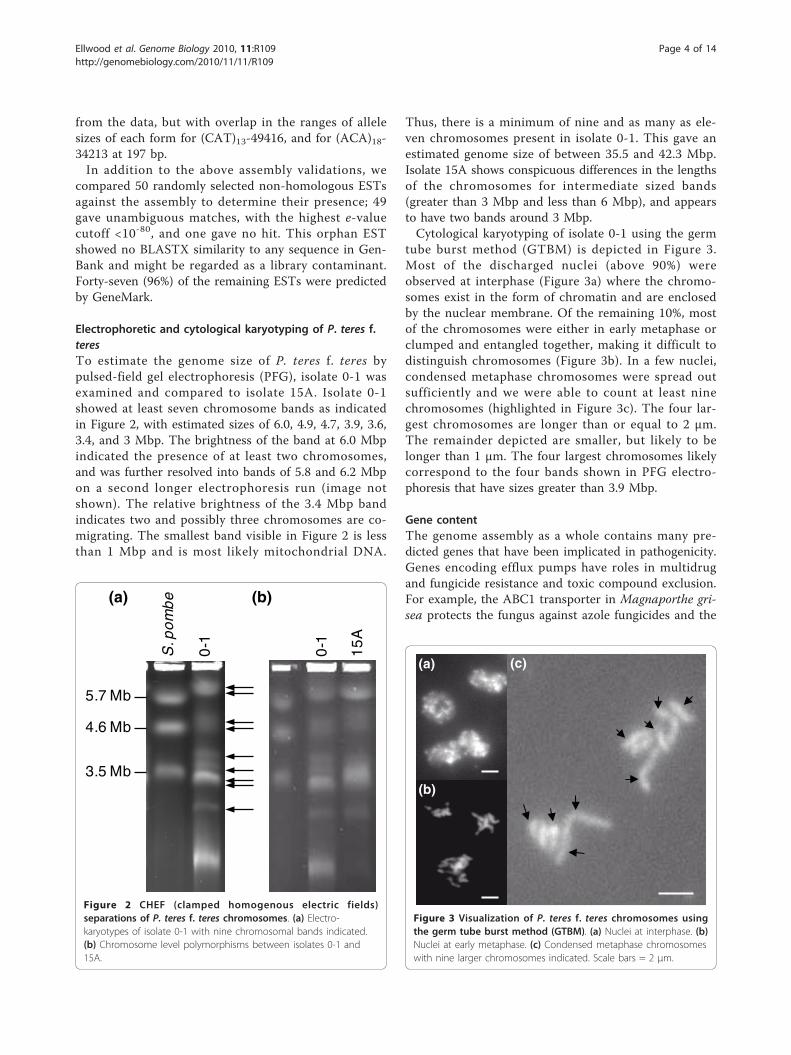
Electrophoretic and cytological karyotyping of P. teres f.teresTo estimate the genome size of P. teres f. teres bypulsed-field gel electrophoresis (PFG), isolate 0-1 wasexamined and compared to isolate 15A. Isolate 0-1showed at least seven chromosome bands as indicatedin Figure 2, with estimated sizes of 6.0, 4.9, 4.7, 3.9, 3.6,3.4, and 3 Mbp. The brightness of the band at 6.0 Mbpindicated the presence of at least two chromosomes,and was further resolved into bands of 5.8 and 6.2 Mbpon a second longer electrophoresis run (image notshown). The relative brightness of the 3.4 Mbp bandindicates two and possibly three chromosomes are co-migrating. The smallest band visible in Figure 2 is lessthan 1 Mbp and is most likely mitochondrial DNA.
Thus, there is a minimum of nine and as many as ele-ven chromosomes present in isolate 0-1. This gave anestimated genome size of between 35.5 and 42.3 Mbp.Isolate 15A shows conspicuous differences in the lengthsof the chromosomes for intermediate sized bands(greater than 3 Mbp and less than 6 Mbp), and appearsto have two bands around 3 Mbp.Cytological karyotyping of isolate 0-1 using the germ
tube burst method (GTBM) is depicted in Figure 3.Most of the discharged nuclei (above 90%) wereobserved at interphase (Figure 3a) where the chromo-somes exist in the form of chromatin and are enclosedby the nuclear membrane. Of the remaining 10%, mostof the chromosomes were either in early metaphase orclumped and entangled together, making it difficult todistinguish chromosomes (Figure 3b). In a few nuclei,condensed metaphase chromosomes were spread outsufficiently and we were able to count at least ninechromosomes (highlighted in Figure 3c). The four lar-gest chromosomes are longer than or equal to 2 μm.The remainder depicted are smaller, but likely to belonger than 1 μm. The four largest chromosomes likelycorrespond to the four bands shown in PFG electro-phoresis that have sizes greater than 3.9 Mbp.
Gene contentThe genome assembly as a whole contains many pre-dicted genes that have been implicated in pathogenicity.Genes encoding efflux pumps have roles in multidrugand fungicide resistance and toxic compound exclusion.For example, the ABC1 transporter in Magnaporthe gri-sea protects the fungus against azole fungicides and the
Figure 2 CHEF (clamped homogenous electric fields)separations of P. teres f. teres chromosomes. (a) Electro-karyotypes of isolate 0-1 with nine chromosomal bands indicated.(b) Chromosome level polymorphisms between isolates 0-1 and15A.
Figure 3 Visualization of P. teres f. teres chromosomes usingthe germ tube burst method (GTBM). (a) Nuclei at interphase. (b)Nuclei at early metaphase. (c) Condensed metaphase chromosomeswith nine larger chromosomes indicated. Scale bars = 2 μm.
Ellwood et al. Genome Biology 2010, 11:R109http://genomebiology.com/2010/11/11/R109
Page 4 of 14
rice phytoalexin sakuranetin [19]. These genes are espe-cially prevalent, with 79 homologues including represen-tatives of the ATP-binding cassette (ABC), majorfacilitator, and multi antimicrobial extrusion proteinsuperfamilies. Proteins encoded by other notable genefamily members are the highly divergent cytochromeP450 s [20], which are involved in mono-oxidation reac-tions, one member of which has been shown to detoxifythe antimicrobial pea compound pisatin [21]; the sidero-phores, which contribute to iron sequestration and resis-tance to oxidative and abiotic stresses but which alsohave essential roles in protection against antimicrobialsand formation of infection structures [22,23]; and thetetraspanins, which are required for pathogenicity inseveral plant pathogenic fungi, one of which is homolo-gous to the newly uncovered Tsp3 family [24].
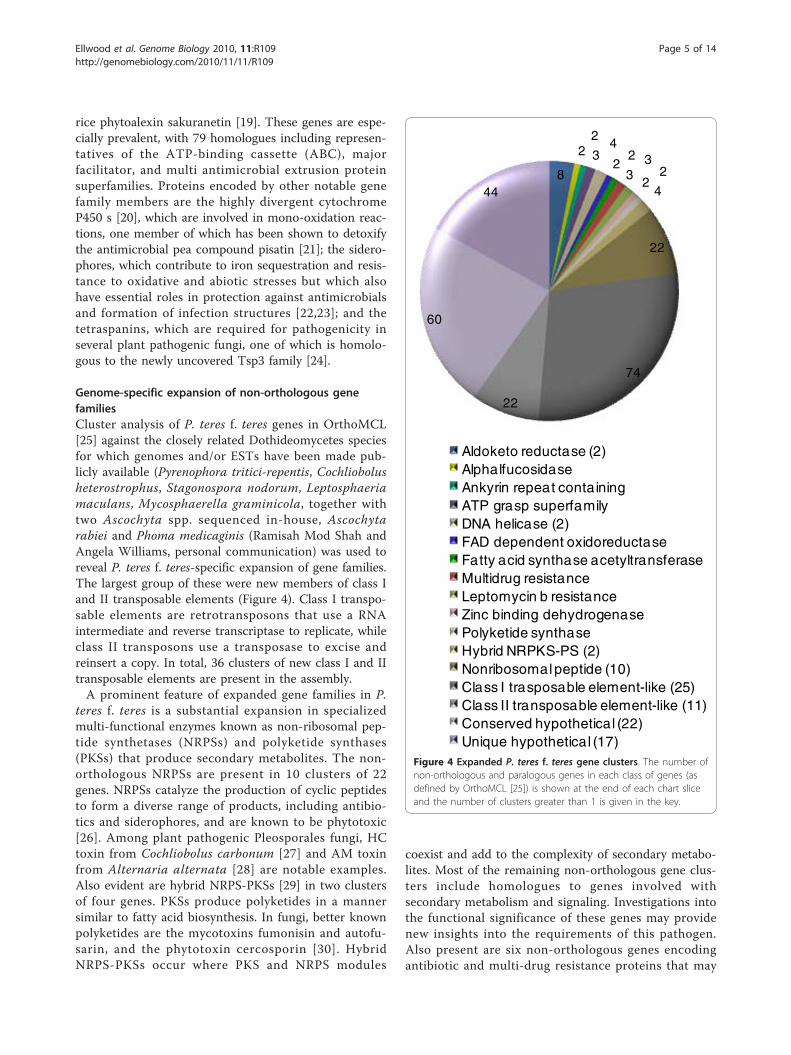
Genome-specific expansion of non-orthologous genefamiliesCluster analysis of P. teres f. teres genes in OrthoMCL[25] against the closely related Dothideomycetes speciesfor which genomes and/or ESTs have been made pub-licly available (Pyrenophora tritici-repentis, Cochliobolusheterostrophus, Stagonospora nodorum, Leptosphaeriamaculans, Mycosphaerella graminicola, together withtwo Ascochyta spp. sequenced in-house, Ascochytarabiei and Phoma medicaginis (Ramisah Mod Shah andAngela Williams, personal communication) was used toreveal P. teres f. teres-specific expansion of gene families.The largest group of these were new members of class Iand II transposable elements (Figure 4). Class I transpo-sable elements are retrotransposons that use a RNAintermediate and reverse transcriptase to replicate, whileclass II transposons use a transposase to excise andreinsert a copy. In total, 36 clusters of new class I and IItransposable elements are present in the assembly.A prominent feature of expanded gene families in P.
teres f. teres is a substantial expansion in specializedmulti-functional enzymes known as non-ribosomal pep-tide synthetases (NRPSs) and polyketide synthases(PKSs) that produce secondary metabolites. The non-orthologous NRPSs are present in 10 clusters of 22genes. NRPSs catalyze the production of cyclic peptidesto form a diverse range of products, including antibio-tics and siderophores, and are known to be phytotoxic[26]. Among plant pathogenic Pleosporales fungi, HCtoxin from Cochliobolus carbonum [27] and AM toxinfrom Alternaria alternata [28] are notable examples.Also evident are hybrid NRPS-PKSs [29] in two clustersof four genes. PKSs produce polyketides in a mannersimilar to fatty acid biosynthesis. In fungi, better knownpolyketides are the mycotoxins fumonisin and autofu-sarin, and the phytotoxin cercosporin [30]. HybridNRPS-PKSs occur where PKS and NRPS modules
coexist and add to the complexity of secondary metabo-lites. Most of the remaining non-orthologous gene clus-ters include homologues to genes involved withsecondary metabolism and signaling. Investigations intothe functional significance of these genes may providenew insights into the requirements of this pathogen.Also present are six non-orthologous genes encodingantibiotic and multi-drug resistance proteins that may
Figure 4 Expanded P. teres f. teres gene clusters. The number ofnon-orthologous and paralogous genes in each class of genes (asdefined by OrthoMCL [25]) is shown at the end of each chart sliceand the number of clusters greater than 1 is given in the key.
Ellwood et al. Genome Biology 2010, 11:R109http://genomebiology.com/2010/11/11/R109
Page 5 of 14
have a role against toxic plant compounds. Indeed, theP. teres f. teres assembly as a whole contains ten geneswith homology to ABC drug transporters.
Secreted proteinsComparisons between plant pathogenic ascomycetes S.nodorum and M. grisea with the saprophyte Neurosporacrassa [31,32] have both shown the expansion ofsecreted gene families consistent with their roles asplant pathogens. P. teres f. teres contains a large numberof genes (1,031) predicted to be secreted by both WolfP-SORT [33] and SignalP [34]. A significant proportion ofthese genes in P. teres f. teres (85%) are homologouswith P. tritici repentis, as might be expected given theirclose phylogenetic relationship. This contrasts with 54%of the predicted genes in S. nodorum for which no phy-logenetically close relative was sequenced [32]. Of theremaining genes, a small number (1.6%) show strongesthomology to species outside the Pleosporales, while 6%are unique to P. teres f. teres isolate 0-1 with no func-tional annotation. These genes may include genes thathave been laterally transferred.In Blast2GO [35,36], 61.6% of the predicted genes
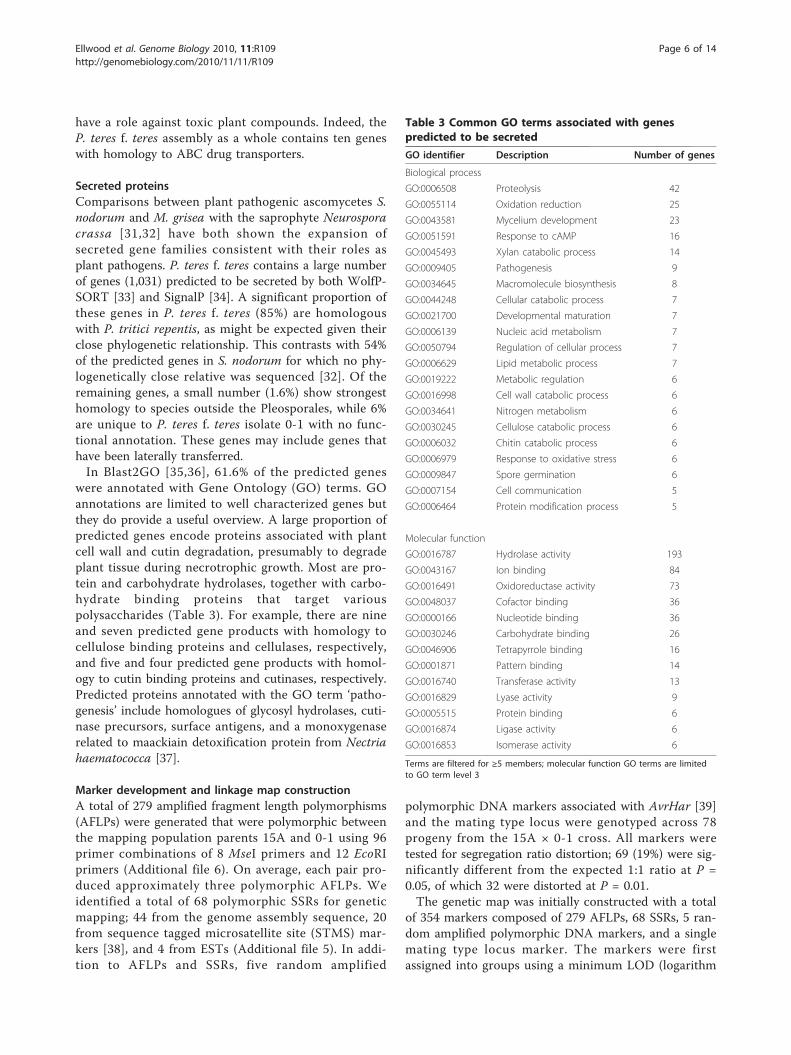
were annotated with Gene Ontology (GO) terms. GOannotations are limited to well characterized genes butthey do provide a useful overview. A large proportion ofpredicted genes encode proteins associated with plantcell wall and cutin degradation, presumably to degradeplant tissue during necrotrophic growth. Most are pro-tein and carbohydrate hydrolases, together with carbo-hydrate binding proteins that target variouspolysaccharides (Table 3). For example, there are nineand seven predicted gene products with homology tocellulose binding proteins and cellulases, respectively,and five and four predicted gene products with homol-ogy to cutin binding proteins and cutinases, respectively.Predicted proteins annotated with the GO term ‘patho-genesis’ include homologues of glycosyl hydrolases, cuti-nase precursors, surface antigens, and a monoxygenaserelated to maackiain detoxification protein from Nectriahaematococca [37].
Marker development and linkage map constructionA total of 279 amplified fragment length polymorphisms(AFLPs) were generated that were polymorphic betweenthe mapping population parents 15A and 0-1 using 96primer combinations of 8 MseI primers and 12 EcoRIprimers (Additional file 6). On average, each pair pro-duced approximately three polymorphic AFLPs. Weidentified a total of 68 polymorphic SSRs for geneticmapping; 44 from the genome assembly sequence, 20from sequence tagged microsatellite site (STMS) mar-kers [38], and 4 from ESTs (Additional file 5). In addi-tion to AFLPs and SSRs, five random amplified
polymorphic DNA markers associated with AvrHar [39]and the mating type locus were genotyped across 78progeny from the 15A × 0-1 cross. All markers weretested for segregation ratio distortion; 69 (19%) were sig-nificantly different from the expected 1:1 ratio at P =0.05, of which 32 were distorted at P = 0.01.The genetic map was initially constructed with a total
of 354 markers composed of 279 AFLPs, 68 SSRs, 5 ran-dom amplified polymorphic DNA markers, and a singlemating type locus marker. The markers were firstassigned into groups using a minimum LOD (logarithm
Table 3 Common GO terms associated with genespredicted to be secreted
GO identifier Description Number of genes
Biological process
GO:0006508 Proteolysis 42
GO:0055114 Oxidation reduction 25
GO:0043581 Mycelium development 23
GO:0051591 Response to cAMP 16
GO:0045493 Xylan catabolic process 14
GO:0009405 Pathogenesis 9
GO:0034645 Macromolecule biosynthesis 8
GO:0044248 Cellular catabolic process 7
GO:0021700 Developmental maturation 7
GO:0006139 Nucleic acid metabolism 7
GO:0050794 Regulation of cellular process 7
GO:0006629 Lipid metabolic process 7
GO:0019222 Metabolic regulation 6
GO:0016998 Cell wall catabolic process 6
GO:0034641 Nitrogen metabolism 6
GO:0030245 Cellulose catabolic process 6
GO:0006032 Chitin catabolic process 6
GO:0006979 Response to oxidative stress 6
GO:0009847 Spore germination 6
GO:0007154 Cell communication 5
GO:0006464 Protein modification process 5
Molecular function
GO:0016787 Hydrolase activity 193
GO:0043167 Ion binding 84
GO:0016491 Oxidoreductase activity 73
GO:0048037 Cofactor binding 36
GO:0000166 Nucleotide binding 36
GO:0030246 Carbohydrate binding 26
GO:0046906 Tetrapyrrole binding 16
GO:0001871 Pattern binding 14
GO:0016740 Transferase activity 13
GO:0016829 Lyase activity 9
GO:0005515 Protein binding 6
GO:0016874 Ligase activity 6
GO:0016853 Isomerase activity 6
Terms are filtered for ≥5 members; molecular function GO terms are limitedto GO term level 3
Ellwood et al. Genome Biology 2010, 11:R109http://genomebiology.com/2010/11/11/R109
Page 6 of 14
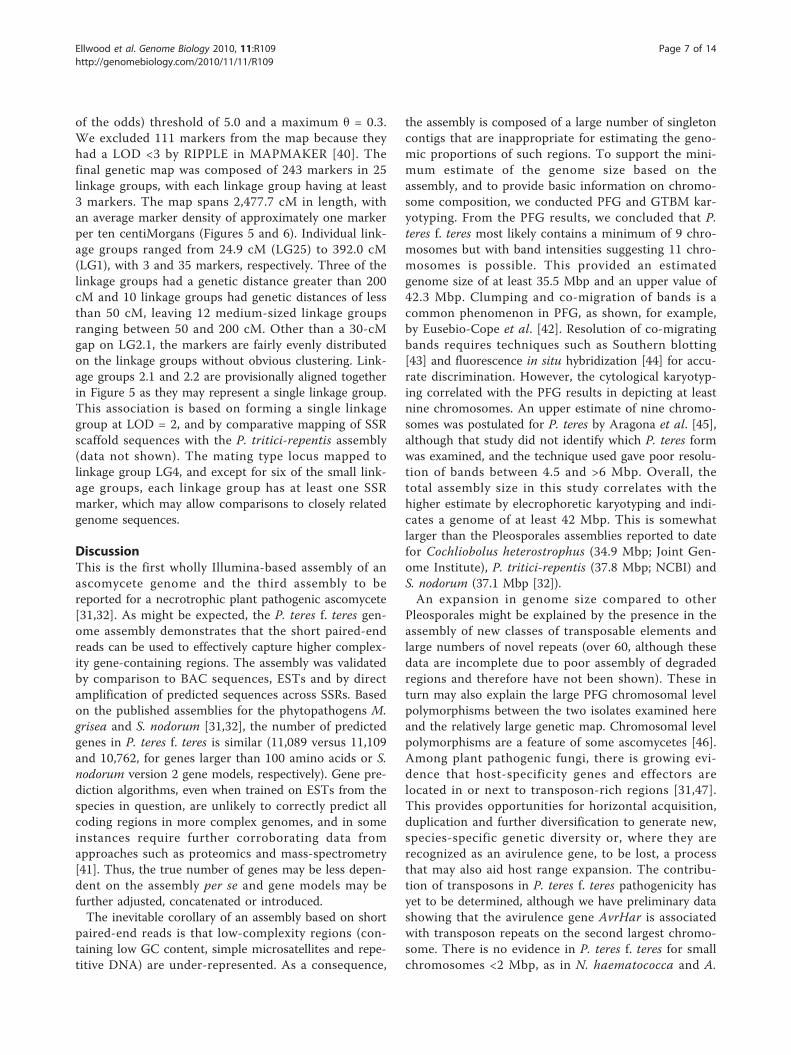
of the odds) threshold of 5.0 and a maximum θ = 0.3.We excluded 111 markers from the map because theyhad a LOD <3 by RIPPLE in MAPMAKER [40]. Thefinal genetic map was composed of 243 markers in 25linkage groups, with each linkage group having at least3 markers. The map spans 2,477.7 cM in length, withan average marker density of approximately one markerper ten centiMorgans (Figures 5 and 6). Individual link-age groups ranged from 24.9 cM (LG25) to 392.0 cM(LG1), with 3 and 35 markers, respectively. Three of thelinkage groups had a genetic distance greater than 200cM and 10 linkage groups had genetic distances of lessthan 50 cM, leaving 12 medium-sized linkage groupsranging between 50 and 200 cM. Other than a 30-cMgap on LG2.1, the markers are fairly evenly distributedon the linkage groups without obvious clustering. Link-age groups 2.1 and 2.2 are provisionally aligned togetherin Figure 5 as they may represent a single linkage group.This association is based on forming a single linkagegroup at LOD = 2, and by comparative mapping of SSRscaffold sequences with the P. tritici-repentis assembly(data not shown). The mating type locus mapped tolinkage group LG4, and except for six of the small link-age groups, each linkage group has at least one SSRmarker, which may allow comparisons to closely relatedgenome sequences.
DiscussionThis is the first wholly Illumina-based assembly of anascomycete genome and the third assembly to bereported for a necrotrophic plant pathogenic ascomycete[31,32]. As might be expected, the P. teres f. teres gen-ome assembly demonstrates that the short paired-endreads can be used to effectively capture higher complex-ity gene-containing regions. The assembly was validatedby comparison to BAC sequences, ESTs and by directamplification of predicted sequences across SSRs. Basedon the published assemblies for the phytopathogens M.grisea and S. nodorum [31,32], the number of predictedgenes in P. teres f. teres is similar (11,089 versus 11,109and 10,762, for genes larger than 100 amino acids or S.nodorum version 2 gene models, respectively). Gene pre-diction algorithms, even when trained on ESTs from thespecies in question, are unlikely to correctly predict allcoding regions in more complex genomes, and in someinstances require further corroborating data fromapproaches such as proteomics and mass-spectrometry[41]. Thus, the true number of genes may be less depen-dent on the assembly per se and gene models may befurther adjusted, concatenated or introduced.The inevitable corollary of an assembly based on short
paired-end reads is that low-complexity regions (con-taining low GC content, simple microsatellites and repe-titive DNA) are under-represented. As a consequence,
the assembly is composed of a large number of singletoncontigs that are inappropriate for estimating the geno-mic proportions of such regions. To support the mini-mum estimate of the genome size based on theassembly, and to provide basic information on chromo-some composition, we conducted PFG and GTBM kar-yotyping. From the PFG results, we concluded that P.teres f. teres most likely contains a minimum of 9 chro-mosomes but with band intensities suggesting 11 chro-mosomes is possible. This provided an estimatedgenome size of at least 35.5 Mbp and an upper value of42.3 Mbp. Clumping and co-migration of bands is acommon phenomenon in PFG, as shown, for example,by Eusebio-Cope et al. [42]. Resolution of co-migratingbands requires techniques such as Southern blotting[43] and fluorescence in situ hybridization [44] for accu-rate discrimination. However, the cytological karyotyp-ing correlated with the PFG results in depicting at leastnine chromosomes. An upper estimate of nine chromo-somes was postulated for P. teres by Aragona et al. [45],although that study did not identify which P. teres formwas examined, and the technique used gave poor resolu-tion of bands between 4.5 and >6 Mbp. Overall, thetotal assembly size in this study correlates with thehigher estimate by elecrophoretic karyotyping and indi-cates a genome of at least 42 Mbp. This is somewhatlarger than the Pleosporales assemblies reported to datefor Cochliobolus heterostrophus (34.9 Mbp; Joint Gen-ome Institute), P. tritici-repentis (37.8 Mbp; NCBI) andS. nodorum (37.1 Mbp [32]).An expansion in genome size compared to other
Pleosporales might be explained by the presence in theassembly of new classes of transposable elements andlarge numbers of novel repeats (over 60, although thesedata are incomplete due to poor assembly of degradedregions and therefore have not been shown). These inturn may also explain the large PFG chromosomal levelpolymorphisms between the two isolates examined hereand the relatively large genetic map. Chromosomal levelpolymorphisms are a feature of some ascomycetes [46].Among plant pathogenic fungi, there is growing evi-dence that host-specificity genes and effectors arelocated in or next to transposon-rich regions [31,47].This provides opportunities for horizontal acquisition,duplication and further diversification to generate new,species-specific genetic diversity or, where they arerecognized as an avirulence gene, to be lost, a processthat may also aid host range expansion. The contribu-tion of transposons in P. teres f. teres pathogenicity hasyet to be determined, although we have preliminary datashowing that the avirulence gene AvrHar is associatedwith transposon repeats on the second largest chromo-some. There is no evidence in P. teres f. teres for smallchromosomes <2 Mbp, as in N. haematococca and A.
Ellwood et al. Genome Biology 2010, 11:R109http://genomebiology.com/2010/11/11/R109
Page 7 of 14
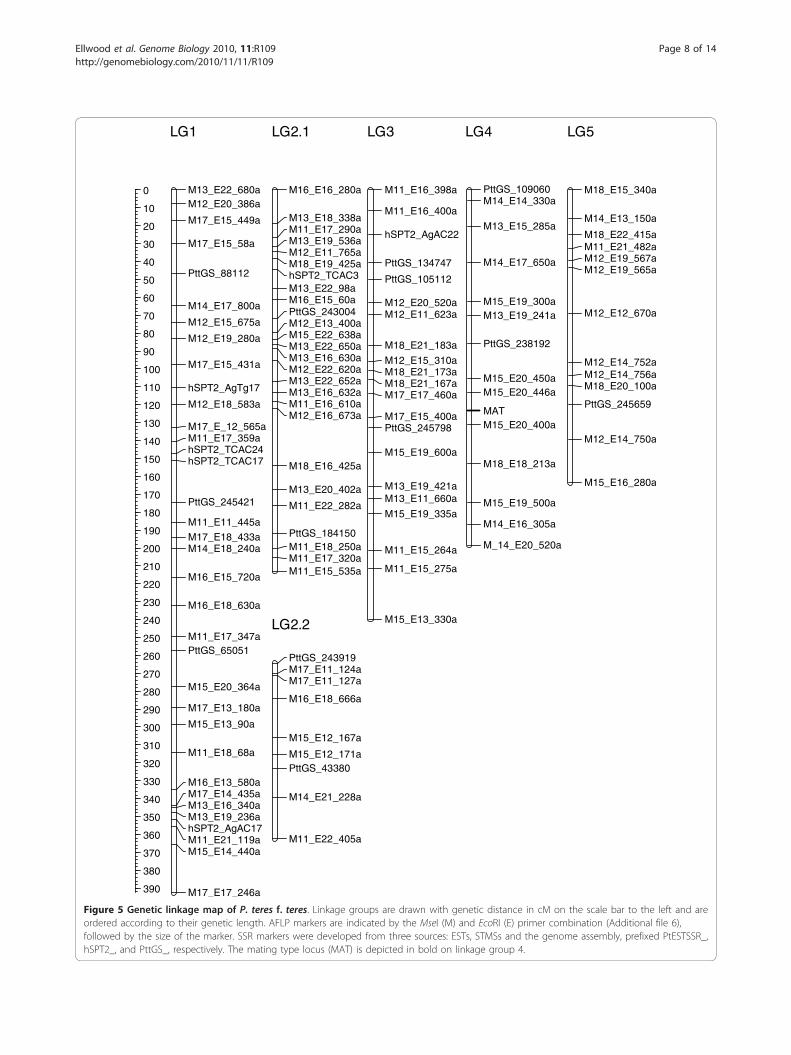
Figure 5 Genetic linkage map of P. teres f. teres. Linkage groups are drawn with genetic distance in cM on the scale bar to the left and areordered according to their genetic length. AFLP markers are indicated by the MseI (M) and EcoRI (E) primer combination (Additional file 6),followed by the size of the marker. SSR markers were developed from three sources: ESTs, STMSs and the genome assembly, prefixed PtESTSSR_,hSPT2_, and PttGS_, respectively. The mating type locus (MAT) is depicted in bold on linkage group 4.
Ellwood et al. Genome Biology 2010, 11:R109http://genomebiology.com/2010/11/11/R109
Page 8 of 14
alternate, where they confer host-specific virulence[48,49], and in Fusarium oxysporum, where they havebeen demonstrated to be mobile genetic elements con-ferring virulence to non-pathogenic strains [50].The analysis of the gene content of the genome
assembly shows that it shares many of the characteris-tics of similar plant pathogenic fungi, and strong homol-ogy to most genes from P. tritici-repentis. These includehighly diverse proteins involved in host contact, signaltransduction, secondary metabolite production andpathogenesis. Secreted proteins are of particular interestto plant pathologists since they represent the key inter-face of host-pathogen interactions, notably avirulenceproteins and effectors. These are key components ofinducing disease resistance and promoting disease, whileexpressed effector proteins offer tangible discriminatingresistance assay tools in a variety of breeding programs.This is because fungal necrotrophic disease is the sumof the contribution of individual effectors [51,52] andsingle, purified effectors give a qualitative responsewhen infiltrated into leaves. However, effector genes
often encode small, cysteine-rich proteins with little orno orthology to known genes. Examples include Avr2and Avr4 in Cladosporium fulvum, Avr3 in F. oxysporum(reviewed in [53]), ToxA and ToxB in P. tritici repentis[54,55] and SnToxA and SnTox3 in S. nodorum [56,57].Identifying candidate effectors in the genome assemblyin conjunction with genetic mapping, functional studiesand proteomic approaches will in future aid theirisolation.We provide the first genetic linkage map of P. teres f.
teres. The total length is nearly 2,500 cM, longer thanthat reported for other ascomycete fungal pathogens;1,216 cM for M. graminicola [58], 1,329 cM for Cochlio-bus sativus [59], and 900 cM for M. grisea [60]. How-ever, a genetic map of 359 loci for the powdery mildewfungus Blumeria graminis f. sp. hordei, an obligate bio-trophic pathogen of barley, covered 2,114 cM [61]. Thelength of the genetic map of P. teres f. teres may be afunction of the relatively large genome size and the pre-sence of large numbers of recombinogenic repetitive ele-ments. This is paralleled by a greater number of linkage
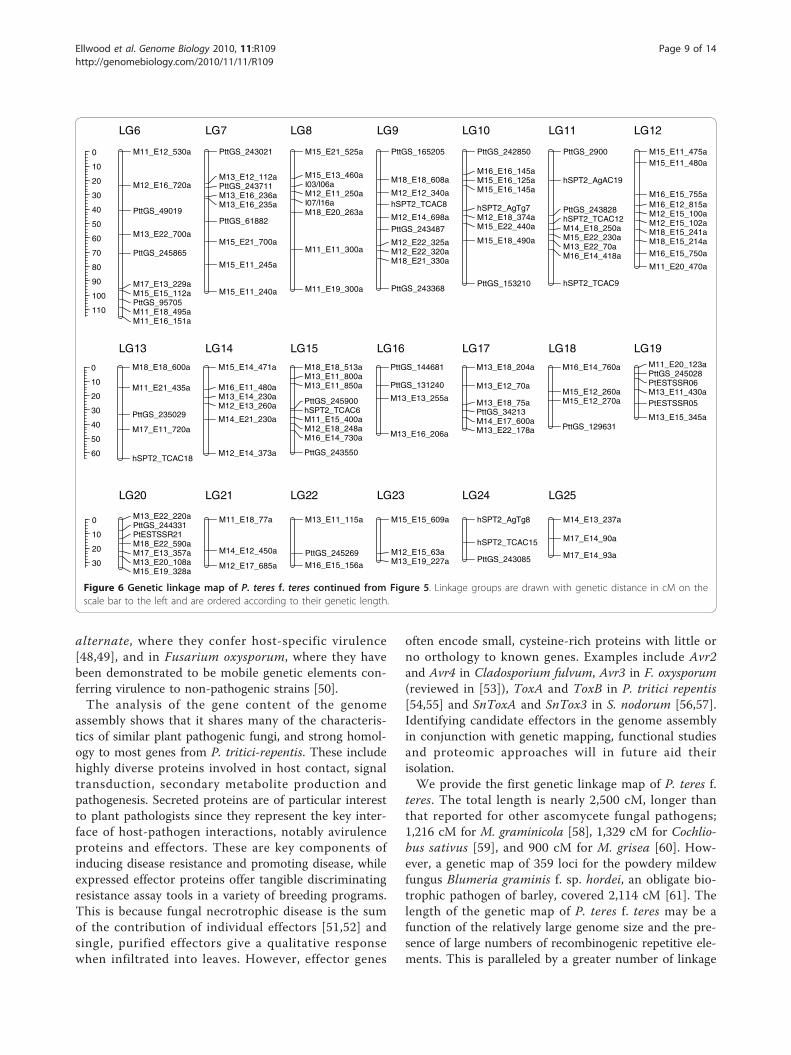
Figure 6 Genetic linkage map of P. teres f. teres continued from Figure 5. Linkage groups are drawn with genetic distance in cM on thescale bar to the left and are ordered according to their genetic length.
Ellwood et al. Genome Biology 2010, 11:R109http://genomebiology.com/2010/11/11/R109
Page 9 of 14
groups (25) compared to the estimated number of chro-mosomes that may also be suggestive of interspersedtracts of repetitive DNA.The genetic map and karyotyping data will be instru-
mental in a final assembly of the P. teres f. teres genome,as they will allow scaffolds to be orientated and tiledonto linkage groups. A combination of the genomeassembly and the genetic map provides an invaluableresource to identify potential effector candidate genesfrom phytotoxic protein fractions in conjunction withmass spectrometry peptide analysis. Genetically charac-terized SSRs provided in this study will also provide animportant resource for the community in comparativemapping, gene-flow and genetic diversity studies.Further validation, assembly of low-complexity sequenceregions, and genome annotation are now underwayusing proteomic approaches and 454 pyrosequencing.The priority now is to fully understand the mechanismof pathogenicity in P. teres f. teres in order to achieve asolution to control this pathogen.
ConclusionsThis study demonstrates that the successful assembly ofmore complex and gene-rich regions of a filamentousfungus is possible using paired-end Solexa sequencing.The approach provides a cost-effective means of directlygenerating marker resources that would previously havebeen prohibitively expensive with modest research fund-ing. At 42 Mbp or more, the genome of P. teres f. teres0-1 is larger by comparison to closely related Pleospor-ales members, and has a correspondingly large geneticmap. The genome is dynamic, in that different isolatesshow obvious chromosomal level differences, while frac-tionated linkage groups and the length of the geneticmap also suggest an abundance of repetitive DNA. Incommon with other plant pathogens, P. teres f. terescontains a rich diversity of predicted genes, notably pro-tein and carbohydrate hydrolases, efflux pumps, cyto-chrome P450 genes, siderophores, tetraspanins, non-ribosomal peptide synthetases and polyketide synthases,and a complex secretome that can be attributed to itslifestyle. Non-ribosomal peptide synthetases and effluxpumps in particular appear to have undergone a P. teresf. teres-specific expansion of non-othologous genefamilies. The assembly presented provides researcherswith an excellent resource to further examine net blotchpathogenicity and plant-microbe interactions in general.
Materials and methodsOrigin of P. teres isolatesThe NFNB isolate sequenced in this study, 0-1, was ori-ginally collected in Ontario, Canada [39]. Isolate 15A(10-15-19), the opposite parental isolate used to developa mapping population, was collected from Solano
County, California [62]. The remaining NFNB isolates(Cad 1-3, Cor 2, Cun 1-1, Cun 3-2, NB100, OBR, Stir 9-2, and Won 1-1) were collected in Western Australia byS Ellwood in the 2009 barley growing season. SFNB iso-lates WAC10721, WAC10981, WAC11177, andWAC11185 were obtained from the Department ofAgriculture and Food, Western Australia (3, Baron HayCourt, South Perth, Western Australia 6151); isolatesCad 6-4, Mur 2, NFR, and SG1-1 were collected inWestern Australia by S Ellwood during 2009.
Electrophoretic and cytological karyotypingProtoplasting and pulsed-field gel electrophoresisChromosome size and number were analyzed for NorthAmerican NFNB isolates; 0-1 and 15A, previously usedto develop a genetic cross for identifying avirulencegenes [39,63]. Fungal protoplasts were prepared using aprotocol established for S. nodorum as described by Liuet al. [56] with some modifications. Briefly, conidia wereharvested from 7-day fungal cultures and inoculatedinto 60 ml liquid Fries medium in 250 ml Erlenmeyerflasks. After growth at 27°C in a shaker (100 rpm) for48 h, the fungal tissue was then homogenized in a War-ing blender and re-inoculated into 200 ml liquid Friesmedium in 500 ml Erlenmeyer flasks. The fungus wasgrown under the same growth conditions for 24 h.Mycelium was harvested by filtering through two layersof Miracloth, washed thoroughly with water and finallywith mycelial wash solution (MWS: 0.7 M KCl and 10mM CaCl2). Around 2 g (wet weight) of mycelial tissuewas then transferred into a Petri dish (100 × 20 mm)containing 40 ml filter-sterilized protoplasting solutioncontaining 40 mg/ml b-d-glucanase, 0.8 mg/ml chiti-nase, and 5 mg/ml driselase (Interspex Product Inc., SanMateo, CA, USA) in MWS. The Petri dish was shakenat 70 rpm at 28°C for at least 5 h. Protoplasts were fil-tered through four layers of Miracloth and pelleted bycentrifugation at 2,000 × g for 5 minutes at room tem-perature, followed by another wash with MWS and pel-leting. Protoplasts were resuspended in MWS to a finalconcentration of 2 × 10⁸ protoplasts/ml and mixed withan equal volume of 2% low melting temperature agarose(Bio-Rad Laboratories, Hercules, CA, USA) dissolved inMWS. Agarose plugs were made by pipetting 80 μl ofthe mixture into plug molds (Bio-Rad Laboratories).Once solidified, plugs were placed in 20 ml Proteinase Kreaction buffer containing 100 mM EDTA (pH 8.0), 1%N-lauroyl sarcosine, 0.2% sodium deoxycholate and 1mg/ml Proteinase K (USBiological, Swampscott, MA,USA) at 50°C for 24 h. Plugs were washed four times in10 mM Tris pH 8.0 and 50 mM EDTA for 1 h withgentle agitation, then stored in 0.5 M EDTA (pH 8.0) at4°C. PFG was performed on a Bio-Rad CHEF Mappersystem. Separation of chromosomes in the 1 to 6 Mb
Ellwood et al. Genome Biology 2010, 11:R109http://genomebiology.com/2010/11/11/R109
Page 10 of 14
range was carried out in 1.0× TAE at 14°C using 0.8%Low EEO agarose gel (USBiological). Run time was 72 hat 2 V/cm (70 V) with a 20- to 40-minute switch timeramp at an angle of 106°.Spore germination and germ tube burst cytologicalkaryotypingConidia were washed with water from 7-day culturesgrown on V8 potato dextrose agar (V8PDA) plates, fil-tered through two layers of miracloth and centrifuged at3,000 × g for 5 minutes. Conidia were washed twicewith potato dextrose broth and re-suspended in thiswith a final concentration of 4 × 10⁵ spores/ml.Approximately 400 μl of spore suspension was placedonto slides coated with poly-L-lysine (Sigma-AldrichCorp., St Louis, MO, USA) and covered by a 22 × 40mm piece of parafilm to keep moist. All slides werekept in a sealed plastic box at room temperature for 3h, and then moved to the fridge for cold treatment over-night. Slides were dipped in H2O to carefully removethe covers and then placed in a methanol/acetic acid(22:3) solution overnight to fix fungal tissue. The slideswere flame dried to burst cells and release chromo-somes. Slides were stained for 5 minutes in the darkwith 1 μg/ml 4’,6-diamidino-2-phenylindole (DAPI;Sigma-Aldrich) and 1 μg/ml Flourescent Brightener 28(Sigma-Aldrich) in anti-fade mounting solution. Slideswere examined and photographed using a Zeiss Axio-plan 2 epiflourescent microscope.
Genome sequence acquisitionWhole shotgun genome sequencingDNA of P. teres f. teres isolate 0-1 was extracted using aBiosprint DNA Plant Kit and a BioSprint 15 automatedworkstation (Qiagen, Hilden, Germany). Genomicsequencing was performed on a Solexa sequencing plat-form at the Allan Wilson Centre (Massey University,Palmerston North, New Zealand). DNA preparation,cluster formation, primer hybridization and DNA ampli-fication reactions were according to the manufacturer’srecommended protocol [64]. DNA sequencing was per-formed using 75-bp paired-end reads of randomlysheared 200-bp fragments in a single flow cell. Datawere pre-filtered in Illumina’s Pipeline v.1.4 and IPARv.1.3. Reads failing a ‘chastity’ filter of 0.6 were dis-carded. The steps described below for genome scaffoldassembly, annotation and analysis were performed onthe iVEC advanced computing facilities [65].Paired-end scaffold assembliesSingle (split pairs) and paired-end reads were assembledusing ABySS v.1.0.14 [17]. In addition to the read filter-ing described above, ABySS removes reads containingambiguous characters (Ns). The optimal sequence kmer(overlap) length was determined by incrementallyadjusting the kmer length by 4 bp and graphing the
number of contigs against L50 for a given kmer length.The optimal kmer length occurred where N50 was mini-mal and L50 was largest as visualized by R [66]. N50 is aweighted median statistic such that 50% of the entireassembly is contained in the number of contigs or scaf-folds equal to or greater than this value, while L50 is thelength of the scaffold that separates the half of theassembled genome from the remainder of smaller scaf-folds, if the sequences are ordered by size.Annotation and analysisProtein coding sequences were identified with GeneMark-ES v.2 [67]. GeneMark uses a self-training algorithm opti-mized for features of fungal gene organization by incor-porating an enhanced intron submodel to accommodatesequences with and without branch point sites. GeneMarkcompares favorably with the accuracy of gene finders thatemploy supervised training based on cDNA sequences.Annotation of predicted proteins was conducted with
the following tools. A mirror of the NCBI database atiVEC, together with publicly available fungal proteinsequence files not present at NCBI, was interrogated byBLASTP [18]. Blast2GO v.2.4.2 [35,36], which incorpo-rates GO, KEGG maps, InterPro and Enzyme Codes wasused with default parameters for functional annotation.De novo annotation of PFAM domains was performedusing HMMER v.2.3.2 [68]. HMMER searches forhomologues of protein sequences and implements meth-ods using probabilistic models called ‘profile hiddenMarkov models’. To detect orthologous genes, we usedOrthoMCL [25] by BLAST to the NCBI non-redundantdatabase with an e-value cutoff of ≤10-5. OrthoMCL is agenome-scale algorithm for grouping protein sequencesbetween species based on BLAST similarity that wasused to identify species-specific expanded gene families.Subcellular localization of proteins and secretion signalswere identified with Wolf PSort [33] and SignalP v.3.0[34] using default parameters and selection of theappropriate organism type.
Genome assembly validationAssembly comparison with Sanger-sequenced BACsTo validate the assembly over a larger scale, BLASTN[18] was used to compare the assembly against twoNFNB 0-1 BACs, designated 8F17 and 1H13, sequencedand assembled by The Genome Center (WashingtonUniversity, St Louis, MO, USA). The data were visua-lized with CIRCOS [69]. To establish if all regions ofthe BACs were covered by Solexa sequencing, raw readswere mapped to the BACs with the Burrows-WheelerAligner [70] and visualized using R and the ggplot2package [66,71].SSR primer design and PCR amplificationShort tandem repeats or SSRs (also known as microsa-tellites) were identified by scanning the genome
Ellwood et al. Genome Biology 2010, 11:R109http://genomebiology.com/2010/11/11/R109
Page 11 of 14
assembly with Tandem Repeat Finder v.4 [72] for a mini-mum of ten tandem repeats from 2 to 7 bp. Primers weredesigned using Primer3 [73] using parameters designed tominimize secondary structures, with a GC content >40%,and an optimum melting temperature of 58 to 60°C, foramplicons in a size range of 150 to 400 bp. The primerswere assayed using single-spored P. teres isolates collectedfrom different sites in Western Australia. DNA extractionand PCR amplification using the Multiplex Ready Techni-que were performed as described previously [74,75]. Allelesizing was performed using GeneMapper v.3.7 (AppliedBiosystems, Foster City, CA, USA).EST library preparation, sequencing, and assemblycomparisonTotal RNA was extracted from isolate 0-1 using fungalmycelium tissue grown in liquid Fries medium for 4days. The RNA was extracted with TRIZOL (Invitrogen,Carlsbad, CA, USA) following the manufacturer’sinstructions. EST library construction and sequencingwas conducted by The Genome Center. To investigatethe presence of ESTs in the assembly and the efficiencyof GeneMark predictions, unique EST sequences wereBLASTN searched against the assembly. BLASTN hitswere then compared against the location of GeneMarkpredicted coding regions with BEDtools [76].
Marker development and genetic linkage mapconstructionLai et al. [63] used a subset of AFLPs to identify markersassociated with fungal avirulence on the barley lines ‘Har-bin’ and ‘Prato’ on two linkage groups. That study used asegregating population of 78 progeny from a crossbetween NFNB isolates 15A and 0-1. The AFLP markerswere generated based on the technique of Vos et al. [77]and employed 96 primer combinations containing EcoRIand MseI restriction sites. In this study, all available AFLPsfrom the 96 primer combinations were used to develop acomprehensive genetic map (Additional file 6). In addition,we incorporated polymorphic STMSs developed frommicrosatellite libraries by Keiper et al. [38], together withSSRs from EST sequences and the genome assemblyherein. SSR PCR amplification and population genotypingwere performed as described previously [38,78,79]. Inaddition, the mating type locus was assayed using primersPt5 and Pt7 that amplify the P. teres HMG box [80].Linkage map construction was performed with MAP-
MAKER v.2.0 for Macintosh as described by Liu et al.[78]. A minimum LOD value of 5.0 and a maximum θ =0.3 were used to establish the linkage groups. For eachlinkage group, the most plausible order of markers wasdetermined using commands ‘FIRST ORDER’ and ‘RIP-PLE’, and markers with low confidence (LOD <3.0 forRIPPLE) were excluded from the map. All markers weretested for fitness of a 1:1 segregation ratio using Qgene
[81]. The genetic map was drawn with the software pro-gram MapChart v.2.1 [82].
Additional material
Additional file 1: P. teres f. teres isolate 0-1 scaffold assemblynucleotide sequences.
Additional file 2: P. teres f. teres isolate 0-1 predicted coding regionnucleotide sequences.
Additional file 3: P. teres f. teres isolate 0-1 predicted coding regiontranslated amino acid sequences.
Additional file 4: Solexa read coverage of BACs 1H13 and 8F17.
Additional file 5: Characteristics of 75 genome assembly-derivedSSRs and those polymorphic SSRs used in the P. teres f. teres 01 ×15A genetic map construction.
Additional file 6: AFLP di-nucleotide selective primer extensionsand their codes.
AbbreviationsABC, ATP-binding cassette; AFLP, amplified fragment length polymorphism;BAC, bacterial artificial chromosome; bp, base pair; DDBJ, DNA Data Bank ofJapan; EST, expressed sequence tag; GO, Gene Ontology; GTBM, germ tubeburst method; LOD, logarithm of the odds; MWS, mycelial wash solution;NCBI, National Center for Biotechnology Information; NFNB, net form of netblotch; NRPS, non-ribosomal peptide synthetase; PFG, pulsed-field gelelectrophoresis; PKS, polyketide synthase; SFNB, spot form of net blotch; SSR,simple sequence repeat; STMS, sequence-tagged microsatellite site.
AcknowledgementsThe authors would like to thank Dr Steven Xu and Dr CC Jan for theirassistance in chromosomal microscopy. This research was funded by theGrains Research and Development Corporation under project UMU00025.
Author details1Department of Environment and Agriculture, Curtin University, Kent Street,Bentley, Perth, Western Australia 6102, Australia. 2Department of PlantPathology, North Dakota State University, Fargo, North Dakota 58105, USA.3CSIRO Plant Industry, Centre for Environment and Life Sciences, Private Bag5, Wembley, Western Australia 6913, Australia. 4South Australian Researchand Development Institute, Waite Institute, Adelaide, South Australia 5064,Australia. 5Division of Health Sciences, Murdoch University, Murdoch Drive,Perth, Western Australia 6150, Australia. 6USDA-ARS Cereal Crops ResearchUnit, Northern Crop Science Laboratory, 1307 18th Street North, Fargo, NorthDakota 58105, USA.
Authors’ contributionsSRE analyzed the data, wrote the manuscript, and performed initiallaboratory SSR genetic marker validation. RAS provided informatics expertisein software implementation, scripting and primary data analysis (includingfor genome assembly, gene prediction, annotation of predicted peptides,and homology searches). JKH provided scripts to facilitate SSR design anddata elucidation. CSM assisted with comparisons of predicted Pyrenophoraproteins. ZL screened for polymorphic SSR markers on genetic mappingpopulation parents and conducted genotyping, genetic map construction,and electrophoretic karyotyping. FK contributed STMS markers. ZL undertookthe AFLP genotyping and the cytological karyotyping. RPO and TLFcontributed to the design of the project and provided assistance infinalizing the manuscript prior to publication.
Received: 25 June 2010 Revised: 21 October 2010Accepted: 10 November 2010 Published: 10 November 2010
References1. Mathre DE: Compendium of Barley Diseases. 2 edition. St Paul MN, American
Phytopathological Society; 1997.
Ellwood et al. Genome Biology 2010, 11:R109http://genomebiology.com/2010/11/11/R109
Page 12 of 14
2. Murray GM, Brennan JP: Estimating disease losses to the Australian barleyindustry. Aust Plant Pathol 2010, 39:85-96.
3. Smedegård-Petersen V: Pyrenophora teres f. maculata f. nov. andPyrenophora teres f. teres on barley in Denmark. Kgl Vet Landbohojsk Arsskr1971, 124-144.
4. Rau D, Attene G, Brown A, Nanni L, Maier F, Balmas V, Saba E, Schäfer W,Papa R: Phylogeny and evolution of mating-type genes fromPyrenophora teres, the causal agent of barley ‘net blotch’ disease. CurrGenet 2007, 51:377-392.
5. Campbell GF, Lucas JA, Crous PW: Evidence of recombination betweennet- and spot-type populations of Pyrenophora teres as determined byRAPD analysis. Mycol Res 2002, 106:602-608.
6. Leisova L, Kucera L, Minarikova V, Ovesna J: AFLP-based PCR markers thatdifferentiate spot and net forms of Pyrenophora teres. Plant Pathol 2005,54:66-73.
7. McLean MS, Howlett BJ, Hollaway GJ: Spot form of net blotch, caused byPyrenophora teres f. maculata, is the most prevalent foliar disease ofbarley in Victoria, Australia. Aust Plant Pathol 2010, 39:46-49.
8. Tekauz A: Characterisation and distribution of pathogenic variation inPyrenophora teres f. teres and P. teres f. maculata from western Canada.Can J Plant Pathol 1990, 12:141-148.
9. Sarpeleh A, Tate ME, Wallwork H, Catcheside D, Able AJ: Characterisationof low molecular weight phytotoxins isolated from Pyrenophora teres.Physiol Mol Plant Pathol 2009, 73:154-162.
10. Sarpeleh A, Wallwork H, Catcheside DE, Tate ME, Able AJ: Proteinaceousmetabolites from Pyrenophora teres contribute to symptomdevelopment of barley net blotch. Phytopathology 2007, 97:907-915.
11. Sarpeleh A, Wallwork H, Tate ME, Catcheside DE, Able AJ: Initialcharacterisation of phytotoxic proteins isolated from Pyrenophora teres.Physiol Mol Plant Pathol 2008, 72:73-79.
12. Flor HH: Current status of the gene-for-gene concept. Annu RevPhytopathol 1971, 9:275-296.
13. McLean MS, Howlett BJ, Hollaway GJ: Epidemiology and control of spotform of net blotch (Pyrenophora teres f. maculata) of barley: a review.Crop Pasture Sci 2009, 60:303-315.
14. Liu Z, Ellwood SR, Oliver RP, Friesen TL: Pyrenophora teres: profile of anincreasingly damaging barley pathogen. Mol Plant Pathol 2010.
15. Properties of Eukaryotic Genome Sequencing Projects. [http://www.ncbi.nlm.nih.gov/genomes/leuks.cgi].
16. Nowrousian M, Stajich JE, Chu M, Engh I, Espagne E, Halliday K,Kamerewerd J, Kempken F, Knab B, Kuo H-C, Osiewacz HD, Poggeler S,Read ND, Seiler S, Smith KM, Zickler D, Kuck U, Freitag M: De novoassembly of a 40 Mb eukaryotic genome from short sequence reads:Sordaria macrospora, a model organism for fungal morphogenesis. PLoSGenet 2010, 6:e1000891.
17. Simpson JT, Wong K, Jackman SD, Schein JE, Jones SJM, Birol A: ABySS: Aparallel assembler for short read sequence data. Genome Res 2009,19:1117-1123.
18. Altschul S, Madden T, Schaffer A, Zhang J, Zhang Z, Miller W, Lipman D:Gapped BLAST and PSI-BLAST: a new generation of protein databasesearch programs. Nucleic Acids Res 1997, 25:3389-3402.
19. Del Sorbo G, Schoonbeek H-j, De Waard MA: Fungal transporters involvedin efflux of natural toxic compounds and fungicides. Fungal Genet Biol2000, 30:1-15.
20. Deng J, Carbone I, Dean R: The evolutionary history of Cytochrome P450genes in four filamentous Ascomycetes. BMC Evol Biol 2007, 7:30.
21. Maloney AP, VanEtten HD: A gene from the fungal plant pathogenNectria haematococca that encodes the phytoalexin-detoxifying enzymepisatin demethylase defines a new cytochrome P450 family. Mol GenGenet 1994, 243:506-514.
22. Idnurm A, Howlett BJ: Pathogenicity genes of phytopathogenic fungi. MolPlant Pathol 2001, 2:241-255.
23. Hof C, Eisfeld K, Welzel K, Antelo L, Foster AJ, Anke H: Ferricrocin synthesisin Magnaporthe grisea and its role in pathogenicity in rice. Mol PlantPathol 2007, 8:163-172.
24. Lambou K, Tharreau D, Kohler A, Sirven C, Marguerettaz M, Barbisan C,Sexton A, Kellner E, Martin F, Howlett B, Orbach M, Lebrun M-H: Fungihave three tetraspanin families with distinct functions. BMC Genomics2008, 9:63.
25. Chen F, Mackey AJ, Stoeckert CJ Jr, Roos DS: OrthoMCL-DB: querying acomprehensive multi-species collection of ortholog groups. Nucleic AcidsRes 2006, 34:D363-368.
26. Walton JD: Host-selective toxins: agents of compatibility. Plant Cell 1996,8:1723-1733.
27. Walton JD: HC-toxin. Phytochemistry 2006, 67:1406-1413.28. Johnson RD, Johnson L, Itoh Y, Kodama M, Otani H, Kohmoto K: Cloning
and characterization of a cyclic peptide synthetase gene from Alternariaalternata apple pathotype whose product is involved in AM-toxinsynthesis and pathogenicity. Mol Plant Microbe Interact 2000, 13:742-753.
29. Silakowski B, Kunze B, Müller R: Multiple hybrid polyketide synthase/non-ribosomal peptide synthetase gene clusters in the myxobacteriumStigmatella aurantiaca. Gene 2001, 275:233-240.
30. Daub ME, Ehrenshaft M: The photoactivated Cercospora toxin cercosporin:contributions to plant disease and fundamental biology. Annu RevPhytopathol 2000, 38:461-490.
31. Dean RA, Talbot NJ, Ebbole DJ, Farman ML, Mitchell TK, Orbach MJ,Thon M, Kulkarni R, Xu J-R, Pan H, Read ND, Lee Y-H, Carbone I, Brown D,Oh YY, Donofrio N, Jeong JS, Soanes DM, Djonovic S, Kolomiets E,Rehmeyer C, Li W, Harding M, Kim S, Lebrun M-H, Bohnert H, Coughlan S,Butler J, Calvo S, Ma L-J, et al: The genome sequence of the rice blastfungus Magnaporthe grisea. Nature 2005, 434:980-986.
32. Hane JK, Lowe RGT, Solomon PS, Tan K-C, Schoch CL, Spatafora JW,Crous PW, Kodira C, Birren BW, Galagan JE, Torriani SFF, McDonald BA,Oliver RP: Dothideomycete plant interactions illuminated by genomesequencing and EST analysis of the wheat pathogen Stagonosporanodorum. Plant Cell 2007, 19:3347-3368.
33. Horton P, Park K-J, Obayashi T, Nakai K: Protein subcellular localizationprediction with WoLF PSORT. In Proceedings of the 4th Annual Asia-PacificBioinformatics Conference APBC06: 13-16 Feb 2006; Taipei, Taiwan Edited by:Jiang T, Yang U-C, Chen Y-PP, Wong L 2006, 39-48.
34. Emanuelsson O, Brunak S, von Heijne G, Nielsen H: Locating proteins inthe cell using TargetP, SignalP and related tools. Nat Protoc 2007,2:953-971.
35. Conesa A, Gotz S, Garcia-Gomez JM, Terol J, Talon M, Robles M: Blast2GO: auniversal tool for annotation, visualization and analysis in functionalgenomics research. Bioinformatics 2005, 21:3674-3676.
36. Gotz S, Garcia-Gomez JM, Terol J, Williams TD, Nagaraj SH, Nueda MJ,Robles M, Talon M, Dopazo J, Conesa A: High-throughput functionalannotation and data mining with the Blast2GO suite. Nucleic Acids Res2008, 36:3420-3435.
37. Covert S, Enkerli J, Miao V, VanEtten H: A gene for maackiaindetoxification from a dispensable chromosome of Nectria haematococca.Mol Gen Genet 1996, 251:397-406.
38. Keiper FJ, Grcic M, Capio E, Wallwork H: Diagnostic microsatellite markersfor the barley net blotch pathogens, Pyrenophora teres f. maculata andPyrenophora teres f. teres. Aust Plant Pathol 2008, 37:428-430.
39. Weiland JJ, Steffenson BJ, Cartwright RD, Webster RK: Identification ofmolecular genetic markers in Pyrenophora teres f. teres associated withlow virulence on ‘Harbin’ barley. Phytopathology 1999, 89:176-181.
40. Lander ES, Green P, Abrahamson J, Barlow A, Daly MJ, Lincoln SE,Newburg L: MAPMAKER: An interactive computer package forconstructing primary genetic linkage maps of experimental and naturalpopulations. Genomics 1987, 1:174-181.
41. Bringans S, Hane J, Casey T, Tan K-C, Lipscombe R, Solomon P, Oliver R:Deep proteogenomics; high throughput gene validation bymultidimensional liquid chromatography and mass spectrometry ofproteins from the fungal wheat pathogen Stagonospora nodorum. BMCBioinformatics 2009, 10:301.
42. Eusebio-Cope A, Suzuki N, Sadeghi-Garmaroodi H, Taga M: Cytological andelectrophoretic karyotyping of the chestnut blight fungus Cryphonectriaparasitica. Fungal Genet Biol 2009, 46:342-351.
43. Talbot NJ, Salch YP, Ma M, Hamer JE: Karyotypic variation within clonallineages of the rice blast fungus, Magnaporthe grisea. Appl EnvironMicrobiol 1993, 59:585-593.
44. Taga M, Murata M, VanEtten HD: Visualization of a conditionallydispensable chromosome in the filamentous Ascomycete Nectriahaematococca by fluorescence in situ hybridization. Fungal Genet Biol1999, 26:169-177.
Ellwood et al. Genome Biology 2010, 11:R109http://genomebiology.com/2010/11/11/R109
Page 13 of 14
45. Aragona M, Montigiani M, Porta-Puglia A: Electrophoretic karyotypes ofthe phytopathogenic Pyrenophora graminea and P. teres. Mycol Res 2000,104:853-857.
46. Mehrabi R, Taga M, Kema GHJ: Electrophoretic and cytologicalkaryotyping of the foliar wheat pathogen Mycosphaerella graminicolareveals many chromosomes with a large size range. Mycologia 2007,99:868-876.
47. Friesen TL, Stukenbrock EH, Liu Z, Meinhardt S, Ling H, Faris JD,Rasmussen JB, Solomon PS, McDonald BA, Oliver RP: Emergence of a newdisease as a result of interspecific virulence gene transfer. Nat Genet2006, 38:953-956.
48. Miao V, Covert S, VanEtten H: A fungal gene for antibiotic resistance on adispensable ("B”) chromosome. Science 1991, 254:1773-1776.
49. Harimoto Y, Hatta R, Kodama M, Yamamoto M, Otani H, Tsuge T:Expression profiles of genes encoded by the supernumerarychromosome controlling AM-toxin biosynthesis and pathogenicity in theapple pathotype of Alternaria alternata. Mol Plant Microbe Interact 2007,20:1463-1476.
50. Ma L-J, van der Does HC, Borkovich KA, Coleman JJ, Daboussi M-J, DiPietro A, Dufresne M, Freitag M, Grabherr M, Henrissat B, Houterman PM,Kang S, Shim W-B, Woloshuk C, Xie X, Xu J-R, Antoniw J, Baker SE,Bluhm BH, Breakspear A, Brown DW, Butchko RAE, Chapman S, Coulson R,Coutinho PM, Danchin EGJ, Diener A, Gale LR, Gardiner DM, Goff S, et al:Comparative genomics reveals mobile pathogenicity chromosomes inFusarium. Nature 2010, 464:367-373.
51. Friesen TL, Meinhardt SW, Faris JD: The Stagonospora nodorum-wheatpathosystem involves multiple proteinaceous host-selective toxins andcorresponding host sensitivity genes that interact in an inverse gene-for-gene manner. Plant J 2007, 51:681-692.
52. Ciuffetti LM, Manning VA, Pandelova I, Betts MF, Martinez JP: Host-selectivetoxins, Ptr ToxA and Ptr ToxB, as necrotrophic effectors in thePyrenophora tritici-repentis-wheat interaction. New Phytologist 2010,187:911-919.
53. Stergiopoulos I, de Wit PJGM: Fungal effector proteins. Annu RevPhytopathol 2009, 47:233-263.
54. Tuori RP, Wolpert TJ, Ciuffetti LM: Purification and immunologicalcharacterization of toxic components from cultures of Pyrenophoratritici-repentis. Mol Plant Microbe Interact 1995, 8:41-48.
55. Martinez JP, Ottum SA, Ali S, Francl LJ, Ciuffetti LM: Characterization of theToxB Gene from Pyrenophora tritici-repentis. Mol Plant Microbe Interact2001, 14:675-677.
56. Liu Z, Faris JD, Oliver RP, Tan K-C, Solomon PS, McDonald MC,McDonald BA, Nunez A, Lu S, Rasmussen JB, Friesen TL: SnTox3 acts ineffector triggered susceptibility to induce disease on wheat carrying theSnn3 gene. PLoS Pathog 2009, 5:e1000581.
57. Friesen T, Chu CG, Liu Z, Xu S, Halley S, Faris J: Host-selective toxinsproduced by Stagonospora nodorum confer disease susceptibility inadult wheat plants under field conditions. Theor Appl Genet 2009,118:1489-1497.
58. Kema GHJ, Goodwin SB, Hamza S, Verstappen ECP, Cavaletto JR, Van derLee TAJ, de Weerdt M, Bonants PJM, Waalwijk C: A combined amplifiedfragment length polymorphism and randomly amplified polymorphismDNA genetic linkage map of Mycosphaerella graminicola, the Septoriatritici leaf blotch pathogen of wheat. Genetics 2002, 161:1497-1505.
59. Zhong S, Steffenson BJ, Martinez JP, Ciuffetti LM: A molecular genetic mapand electrophoretic karyotype of the plant pathogenic fungusCochliobolus sativus. Mol Plant Microbe Interact 2002, 15:481-492.
60. Nitta N, Farman ML, Leong SA: Genome organization of Magnaporthegrisea: integration of genetic maps, clustering of transposable elementsand identification of genome duplications and rearrangements. TheorAppl Genet 1997, 95:20-32.
61. Pedersen C, Rasmussen SW, Giese H: A genetic map of Blumeria graminisbased on functional genes, avirulence genes, and molecular markers.Fungal Genet Biol 2002, 35:235-246.
62. Steffenson BJ, Webster RK: Pathotype diversity of Pyrenophora teres f.teres on barley. Phytopathology 1992, 82:170-177.
63. Lai Z, Faris JD, Weiland JJ, Steffenson BJ, Friesen TL: Genetic mapping ofPyrenophora teres f. teres genes conferring avirulence on barley. FungalGenet Biol 2007, 44:323-329.
64. Bentley DR, Balasubramanian S, Swerdlow HP, Smith GP, Milton J,Brown CG, Hall KP, Evers DJ, Barnes CL: Accurate whole human genome
sequencing using reversible terminator chemistry. Nature 2008,456:53-59.
65. iVEC. [http://www.ivec.org/].66. R Development Core Team: R: a Language and Environment for Statistical
Computing Vienna: R Foundation for Statistical Computing; 2010.67. Ter-Hovhannisyan V, Lomsadze A, Chernoff YO, Borodovsky M: Gene
prediction in novel fungal genomes using an ab initio algorithm withunsupervised training. Genome Res 2008, 18:1979-1990.
68. Eddy S: HMMER User’s Guide. Biological Sequence Analysis Using Profile HiddenMarkov Models , 2.3.2 2003.
69. Krzywinski M, Schein J, Birol I, Connors J, Gascoyne R, Horsman D, Jones SJ,Marra MA: Circos: An information aesthetic for comparative genomics.Genome Res 2009, 19:1639-1645.
70. Li H, Durbin R: Fast and accurate short read alignment with Burrows-Wheeler transform. Bioinformatics 2009, 25:1754-1760.
71. Wickham H: ggplot2: Elegant Graphics for Data Analysis. 2 edition. New York:Springer; 2009.
72. Benson G: Tandem repeats finder: a program to analyze DNA sequences.Nucleic Acids Res 1999, 27:573-580.
73. Rozen S, Skaletsky H: Primer3 on the WWW for general users and forbiologist programmers. Methods Mol Biol 2000, 132:365-386.
74. Nourollahi K, Javannikkhah M, Naghavi MR, Lichtenzveig J, Okhovat SM,Oliver RP, Ellwood SR: Genetic diversity and population structure ofAscochyta rabiei from the western Iranian Ilam and Kermanshahprovinces using MAT and SSR markers. Mycol Prog 2010.
75. Hayden M, Nguyen T, Waterman A, Chalmers K: Multiplex-ready PCR: Anew method for multiplexed SSR and SNP genotyping. BMC Genomics2008, 9:80.
76. Quinlan AR, Hall IM: BEDTools: a flexible suite of utilities for comparinggenomic features. Bioinformatics 2010, 26:841-842.
77. Vos P, Hogers R, Bleeker M, Reijans M, Lee Tvd, Hornes M, Friters A, Pot J,Paleman J, Kuiper M, Zabeau M: AFLP: a new technique for DNAfingerprinting. Nucleic Acids Res 1995, 23:4407-4414.
78. Liu ZH, Anderson JA, Hu J, Friesen TL, Rasmussen JB, Faris JD: A wheatintervarietal genetic linkage map based on microsatellite and targetregion amplified polymorphism markers and its utility for detectingquantitative trait loci. Theor Appl Genet 2005, 111:782-794.
79. Zhong S, Leng Y, Friesen TL, Faris JD, Szabo LJ: Development andcharacterization of expressed sequence tag-derived microsatellitemarkers for the wheat stem rust fungus Puccinia graminis f. sp. tritici.Phytopathology 2009, 99:282-289.
80. Arie T, Christiansen SK, Yoder OC, Turgeon BG: Efficient cloning ofAscomycete mating type genes by PCR amplification of the conservedMATHMG box. Fungal Genet Biol 1997, 21:118-130.
81. Nelson JC: QGENE: software for marker-based genomic analysis andbreeding. Mol Breed 1997, 3:239-245.
82. Voorrips RE: MapChart: software for the graphical presentation of linkagemaps and QTLs. J Hered 2002, 93:77-78.
doi:10.1186/gb-2010-11-11-r109Cite this article as: Ellwood et al.: A first genome assembly of the barleyfungal pathogen Pyrenophora teres f. teres. Genome Biology 2010 11:R109.
Submit your next manuscript to BioMed Centraland take full advantage of:
• Convenient online submission
• Thorough peer review
• No space constraints or color figure charges
• Immediate publication on acceptance
• Inclusion in PubMed, CAS, Scopus and Google Scholar
• Research which is freely available for redistribution
Submit your manuscript at www.biomedcentral.com/submit
Ellwood et al. Genome Biology 2010, 11:R109http://genomebiology.com/2010/11/11/R109
Page 14 of 14