Embed Size (px)
Citation preview

Source of Acqt~ts~ilon NASA Goddtird Space Flight Center
A First Approach to Global Runoff Simulation using Satellite Rainfall Estimation
Yang Hong (2, I ) , Robert F. Adler ( I ) , Faisal Hossain (31, Scott Curtis (4), and George J. NaffWlan (1, 5)
'NASA Goddard Space Flight Center, Laboratory for Atmospheres, Greenbelt, MD 2077 1 2~oddard Earth Science Technology CenterIUniversity of Maryland Baltimore County, Baltimore, MD 21228
3~epartment of Civil and Environmental Engineering, Tennessee Technological University, Cookeville, TN 38505 4~epartment of Geography, East Carolina University, Greenville, NC 27858
'science Systems and Applications, Inc., Lanham, Maryland 20706
Popular Summary:
Many hydrological models have been introduced in the hydrological literature to predict runoff but few of these have become common planning or decision-mahng tools, either because the data requirements are substantial or because the modeling processes are too complicated for operatonal application. On the other hand, progress in regional or global rainfall-runoff simulation has been constrained by the difficulty of measuring spatiotemporal variability of the primary causative factor, i.e. rainfall fluxes, continuously over space and time. Building on progress in remote sensing technology, researchers have improved the accuracy, coverage, and resolution of rainfall estimates by combining imagery from infrared, passive microwave, and space-borne radar sensors.
Motivated by the recent increasing availability of global remote sensing data for estimating precipitation and describing land surface characteristics, this note reports a ballpark assessment of quasi-global runoff computed by incorporating satellite rainfall data and other remote sensang products in a relatively simple rainfall-runoff simulation approach: the Natural Resources Conservation Service (NRCS) runoff Curve Number (CN) method. Using an Antecedent Precipitation Index (APII) as a proxy of antecedent moisture conditions, this note estimates time-varying NRCS-CN values determined by the 5-day normalized API. Driven by multi-year (1998-2006) Tropical Rainfall Measuring Mission (TRMM) Multi-satellite Precipitation Analysis, quasi-global runoff was retrospectively simulated with the NRCS-CN method and compared to Global Runoff Data Centre data at global and catchment scales. Results demonstrated the potential for using this simple method when diagnosing runoff values from satellite rainfall for the globe and for medium to large river basins. This work was done with the simple NRCS-CN method as a first-cut approach to understanding the challenges that lie ahead in advancing the satellite-based inference of global runoff. We expect that the successes and limitations revealed in this study will lay the basis for applying more advanced methods to capture the dynamic variability of the global hydrologic process for global runoff monl to~ng in real time. The essential ingredient in this work is the use of global satellite-based rainfall estimation.
Key words: Rainfall-Runoff Modeling, Remote Sensing Precipitation, TRMM
Acknowledgement: This work is supported by NASA's Applied Science Program under Stephen Ambrose of NASA Headquarters.
Submittal to AGU Water Resources Researches (WRR)
Corresponding Author: Dr. Yang Hong Mailing: NASA Goddard Space Flight Center, Mail code 613.1, Greenbelt, MD 20771; Phone: 1-301-614-6232; Fax: 1-301-614-5492; Email: yanehong;@a,ones.,osfc.nasa.rov
https://ntrs.nasa.gov/search.jsp?R=20070035104 2018-11-23T04:09:15+00:00Z
1 A First Approach to Global Runoff Simulation using Satellite Rainfall Estimation
3 Yang on^*,^*, Robert F. ~ d l e r ' , Faisal Hossain3, Scott cuutis4, and George J. Hufliznn 1.5
'NASA Goddard Space Flight Center, Laboratory for Atmospheres, Greenbelt, MD 20771
2 Goddard Earth Science Technology CenterNniversity of Maryland Baltimore County, Baltimore. MR 21228
' ~ e ~ a r t m e n t of Civil and Environmental Engineering, Tennessee Technological University, Cookeville, TN 35505
4 Department of Geography, East Carolina University, Greenville, NC 27858
'science Systems and Applications, Inc., Lanham, Maryland 20706
Submittal to WRR as Technique Note
14 "Corresponding Author: Dr. Yang Hong
15 Mailing: NASA Goddard Space Flight Center, Mail code 613.1, Greenbelt, MD 20771;
16 Phone: 1-30 1-6 14-6232; Fax: 1-30 1-6 14-5492; Email: vanehong($agncs.gsfc.nasa. sov

Abstract
Motivated by the recent increasing availability of global remote sensing data for estimating
precipitation and describing land surface characteristics, this note reports a ballpark assessment of
quasi-global runoff computed by incorporating satellite rainfall data and other remote sensing products
in a relatively simple rainfall-runoff simulation approach: the Natural Resources Conservation Service
(NRCS) runoff Curve Number (CN) method. Using an Antecedent Precipitation Index (API) as a
proxy of antecedent moisture conditions, this note estimates time-varying NRCS-CN values
determined by the 5-day normalized API. Driven by multi-year (1998-2006) Tropical Rainfall
Measuring Mission (TRMM) Multi-satellite Precipitation Analysis, quasi-global runoff was
retrospectively simulated with the NRCS-CN method and compared to Global Runoff Data Centre data
at global and catchment scales. Results demonstrated the potential for using this simple method when
diagnosing runoff values from satellite rainfall for the globe and for medium to large river basins. This
work was done with the simple NRCS-CN method as a first-cut approach to understanding tbc
challenges that lie ahead in advancing the satellite-based inference of global runoff. We expect that the
successes and limitations revealed in this study will lay the basis for applying more advanced mcthods
to capture the dynamic variability of the global hydrologic process for global runoff monitoring in real
time. The essential ingredient in this work is the use of global satellite-based rainfall estimation.
Key words: Rainfall-Runoff Modeling, Remote Sensing Precipitation, TRMM

1. Introduction
Many hydrological models have been introduced in the hydrological literature to predict mnoff
(Singh, 1995) but few of these have become common planning or decision-making tools (Choi et al.,
2002), either because the data requirements are substantial or because the modeling processes are too
complicated for operational application. On the other hand, progress in regional or global rainfall-
runoff simulation has been constrained by the difficulty of measuring spatiotemporal variability of the
primary causative factor, i.e. rainfall fluxes, continuously over space and time. Building on progress in
remote sensing technology, researchers have improved the accuracy, coverage, and resolution of
rainfall estimates by combining imagery from infrared, passive microwave, and space-borne radar
sensors (Adler et al., 2003). Today, remote sensing imagery acquired and processed in real time can
provide near-real-time rainfall at hydrologically relevant spatiotemporal scales (tens of ltilometcrs and
sub-daily; Hong et al., 2005; Huffman et al., 2007; Joyce et al., 2004; Sorooshian et al., 2000; Turk and
Miller 2005). Over much of the globe, remote sensing precipitation estimates is the only available
source of rainfall information, particularly in real time. Correspondingly, remote sensing has
increasingly become a viable data source to augment the conventional hydrological rainfall-mnofi'
simulation, especially for inaccessible regions or complex terrains, because remotely sensed imagcrics
are able to monitor precipitation and identify land surface characteristics such as topography, stream
network, land cover, vegetation etc. Artan et al. (2007) demonstrated the improved pcrfonnance of
remotely sensed precipitation data in hydrologic modeling when the hydrologic model was rc-
calibrated with satellite data rather than gauge rainfall over four subbasins of the Nile and Mekong
Rivers.
Motivated by the recent increasing availability of global remote sensing data for estimating
precipitation and describing land surface characteristics, this note attempts to obtain a ballpark
assessment of global runoff by incorporating satellite rainfall data and other remote sensing products
through a relative simple rainfall-runoff simulation approach: the United States Natural Resources
3
Conservation Service (NRCS) runoff Curve Number (CN) method (USDA, 1986; Burges et al., 1998).
Its simplicity is especially critical for the vast un-gauged regions and geopolitically trans-boundary
basins of the world. Our effort is a first approach to understanding a challenging problem that lies
ahead in advancing satellite-based global runoff monitoring. Thus, the use of NRCS-CN should not be
construed as a call for replacement of other more advanced methods for rainfall-runoff simulation. We
expect that the successes and limitations revealed in this study will lay the basis for applying more
advanced methods to capture the dynamic variability of the hydrologic process for global runoff
monitoring in real time. The essential ingredient in this work is the use of global satellite-based rainfall
estimation.
Although Ponce and Hawkins (1996) indicated that the NRCS-CN method is widely used in thc
USA and other countries, they also criticized it as a simplistic methodology to simulate the
sophisticatcd hydrological system. As an example, this method is imprecise for the monsoon type
climate in Ethiopia (Mohammed et al., 2004). Taylor et al. (2006) also show that the annual runoff in
the Volta river basin is a linear function of cumulative rainfall during the wet season when more than
approximately 700 mm of rain has fallen. In a literature review, Choi et al. (2002) concludccl that
NRCS-CN has useful skill because it responds to major runoff-generating properties including son1
type, landluseltreatment, and soil moisture conditions. They point out that it has been successfully
applied to situations that include simple runoff calculation (Heaney et al., 2001), assessment of long-
term hydrological impact on land use change (Harbor, 1994) for tens of years, stream-flow cstilnation
for watersheds with no stream flow records (Bhaduri et a]., 2000), and con~prehe~~sive
hydrologiclwater quality simulation (Srinivasan and Arnold, 1994; Engel, 1997; Burges et al., 1998;
Rietz and Hawkins, 2000). Recently, Curtis et al. (2007) used satellite remote sensing rainfall and
gauged runoff data to estimate CN for basins in eastern North Carolina. Harris and Hossain (2007)
found that simpler approaches such as the NRCS-CN method to be more robust than more colnpllcated
schemes for the levels of uncertainty that exist in current satellite rainfall data products. On thc other
4

hand, we note the risks of implementing this, or any other method without fully understanding its
associated 'uncertainty7. As such, we adopt the NRCS-CN method to estimate a first-cut global runoff
by taking advantage of the first 9 years of rainfall estimates from the Tropical Rainfall Neasming
Mission (TRMM) Multi-satellite Precipitation Analysis (TMPA; Huffman et al., 2007).
In this note we first develop spatially distributed and time-variant CN maps for the global land
surface. Driven by multi-year remote sensing rainfall, the NRCS-CN method is then used to coinpute
the surface runoff for each grid independently and subsequently route the surface runoff to the
watershed outlet through downstream cells (USACE, 2000). Finally, simulated quasi-global runoff is
evaluated with Global Runoff Data Center (GRDC) observed runoff (Fekete et al. 2000) and Water-
Balance-Model simulated runoff (Thornthwaite and Mather 1955; Steenhuis et al., 1986;-Vorosmal--.ty
et al. 1998).
2. Mapping NRCS-CN
2.1 Data
The data sets (i.e., precipitation, soil information, and land cover) required by the NRGS-CN
runoff generation scheme are all available globally with a well-established record in Earth system
analysis (Fekete et al., 2000). Information on soil properties is obtained from the Digital Soil of thc
World published in 2003 by Food and Agriculture Organization of the United Natioiis
(htt~://www.fao.or~/AG/a~l/a~ll/dsmw. htm). The Moderate Resolution Imaging Spectsoradiometer
(MODIS) land classification map is used as a surrogate for land uselcover, with 17 classes of land
cover according to the International Geosphere-Biosphere Programme classification (Fridel et al.,
2002). Routing information is taken from the HYDROlk (htt~:/llpdaac.~s~s.~ov/~to~~03Oi11~~d~),
which provides global coverage of topography such as elevation, slope, and flow direction etc. Thcsc
geo-referenced datasets are of value for users who need to run hydrologic models on both regional and
global scales. The rainfall data used in this study are from the NASA TMPA (Huffman ct al., 2007;
1 http://trmm.asfc.nasa.gov) and the runoff data are from GRDCIUniversity of New Hemisphere
2 (http://www.~~;rdc.sr.unh.edu/).
3
4 2.2 Mapping NR CS- CN
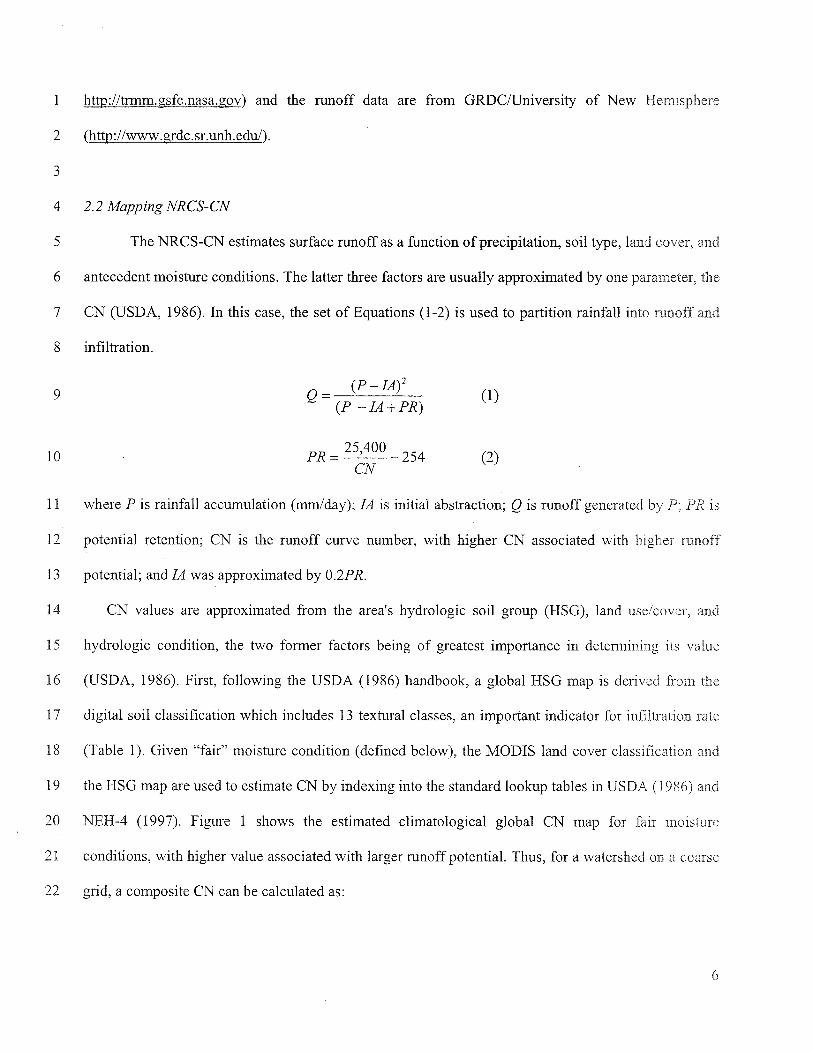
5 The NRCS-CN estimates surface runoff as a function of precipitation, soil type, land cover, and
6 antecedent moisture conditions. The latter three factors are usually approximated by one parameter, the
7 CN (USDA, 1986). In this case, the set of Equations (1-2) is used to partition rainfall into runoff and
8 infiltration.
where P is rainfall accumulation (mrn/day); IA is initial abstraction; Q is runoff generated by P; I'R is
potential retention; CN is the runoff curve number, with higher CN associated with hlgher reinoff
potential; and IA was approximated by 0.2PR.
CN values are approximated from the area's hydrologic soil group (HSG), land use/cover, and
hydrologic condition, the two former factors being of greatest importance in determining its value
(USDA, 1986). First, following the USDA (1986) handbook, a global HSG map is derived from the
digital soil classification which includes 13 textural classes, an important indicator for infiltration rate
(Table 1). Given "fair" moisture condition (defined below), the MODIS land cover classification and
the HSG map are used to estimate CN by indexing into the standard lookup tables in USDA (1986) and
NEH-4 (1997). Figure 1 shows the estimated climatological global CN map for fair moish~re
conditions, with higher value associated with larger runoff potential. Thus, for a watershed on a coarse
grid, a composite CN can be calculated as:

in which CN,,, is the composite CN used for runoff volume computations; i = the index of subgrids or
watershed subdivisions. Ai = the drainage area of area i. The composite CN values far several
watersheds are listed in Table 2.
3. Time-variant NRCS-CN and Runoff Simulation
3.1 Time-vauiant NR CS-CN
Note that the CN values displayed in Fig. 1 are for the "fair" hydrologic condition from standard
lookup tables, which are used primarily for design applications. However, for the same rainfall amoul-rt
there will be more runoff under wet conditions than under dry. In practice, lower and upper enveloping
curves can be computed to determine the range of CN according to the Antecedent Moisture
Conditions (AMC):
where upper subscripts indicates the AMC, I being dry, 11 normal (average), and 111 wet (Hawkins
1993). The change of AMC is closely related to antecedent precipitation (NEH-4, 1997). We apply the
concept of an Antecedent Precipitation Index (API) to provide guidance on how to esti~nate the
variation of CN values under dry or wet antecedent precipitation conditions. Kohler and Linsley (1 95 1 )
define API as:
API = C ek-' ( 6 )

1 where T is the number of antecedent days, k is the decay constant, and P is the precipitation during day
2 t. The model is also known as "retained rainfall" (Singh 1989). Decay constant k is the antilog of the
3 slope on a semi-log plot of soil moisture and time (Heggen, 2001). API practice suggests that k is
4 generally between 0.80 and 0.98 (Viessman and Lewis 1996). Here we use decay constant k as 0.85 for
5 demonstration purpose. API generally includes moisture conditions for the previous five days (or
6 pentad; NEH-4, 1997). In order to obtain time-variant CN, the site-specified API is first normalized as:
8 where T=5 for pentads, the numerator is API, and the denominator is a normalizing operator with two
9 components: average daily precipitation P and the Ck- ' series. The "dry" condition is defined as
I0 NAPI < 0.33, the "wet" condition is defined as NAPI>3, and the intermediate range 0.33- 3 rs the
11 "fair" hydrological condition. By definition, the surface moisture conditions are delineated as dry (or
12 wet) if any pentad API is less than one third (or larger than three times) of the climatologically
13 averaged pentad API, and fair conditions for all others. Summarizing, the CN can be converted to dry,
14 fair, or wet condition using Equations 4-7 according to the moisture conditions approximated by the
15 pentad NAPI.
16 Using the multi-year (1998-2006) satellite-based precipitation dataset from NASA TRMM, tlze 9-
17 year climatological pentad API is shown in Figure 2a. Thus, given any date, the pentad NAPI can be
18 determined and thus CN can be updated with Equations (4-7). For example, on Aug. 25"', 2005, the
19 pentad rainfall accumulation, pentad NAPI, resulting hydrological conditions (dry, fair, or wet), and
20 the updated CN on the same date are shown iru Figures 2b-e, respectively.

Using the concept of NAP1 and the NRCS-CN method (NEH-4, 1997), the TMM-simulated
runoff (TRILIM-CN) can be calculated and compared with three sets of GRDC annual climatological
runoff fields: observed (OBS), Water Balance Model (WBM)-simulated, and composite (CMP) from
the OBS and WBM (Fekete et al, 2000). The WBM used the water-balance model of Thofihwaite and
Mather (1 955) with a modified potential evaporation scheme from Vorosmarty et al. (1 998), driven by
input monthly air temperature and precipitation from Legates and Willmott (1990ab). Note that the
three GRDC runoff climatologies span the period 1950-1979 with incomplete data records, while the
TRMM-CN runoff is simulated for 9 years (1998-2006) of satellite rainfall with complete
spatiotemporal coverage. One assumption here is that the change of rainfall between the two time
periods is small enough so that the resulted runoff climatology is spatially consistent. Table 3 shows
that TRMM-CN runoff corresponds more closely with WBM, having a relatively high correlation and
12 low error. An intercomparison with the GRDC runoff observation demonstrates that the WRM laas a
13 moderate advantage over the TRMM-CN runoff: the correlation and root-mean-square-difference
(nnsd) between GRDC OBS and WBM are 0.81 and 159.7 mdyea r (or 0.437mm/day), respectively,
which is slightly better than for the TRMM-CN case (Table 3).
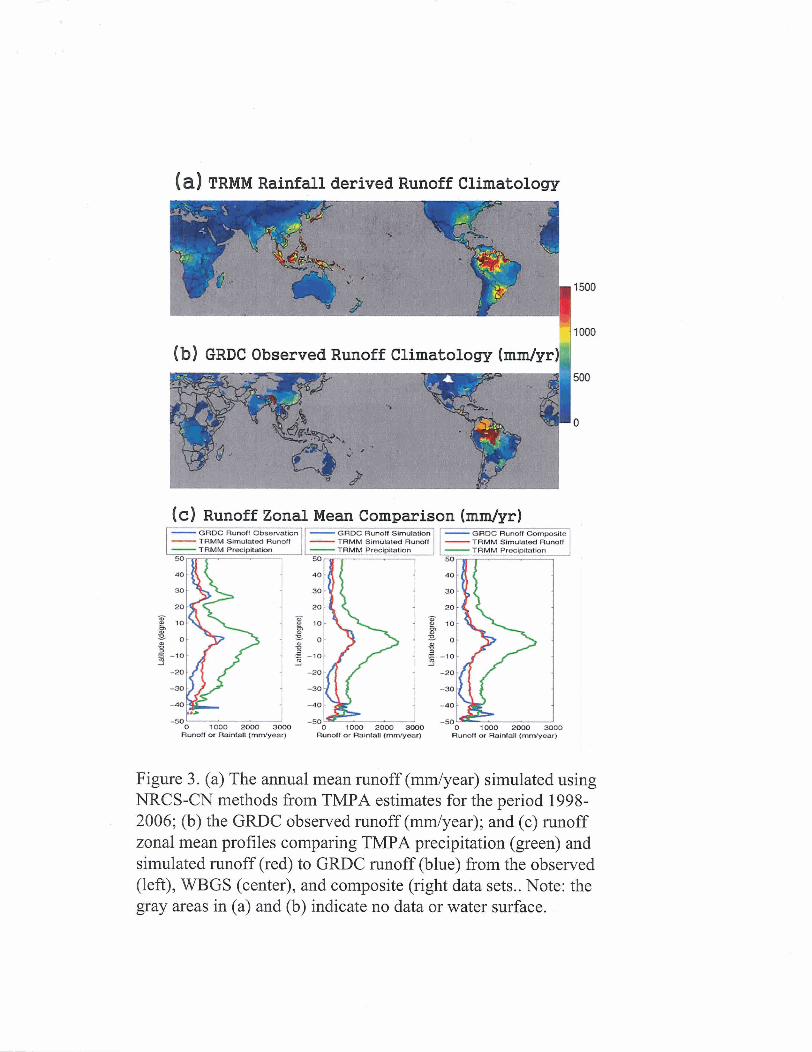
Figure 3a shows the annual mean runoff (mdyear) driven by TRMM daily precipitation for the
same 9-year period, in comparison with the GRDC observed runoff climatology (Fig. 3'0). Note that
the gray areas indicate no data or water surface in figures 3a-b. By averaging areas covered by both
TRMM-CN and GRDC runoff data, Figure 3c shows the TRMM-CN runoff zonal mean profile,
against the OBS, WBM, and CMP. In general, the TRMM-CN zonal mean runoff more closely follows
the three GRDC runoff profiles in the northern hemisphere than in the southern. We believe that this
difference is the result of having many more samples in the northern hemisphere, as well as more-
accurate GRDC data. Considering the TRMM-CN runoff difference as a function of basin area slaows
the TRMM-CN performance deviates more for basins smaller than 10,000 krn" with significantly
better agreement for larger basins (Figure 4).
9

4. Summary and Discussion
Given the increasing availability of global geospatial data describing land surface characteristics,
this note estimated a global CN map primarily based on soil property and land uselcover information
under the "fair" moisture condition. Then using API as a proxy of AMC, this note further estimated
time-variant CN values bounded by dry and wet AMC approximated by pentad nomalized API.
Finally, driven by satellite-based TMPA precipitation estimates, quasi-global runoff was simulated
with the NRCS-CN method and was compared with GRDC runoff measurements for climatology and
at the basin scale.
Although we were able to demonstrate the potential for using the NRCS-CN runoff model when
predicting ball-park runoff values from satellite rainfall for the globe and medium to large river basins,
there remain several unanswered questions: First, among many methods to estimate CN values,
Hawkins (1993) recognized that remote sensing data may not be adequate to define the "true" value sf
a CN. Thus, field surveys of basin characteristics should be conducted where feasible in order to obtain
"true" soil and land cover data. Second, while this study recognized the uncertainty of the estimates of
actual CN values and assumed that they likely fall within the enveloping wet (upper) and dry (lower)
conditions approximated by the 5-day Normalized API, it may be possible to adjust the CN Inore
precisely to account for local or regional information. Finally, one major unaddressed hydrological
concern for rainfall-runoff applications of remotely sensed precipitation is the thorough evaluation of
satellite-based rainfall estimation error and its nonlinear influence on rainfall-runoff enodeling
uncertainty in varying landscapes and climate regimes (Hong et al., 2006; Hossain and Anagnostou,
2006; Villarini and Krajewski, 2007). Thus, while we conclude that this simple approach seems to
provide a reliable tool when both the scale and estimation error of satellite data are large, we also urge
similar studies using more sophisticated hydrological models, particularly seeking to serve the vast LUI-
gauged regions and geopolitically trans-boundary basins of the world (Hossain et al., 2007).
10

1
2 Acknowledgement: This research is carried out with support from NASA's Applied Sciences progran~
3 under Stephen Ambrose of NASA Headquarters. The authors thank Tammo Steenhuis and the two
4 anonymous reviewers for constructive comments. The Editor-in-Chief Marc Parlange is also thanked
5 for his encouragement.

REFERENCE
Adler, R. F., G.J. Huffman, A. Chang, R. Ferraro, P. Xie,, J. Janowiak, B. Rudolf, U. Scbneider, S. Curtis, D. Bolvin, A. Gruber, J. Susskind, P. Arkin, and E. Nelkin, 2003, The version-2 Global Precipitation Climatology Project (GPCP) monthly precipitation analysis (1979-Present), J. Hydrometeor., 4, 1 147-1 167.
Artan, G, H. Gadain, J. Smith, K. Asante, C. Bandaragoda, and J. Verdin, 2007, Adequacy of Satellite
Derived Rainfall Data for Streamflow Modeling, Journal of Natural Hazards (Special Issue). (in
press).
Bhaduri, B., J. Harbor, B. Engel, and M. Grove, 2000, Assessing watershed-scale, long-term
hydrological impacts of land-use change using a GIs-NPS model, Environmental Management,
Burges, S. J., Wigmosta, M. S., and Meena, J. M., 1998, Hydrological Effects of Land-Use Change in
a Zero-Order Catchment, J. Hydraulic Engineeving, ASCE, 3(2), 86-97
Choi, J.Y., B.A. Engel, and H.W. Chung, 2002, Daily streamflow modeling and assessment based on
the curve-number technique, Hydr~ological Pvocesses, 16,: 13-3 150
Curtis, S., T.W. Crawford, and S.A. Lecce, 2007, A Comparison of TRMM to Other Basin-Scale
Estimates of Rainfall during the 1999 Hurricane Floyd Flood, Jouvnal of Natur-a2 Hazar-ds
(Special Issue). (in press).
Engel, B. A. 1997, GIs-based CN Runoff Estimation, Agricultural and Biological Ellgineering
Departmental Report, Purdue University
Fekete, B.M., C.J. Vorosmarty, and W. Grabs, 2000, Global Composite Runoff Data Set (~1.01,
Complex Systems Research Center, University of New Hampshire, Durham, New Hampshire,
U.S.A. Available online at [http://www.grdc.sr.ulih.edu/].
Friedl., M.A. , McIver, D.K. , Hodges, J.C.F., Zhang, X.Y., Muchoney, D., Strahler, A.H., Woodcock,
C.E., Gopal, S., Schneider, A., Cooper, A., Baccini, A., Gao, F., and Schaaf, C., 2002, Global
Land Cover Mapping from MODIS: Algorithms and Early Results, Remote Senxing qf
Environment 83(1-2):287-302.
12

Harbor, J.M., 1994, A practical method for estimating the impact of land-use change on surface nmoff,
groundwater recharge and wetland hydrology, J. of the American Planning Assoc. 6041): 95-1 08
Harris, A., and F. Hossain, 2007, Investigating the Optimal Configuration of Conceptual Hydrologic
Models for Satellite Rainfall-based Flood Prediction in the Upper Cumberland River, Jour-nal of
Hydrometeovology (In review).
Hawkins, R.H. 1993. Asymptotic determination of mnoff curve numbers from data, Journal of
Irrigation and Drainage Engineering, 119(2):334-345.
Heaney, J.P., D. Sample, L. Wright, 2001, Geophysical Information System, Decision Support System,
and Urban Stormwater Management, US Environmental Protection Agency: Edison MJ.
Heggen, R. J, 2001, Normalized Antecedent Precipitation Index, J. Hydrologic Engrg., 6(5), 377-351.
Hong, Y, K.L. Hsu, S. Sorooshian, and X. Gao, 2005, Self-organizing nonlinear output (SONO): A neural network
suitable for cloud patch-based rainfall estimation from satellite imagery at small scales, Water Resources
Research, 4 1, W03008, doi: 10.1029/2004WR003 142.
Hong, Y, K-L Hsu, H. Moradkhani, S. Sorooshian, 2006: Uncertainty quantification of satellite
precipitation estimation and Monte Carlo assessment of the error propagation into hydrologic
response, Water Resources Research., 42(8), W08421, 1 0.1029/2005WR004398
Hossain, F. and E.N. Anagnostou, 2006, A Two-Dimensional Satellite Rainfall Error hdodel, IEEE-
Trans. Geosci and Remote Sens., 44(6), pp. 15 1 1-1 522, doi: 10.1 109/TGRS.2005.863866
Hossain, F., N. Katiyar, Y. Hong, and A. Wolf, 2007, The Emerging role of Satellite Rainfall Data in
Improving the Hydro-political Situation of Flood Monitoring in the Under-developed Regions of
the World, Natuipal Hazards (Special Issue). (In press)
Huffman, G.J., R.F. Adler, D.T. Bolvin, G. Gu, E.J. Nelkin, K.P. Bowman,Y. Hong, E.F. Stocker, D.B.
Wolff, 2007, The TRMM Multi-satellite Precipitation Analysis: Quasi-Global, Multi-Year,
Combined-Sensor Precipitation Estimates at Fine Scale. J. of Hydrometeoroloa, $(I ), 38-55
1 Joyce, R.J., J.E. Janowiak, P.A. Arkin and P. Xie, 2004, CMORPH: A method that produces global
2 precipitation estimates from passive microwave and infrared data at high spatial and temporal
3 resolution. J. Hydrometeor., 5,487-503.
4 Kohler, M.A. and R.K. Linsley, 1951, Predicting runoff from storm rainfall, U.S. Weather Bureau,
Research Paper 34
Legates, D.R. and C.J. Willmott, 1990a, Mean seasonal and spatial variability in gauge-corrected,
global precipitation, Journal of Climatology, 10: 1 1 1-127
Legates, D.R. and C.J. Willmott, 1990b, Mean seasonal and spatial variability in global air te~nperahre,
Theoretical Applied Climatolo,ay, 41: 1 1-2 1
Mohammed, A., F. Yohannes, G. Zeleke, 2004, Validation of agricultural non-point source (AGNPS)
pollution model in Kori watershed, South Wollo, Ethiopia, International Journal of Applied Earth
Observation and Geoinformation, 6: 97- 109
NEH-4 (National Engineering Handbook Section 4 Hydrology Part 630), 1997, tJ.S. Departme111 of
Agriculture Natural Resources Conservation Service, Washington, D.C
Ponce, V. M. and R. H. Hawkins, 1996, Runoff curve number: Has it reached maturity? Jozrvnol of
Hyd~*ologic Engineering l(1): 1 1 - 1 9.
Rietz, P.D. and R.H. Hawkins, 2000, Effects of land use on runoff curve numbers, Watershed
Management 2000, Am. Soc. Civil Engineers (CD ROM).
Singh, A., 1989. Digital change detection techniques using remotely-sensed data: Int. J. Xcn~ote
Sensing, 10(6), 989-1003.
Singh, V.P., 1995, Computer models of watershed hydrology, Water Resources Publication: St. Joseph,
Michigan
Sorooshian, S., K-L. Hsu, X. Gao, H.V. Gupta, B. Imam, and D. Braithwaite, 2000, Evaluation of
PERSIANN System Satellite-Based Estimates of Tropical Rainfall, Bull. Amer. Met. Soc., 81,
2035-2046.
14
Srinivasan, R. and Arnold, J. G., 1994, Integration of a basin-scale water quality model wrth GXS.
Water Resources Bulletin, 30(3), 453-462.
Steenhuis, T.S. and W.H. Van der Molen, 1986, The Thornthwaite-Mather procedure as a srmple
engineering method to predict recharge. J. Hyduol. 84:22 1-229.
Taylor, J.C., N. van de Giesen, T.S. Steenhuis, 2006, West Africa: Volta discharge data quality
assessment and use, JOURNAL OF THE AMERICAN WATER RESOURCES ASSOCIATION
42 (4): 1113-1126
Thornthwaite, C.W. and J.R. Mather, 1955, The water balance, Publication in Climatology, 8: 1-1 04
Turk, F.J., and S.D. Miller, 2005: Toward improving estimates of remotely-sensed precipitation with
MODISIAMSR-E blended data techniques. IEEE Trans. Geosci. Rem.Sensing, 43, 1059- 1069
USACE (US Army Corps of Engineers), 2000, HEC-HMS Technical Reference Manual, Kydrolsgac
Engineering Center, Davic, CA; htt~:llw~vw.l~ec.usace.am~~.~niI/software/licc-l~~~~s~
USDA (United States Department of Agriculture Natural Resources Conservation Ser-vrcc), : 986,
Urban Hydrology for Small Watersheds, Technical Release 55, 2nd ed., NTIS PBS7-I 01580,
Springfield, Virginia, also available on the web in PDFfonmat at
ftp:l/ftp.wcc.scs.usda.~ov/downloads/h~drolo~ hvdraulicsltr55/tr55,pdf
Villarini, G. and W. F. Krajewski, 2007, Evaluation of the research version TMPA three-hourly 0.25" x
0.25" rainfall estimates over Oklahoma, Geophys. Res. Lett., 34, LO5402,
doi: 10.102912006GL029 147
Vorosmarty, C.J., C.A. Federer, and A.L. Schloss, 1998, Potential evaporation functions compared on
US watersheds: Possible implications for global-scale water balance and terrestrial ecosystem
modeling, Joul-nal of Hydrology, 207: 147-1 69
Viessman, W. and G. L. Lewis, 1996, Introduction to Hydrology, fourth edition, HarperColl~ns
College Publishers, NY.

Table 1 Hydrological Soil Group (HSG) derived from soil property
andy loam types of rates even when thoroughly wetted;
chiefly of deep, well to excessively
soils chiefly with moderately fine to
wetted and consist chiefly of solis wrtb
loam, sandy clay, silty infiltration rates when thoroughly wetted
and consist chiefly of clay soils
3
4
5
6
7
8

Table 2 The composite CN for several watersheds for "fair" hydrological conditions.
5 Global surface-averaged CN=72.803
6
7
8
9 Table 3 TRMM-CN runoff climatology in the latitude band 50"s-50°N) compared to GRDC observed
10 (OBS), Water Balance Model (WBM), and the later two composite runoff (CMP).
Statistics
Corr. Coef.
Bias ratio
Rmsd
GRDC Runoff Climatology
OBS
0.75089
1.2799
0.56mdday
WBM
0.79906
1.1174
0.48mdday
CMP
0.78944
1.1187
0.5 l m d d a y

Figure Captions
Figure 1. Global NRCS runoff Curve Number map derived from USDA Hydrological Soil Groups and
Land Cover Classification for fair hydrological conditions.
Figure 2. (a) Climatological pentad Antecedent Precipitation Index (API) averaged over 9 years (1998-
2006); (b) pentad antecedent rainfall accumulation (mm) ending on August 25,2005; (c) pentad
Normalized API (NAPI) on August 25, 2005; (d) hydrological condition, with -1, 0, 1, 2
corresponding to no data, dry, fair, wet conditions, determined by NAPI as of August 25, 2005;
and (e) the updated CN on August 25,. 2005.
Figure 3. (a) The annual mean runoff (mmlyear) simulated using NRCS-CN methods from TMPA
estimates for the period 1998-2006; (b) the GRDC observed runoff (mmlyear); and (c) miloff
zonal mean profiles comparing TMPA precipitation (green) and simulated runoff (red) to
GRDC runoff (blue) from the observed (left), WBGS (center)-, and composite (right data sets..
Note: the gray areas in (a) and (b) indicate no data or water surface.
Figure 4. TRMM-CN runoff difference distribution (a) and root-mean-square difference (b) as a
function of basin area.

Figure 1. Global NRCS runoff Curve Number map derived from USDA Hydrological Soil Groups and land coverluse classification for fair hydrological conditions.

20050825 5-day Normalized Antecedent Precipitation lndex
Updated CN on date 2 0 0 W 5 -m
Figure 2. (a) Climatological pentad Antecedent Precipitation lndex (API)) averaged over 9-year (1998-2006); (b) pentad antecedent rainfall accumulation (mm) ending on August 25, 2005; (c) pentad Normalized API (NAPI) on Aug 25, 2005; (d) hydrological condition, with -1, 0, 1,2 corresponding to no data, dry, fair, wet conditions, determined by NAP1 as of August 25,2005; and (e) the updated CN on date August 25, 2005.
(a 1 TRMM Rainfall derived Runnff Climatology
(b) GRDC Observed Runoff Climatology (mdyr)
( c ) Runoff Zonal Mean Comparison (mdyr)
0 1000 20w 3Wo 0 loo0 2000 3000 0 1000 2000 3000 Runon or Ralnfall (mmyear) Runofl or fiatntall (rnwear) Rumlf or Retnlall (mwyaar)
Figure 3. (a) The annual mean runoff (mm/year) simulated using NRCS-CN methods from TMPA estimates for the period 1998- 2006; (b) the GRDC observed runoff (&year); and (c) runoff zonal mean profiles comparing TMPA precipitation (green) and simulated runoff (red) to GRDC runoff (blue) from the observed (left), WBGS (center), and composite (right data sets.. Note: the gray areas in (a) and (b) indicate no data or water surface.
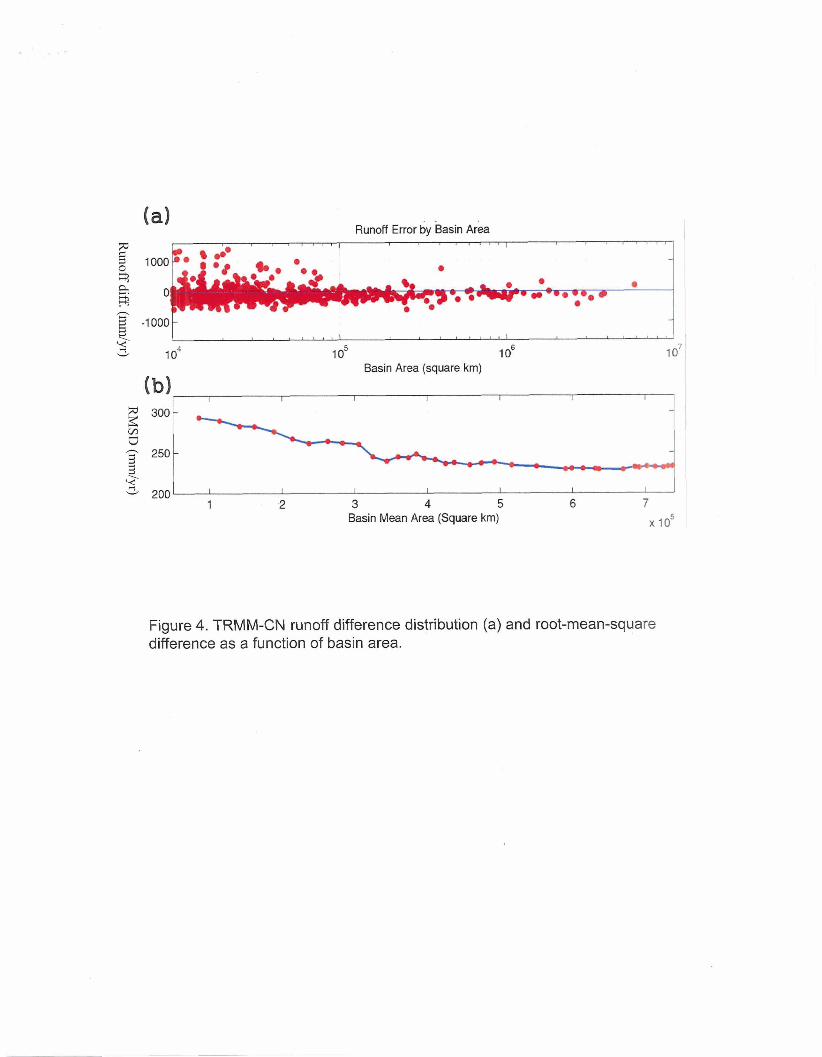
(a) Runoff Error by 'basin ~ r &
I
1000 s, ' a " # " '
0 -
* e e, - 5 FQ w - - - - '=ern
$ -100- - I I
Y 3 I o4 1 o5 I o6 1 o7
Basin Area (square krn)
rn u :- -- 1 *=O w 3 200 I I I I I I I
1 2 3 4 5 6 7 Basin Mean Area (Square km) x loS
Figure 4. TRMM-CN runoff difference distribution (a) and root-mean-square difference as a function of basin area.