Embed Size (px)
Citation preview

A Field Study Comparing Approaches to Collecting Annotated Activity Data in Real-World Settings
Yung-Ju Chang, Gaurav Paruthi, Mark W. Newman School of Information, University of Michigan
Ann Arbor, Michigan, USA {yuchang, gparuthi, mwnewman}@umich.edu
ABSTRACT Collecting ground-truth annotations for contextual data is vital to context-aware system development. However, current research lacks a systematic analysis of different approaches to collecting such data. We present a field experiment comparing three approaches: Participatory, Context-Triggered In Situ, and Context-Triggered Post Hoc, which involved users in recording and annotating activity data in real-world settings. We compared the quantity and quality of collected data using each approach, as well as the participant experience. We found Context-Triggered approaches produced more recordings, whereas the Participatory approach produced a greater amount of data with higher completeness and precision. Moreover, while participants appreciated automated recording and reminders for convenience, they highly valued having control over what and when to record and annotate. We conclude that user burden and user control are key aspects to consider when collecting and annotating contextual data with participants, and suggest features for a future tool focused on these two aspects.
Author Keywords Annotation; label; ground truth; activity data collection; transportation; field experiment; wearable camera
ACM Classification Keywords H.5.m. Information interfaces and presentation (e.g., HCI): Miscellaneous.
INTRODUCTION Wide adoption of mobile smartphones with GPS, cameras, Bluetooth, and myriad other sensors has enabled researchers to leverage these devices to collect behavioral trace data for various purposes. One major purpose is to advance understanding of social, behavioral, and environmental phenomena [7,36]. Frequently, such research employs a context-triggered approach to prompt
participants to report aspects of their in situ experience [11,28], an approach commonly known as the Experience Sampling Method (ESM), or Ecological Momentary Assessment (EMA).
A second purpose, which is the focus of this paper, is to collect contextual and activity traces for context-aware system development. This includes collecting data for building machine learning models for recognizing and predicting contextual conditions and human activities [3,25], and for rapidly testing and prototyping context-aware applications through playing back collected data [4,27,30]. For the purpose of supporting context-aware system development, researchers are interested in collecting not merely data, but also annotations. Annotations are useful for two purposes: first, they can serve as “ground truth” for collected data so as to train and test a machine-learning model. Second, annotations containing semantic information describing the collected data (e.g. driving to grocery store in the afternoon, encountering a traffic jam as opposed to just driving) are useful for researchers to review, filter, and then select suitable data for building models and for testing and prototyping their context-aware systems.
Researchers have used different ways to collect annotated contextual/activity data, including recording and annotating data by themselves [8], and using a structured participant-based approach, i.e. recording and annotating data with a small sample of people performing predefined activities in controlled environments under researcher guidance [2,22]. Since sensor-laden smartphones have become pervasive, researchers have started exploring ways to leverage mobile users to record and annotate targeted activities using their smartphones in real-word settings.
For example, participatory data collection [13,17] refers to users actively participating in collecting data; they manually control an instrument to collect data based on their interpretation of researchers’ needs and instructions [31]. In contrast, opportunistic data collection [13,23] is where an instrument passively records data based on certain heuristics, such as recording at all times or only at sampled times. Sampling can be randomized, based on schedules, or context-triggered [11,28]. To obtain users’ annotations, the instrument can be programmed to prompt users to annotate during the activity being recorded to obtain an in situ annotation, or to prompt users afterwards to obtain a post hoc annotation. In both cases, however, because data
Permission to make digital or hard copies of all or part of this work for personal or classroom use is granted without fee provided that copies are not made or distributed for profit or commercial advantage and that copies bear this notice and the full citation on the first page. Copyrights for components of this work owned by others than the ACM must be honored. Abstracting with credit is permitted. To copy otherwise, or republish, to post on servers or to redistribute to lists, requires prior specific permission and/or a fee. Request permissions from [email protected]. UbiComp '15, September 7-11, 2015, Osaka, Japan. Copyright is held by the owner/author(s). Publication rights licensed to ACM. ACM 978-1-4503-3574-4/15/09…$15.00. http://dx.doi.org/10.1145/2750858.2807524
671
UBICOMP '15, SEPTEMBER 7–11, 2015, OSAKA, JAPAN

collection is performed in real-world settings and is not under researchers’ supervision, it is difficult for researchers to manage the progress and to control the quality of collected data. Nevertheless, collecting data from mobile users in real-world settings has a considerable advantage: the collected contextual/activity data are more diverse, naturalistic, and representative to users’ real life behaviors.
Unfortunately, despite an increasing desire to leverage mobile users to collect annotated contextual/activity data in real-world settings, current research still lacks a systematic analysis of existing approaches for collecting such data. To address this lack, we conducted a field experiment comparing three approaches to collecting annotated contextual/activity data with mobile users in real-world settings, namely, Participatory, Context-Triggered In Situ, and Context-Triggered Post Hoc. In our comparison, we focus on assessing the quantity and quality of collected data, as well as the participant experience in using each approach. Our goal is that through such a comparison we can identify important aspects of an ideal approach to collecting annotated contextual/activity data, and can propose features for future data collection tools. In order to measure the quantity and quality of the collected data using each approach, we used wearable cameras and continuous device logging, along with human coders, to capture the ground truth of users’ activities, against which we validated participants’ recordings and annotations.
The key contributions of this paper include the results from a systematic analysis, identifying two key aspects of an ideal approach—user burden and user control, and a set of design features for a future tool for collecting annotated contextual/activity data. The results are relevant to all researchers and developers interested in collecting such data for context-aware system development.
RELATED WORK The current study builds on research in two areas: assessing quality and validity of data provided by participants, and labels and annotation acquisition for activity data. Literature relating to the former is mostly seen in mobile crowdsensing and research in social science focusing on the validity of research methods. The latter focuses more on techniques and systems for users to annotate their own data. In the sections below we discuss each of these areas in a separate section.
Mobile Crowdsensing Researchers have started discussing the pros and cons of participatory sensing and opportunistic sensing for collecting sensor data on smartphones in reviews of mobile crowdsensing systems and applications [13,19,23]. While the literature provides a comprehensive review, the discussions of the pros and cons are mainly based on researchers’ experiences and offer neither a systematic analysis among different approaches, nor empirical evidence derived from performing these approaches from users’ perspectives.
Researchers working on participatory sensing and citizen science have explored improving data quality from participants [15,33,35], and reducing participants’ effort by, for example, requesting data only from those who are in relevant locations [26], similar to a context-triggered approach. However, research in this area has mostly aimed at sensing external phenomena, in which data being collected by one person can be reviewed and validated by peers or experts. Our study aims at collecting personal activity data in real-world settings, thus only people participating in the activity can validate annotations. Therefore, although our study is informed and inspired by research in mobile crowdsensing, the method for data assessment in this study faces different problems.
Validity Assessment of Research Methods Another related area is assessing the validity of research methods to collect mental and behavioral data in context. In this area of research, methods often being assessed are retrospective methods such as surveys [37] and interviews [21], because they are generally believed to be subject to recall bias. To validate data collected via these methods, researchers have frequently used ESM or EMA as a “gold standard” because they are aimed at collecting participants’ in situ experiences and behaviors. In addition, the daily construction method (DRM) [16], an approach proposed for participants to reconstruct the sequence of activities that occur during a day, has also been assessed using ESM/EMA[9,20]. However, data collection for context-aware systems development introduces concerns that go beyond validity as compared to a gold standard, for example the amount and temporal alignment of collected activity data, as well as users’ experience in collecting data using each approach.
Acquiring Annotations on Recorded Activity Data Many researchers have collected annotated activity data for their research. While it is impossible to review all such studies, we focus on research aiming at supporting acquiring annotations. One focus of obtaining annotation is to leverage video to help users recognize collected activities. For example, CRAFT[29] adopts both in situ and post hoc approaches to capture behaviors of children in a video. However, in their study, post hoc annotations were added by experts to validate in situ annotations added by parents. In addition, the study was not aimed at comparing performances of different approaches.
Another topic on annotation acquisition is easing users’ burden on annotation. One approach is asking users to speak to annotate [14,24]. Another is using a context-triggered in situ approach to prompt users to label activities [5]. In [6], Cleland et al. compared the accuracy of labels using this approach with using a structured and a semi-structured approach where researchers annotate the activities. They found that the accuracy of labels obtained using the context-triggered in situ approach was similar to the structured approach. However, in this study the authors
672
UBICOMP '15, SEPTEMBER 7–11, 2015, OSAKA, JAPAN

neither analyze the amount and quality of recordings nor analyze users’ experience in using them. To our best knowledge, our study is the first study systematically comparing all these dimensions among different approaches in real-world settings. We present our study in the following sections.
THE FIELD EXPERIMENT
Target Activity Data: Transportation Activity We chose transportation activity as the target activity to record and annotate. We had considered other types of contextual/activity data collected in prior research, including home activity, phone placement, noise, and body motions. We set up a list of criteria to evaluate each choice, including: 1) the data collection task is challenging enough but not too difficult so that users’ performances could be distinguished; 2) the task could be performed for several days, so that there is diversity within the to-be-recorded activity; 3) a known method exists for approximately detecting the to-be-recorded activity with a reasonable accuracy so that we could use it for implementing context-triggered approaches and 4) the occurrence of the to-be-recorded activity should be frequent enough so that failing to detect an instance of it will not lead to significant user frustration and a delay of the study. After evaluating each alternative, we chose to collect transportation activity: participants recording and annotating their trips when they are traveling outdoors, as shown in Figure 1.
Choices of Approach to Compare: PART, SITU, POST We chose to compare three approaches to collect transportation activity data, which are: participatory (PART), context-triggered in situ (SITU), and context-triggered post hoc (POST). We chose these three approaches for several reasons. First, PART and POST are commonly adopted and discussed techniques in mobile crowdsensing [13,19,23]. SITU is also used in ESM studies for collecting contextual data (e.g. [11]). Second, PART, POST, and SITU impose different kinds and levels of effort on data collectors, namely, 1) the effort of operating the system to record and to annotate data; 2) the effort of remembering to start and stop recording data, 3) the effort of responding to a prompt in time and then returning to the original task if the current task is interrupted, and 4) the
effort of recalling and reconstructing what happened during the recorded activity. We assume the differences in these aspects would influence user burden and compliance, and the quality of the recorded data. Finally, all PART, SITU, and POST have been used in collecting transportation data with users’ inputs [1,12,34]. Later we will describe the implementation of the three approaches in our study.
Instrument for Data Collection: Minuku For this study we used Minuku, a data collection tool developed in our lab, which consists of a mobile Android application and a supporting backend. It can passively record contextual data (e.g. location, activity), trigger questionnaires based on context, and schedule daily diary prompts at designated times. These features are necessary for SITU and POST, as they automatically record data when they detect that a user is likely traveling using a particular transportation mode (TM). In addition, in SITU, Minuku needs to prompt the user to annotate their trips when it infers the TM of the user. Minuku utilizes the Google Activity Recognition service [38] to generate activity logs, which are in turn used to generate a first approximation of users’ TM. Specifically, Minuku extracts the “in vehicle,” “on foot,” “on bicycle,” and “still” labels from the service, and uses a finite state machine to determine whether a user is in a certain TM or is stationary. Determining a start and an end of a TM requires consistently receiving the same activity labels in a window of time (e.g. one minute). We iteratively tested different window sizes for different TMs with some ad hoc experimentation until the TM detection was robust and accurate in our own testing and in a field pilot study. The testing and the pilot study were important to the experiment because while a low threshold would cause Minuku to repeatedly prompt users during the same trip (over-segmentation), a high threshold would impose a significant delay before Minuku would detect the start of a trip.
Study Design and Procedure A within-subject design was adopted for this study because we reasoned that people have varied number of trips in a day and different commute routines. Accordingly, we chose to let each participant perform all PART, SITU, and POST. To mitigate the order effect, we randomly assigned participants to one of the six possible orderings of the three approaches. The number of participants in each order was balanced.
Collecting Trips using Minuku when Traveling Outdoors: We asked participants to record and annotate their trips when they were traveling outdoors (i.e., between locations). The annotation interface was same for all three conditions, and is shown in Figure 2a. Participants were asked to choose an activity type (i.e. transportation mode) best describing their trip. In addition, we instructed them to add notes to describe their trips, especially when they found a trip to be atypical in terms of the movement dynamic. We said that notes were optional but encouraged participants to add them to let us know more about that trip. To help
Figure 1: Study participants recorded and annotated their
trips when they traveled outdoors.
673
SESSION: SENSING WITH CROWD

participants be aware of recording status, we put an icon in the notification bar whenever Minuku is recording a trip.
Participants were asked to record and annotate at least two trips per day. We clarified to them that a trip should contain a clear origin and a destination, and they did not need to record outdoor movement shorter than 3 minutes nor indoor movement. At the end of each day, we tracked the number of recordings that participants annotated, and transitioned them to the next study condition once they had aggregated four days of annotated trips in the current condition. When the transition occurred, we sent them a new version of Minuku customized for the next condition. We told them that the four days of recordings did not need to be consecutive, and they should travel as they would do normally. They were provided $24 for completing the three conditions. They were rewarded 25 cents for recording extra trips beyond the two required daily trips, and they could earn up to $10 for the extra trips.
Performing PART, SITU, AND POST For the PART condition, participants were told to manually record their trips using the interface shown in Figure 2b. They could start, stop, pause, and resume a recording. Clicking the “Add Details” button brought them to the annotation interface. We asked them not to intentionally split a trip in the same TM into multiple trips, and clarified that whenever they switched to a different TM (e.g., walking after parking a car), they were starting a new trip. Finally, we told them that they could modify labels and notes for their trips in the Recording Tab, in which they could also see all recordings. For the SITU condition, we told participants that Minuku monitored their transportation and would prompt them to annotate their trip (as shown in Figure 2c) as soon as the trip was detected. We told them that the SITU notification would disappear within 1-2 minutes after Minuku detected that they had stopped traveling (i.e., after the end of the trip), and emphasized that they could only annotate during the trip because there was no recording tab in this condition. We also emphasized that they should annotate while they were in a safe situation
(e.g. not during driving). For the POST condition, we told participants that Minuku detected their transportation but would not prompt them to annotate during a trip. Instead, any trips they completed would appear in the Recording Tab (as shown in Figure 2d), and Minuku would remind them every day at 9 pm to annotate. This approach is similar to a daily diary study and the day reconstruction method (DRM) used for reflecting on life experience [16]. The method has also been termed prompted recall survey in transportation research [1]. We told participants that they could annotate their trips in the Recording Tab at any time.
Collecting “Ground Truth” Data To assess amount and quality of a participant’s recordings, it is necessary to know when he or she starts and stops moving outdoors. Therefore, we used Minuku to passively log participants’ location and activity traces. While activity traces were passively logged at all times, location traces were logged only when participants were detected to be moving (i.e. not stationary). However, because location and activity traces are not always reliable and accurate, we asked participants to also wear a wearable camera called Narrative Clip [39] during the study period. The camera is “always on” and takes a photo every 30 seconds. It is intended to be attached to the front of one’s clothing, and to capture whatever the wearer is looking at. Wearable cameras have previously been used to validate travel diaries in transportation research [10,18]. Inspired by the research, we intended to combine photos and logs to cross-validate and to generate Ground Truth Trips for each participant during the study.
We had considered recording continuous video, however, during the study, there was no wearable camera that could continuously record video for an entire day or take still photos at a rate higher than 2Hz. We asked participants to wear the camera at all times if possible, and emphasized to them that it was important for the study that they wore it whenever they started to move. However, for ethical reasons, we told them that they could take off the camera if they were uncomfortable with wearing it in particular
Figure 2. From left to right are: (a) The interface for labeling and adding notes, (b) PART: users manually record their trips,
(c) SITU: prompting users to annotate their trips, and (d) POST: users reviewing and annotating trips afterwards.
674
UBICOMP '15, SEPTEMBER 7–11, 2015, OSAKA, JAPAN

settings. We told participants that photos were important for the analysis, but we did not tell them that photos were used as the ground truth.
Daily Diary and Post-Study Interview In all three conditions, we sent participants a diary e-mail at 9:30 pm daily to have them reflect on unlabeled recordings. The diary prompt contained a list of recordings captured that day, with the start time, end time, and a transportation mode label next to it. We asked them to review and correct any incorrect recordings. For any unlabeled recording, we asked them to choose a reason from a list of reasons why the recording was unlabeled and also provide context about the recording. We also asked them to list trips that they took but did not appear in the recording list, and to choose a reason for why the trip did not appear. We interviewed each participant after they completed all three conditions. We first asked them about their commute process in a typical day and how they decided which trips to record. Then our questions were focused on, for each approach, how they annotated, the challenges they encountered, their subjective preferences, and their suggested improvements.
Participants We recruited participants that regularly commute to work or school by posting flyers on campus, sending department-wide e-mails, and advertising on social media. Respondents completed a screening survey to provide their 1) commute behaviors, 2) experience in using an Android phone; and 3) anticipated travel plans in the near future. We filtered out participants who traveled fewer than 4-5 days in a week, whose typical commute time was less than 5 minutes, and who were planning to travel out of town for more than a couple of days during the study timeframe. We attempted to balance gender, age, and transportation mode among participants. While we started the study with 37 participants, only 29 successfully completed participation (16 males, 13 females). There were several reasons why participants dropped out of the study: the app did not work with their phone, they lost the camera, or they stopped responding. Fourteen participants’ ages were 18-25; twelve were 26-35, and others were over 36. We refer to them as P1-P29 throughout this paper. P13 and P19’s data were excluded from the quantitative analysis because their data were incomplete. Thirteen participants reported that their primary commute mode was “car,” while ten reported “bus,” four “walk”, and two “bike.”
DATA PROCESSING AND CODING
Cleaning, Merging, and Processing Recordings It is important to clarify that in this paper recordings refer to “recordings of trips” generated by Minuku, and trips refer to trips participants took during the study that were captured by a wearable camera that were later verified by human coders. We collected 3070 recordings. We firstly removed duplicate recordings generated due to Minuku’s error. Then we inspected participants’ diary entries to look for recordings explicitly recognized as errors or split trips.
We removed false recordings and merged split recordings. Through this data cleaning and merging process, we obtained 2587 valid recordings (84.3% of all recordings), including both labeled and non-labeled.
Generated Ground Truth Trips We generated Ground Truth Trips from captured photos and activity and location traces. Several participants mentioned in the interview that they did not wear the camera at work or at private places. There were also a few diary entries where participants said they forgot to wear the camera during a few trips. Thus, while we asked participants to wear the camera at all times if possible, we could not assert that Group Truth Trips captured “all” participants’ trips during the study.
Two coders independently coded participants’ Ground Truth Trip times from photos and trace logs. Coders were trained to infer a transportation mode and when a participant started and ended a trip from photos, and to inspect activity traces along with using Google Earth for Desktop [40] to playback location traces to observe movement of participant to determine the final coded start and end times of each Ground Truth Trip. In addition to a standardized coding protocol developed for the coders to follow to ensure consistency, one of the authors also met with the coders weekly to discuss and resolve any uncertainty on coded times. We randomly chose a subset (644) from the coder’s’ coded times and ran the intra-class coefficient (ICC) test between them. The ICC score was 0.87 indicating high reliability between two coders. After the test, each coder then coded a subset of the rest of the photos and logs (randomly assigned). We generated 1414 Ground Truth Trips and paired each of them with participants’ recordings by comparing start time, end time, and transportation mode. Note that mislabeled recordings were treated same as unlabeled recordings in the comparison; their corresponding Ground Truth Trips, if any, were not counted as correctly labeled trips.
DATA ANALYSIS
Measures in Quantitative Analysis In our quantitative analysis, we focus on comparing the amount and quality of collected data using each of the three approaches. We introduced measures as follows:
Overall Performance Measures 1. Number of Valid Recordings 2. Recording labeling ratio (R-LR): The ratio of valid
labeled recordings to total valid recordings 3. Recording appending note ratio (R-NR): The ratio
of valid recordings to which a note was appended to total valid recordings.
These measures indicate participants’ overall performance in producing different kinds of recordings.
Coverage & Trip Labeling Ratio Coverage of recordings measures the length of data being recorded and correctly labeled in terms of absolute time
675
SESSION: SENSING WITH CROWD

Figure 4. The differences in number of recordings decreased when more users’ efforts was involved.
Figure 3. Noise and miss portion of recordings.
(seconds) and percentage of total time (percentage) per day. For example, if a participant traveled 70 minutes in a day and recorded 56 minutes, the coverage length is 56 minutes and the percentage is 80%. The higher these two measures are for a particular approach, the greater amount of data we collected through that approach. Another measure we calculated was trip labeling ratio (T-LR) per day. This indicates the ratio of participants’ actual trips recorded and labeled to total trips per day. For example, if a participant took 8 Ground Truth Trips in a day but only provided labeled recordings for 4, the T-LR would be 50% for that day. We assume T-LR of PART is lower than of SITU and POST because in PART, participants had to initiate recording on their own, whereas in SITU and POST Minuku records a trip whenever it recognizes movement in a targeted transportation mode.
Completeness Completeness measures percentage of a trip being recorded and annotated. For example, if 15 minutes out of a 20-minute trip is recorded and annotated, the completeness of the recording is 75%. Two other related measures are length of missed portions at the beginning and at the end of a trip (seconds), respectively. If a recording starts ten seconds after a trip starts, it misses ten seconds at the beginning; if it ends ten seconds before a trip ends, it misses ten seconds at the end. We expected to see missed portion in recordings of SITU and POST because for both Minuku needs to detect movement of a participant, which is likely to cause a delay in starting and stopping a recording.
Precision Precision measures percentage of a recording precisely reflecting its label. If a recording labeled driving starts one minute earlier than the start of a 9-minute trip, it contains one minute of noise at the beginning, and its precision is 90%. We also measure length of noise at the beginning and at the end (seconds). Due to the detection delay, we expect some noise at the end of recordings of SITU and POST.
The illustration of completeness with missing portions and precision with noises is shown in Figure 3.
Methods for Data Analysis We used a Chi-Square Test to examine whether participants had significant differences in overall performance in producing recordings across three approaches. For measures related to coverage, completeness and precision, we examined the main effect of variables of interest, including condition, transportation mode, day of a week, and user using an analysis of variance (ANOVA). The user variable was included to account for individual differences. We included the periods of day variable for trip level analyses such as completeness and precision. The periods we used are: morning (6am-11am), noon (11am-2pm), afternoon (2pm-6pm), evening (6pm – 9pm), night (9pm-1am), and midnight (1am-6am). These periods were determined based on our knowledge of participants’ typical daily travel patterns obtained from the interviews. We also
included the interaction effect between condition and transportation mode to examine whether certain combinations between the two would have an impact on recording coverage and accuracy. For example, in SITU, we expect participants less likely to label their trip when driving. We used the Tukey HSD Test for post-ANOVA pairwise comparisons. Below we present results related to main effects of condition and transportation mode, and the interaction effect between them.
For qualitative analysis, we transcribed interviews, and coded the transcriptions and daily diary entries using an iterative process of generating, refining, and probing emergent themes. The coding themes were focused on the topics of challenges of using the approaches and participants’ likes and dislikes about each approach.
QUANTITATIVE RESULTS & FINDINGS
Overall Performance of Annotating Recordings We start presenting measures of overall performance. Among the 2587 valid recordings, 1919 were labeled (74.2%), and 994 (38.4%) were given a note. As expected, the number of labeled recordings of PART (424) is lower than of SITU (723) and POST (772). In terms of the recording labeling ratio (R-LR), from highest to lowest are: PART (91.6%), POST (76.8%), and SITU (64.9%). All of the differences in R-LR between any two approaches are statistically significant using the Chi-Square Test for pairwise comparisons (PART vs. SITU: χ2 = 109.9, p < .001; SITU vs. POST: χ2 = 33.4, p < .001; PART vs. POST: χ2 = 40, p <. 001). In addition, PART also had the highest ratio of appended notes (R-NR: 58.2%), which is higher than of SITU (R-NR: 31.6%, χ2 = 25.1, p < .001) and of POST (R-NR: 36.8%, χ2 = 28.3, p <. 001). No significant difference was found between SITU and POST.
There are several things to note regarding these results. First of all, the SITU approach, i.e. asking users to label during traveling, led to the lowest labeling ratio. We think
676
UBICOMP '15, SEPTEMBER 7–11, 2015, OSAKA, JAPAN

this may be linked to the issue of interruption in SITU. Secondly, the R-NR of POST is roughly as low as SITU. We speculate that this is because in a post hoc review it was easier for participants to recall (or reason) the transportation mode of trip than to recall details of a trip. Third, SITU and POST produced more valid recordings than PART because of its automated recording. However, another reason is that participants sometimes labeled one trip more than once in SITU and POST when the app falsely detected them stopping and starting a new trip. Regardless of the reasons, Figure 4 shows that with more effort involved (i.e. labeling and adding notes), the advantage of automated recording on producing more annotated recordings is decreasing. The decrease in the rate of adding notes is especially apparent, probably because we only encouraged instead of required participants to add notes to recordings.
Coverage of Recordings Having more labeled recordings does not necessarily mean a greater quantity of activity data being recorded and labeled. In this section, we compare the ratio of actual trips recorded and labeled to total trips per day (T-LR) and the coverage of recordings among the three approaches. For T-LR, our results indicated main effects of transportation mode (F[5,454]=5.3, p < .001) but not condition. In a post hoc analysis, we found the T-LR of walking trips to be lower than bus trips (p < .001) and car trips (p = .02), respectively. This may have been because participants considered car and bus trips more like “real trips,” and may have been more likely to record and label them.
For coverage length, our results showed main effects of both condition (F[2,454] = 4.9, p = .007) and transportation mode (F[6,454] = 18.6, p < .001). In a post hoc analysis, we found the total coverage (absolute time) of PART greater than of SITU (p = .02) and POST (p = .02). A similar result was also found in coverage percentage: both condition (F[2,454] = 12.9, p < .001) and transportation mode (F[5,454] = 2.8, p = .02) had an effect on coverage percentage, and the coverage percentage of PART was also greater than that of SITU (p < .001) and POST (p < .001).
Completeness of Recordings As a reminder, completeness denotes the percentage of a trip that was recorded and labeled. Our results suggested both main effects of condition (F[2,1365] = 35.2, p < .001) and transportation mode (F[5,1365] = 8.2, p < .001). A post
hoc analysis showed that completeness of recordings of PART (68.2%) was higher than of SITU (48.1%, p < .001) and POST (47.4%, p < .001). We also found completeness of recordings for walking trips (45.2%) to be lower than of car trips (59.8%, p < .001) and bus trips (59.7%, p < .001). There also existed an interaction effect between condition and transportation mode (F[4,1365] = 3.8, p = .004). In particular, we found that when using PART, completeness of recordings of walking trips (51.8%) was significantly lower than of bus trips (80.5%, p < .001) and car trips (76.2%, p < .001), respectively. This result indicates that there was a larger disagreement regarding when walking trips started and ended between participants and our coders than car trips and bus trips. This might be because starts and ends of car trips and bus trips are generally less ambiguous than of walking trips.
Regarding missed portions at the beginning of a trip, we found main effects of condition (F[2,901] = 31.3, p < .001) and transportation mode (F[4,901] = 7.2, p < .001), and an interaction effect between condition and transportation mode (F[4,901] = 3.9, p = .004). Specifically, recordings of PART missed shorter portions at the beginning (29.8 seconds) than of SITU (140.4 seconds, p < .001) and POST (144.1 seconds, p < .001), suggesting that the TM detection delay led to longer missed portions at the beginning. In addition, recordings of walking trips missed longer portions at the beginning than of car trips (p < .001). On the other hand, there was no statistically significant difference in the length of missed portions at the end among the approaches. This suggests that when using PART, participants could stop a recording soon after ending a trip. Completeness and missing portions across approaches and transportation modes are shown in Figure 5.
Precision of Recordings As a reminder, precision measures the percentage of a recording reflecting its transportation mode label. Our results showed main effects of condition (F[2,901] = 32.1, p < .001) and transportation mode (F[4,901] = 16.5, p < .001). As expected, we found precision of recordings of PART to be higher than of SITU (p < .001) and POST (p < .001), as shown in Figure 6. As with the completeness result discussed above, this difference was probably caused by the detection delay. Furthermore, we found the precision of walking trip recordings in both SITU and POST lower
Figure 5: Completeness of Recordings (Left), length of missed portion at the beginning (Middle), and length of missed portion
at the end (Right) across approaches and transportation modes.
677
SESSION: SENSING WITH CROWD
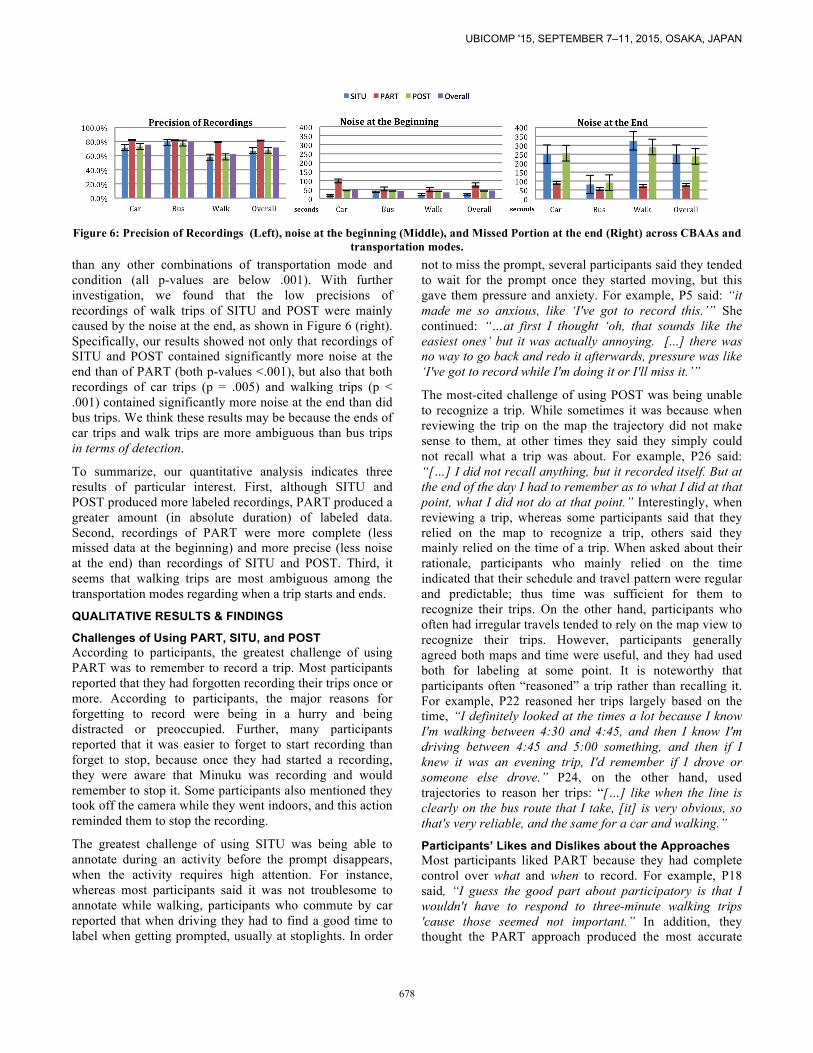
than any other combinations of transportation mode and condition (all p-values are below .001). With further investigation, we found that the low precisions of recordings of walk trips of SITU and POST were mainly caused by the noise at the end, as shown in Figure 6 (right). Specifically, our results showed not only that recordings of SITU and POST contained significantly more noise at the end than of PART (both p-values <.001), but also that both recordings of car trips (p = .005) and walking trips (p < .001) contained significantly more noise at the end than did bus trips. We think these results may be because the ends of car trips and walk trips are more ambiguous than bus trips in terms of detection.
To summarize, our quantitative analysis indicates three results of particular interest. First, although SITU and POST produced more labeled recordings, PART produced a greater amount (in absolute duration) of labeled data. Second, recordings of PART were more complete (less missed data at the beginning) and more precise (less noise at the end) than recordings of SITU and POST. Third, it seems that walking trips are most ambiguous among the transportation modes regarding when a trip starts and ends.
QUALITATIVE RESULTS & FINDINGS
Challenges of Using PART, SITU, and POST According to participants, the greatest challenge of using PART was to remember to record a trip. Most participants reported that they had forgotten recording their trips once or more. According to participants, the major reasons for forgetting to record were being in a hurry and being distracted or preoccupied. Further, many participants reported that it was easier to forget to start recording than forget to stop, because once they had started a recording, they were aware that Minuku was recording and would remember to stop it. Some participants also mentioned they took off the camera while they went indoors, and this action reminded them to stop the recording.
The greatest challenge of using SITU was being able to annotate during an activity before the prompt disappears, when the activity requires high attention. For instance, whereas most participants said it was not troublesome to annotate while walking, participants who commute by car reported that when driving they had to find a good time to label when getting prompted, usually at stoplights. In order
not to miss the prompt, several participants said they tended to wait for the prompt once they started moving, but this gave them pressure and anxiety. For example, P5 said: “it made me so anxious, like ‘I've got to record this.’” She continued: “…at first I thought ‘oh, that sounds like the easiest ones’ but it was actually annoying. [...] there was no way to go back and redo it afterwards, pressure was like ‘I've got to record while I'm doing it or I'll miss it.’”
The most-cited challenge of using POST was being unable to recognize a trip. While sometimes it was because when reviewing the trip on the map the trajectory did not make sense to them, at other times they said they simply could not recall what a trip was about. For example, P26 said: “[…] I did not recall anything, but it recorded itself. But at the end of the day I had to remember as to what I did at that point, what I did not do at that point.” Interestingly, when reviewing a trip, whereas some participants said that they relied on the map to recognize a trip, others said they mainly relied on the time of a trip. When asked about their rationale, participants who mainly relied on the time indicated that their schedule and travel pattern were regular and predictable; thus time was sufficient for them to recognize their trips. On the other hand, participants who often had irregular travels tended to rely on the map view to recognize their trips. However, participants generally agreed both maps and time were useful, and they had used both for labeling at some point. It is noteworthy that participants often “reasoned” a trip rather than recalling it. For example, P22 reasoned her trips largely based on the time, “I definitely looked at the times a lot because I know I'm walking between 4:30 and 4:45, and then I know I'm driving between 4:45 and 5:00 something, and then if I knew it was an evening trip, I'd remember if I drove or someone else drove.” P24, on the other hand, used trajectories to reason her trips: “[…] like when the line is clearly on the bus route that I take, [it] is very obvious, so that's very reliable, and the same for a car and walking.”
Participants’ Likes and Dislikes about the Approaches Most participants liked PART because they had complete control over what and when to record. For example, P18 said, “I guess the good part about participatory is that I wouldn't have to respond to three-minute walking trips 'cause those seemed not important.” In addition, they thought the PART approach produced the most accurate
Figure 6: Precision of Recordings (Left), noise at the beginning (Middle), and Missed Portion at the end (Right) across CBAAs and
transportation modes.
678
UBICOMP '15, SEPTEMBER 7–11, 2015, OSAKA, JAPAN

recordings among the three. Participants disliked PART mostly because they had to remember to start and stop on their own. For example, P5 said, “You had to remember to press. […] so if you were forgetful you wouldn't want to have that burden.”
Participants disliked SITU mainly for being prompted erroneously—sometimes multiple times during a single trip. For example, P10 complained about getting prompts whenever he encountered a stop sign: “By the time I get to the stop sign, it was [like]: ‘Perfect, you got a stop sign.’ And then, [the prompt] would then pop up. I was like, "You stupid [app], not giving me the notification.” Another commonly cited problem was being unable to prevent the app from recording the movement they did not want to record. For example, P13 said, “[…] especially when I didn't wanna record a trip, it would constantly be nagging me, like when I work, I deliver stuff.” P5 also complained: “... it would record me walking inside, […]. I was like ‘ugh, just leave me alone.’” Furthermore, participants felt that they lacked the control over when to annotate in SITU, as P24 reported: “I didn't like how I couldn't go back to my trips at the end of the day. Like I said, every now and again, I was concerned about not being able to record them... I couldn't go back and see which ones I forgot to record.” These participants wished there had been a way for them to review and labeled their trips afterwards like in POST.
On the other hand, participants liked SITU for its prompting feature suggesting the current transportation mode. For example, P4 said, “I like that it did have that reminder, it was able to pre-judge what transportation I was actually using” P9 also said, “[…] it was pretty efficient the way that it only prompted when it was a long trip.” He later added, “I thought [it] was intelligent. It can detect when you're in a car, when you're walking, so, which was pretty good. […] It was always accurate.”
Participants liked POST in that they only needed to annotate their trips once at the end of the day or when they were free, as P34 said, “I really enjoyed being able to […] fill it all out in one time. […] It gave me a lot of flexibility. I could label it afterwards. I could label it at the very end of the day when I was sitting down charging the camera.” P28 also said, “[…] Like the best one would be: have an app which will do efficient tracking, and it will pop up only once in the night. It will do everything in the background, okay?” However, not all participants liked repeatedly labeling their trips all at once, which may have led to less effort being directed towards the labeling task. For example, P29 illustrated this issue in the interview: “Submit. Submit. Submit. [laughter]. Most people will be more diligent so they'll take more time to fill out the reports.”
Another often mentioned dislike was seeing a number of errors, such as trips that were too short to record or trips that were hard to recognize. For example, P9 said: “Prompting me for a lot of trips which weren't trips
actually. […] I couldn't remember what they were, because the map would show like 10 feet or something, like a dot.”
DISCUSSION
Analyzing Pros and Cons of PART, SITU, and POST We analyze pros and cons of PART, SITU, and POST in three aspects vital to collecting annotated activity data: quantity of data, quality of data, and user experience.
Quantity of Data A common question regarding the amount of collected data using participatory vs. context-triggered is: does automated recording lead to greater quantity of data? Our results do not suggest such an advantage. Although SITU and POST resulted in more labeled recordings, these recordings were shorter because they were less complete. In addition, some of these recordings were fragmented and actually belonged to a single trip due to over-aggressive segmentation. In addition, although we originally expected in PART participants would record fewer trips in a day because of the higher burden, our result shows that participants did not label fewer actual trips in a day in PART than in SITU and POST. On the other hand, our result also shows that the coverage of recordings and the ratio of labeled trips to total trips between SITU and POST are similar. This seems to indicate that neither the interruption issue of SITU nor the recall bias issue of POST lead to smaller amount of annotated activity data, as compared with the other.
Quality of Data Our result shows a pattern regarding completeness and precision of recordings. Both the context-triggered approaches, SITU and POST, had more missed portions at the beginning and contained longer noise at the end due to the detection delay. In addition, because of occasional detection errors, both SITU and POST had issues with splitting a single trip into multiple recordings. In contrast, recordings of PART more precisely matched the actual start times and end times of their corresponding Ground Truth Trips. Moreover, participants also stated that they felt their recordings in PART more accurately reflected their trips.
User Experience According to the qualitative findings, we identify two key aspects of user experience particularly vital to collecting annotated activity data: user burden and user control. Regarding user burden, participants generally felt PART least convenient because they needed to remember to record their trips. In contrast, they appreciated the convenience in SITU and POST because of their automated recording and prompt, especially that in POST they did not need to annotate during a trip, as they needed for PART and SITU.
Regarding user control, participants highly valued being able to control when and what to annotate and record. The fact that participants could only annotate during a trip in SITU made participants anxious about missing a prompt, especially when an activity required their attention (e.g. driving). They favored the flexibility of deciding when to
679
SESSION: SENSING WITH CROWD

annotate in POST because they could annotate whenever they were free. In addition, participants wanted to control the app so that it did not record a trip they were reluctant or did not need to record. These issues are specific to context-triggered approaches, which are challenging yet crucial to address. They are challenging because it is likely that researchers who aim to collect activity data using a context-triggered approach may not yet have a context-detection system that is accurate and intelligent enough to prevent false detection or to accurately select what and when to record. These issues are crucial to solve because they are likely to annoy users over time and decrease compliance. Allowing users to control a collection tool, especially when context-detection is not accurate, can ameliorate this issue. When the context detection improves, users may find themselves not needing to rely all by themselves to record. In the next section, we propose set of features for a future tool for collecting annotated activity data.
Proposed Features for Activity Data Collection Tool While granting user control and easing user burden can be seen as a design tradeoff, our experiences convince us that these two elements can be balanced to improve not only user experience, but also the quantity and quality of data collected. For granting user control, we argue that it is important to allow users to control a recording interface regardless of whether there is a context-trigger feature. We suggest tools should include a context-trigger function if it is available because automated recording and reminders can reduce users’ burden. However, users must be able to switch this function on and off whenever they want to prevent the tool from recording. A promising approach might be to encourage users to manually record their activity (as in PART); meanwhile, a context-trigger function is running as a fall-back so that when users forget to record the tool can automatically record it and remind them to annotate (as in SITU/POST). We suggest the tool to deliver a reminder during an activity (as in SITU) so that users can be aware of an ongoing recording (so that they can also cancel it) and can annotate it at a breakpoint. However, the tool must allow users to review and annotate their activity after the activity ends (as in POST).
To further ease user burden, the tool could automatically suggest a label where possible, meaning that users only need to change the label if it is incorrect. When the tool detects users being in the same activity consecutively, it could ask whether this is a continued activity, and if yes, it could automatically connect the current recording to the previous one. Finally, detecting an opportune moment [32] for delivering the prompt during or after an activity can also avoid interrupting the user.
Limitations of the Study The current study is subject to several limitations. First, the Ground Truth Trips in the study were generated where photos were available. As a result, the result may be subject to a systematic bias related to the availability of photos.
Second, the sampling rate of the camera is one photo per 30 seconds. Although we used logs to establish more precise times of Ground Truth Trips, there might be still some imprecision on the start/end times. Third, this paper did not analyze the length and quality of notes, which could be useful to assess users’ compliance. Fourth, we only analyzed log data from a small sample of 27 participants, and the participants were mostly below 35 years old. Thus their behavior may not be representative to the general mobile user population. Fifth, in our study we only asked participants to collect transportation activities; it is possible that the results of the comparison might have been different if we had chosen to collect other types of activities (e.g., exercise). Finally, participants only used each approach for four days. It is likely that their compliance might decrease if our study had been longer, especially for approaches considered more troublesome. In addition, the action of wearing a camera might remind participants to start and stop recording their trips in PART. Therefore, our results might overestimate the coverage and underestimate amount of noise of recordings of PART if employed without a camera. Despite these limitations, we reemphasize that the goal of the study is not to identify “a winner” among the three approaches, but instead, to inform future research on developing a reliable and effective approach and tool for collecting annotated activity data through the comparison.
CONCLUSION We presented a field experiment comparing three approaches involving mobile users in recording and annotating their transportation activities in real-word settings. The approaches we compared are participatory (PART), context-triggered in situ (SITU), and context-triggered post hoc (POST). Our data showed that although SITU and POST produced more activity recordings, PART produced larger amount of activity data in terms length, suggesting that automated recording was not advantageous in our study. In addition, recordings of PART were also more complete and contained less noise than recordings of SITU and POST. On the other hand, we learned that users highly value being able to control what and when to record and annotate, and appreciate automated recording and reminders that can reduce their burden. We conclude that both granting user control and easing user burden are key aspects to future approach and tool for collecting annotated contextual/activity data. Based on these two aspects and with a goal for improving user experience as well as the amount and quality of collected data, we propose a set of design features for a future tool.
ACKNOWLEDGEMENTS This work was funded in part by NSF award IIS-1149601 and the University of Michigan M-Cubed program. We thank our participants, Natalie Colabianchi and the Interaction Ecologies group for helpful feedback, Wirithphol “Flash” Ek-Ularnpun for help testing Minuku, and Hsing-Ying Wu and Noureen Dharani for their efforts coding the data.
680
UBICOMP '15, SEPTEMBER 7–11, 2015, OSAKA, JAPAN

REFERENCES 1. Joshua Auld, Chad Williams, Abolfazl Mohammadian,
and Peter Nelson. 2009. An automated GPS-based prompted recall survey with learning algorithms. Transportation Letters 1, 1, 59–79.
2. Ling Bao and Stephen S. Intille. 2004. Activity Recognition from User-Annotated Acceleration Data. In Pervasive Computing, Alois Ferscha and Friedemann Mattern (eds.). Springer Berlin Heidelberg, Berlin, Heidelberg, 1–17.
3. Gerald Bieber, Jörg Voskamp, and Bodo Urban. 2009. Activity Recognition for Everyday Life on Mobile Phones. In Universal Access in Human-Computer Interaction. Intelligent and Ubiquitous Interaction Environments, Constantine Stephanidis (ed.). Springer Berlin Heidelberg, Berlin, Heidelberg, 289–296.
4. Yung-Ju Chang, Pei-Yao Hung, and Mark Newman. 2012. TraceViz: “brushing” for location based services. Proceedings of the 14th international conference on Human-computer interaction with mobile devices and services companion, ACM, 219–220. http://doi.org/10.1145/2371664.2371717
5. Ian Cleland, Manhyung Han, Chris Nugent, et al. 2013. Mobile Based Prompted Labeling of Large Scale Activity Data. In Ambient Assisted Living and Active Aging, Christopher Nugent, Antonio Coronato and José Bravo (eds.). Springer International Publishing, 9–17.
6. Ian Cleland, Manhyung Han, Chris Nugent, et al. 2014. Evaluation of Prompted Annotation of Activity Data Recorded from a Smart Phone. Sensors 14, 9, 15861–15879.
7. Caren B. Cooper, Janis Dickinson, Tina Phillips, and Rick Bonney. 2007. Citizen science as a tool for conservation in residential ecosystems. Ecology and Society 12, 2, 11.
8. R DeVaul and S Dunn. 2001. Real-Time Motion Classification for Wearable Computing Applications.
9. Samantha Dockray, Nina Grant, Arthur A. Stone, Daniel Kahneman, Jane Wardle, and Andrew Steptoe. 2010. A Comparison of Affect Ratings Obtained with Ecological Momentary Assessment and the Day Reconstruction Method. Social Indicators Research 99, 2, 269–283. http://doi.org/10.1007/s11205-010-9578-7
10. Aiden Doherty, Paul Kelly, and Charlie Foster. 2013. Wearable Cameras: Identifying Healthy Transportation Choices. IEEE Pervasive Computing 12, 1, 44–47. http://doi.org/10.1109/MPRV.2013.21
11. Jon Froehlich, Mike Y. Chen, Sunny Consolvo, Beverly Harrison, and James A. Landay. 2007. MyExperience: a system for in situ tracing and capturing of user feedback on mobile phones. Proceedings of the 5th international conference on Mobile systems, applications and services, 57–70. http://doi.org/10.1145/1247660.1247670
12. Jon Froehlich, Tawanna Dillahunt, Predrag Klasnja, et al. 2009. UbiGreen: investigating a mobile tool for tracking and supporting green transportation habits.
Proceedings of the 27th international conference on Human factors in computing systems, ACM, 1043–1052. http://doi.org/10.1145/1518701.1518861
13. Raghu K. Ganti, Fan Ye, and Hui Lei. 2011. Mobile crowdsensing: Current state and future challenges. Communications Magazine, IEEE 49, 11, 32–39.
14. Susumu Harada, Jonathan Lester, Kayur Patel, et al. 2008. VoiceLabel: using speech to label mobile sensor data. Proceedings of the 10th international conference on Multimodal interfaces, ACM, 69–76. http://doi.org/10.1145/1452392.1452407
15. Kuan Lun Huang, Salil S. Kanhere, and Wen Hu. 2010. Are you contributing trustworthy data?: the case for a reputation system in participatory sensing. Proceedings of the 13th ACM international conference on Modeling, analysis, and simulation of wireless and mobile systems, 14–22. http://doi.org/10.1145/1868521.1868526
16. Daniel Kahneman, Alan B. Krueger, David A. Schkade, Norbert Schwarz, and Arthur A. Stone. 2004. A survey method for characterizing daily life experience: The day reconstruction method. Science 306, 5702, 1776–1780.
17. Salil S. Kanhere. 2011. Participatory Sensing: Crowdsourcing Data from Mobile Smartphones in Urban Spaces. Mobile Data Management (MDM), 2011 12th IEEE International Conference on, 3–6. http://doi.org/10.1109/MDM.2011.16
18. Paul Kelly, Aiden Doherty, Anja Mizdrak, et al. 2014. High group level validity but high random error of a self-report travel diary, as assessed by wearable cameras. Journal of Transport & Health 1, 3, 190–201. http://doi.org/10.1016/j.jth.2014.04.003
19. Wazir Zada Khan, Yang Xiang, Mohammed Y Aalsalem, and Quratulain Arshad. 2013. Mobile Phone Sensing Systems: A Survey. IEEE Communications Surveys Tutorials 15, 1, 402–427. http://doi.org/10.1109/SURV.2012.031412.00077
20. Jinhyuk Kim, Hiroe Kikuchi, and Yoshiharu Yamamoto. 2013. Systematic comparison between ecological momentary assessment and day reconstruction method for fatigue and mood states in healthy adults. British Journal of Health Psychology 18, 1, 155–167. http://doi.org/10.1111/bjhp.12000
21. Petra L. Klumb and Margret M. Baltes. 1999. Validity of retrospective time-use reports in old age. Applied Cognitive Psychology 13, 6, 527–539.
22. Jennifer R. Kwapisz, Gary M. Weiss, and Samuel A. Moore. 2011. Activity recognition using cell phone accelerometers. ACM SigKDD Explorations Newsletter 12, 2, 74–82. http://doi.org/10.1145/1964897.1964918
23. Nicholas D. Lane, Emiliano Miluzzo, Hong Lu, Daniel Peebles, Tanzeem Choudhury, and Andrew T. Campbell. 2010. A survey of mobile phone sensing. Communications Magazine, IEEE 48, 9, 140–150. http://doi.org/10.1109/MCOM.2010.5560598
681
SESSION: SENSING WITH CROWD
24. Nicholas D. Lane, Ye Xu, Hong Lu, et al. 2011. Enabling large-scale human activity inference on smartphones using community similarity networks (csn). Proceedings of the 13th international conference on Ubiquitous computing, ACM, 355–364. http://doi.org/10.1145/2030112.2030160
25. Walter S. Lasecki, Young Chol Song, Henry Kautz, and Jeffrey P. Bigham. 2013. Real-time crowd labeling for deployable activity recognition. Proceedings of the 2013 conference on Computer supported cooperative work, ACM, 1203–1212. http://doi.org/10.1145/2441776.2441912
26. M. Linnap and A. Rice. 2014. The effectiveness of centralised management for reducing wasted effort in participatory sensing. 2014 IEEE International Conference on Pervasive Computing and Communications Workshops (PERCOM Workshops), 68–73. http://doi.org/10.1109/PerComW.2014.6815167
27. Yang Li and James A Landay. 2008. Activity-based prototyping of ubicomp applications for long-lived, everyday human activities. Proceeding of the twenty-sixth annual SIGCHI conference on Human factors in computing systems, ACM, 1303–1312. http://doi.org/http://doi.acm.org.proxy.lib.umich.edu/10.1145/1357054.1357259
28. Alexander Meschtscherjakov, Wolfgang Reitberger, and Manfred Tscheligi. 2010. MAESTRO: orchestrating user behavior driven and context triggered experience sampling. Proceedings of the 7th International Conference on Methods and Techniques in Behavioral Research, 29. http://doi.org/10.1145/2441776.2441912
29. N. Nazneen, Agata Rozga, Mario Romero, et al. 2012. Supporting parents for in-home capture of problem behaviors of children with developmental disabilities. Personal and Ubiquitous Computing 16, 2, 193–207. http://doi.org/10.1007/s00779-011-0385-1
30. Mark W. Newman, Mark S. Ackerman, Jungwoo Kim, et al. 2010. Bringing the field into the lab. Proceedings of the 23nd annual ACM symposium on User interface software and technology - UIST ’10, 105. http://doi.org/10.1145/1866029.1866048
31. Mark Paxton and Steve Benford. 2009. Experiences of participatory sensing in the wild. Proceedings of the 11th international conference on Ubiquitous computing, ACM, 265–274. http://doi.org/10.1145/1620545.1620584
32. B. Poppinga, W. Heuten, and S. Boll. 2014. Sensor-Based Identification of Opportune Moments for Triggering Notifications. IEEE Pervasive Computing 13, 1, 22–29. http://doi.org/10.1109/MPRV.2014.15
33. Sasank Reddy, Jeff Burke, Deborah Estrin, Mark Hansen, and Mani Srivastava. 2007. A framework for data quality and feedback in participatory sensing. Proceedings of the 5th international conference on Embedded networked sensor systems, 417–418. http://doi.org/10.1145/1322263.1322324
34. S. Reddy, M. Mun, J. Burke, D. Estrin, M. Hansen, and M. Srivastava. 2010. Using mobile phones to determine transportation modes. ACM Transactions on Sensor Networks (TOSN) 6, 2, 13. http://doi.org/10.1145/1689239.1689243
35. S. Andrew Sheppard, Andrea Wiggins, and Loren Terveen. 2014. Capturing quality: retaining provenance for curated volunteer monitoring data. Proceedings of the 17th ACM conference on Computer supported cooperative work & social computing, ACM, 1234–1245. http://doi.org/10.1145/2531602.2531689
36. Jonathan Silvertown. 2009. A new dawn for citizen science. Trends in ecology & evolution 24, 9, 467–471.
37. Bettina Sonnenberg, Michaela Riediger, Cornelia Wrzus, and Gert G. Wagner. 2012. Measuring time use in surveys – Concordance of survey and experience sampling measures. Social Science Research 41, 5, 1037–1052. http://doi.org/10.1016/j.ssresearch.2012.03.013
38. Google Activity Recognition API. Retrieved from https://developer.android.com/reference/com/google/android/gms/location/ActivityRecognitionApi.html
39. Narrative Clip. Retrieved from http://getnarrative.com/ 40. Google Earth for Desktop. Retrieved from
http://www.google.com/earth/explore/products/desktop.html
682
UBICOMP '15, SEPTEMBER 7–11, 2015, OSAKA, JAPAN