Embed Size (px)
Citation preview
A Feasibility Study and Evaluation of
Financing Models for Wind Energy Projects: A Case Study on Izmir Institute of Technology Campus
Area
By
Serra ÖZER
A Dissertation Submitted to the Graduate School in Partial Fulfillment of the
Requirements for the Degree of
MASTER OF SCIENCE
Department: Mechanical Engineering Major: Mechanical Engineering
Izmir Institute of Technology Izmir, Turkey
July, 2004
ii
We approve the thesis of Serra ÖZER
Date of Signature
.............................................................................. 29.07.2004
Assoc. Prof. Dr. Baris ÖZERDEM
Supervisor
Department of Mechanical Engineering
............................................................................. 29.07.2004
Asst. Prof. Dr. Gülden GÖKÇEN
Department of Mechanical Engineering
.............................................................................. 29.07.2004
Assoc. Prof. Dr. Murat GÜNAYDIN
Department of Architecture
............................................................................. 29.07.2004
Assoc. Prof. Dr. Baris ÖZERDEM
Head of Department of Mechanical Engineering
iii
ACKNOWLEDGEMENTS
The author wishes to express her gratitude to her supervisor Assoc. Prof. Dr. Baris
ÖZERDEM for his valuable guidance, continual support and supervision throughout this
thesis.
The author is grateful to Murat DURAK, Levent ISHAK for their support and help.
The author also wishes to thank Arslan ÖRNEK for his support and guidance.
The author also wants to express her warm thanks to her colleagues, Nazmi PINAR
and Ferit ARSAN for their trusting, friendship and support.
Finally, the author wishes to express her thanks to her family for their help,
encouragement and support during her study.
iv
ABSTRACT
Feasibility studies have been done for different scenarios on IZTECH campus area
where previous wind data evaluation showed considerable wind potential. RET Screen
software has been used for feasibility calculations. Internal rate of return and unit cost of
energy have been examined for the proposed scenarios. First scenario represents an
autoproducer model which would meet IZTECH’s electricity need. Two 600 kW turbines
were used in this scenario and the unit cost of energy have calculated as 24 cents/kWh.
Second scenario represents an autoproducer group. Two units with 900 kW rated power
turbines were used in the scenario and 4.82 cents/kWh is found as unit energy cost. Finally,
third and last scenario is planned as production plant with thirteen 900 kW turbines. The
energy unit cost would be 2.68 cents/kWh when scenario is applied. This study showed that
IZTECH campus area which was inspected before for wind data characteristic and technical
potential point of view, found economically viable too. Within the finance models, project
finance and syndicated loan credit were examined as the most convenient mechanisms.
v
ÖZ
Önemli ölçüde rüzgar potansiyeli oldugu belirlenmis olan Izmir Yüksek Teknoloji
Enstitüsü (IYTE) kampus arazisinde farkli senaryolar için fizibilite çalismasi yapilmistir.
Fizibilite hesaplamalarinda RET Screen programi kullanilmistir. Olusturulan senaryolar
için karlilik ve birim maliyet degerleri incelenmistir. Birinci senaryo, IYTE’nin kendi
elektrik ihtiyacini karsilayacagi otoprodüktör modeli temsil etmektedir. Bu senaryoda iki
adet 600 kW gücünde rüzgar türbini kullanilmis ve birim enerji maliyeti 6.24 cent/kWh
olarak hesaplanmistir. Ikinci senaryo otoprodüktör grubu modeline karsi gelmektedir. Iki
adet 900 kW gücünde rüzgar türbininin kullanildigi senaryoya göre birim enerji maliyeti
4.82 cent/kWh olarak bulunmustur. Üçüncü ve son senaryo ise üretim santrali olarak
tasarlanmis olup, on üç adet 900 kW gücünde rüzgar türbini kurulumunu öngörmektedir.
Bu senaryo uygulandiginda birim enerji maliyeti 2.68 cent/kWh olmaktadir. Bu çalisma,
daha önce rüzgar veri karakteristikleri ve potansiyeli teknik olarak incelenen IYTE kampus
alaninin, rüzgar santrali kurulmasi durumunda, ekonomik olarak da uygun oldugunu
göstermistir. Finansman modelleri içerisinde de en uygun çözümün proje finansmani veya
sendikasyon kredisi kullanmak oldugu belirlenmistir.
vi
TABLE OF CONTENTS
TABLE OF CONTENTS.......................................................................................................vi LIST OF FIGURES .............................................................................................................viii LIST OF TABLES .................................................................................................................ix Chapter 1 ...............................................................................................................................12 INTRODUCTION ................................................................................................................12 Chapter 2 ...............................................................................................................................16 WIND ENERGY STATUS ..................................................................................................16
2.1 Global Status of Wind Power ...............................................................................16 2.1.1 An Overview of Wind Energy in the World .................................................16 2.1.2 The World’s Wind Resources and Demand for Electricity ..........................21 2.1.3 Environmental Benefits.................................................................................21 2.1.4 Costs..............................................................................................................22
2.2 Energy in Turkey ..................................................................................................27 2.2.1 An Overview of Turkish Energy Sector .......................................................27 2.2.2 Energy Sector Regulations............................................................................30 2.2.3 Wind Energy .................................................................................................34
Chapter 3 ...............................................................................................................................35 GUIDELINE FOR WIND ENERGY PROJECTS ...............................................................35
3.1 Phase1: Site Selection ...........................................................................................36 3.1.1 Potential Wind Resource...............................................................................36 3.1.2 Potential Size of Site:....................................................................................37 3.1.3 Electrical Interconnection: ............................................................................37 3.1.4 Land Ownership and Current Usage:............................................................37 3.1.5 Construction Issues:......................................................................................38
3.2 Phase2: Feasibility ................................................................................................39 3.2.1 Wind Resource ..............................................................................................39 3.2.2 Land Use and Ground Conditions .................................................................40 3.2.3 Energy Yield .................................................................................................40 3.2.4 Site Access ....................................................................................................40 3.2.5 Electrical Connection....................................................................................41 3.2.6 Draft project design.......................................................................................41 3.2.7 Economic Feasibility.....................................................................................41
3.3 Phase3: Detailed Assessment................................................................................41 3.3.1 Selecting Appropriate Wind Turbine Generator ...........................................42 3.3.2 Electrical Interconnection.............................................................................42 3.3.3 Environmental Considerations:.....................................................................42
3.4 Phase4: Development Application........................................................................43 3.5 Phase5: Construction............................................................................................43 3.6 Phase6: Operation .................................................................................................44 3.7 Phase7: Decommissioning....................................................................................44
Chapter 4 ...............................................................................................................................46 ECONOMIC ASSESSMENT OF WIND FARM PROJECTS ............................................46
4.1 Capital Costs .........................................................................................................49 4.2 Operation and Maintenance (O&M).....................................................................50
Chapter 5 ...............................................................................................................................52
vii
ECONOMIC CONCEPTS: CONSIDERATIONS IN PROJECT EVALUATION.............52 5.1 Net Present Value Method ....................................................................................53
5.1.1 Time Value of Money...................................................................................53 5.1.2 Discounting ...................................................................................................54 5.1.3 Net Present Value Calculation......................................................................55
5.2 Internal Rate of Return (IRR) ...............................................................................57 5.3 Simple Payback Method .......................................................................................58
5.3.1 Payback Period..............................................................................................58 Chapter 6 ...............................................................................................................................60 FINANCING WIND ENERGY PROJECTS .......................................................................60
6.1 Sources of Finance ................................................................................................60 6.2 Financing Methods................................................................................................61
6.2.1 Project Finance..............................................................................................63 6.2.2 Syndicated Loan Credit.................................................................................67
Chapter 7 ...............................................................................................................................69 CASE STUDY ON IZTECH CAMPUS AREA...................................................................69
7.1 Site selection:........................................................................................................69 7.2 Available Data.......................................................................................................70
7.2.1 Historical Data ..............................................................................................70 7.2.2 IZTECH Site Data.........................................................................................71 7.2.3 Wind Field Modeling....................................................................................71 7.2.4 Wind Farm Arrangement – Selecting Best Fit Turbine for IZTECH Campus Area .......................................................................................................................74
7.3 Economic Analysis ...............................................................................................76 7.3.1 SCENARIO 1: IZTECH Autoproducer ........................................................78 7.3.2 SCENARIO 2: Autoproducer Group ............................................................93 7.3.3 SCENARIO 3 : Independent Power Producer (IPP)...................................102
Chapter 8 .............................................................................................................................112 CONCLUSION...................................................................................................................112 REFERENCES ...................................................................................................................116 APPENDIX ….…..………...……………………………………………………………..121
viii
LIST OF FIGURES
Figure 2-1 The capital cost breakdown of a typical 5 MW .................................................22 Figure 2-2 Total world wind power generation, by region ..................................................24 Figure 2-3 Capacity Installed at year end .............................................................................25 Figure 2-4 Top Wind Energy Markets in 2003 ....................................................................26 Figure 2-5 Annual Development of Turkey’s Installed Capacity.........................................28 Figure 2-6 Primary Energy Production in Turkey................................................................28 Figure 2-7 Primary Energy Consumption in Turkey............................................................29 Figure 2-8 Installed capacity in 2002....................................................................................33 Figure 6-1 Structure of Project Financing ............................................................................63 Figure 6-2 A sample of due diligence requirements for a particular bank .........................66 Figure6-3 Structure of a Syndicated Loan Structure ............................................................68 Figure 7-1 Location of the IZTECH mast on Izmir map .....................................................70 Figure 7-2 Average wind speed map of campus area. .........................................................72 Figure 7-3 Wind energy map of campus area (kWh/m 2 /year). ...........................................73 Figure 7-4 Usage area of existing buildings (m ²) ................................................................78 Figure 7-5 Comparison of Cost Components .......................................................................82 Figure 7-6 - IRR versus Energy Price for Autoproducer......................................................85 Figure 7-7 The cost component distribution of Enercon E40 600kW for Autoproducer .....86 Figure 7-8 Sensitivity Graph for Autoproducer....................................................................88 Figure 7-9 NPV versus Discount Rate for Autoproducer.....................................................89 Figure 7-10 IRR via Debt Interest Rate for Autoproducer ...................................................90 Figure 7-11 The effect of inflation on IRR and NPV ……………………………………..91 Figure 7-12 Inflation via required minimum sales price for IRR=15 ……………………..92 Figure 7-13 Comparison of Cost of Energy Components ....................................................94 Figure 7-14 IRR versus Energy Price for Autoproducer Group ...........................................96 Figure 7-15 The cost component distribution of NEG-Micon NM52- 900 kW for
Autoproducer Group .....................................................................................................97 Figure 7-16 Sensitivity Graph for Autoproducer Group .......................................................98 Figure 7-17 NPV versus Discount Rate for Autoproducer Group ........................................99 Figure 7-18 IRR via Debt Interest Rate for Autoproducer Group ......................................100 Figure 7-19 The effect of inflation on IRR and NPV…………………………………….101 Figure7-20 Inflation via required minimum sales price for IRR=15% …………………..101 Figure 7-21 Comparison of Cost of Energy Components ..................................................103 Figure 7-22 IRR versus Energy Price for IPP.....................................................................104 Figure 7-23 The cost component distribution of NEG-Micon NM52- 900 kW for
Autoproducer Group ...................................................................................................105 Figure 7-24 Sensitivity Graph for IPP ................................................................................106 Figure 7-25 NPV versus Discount Rate for IPP .................................................................107 Figure 7-26 IRR via Debt Interest Rate for IPP..................................................................108 Figure 7-27 The effect of inflation on IRR and NPV ……………………………………109 Figure 7-28 Inflation via required minimum sales price for IRR=15% ………………….109 Figure7-29 Structure of building a wind energy project ...................................................111 Figure 8-1 Energy price versus installed capacity ..............................................................114
ix
LIST OF TABLES
Table2-1 Global Wind Energy Generating Capacity by Country ........................................18 Table2-2 Growth in World Wind Power Market 1997-2002 ...............................................20 Table 2-3 Growth Rates in Top Ten Wind Energy Markets ................................................20 Table 2-4 Capacity Installed at the year end (MW) .............................................................24 Table 2-5 Top Wind Energy Markets in 2003 .....................................................................26 Table 7-1 Comparison of Annual Energy Production (AEP) of five turbines and their
efficiencies . ..................................................................................................................74 Table7-2 Annual Electricity Consumption of Campus (2000-2001-2002) ..........................78 Table 7-3 Projected final building area.................................................................................79 Table 7-4 Annual Electricity Consumption of the Campus ..................................................79 Table 7-5 Technical data of wind turbines used in the analysis ...........................................80 Table 7-6 Cost related data of wind turbines used in the analysis. .......................................81 Table 7-7 Cost break down (thousand US$) .........................................................................81 Table 7-8 Summary of all alternatives ..................................................................................83 Table 7-9 Variance Analysis Summary for Enercon E40-600kW........................................86 Table 7-10 The effect of Discount Rate on IRR,NPV, Payback Time and Year to Positive
Cash Flow .....................................................................................................................89 Table 7-11 The effect of Interest Rate on IRR, NPV, Payback Time and Year to Positive
Cash Flow .....................................................................................................................90 Table 7-12 The effect of inflation on IRR and NPV............................................................91 Table 7-13 Cost related data of wind turbines used in the analysis......................................93 Table 7-14 Cost break down for Autoproducer Group (US$) ..............................................94 Table7-15 Summary of all alternatives .................................................................................95 Table 7-16 Variance Analysis Summary for NM52-900kW ................................................97 Table 7-17 The effect of Discount Rate on IRR, NPV, Payback Time and Year to Positive
Cash Flow .....................................................................................................................99 Table 7-18 The effect of Interest Rate on IRR,NPV, Payback Time and Year to Positive
Cash Flow ...................................................................................................................100 Table 7-19 The effect of inflation on IRR and NPV..........................................................101 Table 7-20 Cost related data of wind turbines used in the analysis ....................................102 Table 7-21 Cost break down (thousand US$) .....................................................................102 Table 7-22 Summary of all alternatives ..............................................................................103 Table 7-23 Variance Analysis Summary for NM52-900kW ..............................................105 Table 7-24 The effect of Interest Rate on IRR,NPV, Payback Time and Year to Positive
Cash Flow ...................................................................................................................107 Table 7-25 The effect of Discount Rate on IRR, NPV, Payback Time and Year to Positive
Cash Flow ...................................................................................................................108 Table 7-26 The effect of inflation on IRR and NPV..........................................................109
x
NOMENCLATURE
nA : End of period payments series of payments
AWEA: American Wind Energy Association
nB : Benefit
B: Benefit
BCR: Benefit/Cost Ratio
BOO: Build Own Operate
BOT: Built Operate Transfer
nC : Cost ($)
C: Cost ($)
ECA: Export Credit Agencies
EIE: Turkish Directorate of Electrical Power Survey and Development Administration
EMRA: Energy Market Regulatory Authority
EU: European Union
EWEA: European Wind Energy Association
nF : Future Value ($)
I: Interest Rate (%)
IEA: International Energy Agency
IRR: Internal Rate of Return (%)
MENR: Ministry of Energy and Natural Resources
xi
MLA: Multilateral Lending Agencies
n: period (year)
NPV: Net Present Value
NWCC: National Wind Coordinating Committee
O&M: Operation and Maintenance
vP : Present Value
PBP: Pay Back Period (year)
PPA: Power Purchase Agreement
PV: Present Value ($)
r: Discount Rate
RET: Renewable Energy Technology
ROI: Return on Investment
SIS: State Institute of Statistics
TEAS: Turkish Electricity Generation and Transmission Co.
TEDAS: Turkish Electricity Distribution Co.
TEK: Turkish Electricity Authority
TOR: Transfer of Operating Rights
TPAO: National Oil and Gas Company
WT: Wind Turbine
WECS: Wind Energy Conversion System
12
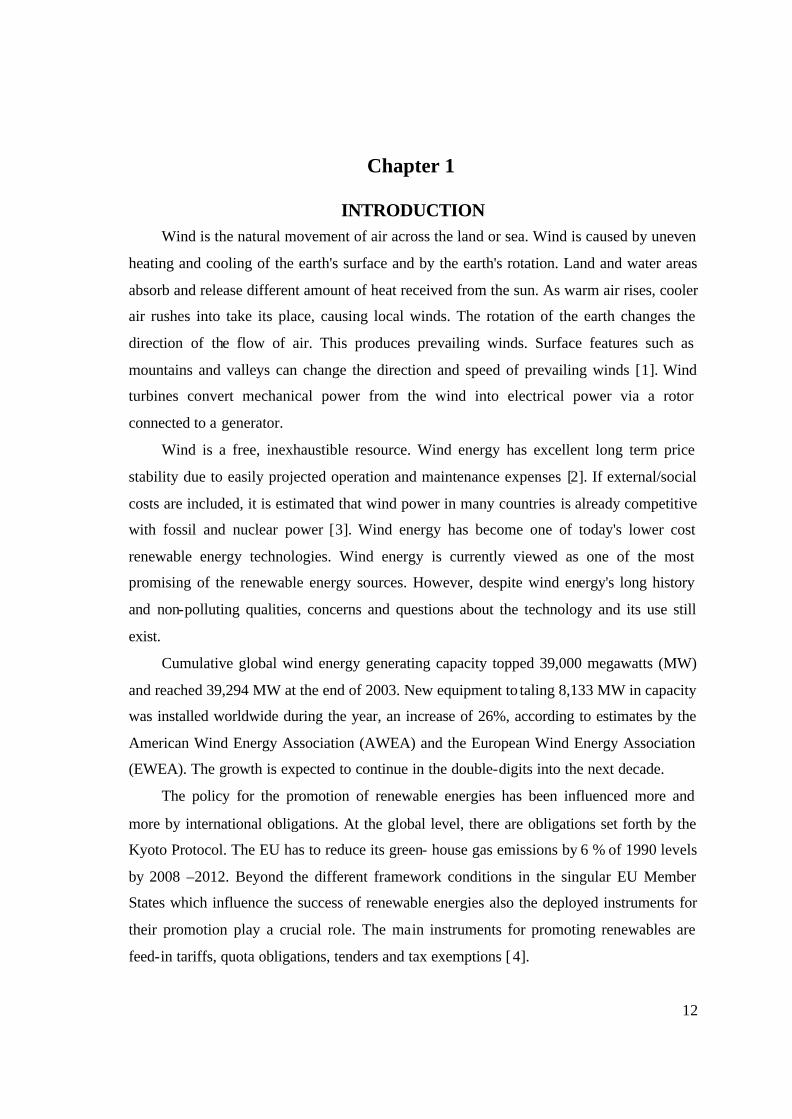
Chapter 1
INTRODUCTION Wind is the natural movement of air across the land or sea. Wind is caused by uneven
heating and cooling of the earth's surface and by the earth's rotation. Land and water areas
absorb and release different amount of heat received from the sun. As warm air rises, cooler
air rushes into take its place, causing local winds. The rotation of the earth changes the
direction of the flow of air. This produces prevailing winds. Surface features such as
mountains and valleys can change the direction and speed of prevailing winds [1]. Wind
turbines convert mechanical power from the wind into electrical power via a rotor
connected to a generator.
Wind is a free, inexhaustible resource. Wind energy has excellent long term price
stability due to easily projected operation and maintenance expenses [2]. If external/social
costs are included, it is estimated that wind power in many countries is already competitive
with fossil and nuclear power [3]. Wind energy has become one of today's lower cost
renewable energy technologies. Wind energy is currently viewed as one of the most
promising of the renewable energy sources. However, despite wind energy's long history
and non-polluting qualities, concerns and questions about the technology and its use still
exist.
Cumulative global wind energy generating capacity topped 39,000 megawatts (MW)
and reached 39,294 MW at the end of 2003. New equipment to taling 8,133 MW in capacity
was installed worldwide during the year, an increase of 26%, according to estimates by the
American Wind Energy Association (AWEA) and the European Wind Energy Association
(EWEA). The growth is expected to continue in the double-digits into the next decade.
The policy for the promotion of renewable energies has been influenced more and
more by international obligations. At the global level, there are obligations set forth by the
Kyoto Protocol. The EU has to reduce its green- house gas emissions by 6 % of 1990 levels
by 2008 –2012. Beyond the different framework conditions in the singular EU Member
States which influence the success of renewable energies also the deployed instruments for
their promotion play a crucial role. The main instruments for promoting renewables are
feed-in tariffs, quota obligations, tenders and tax exemptions [4].
13
Turkey’s natural energy resources are quite diversified; hard coal, lignite, asphaltite,
oil, natural gas, hydro, geothermal, wood, animal and plant wastes, solar and secondary
energy resources such as coke and briquettes are produced and consumed. Oil has the
biggest share (44%) in total primary energy consumption, while natural gas has a share of
12% [5].
In 1970, growing generation, distribution and consumption of electricity as well as the
necessity of expanding the respective services made it essential the forming of an
institutional structure and thus TEK (Turkish Electricity Authority) was established. So, the
integrity in the power sector was ensured, with the exception of municipalities and the
Bank of Provinces [6].
In 1984 with the new regulations, the monopoly of TEK was lifted up and the private
entities formed against permissions were also given the opportunity to intervene generation,
transmission and distribution of electricity. This is called the BOT (Built-Operate-
Transfer); Law No: 3096.
Turkish Electricity Authority had been incorporated in the scope of the privatization
and it was split into two separate State Owned Enterprises, namely “Turkish Electricity
Generation Transmission Co” TEAS and Turkish Electricity Distribution Co” TEDAS, by
the Act of the Council of Ministers [6].
The latest development is the Electricity Market Law (No: 4628), which was issued in
the Official Gazette dated 3rd March, 2001. It is concerning the restructuring of the energy
sector and it has been targeted the establishment of financially strong, stable and
transparent electricity market under competitive and special law provisions for a sufficient,
high-quality, continuous, low-cost and environment friendly supply of electricity to the
disposal of consumers as well as the maintaining an independent regulatory and
supervisory framework.
This law covers the generation, transmission, distribution, wholesale, retail and
respective services of electricity including its import-export and also the rights and
responsibilities of all real and legal persons connected with those services and
establishment of a Energy Market Regulatory Authority and its running procedures and
principals as well as the procedures to be followed for the privatization of the electricity
generation and distribution assets. TEAS had been restructured to form 3 state- owned
14
public enterprise by the Decree of Council of Ministers No:2001/2026 and dated
05.02.2001 which was issued in the Official Gazette dated 2nd March, 2001 [6].
Every wind farm is unique but the steps in building a wind farm are common. The
most important factor to consider in the construction of a wind energy facility is the site's
wind resource. Availability and access to existing lines should be considered in selecting a
site whenever possible. Roads, transmission equipment, maintenance infrastructure,
turbines need to be considered. There are many factors contributing to the cost and
productivity of a wind plant. Financing methods can make a major difference in project
economics as well [7].
A developer’s key aim is to maximize value creation by ensuring that a project is
successfully guided through the development process. This process consists of a number of
key steps: site selection, planning approval, grid connection, arrangement of Power
Purchase Agreement (PPA) and financial close [8].
The cost of a wind energy system is determined by three components: initial
installation costs, operating expenses and the cost of financing. The initial installation cost
includes the purchase price of the complete sys tem (including tower, wiring, utility
interconnection, power conditioning unit, etc.) plus delivery and installation charges,
professional fees and sales tax.
Operating expenses is incurred over the lifetime of the wind system. Operating costs
include maintenance and service, insurance and any applicable taxes. The last component,
cost of financing, depends on the interest rate on the money invested (how the capital cost
is repaid).
Wind energy costs are decreasing every year, whereas most conventional generation
costs continue to increase. Wind energy project capital costs as reported by the
International Energy Agency(IEA) show substantial variation between countries, due to
factors such as market structures, site characteristics and planning regulations; total wind
project capital costs vary between approximately US$900 per kW and US$1,600 per kW in
different countries [9].
The discount rate has a significant influence on production costs and hence on the
financial viability of wind projects. For a 600kW turbine, changing the discount rate from
5% to 10% a year (in real terms) increases the production cost by a little more than 30%,
15
from 5 US cents per kWh to 6.7 US cents per kWh [9]. This effect is considered in the case
study.
Wind energy is a capital- intensive technology with short construction times (typically
a few months), low operating costs and zero fuel costs. The economics of wind energy are
therefore more sensitive to discount rate and plant capital cost than, for example, are those
of fossil or nuclear fuelled generation [10].
The present study focuses on the economics of grid -connected wind turbines only.
The main parameters governing wind power economics are: (i) investment costs, including
auxiliary costs for foundation, grid-connection, and so forth; (ii) operation and maintenance
costs; (iii) electricity production/average wind speed; (iv) turbine lifetime; and (v) discount
rate. Of these the most important are the turbines’ production of electricity and the
investment costs. As electricity production is highly dependent on wind conditions,
choosing the right turbine site is critical to the economic results.
16
Chapter 2
WIND ENERGY STATUS 2.1 Global Status of Wind Power
2.1.1 An Overview of Wind Energy in the World
World’s primary energy consumption increased by 2.6% in 2002, well ahead of the
10-year growth trend of 1.4% per annum. Reported growth in energy demand of almost
20% in China was behind much of this relative strength. Energy consumption in the world,
excluding China, grew by less than 1% during the year 2002 [11].
With Kyoto Protocol, a series of greenhouse gas reduction targets has cascaded down
to a regional and national level. These in turn have been translated into targets for
increasing the proportion of renewable energy, in the supply mix. Kyoto Protocol called for
global cut of 6 % from 1990 levels by the period 2008-2012, a series of greenhouse gas
reduction targets has cascaded down to regional and national levels. Wind power and other
renewable energy technologies generate electricity without producing the pollutants
associated with fossil fuels and nuclear power generation, and emit no carbon dioxide, the
most significant greenhouse gas.
Despite the scale of the potential, the current contribution of renewables to world
energy supplies is modest. Renewables are estimated to supply around 17% of world
primary energy, but most of this is from large hydroelectric schemes and the use of
traditional biomass and agricultural waste in developing countries – these supply 3% (18%
of electricity) and 14% of primary energy, respectively [12].
However, both can lead to considerable local environmental problems and the
potential for sustainable expansion because both are limited. Meanwhile, according to IEA
the ‘new’ renewables such as solar, modern biomass and wind power contribute a much
smaller proportion of energy needs at present – around 3% of electricity and 2% of primary
energy [13]. Wind is the world's fastest-growing energy source, with installed generating
capacity increasing by an average 32% annually for the last five years (1998-2002).
17
The power of the wind has been utilized for at least 3000 years for pumping water or
grinding grain. The first electricity generation by wind energy was achieved around the
end of the 19th century. Dane Poul La Cour was the first to build a wind turbine generating
electricity in 1891.
The first modern wind turbine was built in Denmark at 1940s. Despite the success of
German and Danish wind turbines, the interest in large-scale wind power generation
declined after World War II [14,15]. In late 1970s the interest in wind power generation
returned as a part of response to the oil crises in 1973 and 1979.
As a result, financial support for research and development programmes of wind
energy became available. Governments used several different approaches to promote wind
energy. Countries like Germany, USA or Sweden used this money to develop large-scale
wind turbine prototypes in the MW range, others concentrated on creating the right market
conditions for deployment of the technology.
During the last decade of the 20th century, grid -connected wind capacity world wide
has doubled approximately every three years. Due to the fast market development, wind
turbine technology has experienced an important evaluation over time.
In many respects, wind power is the great success story of renewables development
[12]. Currently wind energy production represents the fastest growing of all renewable
energy sources on the market, with most of the growth coming from the Europe (Germany,
Spain and Denmark).
Since the Wind Force 12 report, which was published by EWEA and Greenpeace,
wind power has maintained its status as the world’s fastest growing energy source. Installed
capacity has continued to grow at an annual rate in excess of 30%. During 2002 alone,
more than 7,000 MW of new capacity was added to the electricity grid. This investment
was worth more than €7 billion.
Kyoto in turn has been translated into targets for introducing an increasing proportion
of renewables into the supply mix. For example, the 15 member states of the European
Union now have an overall target for 22% of their electricity to come from renewables by
2010.
A great deal of information included in this study has been obtained from EWEA
reports.
18
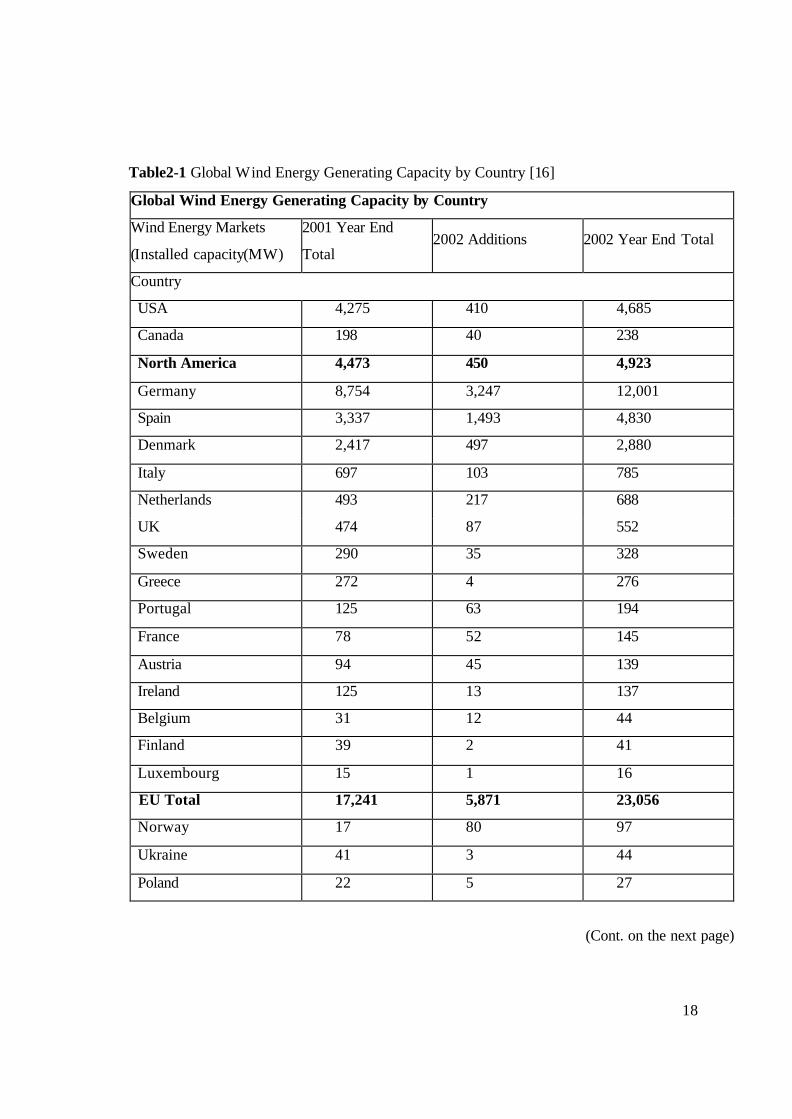
Table2-1 Global Wind Energy Generating Capacity by Country [16]
Global Wind Energy Generating Capacity by Country
Wind Energy Markets
(Installed capacity(MW)
2001 Year End
Total 2002 Additions 2002 Year End Total
Country
USA 4,275 410 4,685
Canada 198 40 238
North America 4,473 450 4,923
Germany 8,754 3,247 12,001
Spain 3,337 1,493 4,830
Denmark 2,417 497 2,880
Italy 697 103 785
Netherlands 493 217 688
UK 474 87 552
Sweden 290 35 328
Greece 272 4 276
Portugal 125 63 194
France 78 52 145
Austria 94 45 139
Ireland 125 13 137
Belgium 31 12 44
Finland 39 2 41
Luxembourg 15 1 16
EU Total 17,241 5,871 23,056
Norway 17 80 97
Ukraine 41 3 44
Poland 22 5 27
(Cont. on the next page)
19
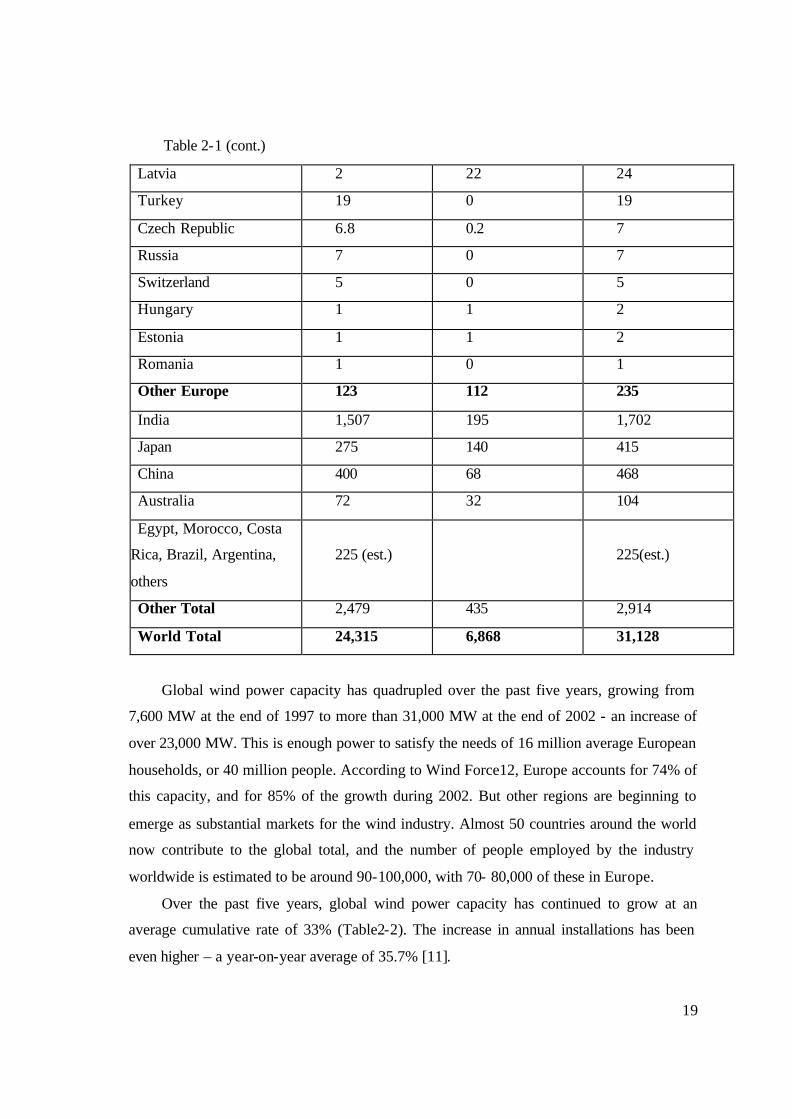
Table 2-1 (cont.)
Latvia 2 22 24
Turkey 19 0 19
Czech Republic 6.8 0.2 7
Russia 7 0 7
Switzerland 5 0 5
Hungary 1 1 2
Estonia 1 1 2
Romania 1 0 1
Other Europe 123 112 235
India 1,507 195 1,702
Japan 275 140 415
China 400 68 468
Australia 72 32 104
Egypt, Morocco, Costa
Rica, Brazil, Argentina,
others
225 (est.) 225(est.)
Other Total 2,479 435 2,914
World Total 24,315 6,868 31,128
Global wind power capacity has quadrupled over the past five years, growing from
7,600 MW at the end of 1997 to more than 31,000 MW at the end of 2002 - an increase of
over 23,000 MW. This is enough power to satisfy the needs of 16 million average European
households, or 40 million people. According to Wind Force12, Europe accounts for 74% of
this capacity, and for 85% of the growth during 2002. But other regions are beginning to
emerge as substantial markets for the wind industry. Almost 50 countries around the world
now contribute to the global total, and the number of people employed by the industry
worldwide is estimated to be around 90-100,000, with 70- 80,000 of these in Europe.
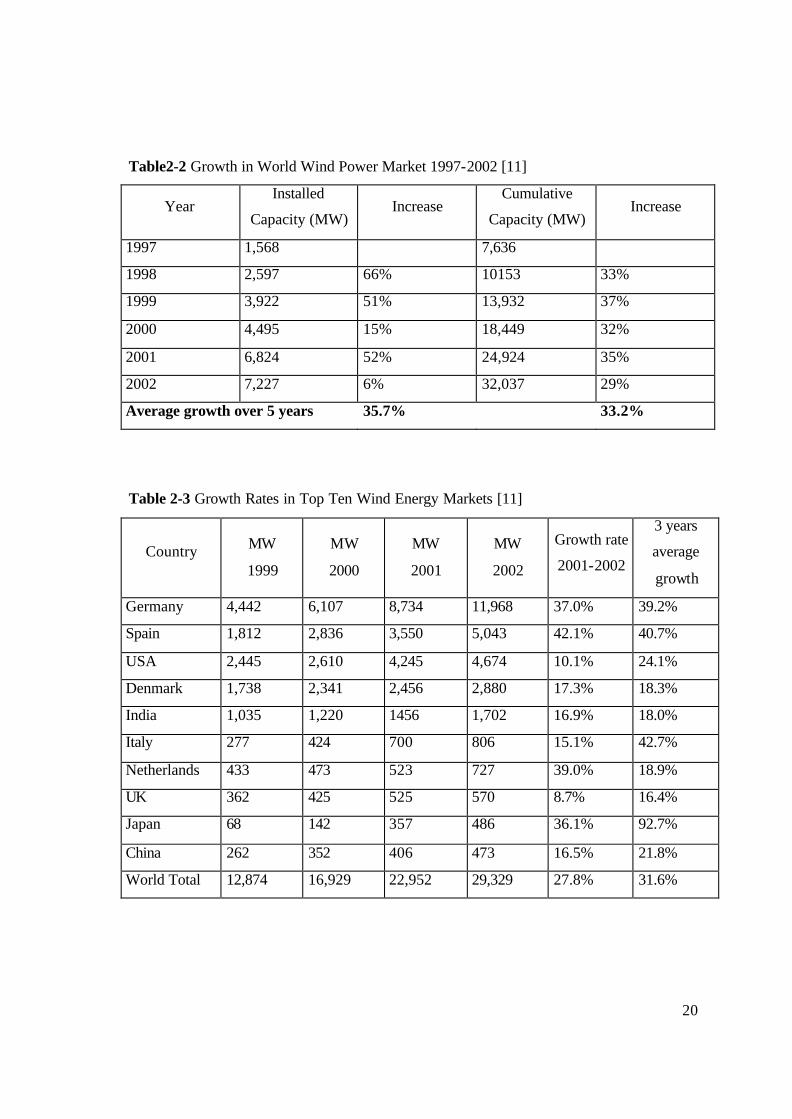
Over the past five years, global wind power capacity has continued to grow at an
average cumulative rate of 33% (Table2-2). The increase in annual installations has been
even higher – a year-on-year average of 35.7% [11].
20
Table2-2 Growth in World Wind Power Market 1997-2002 [11]
Year Installed
Capacity (MW)
Increase Cumulative
Capacity (MW)
Increase
1997 1,568 7,636
1998 2,597 66% 10153 33%
1999 3,922 51% 13,932 37%
2000 4,495 15% 18,449 32%
2001 6,824 52% 24,924 35%
2002 7,227 6% 32,037 29%
Average growth over 5 years 35.7% 33.2%
Table 2-3 Growth Rates in Top Ten Wind Energy Markets [11]
Country
MW
1999
MW
2000
MW
2001
MW
2002
Growth rate
2001-2002
3 years
average
growth
Germany 4,442 6,107 8,734 11,968 37.0% 39.2%
Spain 1,812 2,836 3,550 5,043 42.1% 40.7%
USA 2,445 2,610 4,245 4,674 10.1% 24.1%
Denmark 1,738 2,341 2,456 2,880 17.3% 18.3%
India 1,035 1,220 1456 1,702 16.9% 18.0%
Italy 277 424 700 806 15.1% 42.7%
Netherlands 433 473 523 727 39.0% 18.9%
UK 362 425 525 570 8.7% 16.4%
Japan 68 142 357 486 36.1% 92.7%
China 262 352 406 473 16.5% 21.8%
World Total 12,874 16,929 22,952 29,329 27.8% 31.6%
21
2.1.2 The World’s Wind Resources and Demand for Electricity
A number of assessments confirm that the world’s wind resources are extremely large
and well distributed across almost all regions and countries. The total available resource
that is technically recoverable is estimated to be 53,000 Terawatt hours (TWh)/year. This is
over twice as large as the projection for the world’s entire electricity demand in 2020 [11].
Future electricity demand is assessed regularly by the International Energy Agency.
The IEA’s 2002 World Energy Outlook assessment shows that by 2020, total world
demand will reach 25,578 TWh. For wind power to meet 12% of global consumption it will
therefore need to generate an output in the range of 3,000 TWh/year by 2020 [11].
According to the Commission’s (IEA) “EU Energy Outlook to 2020” study, the use of
electricity is expected to expand by 1.7 % per year over the period 1995–2020. Total power
capacity requirements are expected to increase by some 300 GW during this period and a
similar amount of new capacity will be required for the replacement of decommissioned
plants. Thus, the EU is projected to build approximately 600 GW of new plants over the
1995–2020 period. At the same time, the European Parliament in 1998 has set the goal of
doubling Renewable Generation in Europe from 6 % of the gross energy consumption to
12% by 2010. It is estimated that this development will have the following effects [13].
• Total avoided fuel cost (1997–2010) 21 billion Euros.
• Half a million new jobs created.
• Reduction of fuel imports by 17.4% compared to 1994.
• Reduction in CO emissions up to 402 million tons per year compared to 1997 [17].
It should be noted that this 12% share of total renewable energy sources in the gross
inland energy consumption is translated into a 22.1% for consumption of electricity
produced from renewable energy sources or 12.5% excluding large hydro schemes, above
10MW [13].
2.1.3 Environmental Benefits
The excepted growth of renewable energy is being driven by environmental, social,
political and economic concerns. A reduction in the levels of carbon dioxide being emitted
into the world’s atmosphere is an important environmental benefit from wind power
generation. Carbon dioxide is the gas largely responsible for exacerbating the greenhouse
22
effect, leading to the disastrous consequences of global climate change. On the assumption
that the average value for carbon dioxide saved by switching to wind power is 600 tonnes
per GWh, the annual saving under this scenario will be 1,813 million tonnes of 2CO by
2020 and 4,860 million tonnes by 2040. The cumulative savings would be 10,921 million
tonnes of 2CO by 2020 and 85,911 million tonnes by 2040 [11].
2.1.4 Costs
With wind energy, and many other renewables, the fuel is free. Therefore once the
project has been paid for, the only costs are operation and maintenance and fixed costs,
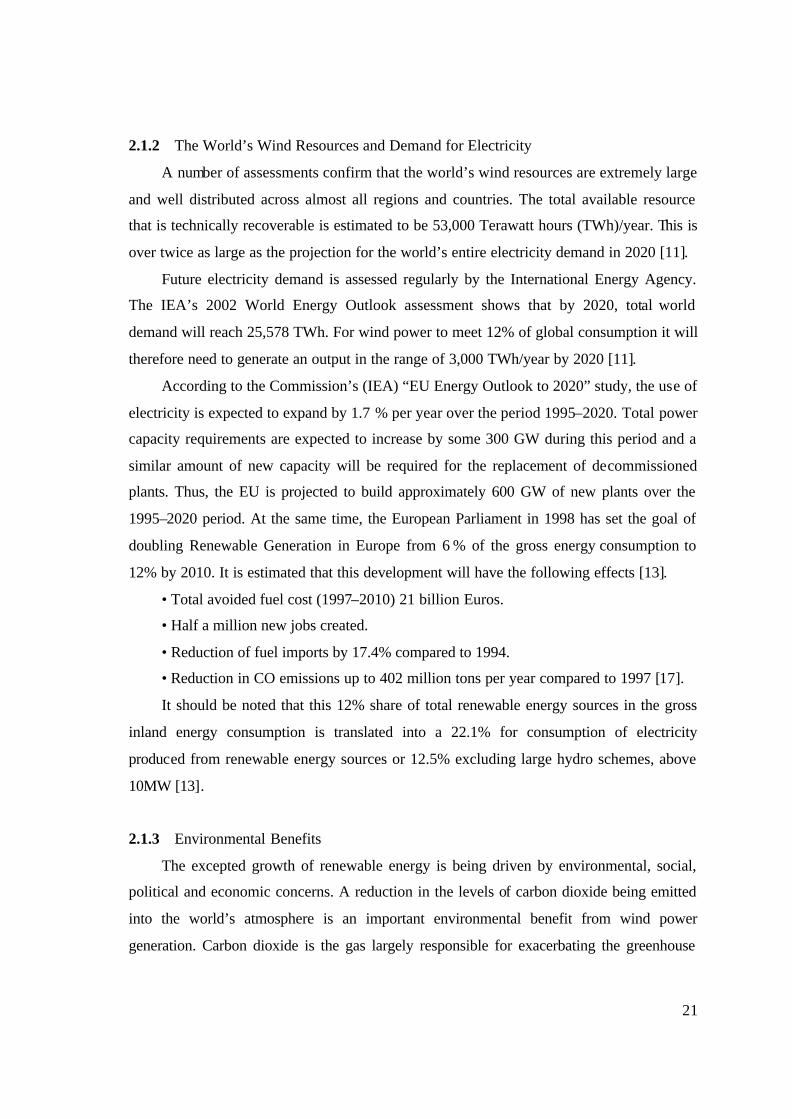
such as land rental. The capital cost is high, between 75% and 90% of the total [18].
The capital cost breakdown of a typical 5 MW project is shown below.
Figure 2-1 The capital cost breakdown of a typical 5 MW [18]
Although the cost varies between different countries, the trend everywhere is the same
wind energy is getting cheaper. The cost is coming down for various reasons. The turbines
themselves are getting cheaper as technology improves and the components can be made
more economically. The productivity of these newer designs is also better, so more
electricity is produced from more cost-effective turbines. There is also a trend towards
larger machines. This reduces infrastructure costs, as fewer turbines are needed for the
same output.
23
The cost of financing is also falling as lenders gain confidence in the technology.
Wind power should become even more competitive as the cost of using conventional
energy technologies rises [18].
Onshore wind plant costs have fallen substantially during the last decade. On good
sites wind is already competitive with new coal-fired plants and in some locations can
challenge gas.
The production cost of a wind power has fallen by 20% over the past five years alone
due to lower turbine costs, higher efficiency and availability and lo wer operation and
maintenance costs. And in operation period, wind power is free from fuel price fluctuations
and secure of supply concerns.
Using the progress assumptions already discussed, and taking into account
improvements both in the average size of turbines and in their capacity factor, the cost per
kilowatt hour of installed wind capacity is expected to have fallen to 2.93 €cents/kWh by
2010, assuming a cost per installed kilowatt of €623. By 2020 it is expected to have
reduced to 2.34 €cents/kWh, with an installation cost of €497/kW – a substantial reduction
of 40% compared with 2002 [11, 15].
Costs are sensitive to wind speed, discount rate and other variables and there is a wide
range in existing wind farms. It is particularly important to note that cost falls rapidly with
wind speed because power output from wind turbines rises with the cube of the wind speed.
For this reason, wind farms at the windiest sites are already close to cost competitive with
the average costs of conventional power [12]. Wind power costs are also expected to look
increasingly attractive when compared with other power technologies especially when
external costs are taken into account.
The booming wind energy business has attracted the serious attention of the banking
and investment market, with new players such as oil companies entering the market.
Booming wind energy markets are found in Germany, Spain, Denmark, the US and India.
Two thirds of wind power installed in 2001 was in Europe. A new market sector is
emerging offshore, with more than 20,000 MW of wind farms proposed in the seas around
Northern Europe [19].
24
Wind-based electricity is not yet generally competitive with alternate sources of
electricity such as fossil fuels. Thus, it is dependent on nonmarket support for development
to take place [20].
In order to promote renewable energy, countries in both Europe and elsewhere have
adopted a variety of policy mechanisms. These range from premium payments per unit of
output to more complex mechanisms based on an obligation on power suppliers to source a
rising percentage of their supply from renewables [11].
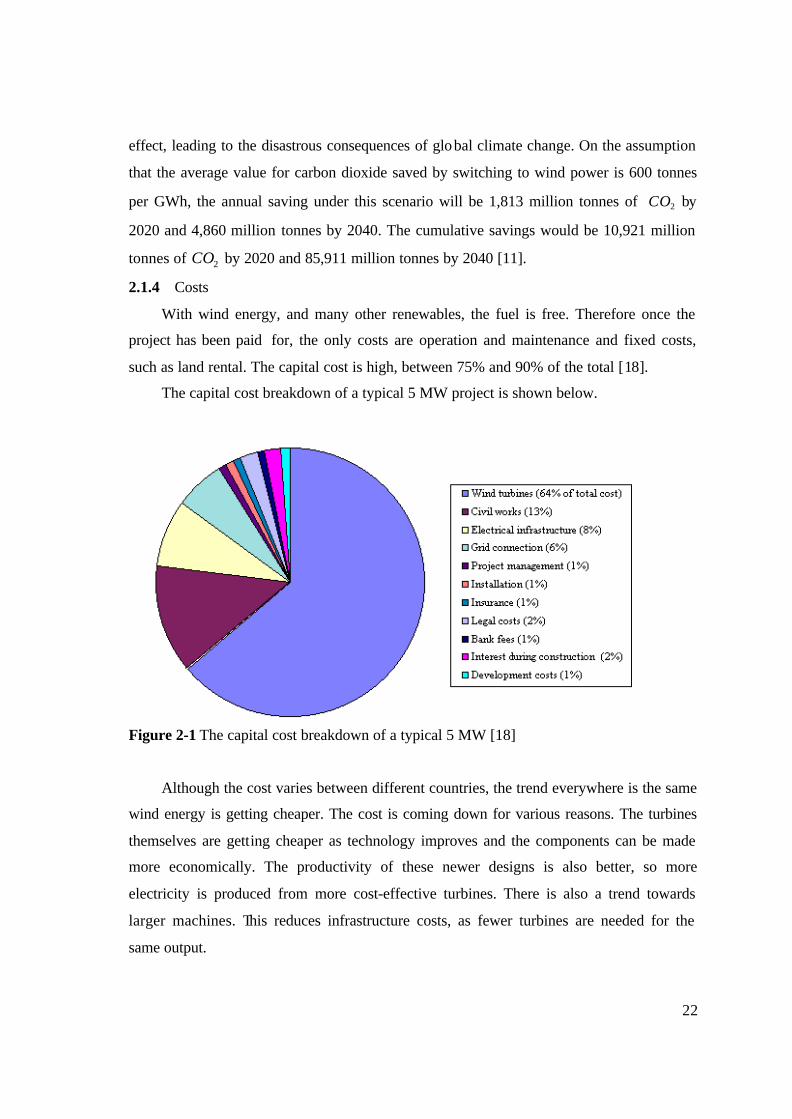
Figure 2-2 Total world wind power generation, by region [16]
The countries with most wind power capacity are Germany - by far the largest, with
just over 12,000 MW - followed by Spain, the United States, Denmark, and India [16].
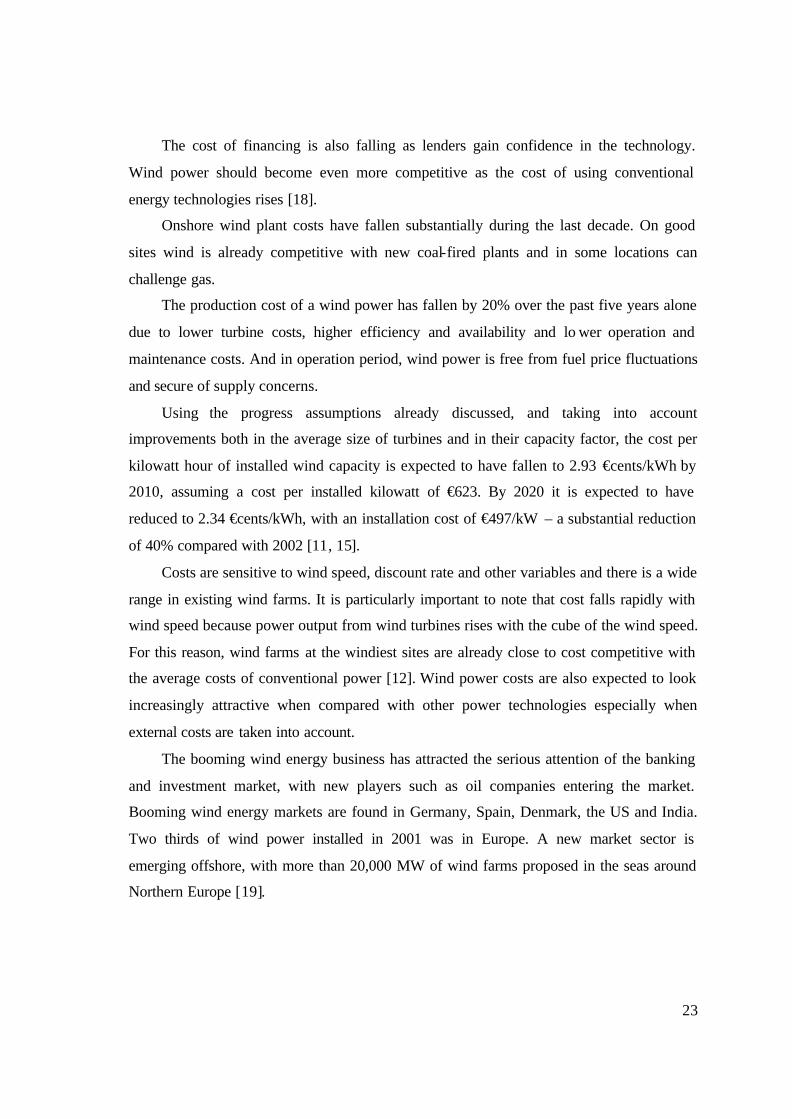
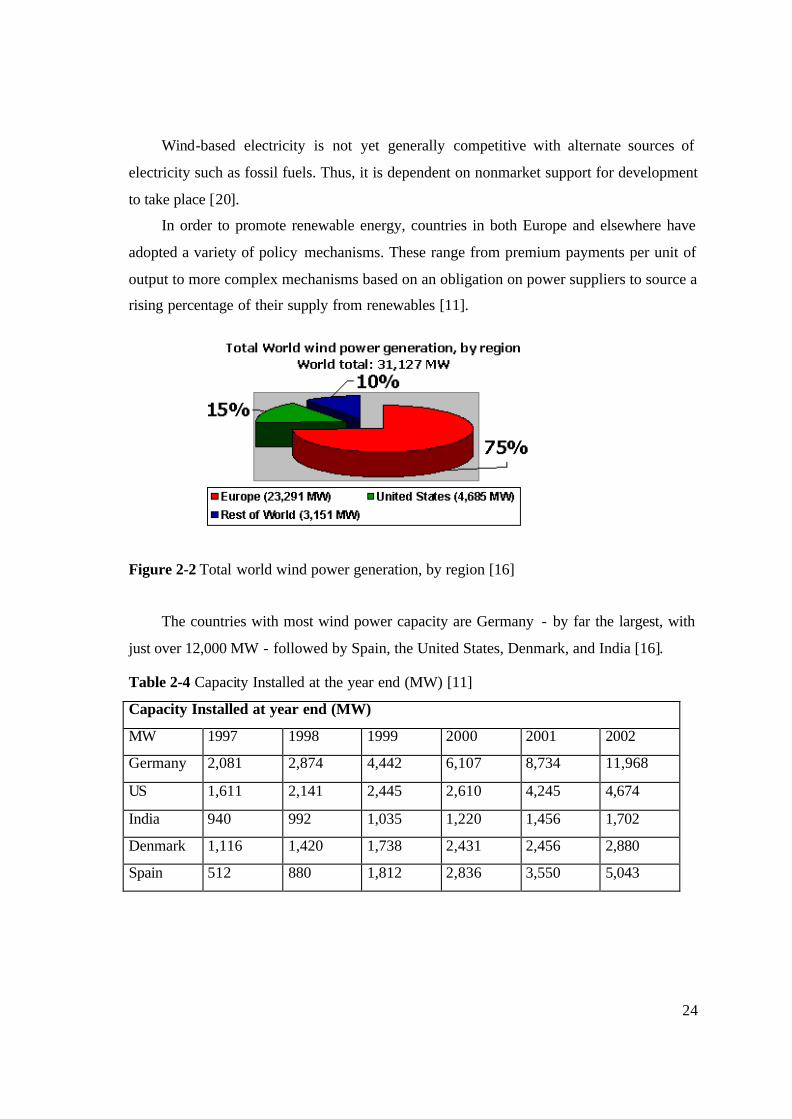
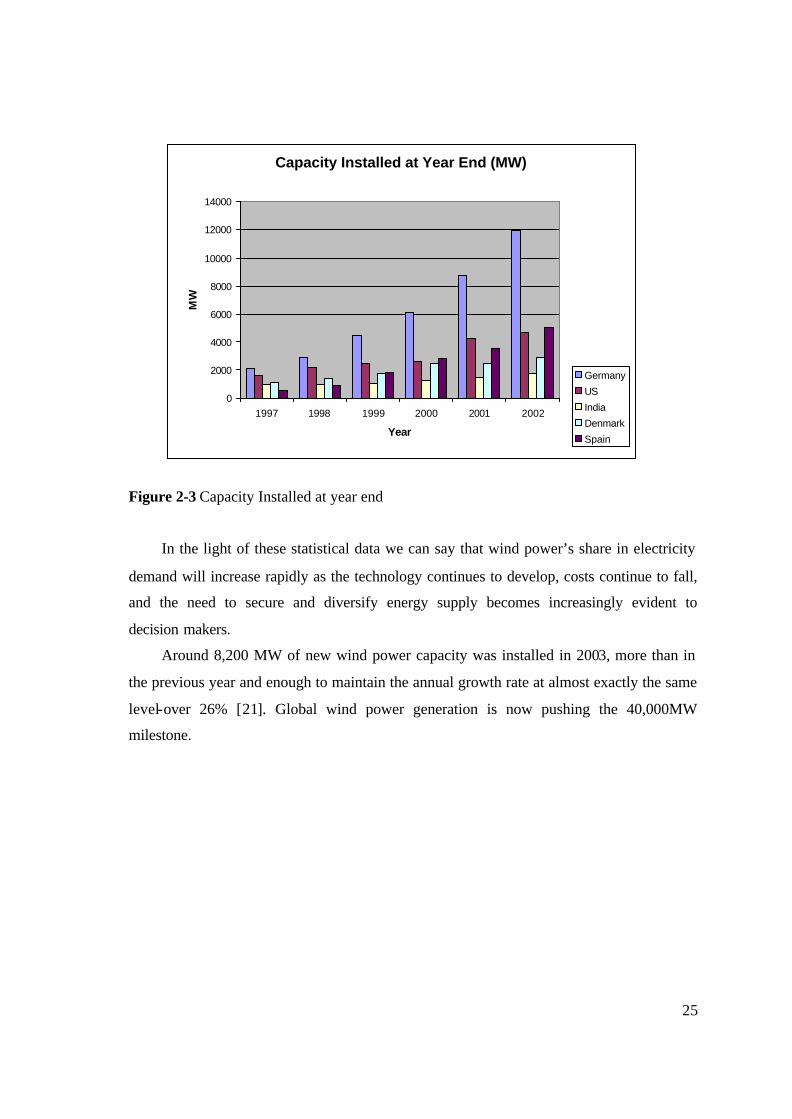
Table 2-4 Capacity Installed at the year end (MW) [11]
Capacity Installed at year end (MW)
MW 1997 1998 1999 2000 2001 2002
Germany 2,081 2,874 4,442 6,107 8,734 11,968
US 1,611 2,141 2,445 2,610 4,245 4,674
India 940 992 1,035 1,220 1,456 1,702
Denmark 1,116 1,420 1,738 2,431 2,456 2,880
Spain 512 880 1,812 2,836 3,550 5,043
25
Capacity Installed at Year End (MW)
0
2000
4000
6000
8000
10000
12000
14000
1997 1998 1999 2000 2001 2002
Year
MW
Germany
US
India
Denmark
Spain
Figure 2-3 Capacity Installed at year end
In the light of these statistical data we can say that wind power’s share in electricity
demand will increase rapidly as the technology continues to develop, costs continue to fall,
and the need to secure and diversify energy supply becomes increasingly evident to
decision makers.
Around 8,200 MW of new wind power capacity was installed in 2003, more than in
the previous year and enough to maintain the annual growth rate at almost exactly the same
level-over 26% [21]. Global wind power generation is now pushing the 40,000MW
milestone.
26
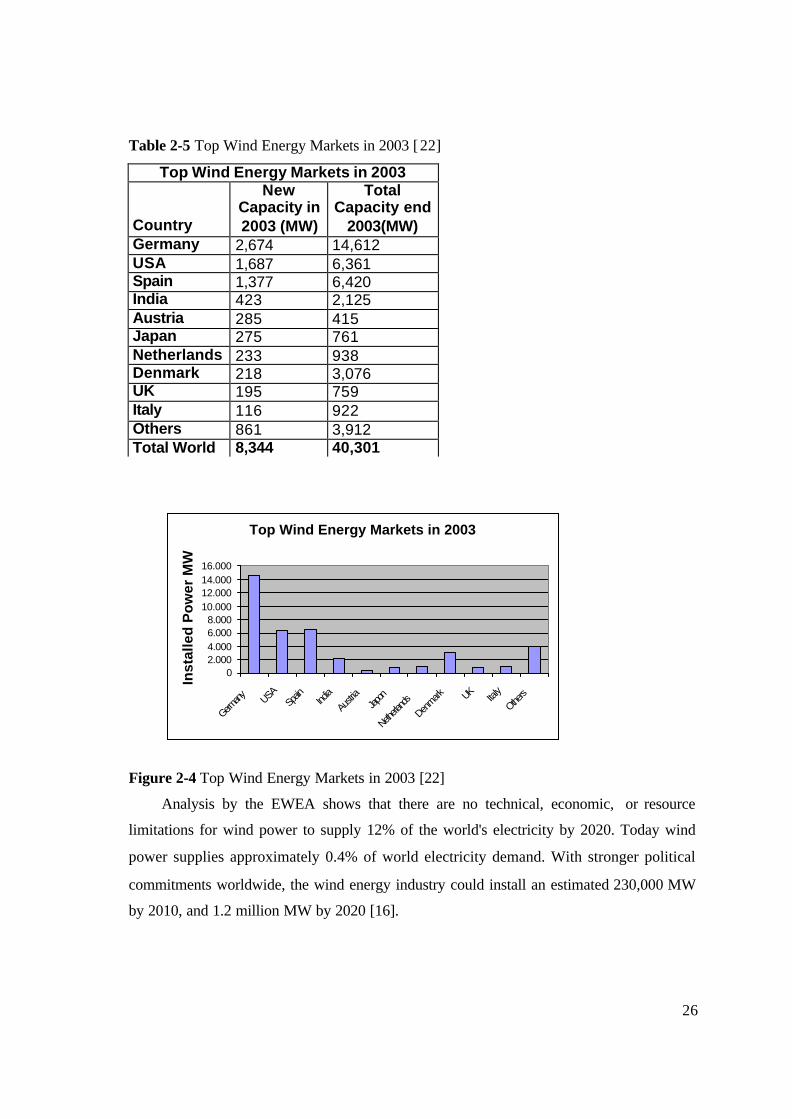
Table 2-5 Top Wind Energy Markets in 2003 [22]
Top Wind Energy Markets in 2003
Country
New Capacity in 2003 (MW)
Total Capacity end
2003(MW) Germany 2,674 14,612 USA 1,687 6,361 Spain 1,377 6,420 India 423 2,125 Austria 285 415 Japan 275 761 Netherlands 233 938 Denmark 218 3,076 UK 195 759 Italy 116 922 Others 861 3,912 Total World 8,344 40,301
Top Wind Energy Markets in 2003
02.0004.0006.0008.000
10.00012.00014.00016.000
Germany USA
Spain Ind
ia
Austr
iaJap
on
Nethe
rlands
Denmark UK Ita
ly
Others
Inst
alle
d P
ow
er M
W
Figure 2-4 Top Wind Energy Markets in 2003 [22]
Analysis by the EWEA shows that there are no technical, economic, or resource
limitations for wind power to supply 12% of the world's electricity by 2020. Today wind
power supplies approximately 0.4% of world electricity demand. With stronger political
commitments worldwide, the wind energy industry could install an estimated 230,000 MW
by 2010, and 1.2 million MW by 2020 [16].
27
2.2 Energy in Turkey
2.2.1 An Overview of Turkish Energy Sector
Turkey is a rapidly growing country, both in economic and population sense, with
8.5% economic growth rate and 1.5% population growth rate. In parallel, it is one of the
fastest growing electricity and natural gas markets in the world.
During the past 20 years the electricity market in Turkey was one of the fastest
growing in the world. The International Energy Agency estimated growth in consumption
between 1973 and 1995 at on average 9 % - 10 % per year. Despite the major economic
crisis under which the country has been suffering since the end of 2000, a barely inhibited
growth in demand is expected for the coming decade too [23,24].
Turkey is an energy importer. The energy consumption of the country which was
79,600,000 Tons of equivalent petroleum in 2000 is increasing every year. The energy
consumption was 128,500,000,000 kWh in 2000 while 3,800,000,000 kWh of this
consumption was imported [15].
In 2001, the total installed capacity of the power plants reached 28,318MW, but
because of the insufficient water supply in the dam reservoirs and decreasing utilization
capacity of hydro electricity power plants, the actual production was 123 billion kWh,
whereas the average production capacity of power plants increased to 151.4 billion kWh.
Net electricity imports, which were 3 billion kWh in 1998 and 2 billion in 1999, realized
around 3.8 billion kWh in 2000 [25]. In 2002, the total installed and average production
capacity of power plants increased to 31,845.6MW and 122.724 billion kWh respectively.
According to State Institute of Statistics (SIS), Turkey’s population of more than 65
million is growing at an annual rate of 1.7% and expected to grow to 83.4 million in 2022,
with an annual growth rate decelerating to 1% over the next 20 years. Turkey's rapid
growth in electricity demand is expected to continue for the foreseeable future.
28
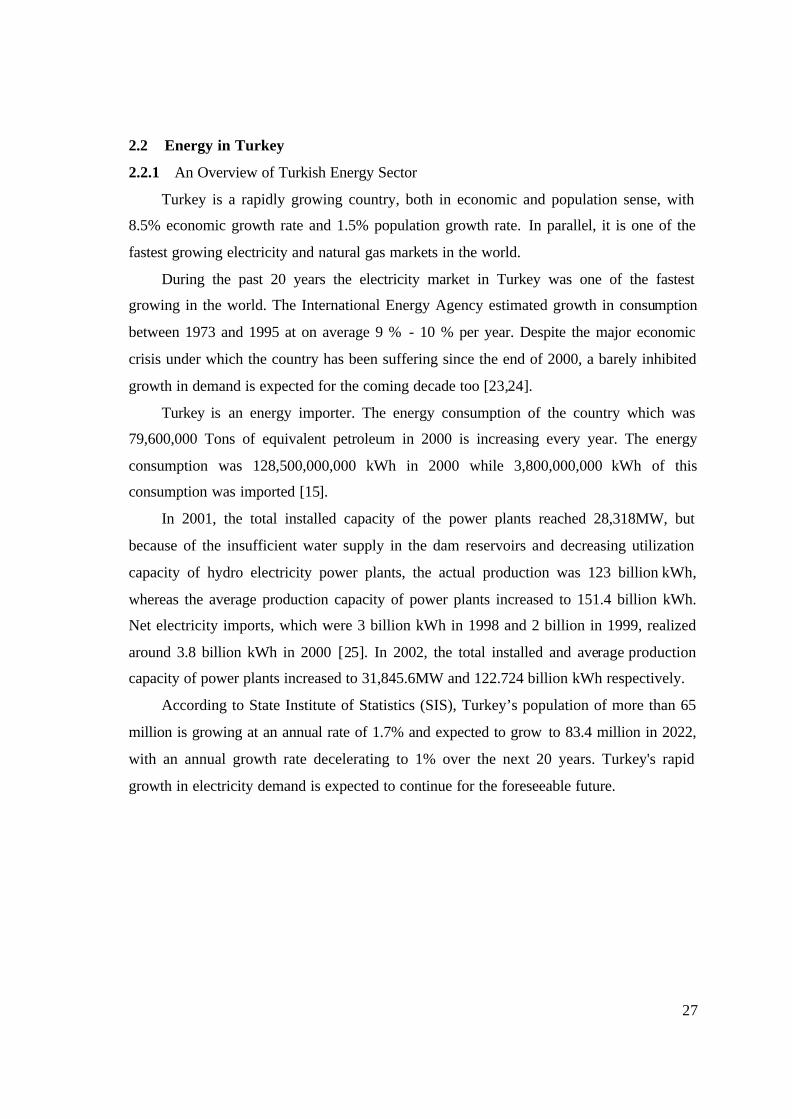
Figure 2-5 Annual Development of Turkey’s Installed Capacity
According to SIS, the electric production increased 8.5 percent in 2003 and the
production became 140.2 billion kWh. In respect to consumption the consumption rate
increased 7.5 percent and became 115.2 billion kWh. 78.8% of the production is met by the
thermal plants and 25.2% by hydroelectric plants. The wind energy is even much less then
1%. 44 % of the thermal plants use natural gas and according to the projections and this
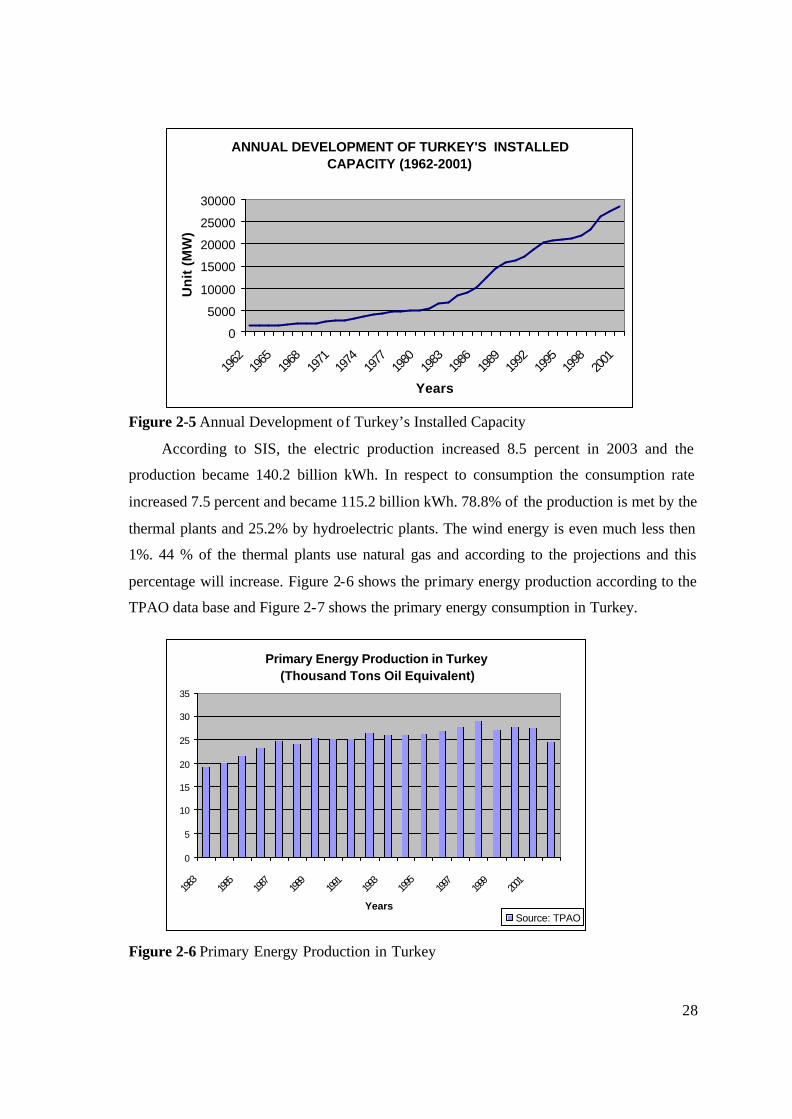
percentage will increase. Figure 2-6 shows the primary energy production according to the
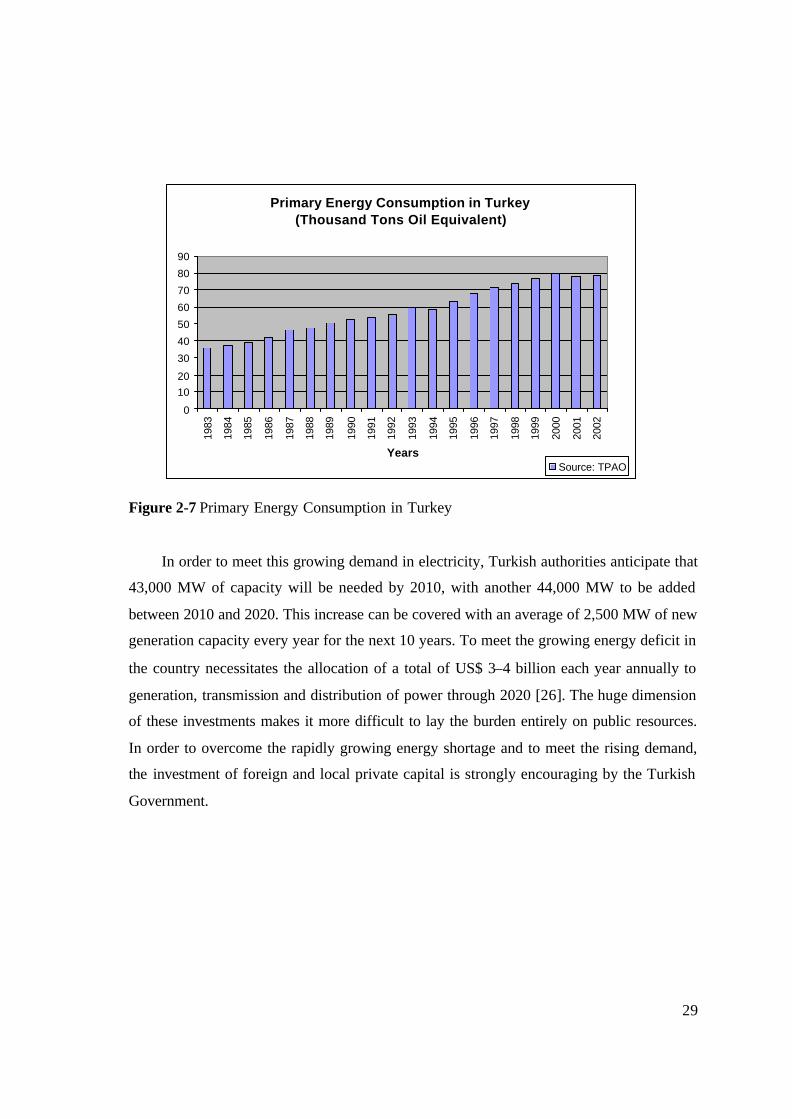
TPAO data base and Figure 2-7 shows the primary energy consumption in Turkey.
Figure 2-6 Primary Energy Production in Turkey
ANNUAL DEVELOPMENT OF TURKEY'S INSTALLED CAPACITY (1962-2001)
0
5000
10000
15000
20000
25000
30000
1962
1965
1968
1971
1974
1977
1980
1983
1986
1989
1992
1995
1998
2001
Years
Un
it (
MW
)
Primary Energy Production in Turkey (Thousand Tons Oil Equivalent)
0
5
10
15
20
25
30
35
1983
1985
1987
1989
1991
1993
1995
1997
1999
2001
YearsSource: TPAO
29
Primary Energy Consumption in Turkey (Thousand Tons Oil Equivalent)
0
1020
30
40
50
60
70
80
90
1983
1984
1985
1986
1987
1988
1989
1990
1991
1992
1993
1994
1995
1996
1997
1998
1999
2000
2001
2002
YearsSource: TPAO
Figure 2-7 Primary Energy Consumption in Turkey
In order to meet this growing demand in electricity, Turkish authorities anticipate that
43,000 MW of capacity will be needed by 2010, with another 44,000 MW to be added
between 2010 and 2020. This increase can be covered with an average of 2,500 MW of new
generation capacity every year for the next 10 years. To meet the growing energy deficit in
the country necessitates the allocation of a total of US$ 3–4 billion each year annually to
generation, transmission and distribution of power through 2020 [26]. The huge dimension
of these investments makes it more difficult to lay the burden entirely on public resources.
In order to overcome the rapidly growing energy shortage and to meet the rising demand,
the investment of foreign and local private capital is strongly encouraging by the Turkish
Government.
30
2.2.2 Energy Sector Regulations
Power production and construction activities have been controlled by state own
enterprises until 1984.
With regard to privatizatio n activities in the energy sector, Law No:3096 was issued
in 1984 to allow the domestic and foreign private sector to invest, operate and trade in the
power sector.
With this law, new methods for energy project financing and ownership had
implemented. Three models were developed: "Build-Operate-Transfer" (BOT), "Build-
Own-Operate" (BOO), and "Transfer of Operating Rights" (TOR).
BOT (Build-Operate -Transfer):
Under BOT model, private investors would finance construct and operate power plant
for a certain period of time (usually 15-20 years) sufficient to pay off the debt and pay the
equity, then finally transfer ownership back to the state. The investor does not own the
plant. The electric power produced by these projects could be sold to the national electricity
authority which is TEAS.
BOT model can not be considered as fully privatization because it is based on the
principle of private sector building and operating the power plant for an agreed term and
transferring the subject facilities to the state at the end of the term. It is rather a method of
financing and realization of energy projects via private sector.
Within the framework of the BOT model, 16 hydro-electric power plants, 4 natural
gas-burning power plants and 2 wind power plants, with the to tal installed capacity of
2,276 MWs have been put into operation. In addition, the construction of 4 hydro-electric
power plants, with the total installed capacity of 293 MWs, is ongoing [27].
TOR (Transfer of Operating Rights):
TOR is a similar concept for privatization. A private developer or consortium receives
a power plant in exchange for a transfer fee (usually set via a bid process), then operates
and maintains the facility as necessary during the predetermined transfer term. At the end
of that term, the power plant is transferred back to the state without any further cost or
additional requirements.
31
BOO (Built-Operate-Own):
As BOO does not impose any time constraints on the project, this approach has been
more favorably received by power developers. As a result, the economics of power
production is usually more favorable than for the BOT approach, which results in a lower
cost of power generation.
BOO is a true independent power producer model (IPP). The investor again plans,
builds and operates the power plant but sells the power directly to a consumer and/or to
TEAS/TEDAS. BOO does not apply to nuclear and renewables.
BO (Built,Own):
BO Law No.4282 was enacted in 1997 with the experience gained from the
implementation of the BOT model. This Law provides for the establishment and ownership
of thermal power plants by the private sector, excluding nuclear and renewable plants.
Autoproduction:
Industrial entrepreneurs are allowed to build their own combined power and heat
producing plant (cogeneration) just to meet their own power and heat requirement with the
Law No.3096 and related regulation dated 04/09/1985. Autoproducers can sell their excess
to the grid at a price not to exceed 85% of the average selling price of distribution
companies to end-consumers excluding taxes and TEDAS (now TETTAS) is obligated to
purchase the surplus electricity generated by Autoproducer.
New Regulations:
The regulatory reform in the electricity and the natural gas sector has been launched
by the enactment of the Electricity Market Law ,No.4628, in March 3,2001 and has been
continued by the enactment of the Natural Gas Law ,No.4646, in May 2,2001.
In the lights of the recent changes in the legislation:
1. International arbitration is allowed for settlement of disputes.
2. The authority of the High Council has been limited to giving an advisory
opinion about concession contract and agreements within two months, rather
than a binding decision.
32
3. Electricity production and distribution projects included the BOT scheme and
BOT contracts are not considered as concession contracts, but private law
contracts.
4. An independent Energy Market Regulatory Authority (EMRA) has been set up
which will undertake a monitoring and auditing of electricity and gas sectors
on behalf of public in accordance with the new legal framework and ensuring
the formation of Energy Market Regulatory Board which will represent and
govern the Energy Market Regulatory Authority.
5. Liberalization of electricity and gas sectors in harmonization with the EU
Electricity and Gas Directives and opening of these sectors to competition was
ensured.
6. The monopolistic position of BOTAS in the gas sector was removed. The
Turkish Electricity Generation and Transmission Company has been divided
into three enterprises [25].
The law paves the way for a free market in power generation and distribution in the
country.
In summary, the new Laws include the following key elements:
• an autonomous Energy Market Regulatory Authority, governed by a Board,
• a new licensing framework for market participants,
• an energy market, to be comprised of bilateral contracts between market participants,
• a cost-reflecting structure for pricing,
• an eligible consumer concept (eligible consumers to be free to choose their
suppliers),
• a transition mechanism to be implemented over a two year program for the
electricity sector and a 1.5 year program for the gas sector [27].
Among other things, the legislation calls for: 1) TEAS to be broken up into separate
generation, distribution, and trade companies; 2) trade and generation companies to be
privatized, while transmission remains in state hands; and 3) a new regulatory board to be
set up which will oversee the Turkish power market, set tariffs, issue licenses, and prevent
uncompetitive practices [28].
This law sets up a path toward a free market in power generation and distribution.
33
The state-owned power company, TEAS, was split into three entities in October 2001.
Following the ‘unbundling’, three new companies have been established: the Electricity
Generation Corp. (TEÜAS); the Turkish Electricity Transmission Corp. (TEIAS); and the
Turkish Electricity Trading and Contracting Corp (TETTAS).
Each activity in the electricity market, such as generation, transmission and
distribution of electricity, trade and autonomous production, must be licensed by the
regulatory authority. Licenses are awarded for a maximum of 49 years. The statutory
minimum duration for production, carriage and distribution license is 10 years. Within the
framework of a production license generating companies are allowed to hold shares in
distribution companies too [23].
The market structure put in place with the new law is in many aspects fundamentally
different from the previous monopolistic and centralized regime. The new structure calls
for a dually competitive environment where there are nor state guarantees whatsoever. And
the licensing regime which stipulates competition in the market as opposed to competition
for the market [27].
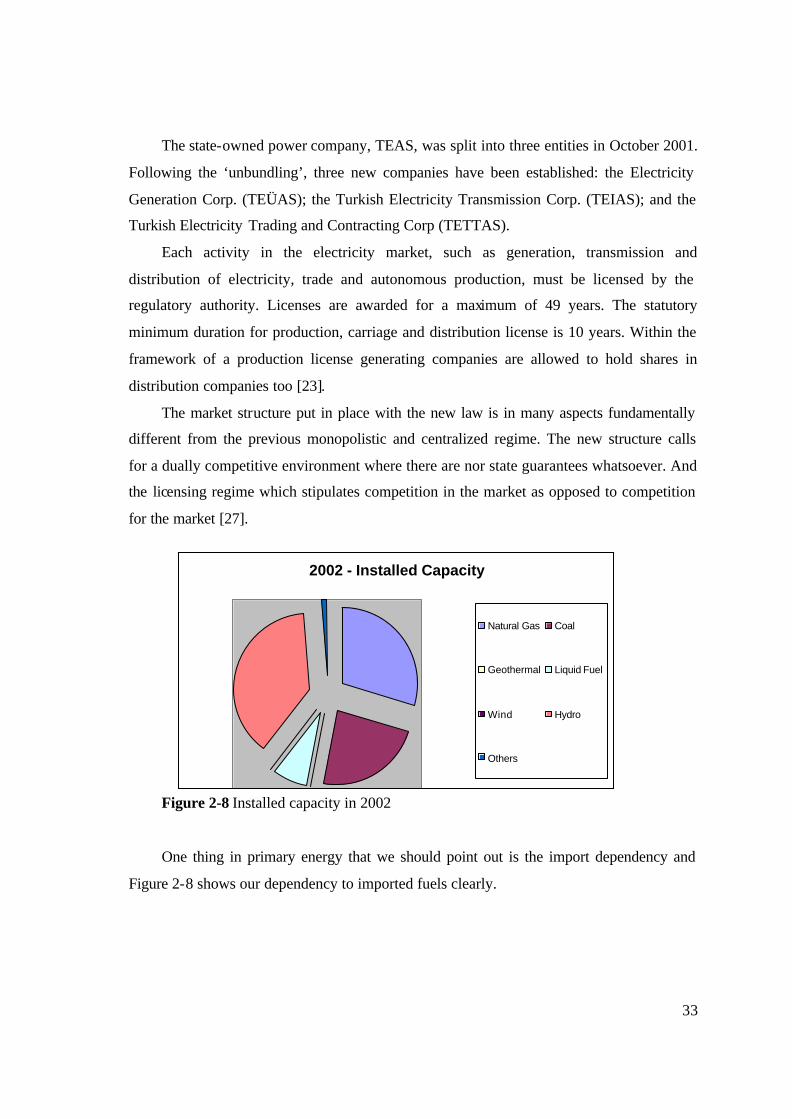
Figure 2-8 Installed capacity in 2002
One thing in primary energy that we should point out is the import dependency and
Figure 2-8 shows our dependency to imported fuels clearly.
2002 - Installed Capacity
Natural Gas Coal
Geothermal Liquid Fuel
Wind Hydro
Others
34
2.2.3 Wind Energy
Turkey has a considerable potential for electricity generation from wind. A study
carried out in 2002 concluded that Turkey has a theoretical wind energy potential of nearly
90,000 MW and an economical wind energy potential of about 10,000 MW. The most
promising region is in northwest Turkey, including the area around the Sea of Marmara
[29].
Although Turkey has huge amount of wind potential, the installed wind energy
capacity is only 18.9MW. The first turbines erected in Çesme- Germiyan with 1.5MW
capacity. Three 500kW Enercon turbines were commissioned as autoproducer, under the
law 3096, in 1998.
The first BOT wind farm, ARES, was erected Çesme-Alacati and commissioned in
November 1998.The facility has 12 Vestas turbines with 600kW nominal power for a total
capacity of 7.2 MW. The annual production of the site is about 20,000,000 kWh.
The second BOT wind farm, BORES, is located in Bozcaada. The wind farm is in
operation since 2000; it has 17 Enercon turbines for a total capacity of 10.2 MW. The
annual energy production is about 40,000,000 kWh [15].
35
Chapter 3
GUIDELINE FOR WIND ENERGY PROJECTS This chapter explains the steps that should be taken to develop a successful wind
turbine generator project. But it is not possible to show in detail, so the chapter provides a
summary for activities to be done. In another words, although each wind project is unique
and have different characteristics, it is possible to describe the basic features of a wind
project and the steps that developers have to take to get a project realized. This is important
to understand all the issues if a new wind project is to be successfully completed. In
practice, the steps are iterative and overlap one another to a greater or lesser extent,
depending on the specific project circumstances.
Another aspect for successful project development is professional support. Part or
potentially all the work involved can be contracted out to an engineering company
specialized in wind energy. Involvement of professional support is important for financing.
Each planning step should be used to reveal, manage and resolve the risk factors for
subsequent steps.
Developing a wind project is a complicated and time-consuming process involving
developers, landowners, utilities, the public and various local and state agencies. [ 30]
The key steps of development and planning for a wind farm are:
• Site Selection
• Ministry of Energy and Natural Resources (MENR) Permit Application
• Feasibility
• Detailed Assessment
• Energy Market Regulatory Authority(EMRA) License Application
• Construction
• Operation
• Decommissioning
36
3.1 Phase1: Site Selection
The first phase in any wind generation development is to identify a suitable site for the
turbines. For many developers the starting point of this process involves looking at a
chosen area in order to identify one or more sites which may be suitable for development.
The purpose of this phase is to identify suitable sites and define any technical, commercial
or environme ntal constraints in order that only the most appropriate sites are taken forward
[31]. For successful development, the site selection process should satisfy five crucial
technical criteria for successful development
1. Potential Wind Resource
2. Potential Size of Site
3. Electrical Interconnection
4. Land Ownership and Current Usage
5. Construction Issues
Finding a suitable site needs both on site and desk study. “Desk-based” studies to
determine whether sites satisfy crucial technical criteria for successful development. The
developer need to study topographic and electrical power maps of the local area. Site visit
is also necessary, for the developer to collect general information like obvious signs of
strong winds (e.g. flagged trees….etc.), the accessibility of the terrain and proximity to the
transmission line. A site is selected for further investigation if the preliminary study reveals
promising economic potential and an absence of major environmental and technical
constraints [32].
3.1.1 Potential Wind Resource
After finding a potentially suitable site, the developer gets permission to erect masts
for making site-specific wind measurements. At least one year data is required to determine
the average annual wind speed of the site. Wind data is required to determine the average
annual wind speed of the site. If wind data show that the site has economic potential for
energy generation, the developer will prepare micro sitting, which shows where to put the
turbines [29].
Wind speed and proximity to the grid are the most important variables affecting wind
farm economics. So if long term wind data from the nearest measurement station is
available, these data have to be studied.
37
According to the Australian Wind Energy Association, with current wind turbine
technology and Australian costs, a wind speed of around 6 m/s is considered the viable
minimum. But this consideration changes for all countries. For Turkey, this speed is around
7m/s.
3.1.2 Potential Size of Site:
Consideration of the likely size of the site will help to establish whether the
development will be commercially viable [33].
Long transmission lines can add to development cost and may eliminate a site, despite
promising wind speeds. An examination of the local electricity distribution system and
dialogue with the local electricity company will indicate whether an electrical connection to
the proposed site is technically and commercially feasible (this only applies to projects
which are to be connected to the grid). Information about the electrical grid in the area, map
of electric lines and connection possibilities, can be obtained with the electrical company in
the area [31].
3.1.3 Electrical Interconnection:
An examination of the grid connection (the local electricity distribution system) will
indicate whether an electrical connection to the site is technically and commercially
feasible. The capacity of the grid to accept the output of wind farms are limited, this limit is
5% of the short cut power. So the developer should also be aware of the potential impacts
of other wind farm developments [33]. A study of the local road network will give an idea
of the likely access constraints to the proposed site.
3.1.4 Land Ownership and Current Usage:
Another aspect is consideration of site ownership. Land is often subject to conflicting
utilization pressures, in this respect the profile of existing land use should be checked at
this early point.
Gaining the approval of the EMRA is a major consultative milestone. The developer’s
risk is significantly mitigated once the License is ‘in the bag’. Finance can then be released
to perform a more detailed site assessment.
One of the key input to the MENR is the Ministry of Environment’s statement and
approval. For instance, the proposed site may be in an area of outstanding natural heritage
value.
38
After the approval of Ministry of Environment, the developers ask MENR to do the
expropriation. The expropriation will be done by the MENR on behalf of the developer.
Developers should consider the number of landowners likely to be involved in the
development and their current and future options for usage of the land.
Environmental Considerations are also subject to the site selection. It is critical to
reveal any major environmental issues that could impact the acceptability of the
development. For instance, the proposed site may be in an area of outstanding natural
heritage value. They are also key input to the EMRA approval is the Ministry of the
Environment. The European Wind Energy Association recommends that an environmental
impact assessment study is conducted. As well as looking at reports and maps of the area in
order to determine specific technical or environmental issues, developers should have
regard to existing and emerging national, regional and local planning policies [31].
Visual aspects are also important in environmental considerations. Wind turbines
should not be located so close to domestic dwellings that they unreasonably affect the
amenity of such properties through noise, shadow flicker, visual domination or reflected
light [31].
The following factors should also be taken into account in site selection.
-Ecology
-Archaeological / historical heritage
-Recreational uses
-Civil and military airports
-Restricted areas
3.1.5 Construction Issues:
Construction is another issue for site selection. An overview of site access constraints
should be carried out. Most sites are far away from the urban life and often accessible by
narrow roads with sharp bends. This may make transportation of long wind turbine blades
difficult. Also gradients and dips in access roads may not be suitable for large plant
transportation. As a developer we should also be aware that at the location of each wind
turbine a handstand and flat lay down area will be required to position heavy lift cranes and
pre assemble turbine blades [33].
39
3.2 Phase2: Feasibility
On the contrary to Phase One, phase two will be focus on site visit and/or survey to
determine site’s further suitability and availability.
At the end of phase one, the developer had identified a site for further examination. In
Phase two, this site should then be subject to:
- a more detailed technical assessment including on-site wind monitoring;
- an economic assessment to establish the commercial viability of the project,
- an assessment of planning constraints;
- a risk analysis
for the installation:
-further consideration and evaluation of grid connection issues [6].
A full technical assay of the site is conducted to reveal the major engineering
considerations and environmental factors. From anemometry data, historic wind records
and topographical data, long term wind characteristics and power extraction can be
predicted. A network analysis is conducted to determine the impacts of embedding the
wind farm onto the grid, in terms of surrounding loads, capacity dynamics, constraints and
equipment upgrade. A geotechnical study is conducted to determine soil stability,
foundation requirements, drainage and potential erosion problems. The legal aspects of the
land allocated for the wind farm need ratification, particularly if there is conflicting
requirements for land use, or where pre-existing rights need to be regarded. Examples of
pre-existing rights include forestry property rights, easements, covenants and leases [32].
3.2.1 Wind Resource
Actual site measurements are vital for the wind projects. For the feasibility study
accurate determination of wind speed is needed. In general, the measurement of wind
speeds as close as possible to the hub height of a wind turbine is desirable. The cost of
tower increases with its height above ground level. Because of the high costs usually 30m
masts are used. One or more masts may be required and a typical bankable project requires
energy prediction based on at least one year of data, at the hub height (or as near as
possible).
After recording on-site data (for at least one year), a long-term assessment is required
to remove uncertainty due to the annual wind resource viability. This is usually done by
40
comparing the data measured at the site, with the long-term records from the nearest
meteorological station [33].
3.2.2 Land Use and Ground Conditions
The existing uses of the land should be discussed. The legal aspects of the land have
to examine carefully. The availability of the land for wind farm must be approved by
Ministry of Environment and Forestry. The ownership of the land is also examined
carefully.
Turkey is in the middle of two different earthquake zones. So geotechnical
engineering investigations should be carried out on the site. This study has to be conducted
to determine soil stability, foundation requirements, drainage and potential erosion
problems. These investigations will help to assess whether construction of the foundations
for the wind turbines, the erection of the machines and the provision of access roads is
practical and economic. After micro-siting such investigations could be required at each
turbine location.
3.2.3 Energy Yield
Energy yield is an important input into the project layout. Today, special designed
computer modeling programs are used for mapping potential energy yield over the site.(eg:
Wasp, WindPro) [33]. Unlike conventional energy sources, generation from wind energy is
not continuous and constant. So a proper planning for turbine settlement is a must. Before
constructing a wind turbine, energy map would help developer to find the area which would
give maximum output.
3.2.4 Site Access
The construction of a wind energy project requires access by heavy goods vehicles to
the site. Access to the site must be assessed to determine the suitability of existing public
and private roads. And find out what improvements or special traffic control arrangements
may be required during construction [33].
Movement between turbines must be practical; therefore the route of onsite access
roads is also important. On site access roads should avoid steep gradients, not only because
of heavy vehicle considerations and also because of potential erosion issues.
41
3.2.5 Electrical Connection
In grid connected wind energy projects, the cost of connection to the network have a
significant affect on the projects’ capital cost. Because of the costs for connecting the wind
turbine generators to the electrical grid can vary a lot, despite promising wind speeds, long
transmission lines can add to development cost and may eliminate a site.
Developers should carry out sufficient electrical investigations to determine potential
cost implications of network interconnection and determine the distance to the nearest
connection point.
3.2.6 Draft project design
All of the factors considered to date should be taken into account in determining the
scale of the proposed wind energy project. However, at this stage, the developer will only
be able to consider a range of design and layout options. This should include potential
turbine sizes and numbers.
3.2.7 Economic Feasibility
All the steps we explained in Phase 2 are subject to decision making, but economic
analysis is also needed both for developers and financiers to decide. The preliminary study
would have given an indication of project viability. The purpose of this step is to evaluate
the economic feasibility of the proposed site to a level of accuracy required to gain investor
development approval.
The data from the comprehensive technical studies, combined with economic and
investment data are used for modeling over the anticipated lifetime of the wind farm to
assess its economic viability. This incorporates electricity purchase prices negotiated with
the utility.
3.3 Phase3: Detailed Assessment
If the information obtained from Phase 1 and 2 shows that proposed wind farm will be
viable in all aspects, the developer can implement Phase 3.
It is recommended to continue gathering wind data and to re-appraise the economic
viability of the project throughout Phase 3.
42
3.3.1 Selecting Appropriate Wind Turbine Generator
Equipment Selection:
In addition to the wind resource, the type of the equipment greatly affects the power
output. The swept area of a turbine rotor is a function of the square of the blade length so
even a small increase in blade length boosts energy capture and cost-effectiveness [33].
The wind speed profile will determine the choice for a wind turbine generator, while
the supply of wind influences the relative dimensions of the rotor, generator and shaft
height. In poor wind conditions a high shaft height and relative large rotor are necessary.
A number of factors will determine the selection of wind turbine generator for a given
site. The wind speed distribution of the site is one of the most important, which has a direct
relationship to the amount of electricity. The other most important factor is the power curve
of the turbine which affects the revenue (energy) that the site will generate [33].
3.3.2 Electrical Interconnection
Developers will need to continue dialogue with the distribution utility (in our case
TEDAS), to identify the significant technical, cost or schedule issues associated with
network interconnections. Power utilities have standards for voltage quality and reliability
of supply. Developers and turbine manufacturers have to examine these standards, in order
to prevent greater investment being made in the power supply system than is necessary to
accommodate wind turbine outputs.
3.3.3 Environmental Considerations:
During the feasibility stage developer should have consulted local or state authorities
on the scope of the environmental assessment that will be required. Where authorities
believe that the proposed wind farm could have significant effects on the environment by
virtue of factors such as its nature, size or location, a proponent may be required to submit a
formal environmental assessment, sometimes including an environmental management
plan. It is very important to seek advice from the planning authority, and/or planning
experts on the requirements of environmental impact assessment [33]. Environmental
considerations would not be discussed in this study. Only the topics which could be
considered in the environmental statement are given [31]. These are; visual and landscape
assessment; noise assessment; ecological assessment; archaeological and historical
assessment; hydrological assessment; interference with telecommunication systems; aircraft
43
safety; safety assessment; electrical connection; effects on the local economy; global
environmental effects; tourism and recreational effects; decommissioning.
3.4 Phase4: Development Application
In this phase, the detailed technical and environmental assessment would be
undertaken for the site and electrical grid extension works needed to accommodate the
development. If the site is stil l considered suitable, the developer should apply for the
license to EMRA. This process is explained in Chapter2 - the “Energy Sector Regulations”.
3.5 Phase5: Construction
Construction of a wind energy plant is respectively shorter than other energy
generation plants. It depends on its size and climate of the site. A wind project typically can
be built and operational within nine to eighteen months. But the conditions and obligations
of the developer doesn’t depend on the completion time.
Developers should refer back to the conditions and obligations under which
development permission has been granted and development approval conditions should be
covered during construction [33].
Wind facility construction requires heavy equipment, including bulldozers, grades,
trenching machines, concrete trucks, flat-bed trucks and large cranes. Construction
normally begins with grading and laying out the access roads and the service roads that run
to the wind turbines. After completing the roads, the concrete foundations for the turbine
towers and ancillary structures are excavated and poured. Foundation work is followed by
digging the trenches for the underground electrical cables, laying the electrical and
communication cables, and building the overhead collection system and substation. Next
activities include assembling and erecting the wind turbine towers, mounting the nacelles
on top of the tower, and attaching the rotors. Once the wind turbines are installed, the
electrical connections between the towers and the power collection system are made, and
the system is tested [30].
It may be beneficial for the developer to identify and individual with the overall
responsibility for site management, because there will be number of separate contractors
involved in the construc tion work of the project.
44
In the construction phase the developer will need to enter into a number of
construction agreements. Developer may need an expert in the management of engineering
contracts to provide financial and legal security to the project [33].
3.6 Phase6: Operation
The continuous satisfactory and continuous safe operation of the plant throughout the
project lifetime is developers and/or the owners and operators responsibility. He should
comply with all the facts and conditions of the development approval stipulations. The
main responsibility of the owner/operator in operation stage is formulating plans for
operations and maintenance of the farm (e.g. performance tests, availability tests,…etc.)
A wind facility requires few on-site personnel. Turbines operate automatically. Each
wind turbine is equipped with a computer for monitoring and controlling the activity of
turbine and also for monitoring wind conditions. The operators use these data for reporting
and diagnose the cause of any failure. The operator may restart the turbine directly from the
control facility. If he is unable to restart, then specially-trained mechanics are dispatched to
repair. By the monitoring system the operator can monitor the power output of each turbine
[30].
On going operations and maintenance of the wind farm can be outsourced and
contractual arrangements need to be made for outsourcing. This contract must include
issues of operational safety issues. Turbine manufacturers give this services but it may be a
time consuming and costly action if the manufacturer is at another country. It would be
preferable to have two maintenance contracts; one with a local maintenance company for
small failures and secondly with the manufacturer for scheduled maintenance and for major
breakdowns which shall need expertise [33].
3.7 Phase7: Decommissioning
NWCC defines repowering as follows: “Repowering of a wind facility entails the
removal of individual turbines which are then replaced with new equipment.” The
repowering can be possible only if the economics is supporting.
Another definition of decommissioning made by NWCC is; “The decommissioning of
a wind facility entails the dismantling and removal of all wind turbines and towers, as well
45
as the underground and overhead collection and transmission system. Typically, the
foundations for the towers and other structures are removed to a specified depth below the
ground surface. They all depend on the permits and terms of the land agreements.”
Wind farms typically have 20-25 years of design life and agreements are often made
on this basis. After the project time the owner/operator may update the wind turbines with
more efficient machines or remove them altogether. If the project is built as BOT then after
the design life, -20years-, mentioned in the agreements the owner of the wind farm will be
MENR and MENR would decide what to do. Neither of the wind projects completed their
design life in Turkey so it is not certain what MENR would do or decide.
The subject of decommissioning and site clearance should be adequately covered in
the planning conditions and/or planning agreements accompanying permission. However,
should the wind energy project cease to produce electricity for a specified period, the
owner/operator should remove all the turbines and return the site as closely as practicable to
its original state [31].
Unlike most power generation projects, wind turbines can be decommissioned easily
and rapidly. Despite this, developers still need to approach the issue of decommissioning
respons ibly. Notice should be given to the local planning authority in advance of
commencing decommissioning work [31].
Normally the scrap value of the turbines themselves will be sufficient to cover the
costs of their dismantling. Where this may not be the case, consideration should be given to
the setting aside of funds over the life of the project in order to ensure there will be enough
money available at the end of the project’s life to pay for decommissioning and other
reinstatement requirements [31].
46
Chapter 4
ECONOMIC ASSESSMENT OF WIND FARM PROJECTS
Despite of all positive environmental aspects which are related with the of use wind
energy cost effectiveness and reliability are the most characteristic attributes which
influence the readiness to invest into wind energy projects. Cost effectiveness of wind
energy projects depends on several parameters. These are the total investment cost of the
project, the operation and maintenance costs, the depreciation period and interest rates for
loans. Furthermore the ener gy yield which depends on the quality of the sites, the technical
availability of the turbines and the reliability of service staff have major influence on the
economical development of wind projects [34].
The electricity supply industry is highly capital intensive. It is probably more capital
intensive than any other sector, particularly in developing countries. Therefore, planning
and proper financial and economic evaluation of projects are important for rationalizing
investment and achieving economic efficiency. [35] The economic parameters and
important issues in financial evaluation are explained in this chapter.
A feasibility study is the due diligence that every company should do before starting
any project. It helps to avoid risk. Risk is an inescapab le fact of the business, but a well
prepared and researched study can help reduce the risk. The feasibility study should provide
all the data and details necessary to take a decision to invest in the project.
The background features; size and location of the facility, technical details, network
features, environmental impacts, timing of the project and implementation schedule; have
been well defined in the feasibility stage.
This study mainly concerned with the financial and economic evaluation of wind
energy projects to ensure their viability. However, it is essential to understand the impact of
the other four considerations in electrical power project feasibility. These are; the sector,
the market, technology and engineering analysis and management and manpower.
47
The generation cost of wind energy basically is determined by the following
parameters: [36]
§ total investment cost, which consists of production, transportation and erection
cost of wind turbines; project preparation costs (permits), cost of land, cost of
the infrastructure and suchlike;
§ operation and maintenance cost
§ average wind speed at the particular site and hub height
§ availability
§ technical life-time
§ amortization period
§ real interest rate.
The required capital cost includes the following elements:
1- Feasibility Study (1-10% of the total wind energy project cost) including:
- Site investigation
-Wind resource assessment and analysis
-Environmental assessment
-Preliminary design
-Detailed cost estimation
-Report preparation
-Project management
-Travel and accommodation
2- Development (1-10% of the total wind energy project cost) including:
-PPA negotiation
-Permits and approvals
-Land rights & land survey
-Financing
-Legal and accounting
-Project management
-Travel and accommodation
48
3- Engineering (1-10% of the total wind energy project cost) including:
-Micro-siting
-Mechanical design
-Electrical design
-Civil design
-Tenders and contracting
-Construction supervision
4- Renewable energy equipment (40-80% of the total wind energy project cost)
including:
-Wind turbine(s)
-Spare parts
-Transportation and installation
5- Balance of plant (10-30% of the total wind energy project cost) including:
-Wind turbine(s) foundation
-Wind turbine(s) erection
-Road construction
-Transmission line and substation
-Construction of operation and maintenance facilities
-Transportation
6- Miscellaneous (1-10% of the total wind energy project cost) including:
-Contingencies
-Personnel training etc.
-Interest during construction
-Commissioning
The annual costs associated with the operation of a WECS projects are:
-Spare parts (parts and labor)
- Operation and Maintenance (O&M)
-Contingencies
-Land Lease
-Property taxes
49
-Insurance Premium
-Transmission line maintenance
-Travel and accommodation
-General and administrative
There are two cost inputs to a wind developer or owner. The capital, or installed, costs
of the plant are primarily a function of the size of the installation (due to economies of
scale). Operating costs are the second input, and, similarly, depend on size, and may be
dependent also on capacity or energy yield.
It is estimated that wind power in many countries is already competitive with fossil
fuel and nuclear power if external and/or social costs are included. The wind as a fuel may
be free, but the equipment necessary to generate electricity from wind tends to be
expensive, so economic studies are quite important.
4.1 Capital Costs
The economy of a wind energy project depends primarily on the wind turbine (WT)
price and the energy yields. Also variables like additional capital expenses, subsidies,
reimbursement and constructive parameters of wind turbines influence the energy
generating costs.
The economics of wind energy differ significantly from country to country. There are
no absolutes in energy prices. No single number can be assigned to the price of wind
energy.
The unit cost of electricity can be determined from capital investment and operation
costs but the value of electricity is somewhat more difficult to determine. But it must be
calculated before investment decision made. In this thesis only the unit cost of electricity is
evaluated.
Wind turbine prices vary little with size, but there are sound reasons for pursuing the
development of large machines. The use of large machines means fewer are required for a
given capacity, and a number of items in the “balance of plant” cost category decrease with
machine size, or machine numbers, especially: foundation costs, electrical interconnection
costs and access tracks [35].
50
A wind turbine contains many components. Rotor, gearbox, generator, bedplate,
various sensors, controls, couplings, a brake and lightning protection are at the top of the
tower of a horizontal axis turbine. Transformers, switchgear, protective relays, controls are
at the foot of the tower.
To have a working system a distribution line, which connects the turbine to the utility
grid, land, an access road, control and O&M building are also required.
Some capital costs, such as distribution lines, land and access roads can vary widely
with the site.
Turbine costs include the following; purchase price of the turbine, shipping, import
duty, import broker fee, concrete and other foundation costs and labor.
The steady extension of wind energy use within the past years was accompanied by
new turbine generations. New generations with more installed power and improved
economy. The wind turbine prices decreased due to the serial production. But next to the
prices, the additional expenses are an essential factor of the economy of a wind energy
project. Such additional expenses could be: foundation costs, grid connection costs (e.g.
transformer, delivery station, grid reinforcement etc.) development of ground (drive ect.)
and planning costs. [37]
In Germany the additional expenses percentage referring to wind turbine prices are
foundation (7%), grid connection (17%), development of ground (2%), planning costs
(4%), sum of additional expenses (30%). Further costs which accrue regular due to the
operation of a wind turbine are the so called operation costs. This could be for example:
insurance, maintenance costs, costs of leased area, spare parts [38].
4.2 Operation and Maintenance (O&M)
Operational costs vary between countries and wind farms. As some elements are fixed
annual sums, wind farms on high wind speed sites may have lower costs. The main
components are; service, consumables, repair, insurance, administration, possible lease of
site, and so on.
Danish and German experiences indicate that the annual operation and maintenance
costs for new grid-connected wind turbines in the 0.5-1.5MW size range are approximately
0.5-0.9 US cents / kWh, of which half consists of insurance cost. For machines with over
10 years of operation these costs may go up to a level of 1.3-1.7/ US cents kWh [36].

51
Availability and thus energy production depends on reliability and accessibility of the
wind turbine installations. In particular, wind turbines located offshore and in mountainous
terrain are subject to potentially very high costs, through increased operation and
maintenance costs and loss of availability. In this respect, it is essential to accelerate the
development of early failure detection systems and systems to monitor machine condition.
These systems would be linked with planning systems for maintenance, and the data
obtained may be used as inputs to improve the reliability of the wind turbine design [39].
The annual O&M cost is often estimated as 3% of a wind turbine’s ex works cost.
Technical life time or designed life time for European machines is typically 20years.
Individual components are to be replaced or renewed in a shorter interval. Consumables
such as oil in gearbox, braking clutches, etc. are often replaced with intervals of 1 to 3
years. Parts of the yaw system are replaced in intervals of 5 years. Vital components
exposed to fatigue loads such as main bearings, bearings in gearbox and generator are
foreseen to be replaced halfway through the total design life time [3].
52
Chapter 5
ECONOMIC CONCEPTS: CONSIDERATIONS IN PROJECT
EVALUATION In order to compare the projects and make investment decisions, common units must
be used to express the outputs of each alternative before any comparison can be made.
Monetary units are the most commonly used units.
Some projects will provide outputs in the near future and other projects may delay
outputs for an appreciable time or distribute them uniformly over the project lifetime.
Outputs today do not have the same value as outputs tomorrow. Project owners and bankers
have different perspectives for evaluation while owner concerns only with the return to
equity, banker considers both equity and loans. Owners/Developers are mainly concerned
with cash flow and considers all money flowing in (income from sales) as positive and all
money flowing out (project cost, operation costs…etc) as negative. They are interested in
net benefits and net present values in comparison to the value of their investment (equity).
Banker’s point of view is different from a developer. The bankers analyze the project
for loan considerations. The banker evaluates the return on the total investment (equity plus
loan) and considers its profitability.
Despite different point of view, the important aim for all parties is to ensure that the
project is the least-cost alternative for attaining the required output. It is necessary to ensure
that a project is profitable and that its return is higher than the opportunity cost of capital.
The Electricity Supply Industry (ESI) is one of the best venues for using least-cost
solution techniques, since there is always more than one way in which a project can be
executed so that its benefits can be secured. Least-cost solutions aim to evaluate all realistic
alternatives, financially and economically, before deciding the alternative which can
achieve the project benefits at the least cost [40].
The aim of the least-cost solution is finding, technically and economically, the most
suitable alternative for the utility. In most electrical power engineering decisions, there is
more than one alternative for achieving the required result. The least-cost solution
considers all these alternatives and evaluates them. In choosing the least-cost solution the
decision makers are concerned with the differences in the present value of the cost of the
53
alternatives. In many cases, the outputs of each alternative are the same, as a result of
meeting the project objectives. But in wind energy projects, the output of different turbines
with the same installed capacity is different because of the technical considerations of the
turbines.
When there are differences in the amount of the energy output, the comparison can be
done by per discounted kWh of electricity output, through evaluating, the overall system of
the alternatives. The essential economic concepts and criteria which may lead to safe
conclusions with respect to the economic and financing viability in terms of investment and
operation of a Wind Energy Conversion System (WECS) at a given site with prescribed
wind and other relevant conditions are the following: Pay Back Period (PBP), Return of
Investment (ROI), Net Present Value (NPV), Internal Rate of Return (IRR), Benefit/ Cost
Ration (BCR) [41].
The computation of the PBP index is a useful approach to obtain a quick and
appropriate economic viability system evaluation, whereas the computation of the NPV,
IRR and BCR indicates constitutes a more accurate approach for a similar evaluation
procedure [41]. For an investment project to be properly evaluated, one must take into
account all the required initial investment cost elements for the WEC system and also the
costs and benefits associated with the operation etc. the system. Several methods can be
used to determine the financial benefit of a wind system investment.
Only the three important ones are considered in this study. These are; estimating the
payback period, IRR and NPV methods. These methods are more appropriate for grid-
connected systems than for remote, off-grid systems.
5.1 Net Present Value Method
“Time Value of Money” and “discounting” concepts have to be understood before
discussing Net Present Value.
5.1.1 Time Value of Money
Projects in the electricity supply industry live for a long time. Normal useful life of a
conventional power station is about 25-30 years and for a wind power project it is about 20-
25 years. For power generation projects most expenditure and income occurs after
commissioning. Such future financial flows will fluctuate according to time and
54
circumstances. Correspondingly, these will have a different financial value than flows
occurring during project evaluation. Therefore, the time value of money is highly important
for capital-intensive long life projects, like electricity supply industry [40].
5.1.2 Discounting
In general, financial flows occur after commissioning, they do not occur during
project evaluation. In evaluation stage, the project developers and decision makers have to
know if the project is feasible or not. So cash flow tables are important for developers for
decision making. But cash flows occurring at different times cannot be readily added, since
a dollar today is different from a dollar a year later. So before dealing with financial flows
occurring at different times, these have to be adjusted to the value of the base year.
Therefore, an important factor to be discussed in project evaluation is the time value of
money. The time value of money states that a dollar today is worth more than a dollar at
some time in the future.
There is variety of reasons for this: risk, inflation, opportunity cost, etc.
§ Inflation; future incomes are eroded by inflation
§ The existence of risk; an income or expenditure which occurs today is a sure
amount, future income or expenditure may vary from anticipated values;
§ The need for a return-by undertaking investment and forgoing expenditure
today, an investor expects to be rewarded by a return in the future [40].
An entrepreneur expects to gain a premium on his investment, to allow for the
following three factors: inflation, risk taking and the expectation of a real return. That is, he
expects to regain his money, plus a return, which tallies with the market and his estimation
of these three factors [40].
Money today will be more valuable than tomorrow’s money because of risk and
expectation of reward by foregoing today’s expenditure, even if inflation is ignored or
allowed. To an investor point of view, a dollar today is more valuable than tomorrow’s
dollar because it can be invested immediately and can earn a real income, that is, a return
higher than inflation. Today’s dollar will equal tomorrow’s dollar plus a real value.
Present valuing (discounting) is central to the financial and economic evaluation
process. Since most of the project costs, as well as benefits, occur in the future, it is
55
essential that these should be discounted to their present value (worth) to enable proper
evaluation [40].
nn rFPV
)1(1
.+
= (5.1)
where nF is future value and r is the discount rate.
Discount rate is the reward that investors demand for accepting a delayed payment. It
is also referred to as the rate of return or opportunity cost of capital.
The value of nr)1(
1+ is called discount factor. It is universal, with n positive for all
future years and negative (-n) for all past years financial outlays, with n=0 for the base
year.
It has to be emphasized that valuing is based on compounding returns. That is, the
expected return on the first year’s money is also added to the original investment and then
the sum reinvested at the same interest rate. This is different from simple return (simple
interest), where interest is only paid on the original investment. [40]
5.1.3 Net Present Value Calculation
Net present value is computed by assigning monetary values to benefits and costs,
discounting future benefits and costs using an appropriate discount rate, and subtracting the
sum total of discounted costs from the sum total of discounted benefits. Discounting
benefits and costs transforms gains and losses occurring in different time periods to a
common unit of measurement. Programs with positive net present value increase social
resources and are generally preferred [42].
The present value (PV) method aims at present valuing (discounting) all costs and
benefits of the project or cash flows (net benefits) to a specified date, the base year [40].
In this case, all cash flows prior to or after the base year are discounted to the base
year through multiplying by the discount factor [ ]nr)1(1 +÷ where n is negative for years
prior to the base year. All values are considered to occur at the year-end [40].
Cost (C) and benefit (B) are the two financial streams of the project along the life of
the project. Benefit item must contain all the benefits for the same estimated life frame of
the project.
56
The present value is the value at Year 0, with equal payments being made at the end
of each period. Economic alternatives can always be compared by examining the PV of
each scenario/alternative.
n
n
nv iii
AP)1(
1)1(+
−+=
(5.2)
where vP is present value, i the interest rate, nA end of period payments series of
payments and n is the period.
The cost stream, being outward flowing cash is regarded as negative. The difference
between the two streams is the net cash flow. The value of the net cash flows in certain
years can be negative, particularly during construction and the early years of the project.
Discounting the net benefits stream into its present value, by multiplying each year’s
net benefits, i.e. project income minus project cos t, by that year’s discount factor, will
present the net present value (NPV) of the project. Notice that outward flowing cash (costs)
is negative and inward flowing cash (income) is positive [40].
If the net result is higher than zero, this proves that the project will provide benefits
higher than the discount rate and is worthwhile undertaking.
The NPV method is a powerful indicator of the viability of projects. However, it has
its weakness in that it does not relate the net benefit gained to the capital investment and to
the time taken to achieve it. However, it is a very useful method for choosing the least-cost
solution, since it is the alternative which fulfils the exact project requirements, and has the
higher NPV that is preferred [40].
∑ +−=N
nnn rCBNPV )1/()(
(5.3)
where; NPV is net present value, nB benefit , nC : cost , n period and r the discount
rate.
One of the advantages of the NPV method is that is accounts for the time value of
money. The NPV method determines the worth of a project over time, in today’s dollars.
The greater the NPV value of a project, the more profitable it is. This method can be used
to rate and compare the profitability of several competing options [ 43].
57
Usually, projects are undertaken because they have a positive net present value. That
is, their return is higher than the discount rate, which is the opportunity cost of capital. The
calculation of net present value is the most important aspect in project evaluation and its
positive estimation, at the designated discount rate, is essential before undertaking a
project.
According to the literature surveyed the life cycle costs of a project and its feasibility
depends on 3 factors; the investment cost, the operational costs and the discount rate
utilized.
Many developers think that the discount rate is the most important of these three
factors. It greatly affects the whole economics of the project and the decision making,
particularly in capital intensive projects like those of electricity supply industry [40].
It greatly affects estimation of the net returns from the project during the evaluation
stage. Because of this, it is important in decision process. A high discount rate will favor
low capital cost with higher operational cost project alternatives. A low discount rate will
tend to weigh the decision in favor of the high capital cost and low operational cost
alternatives [40].
In spite of its crucial importance, we will not discuss ‘choice of the discount rate’. We
will take a specific discount rate and do the calculations according to this specific rate.
5.2 Internal Rate of Return (IRR)
Calculating the internal rate of return is a popular and widely used method in the
evaluation of projects. The internal rate of return (IRR) is that discount rate which equates
the two streams of costs and benefits of the project. Alternatively, it is the rate of return, r,
that project is going to generate provided the streams of costs ( nC ) and benefits ( nB ) of the
project materialize. It is also the rate r that would make the NPV of the project equal to
zero. [40]
∑ ∑ +=+ ])1/([])1/([ nn
nn rBrC (5.4)
where nC is the costs nB the benefits, r the discount rate and n the period.
If IRR is equal to or above the opportunity cost for a private project or the social
discount rate (as set by the government) in public projects, then the project is deemed a
worthwhile undertaking. Utilities, governments and development funds set their own
58
criteria for the opportunity cost of capital and for the social discount rate below which they
will not consider providing funds. Such criteria depend on the amount and availability of
required funds. Criteria also depend on the presence and expected return of alternative
projects in other sectors of the economy, the market rate of interest and the risk of the
project [40].
The main merit of the IRR is that it is an attribute of project evaluation. Its calculation
does not involve the estimation of a discount rate; therefore, the evaluator avoids the
tedious analysis [40].
Maximization of NPV while utilizing as a discount rate, the opportunity cost of capital
is the guiding principle for project evaluation. The internal rate of return is not the only
criterion for project evaluation for investment decision. NPV with a proper discount rate is
a criterion, when the discount rate reflects the true opportunity cost of capital [40].
5.3 Simple Payback Method
5.3.1 Payback Period
A common and simple way to evaluate the economic merit of an investment is to
calculate its payback period, or break-even time. The payback period is the number of years
of energy-cost savings it takes to recover an investment's initial cost. To determine the
payback, the investor first estimates the wind turbine's total initial cost, annual energy-cost
savings, and annual operating costs. Dividing total initial cost by the difference between
annual energy-cost savings and annual operating costs gives the payback period [44].
The payback period is the amount of time (usually measured in years) to recover the
initial investment in an opportunity. Unfortunately, the payback method doesn’t account for
savings that may continue from a project after the initial investment is paid back from the
profits of the project, but this method is helpful for a “first cut” analysis of a project [43].
If annual cash flows are equal, the payback period is found by dividing the initial
investment by the annual savings.
Payback Period= Initial Investment Cost
(in years) Annual Operating Savings (5.5)
Annual Operating Savings= Annual Energy Cost Savings – Annual Operating Costs (5.6)

59
Annual electric savings are the retail value of electricity from the wind system that
you would have otherwise bought from the utility company. It is determined that by
multiplying the retail cost of electricity given on your electric bill by the number of
kilowatt-hours the wind turbine is supposed to produce in a typical year [44].
60
Chapter 6
FINANCING WIND ENERGY PROJECTS Specifically with regard to financing wind energy, as the industry grows, the
investment requirement increases accordingly. The European Wind Energy Association
estimates the funding requirement will be around USD 125-140 billion over the next twenty
years [45].
Despite encouraging growth forecasts and a fair amount of enthusiasm, private
investment in the renewable energy sector is currently very modest and largely limited to
energy sector specialists. The industry is still heavily dependent on government and public
sector funding, and favorable political policies and framework conditions are still essential
for the commercialization of renewable energy [46].
Although many renewable energy companies are small players, the renewable
industry is growing rapidly, with established energy companies and financial institutions
entering the market. While the entry of large companies is improving the profile and
attractiveness of the renewable industry to more conservative investors, the investment
amounts are still smaller than fossil fuel exploration.
These are titled as enhancing domestic capital markets, accessing international capital
markets, enhancing public-private partnership, restructuring tariffs and reducing subsidies,
and lastly restructuring the power industry. The importance and priority of every each of
the items varies in accordance with the conditions to specific country [45].
Sources of finance and financing methods, which are used by these agencies, are listed
below [47 ,48];
6.1 Sources of Finance
− Private Equity Funds-Equity
− Banks- Loan, Bond
− Export Credit Agencies (ECA’s) – Loan
− Multilateral Lending Agencies (MLA’s) – Loan, Equity
− Leasing Companies – Loan
− Vendor Financing – Loan
61
− Securitization – Loan
− Institutional Investors – Bond, Equity
− High Net Worth Individual Investors – Bond, Equity
− Host Governments – Loan, Equity
6.2 Financing Methods
The financing methods for energy projects are:
− Project Finance
− Balance Sheet Finance
− Sale and Lease Back
− Mortgaging
− Cooperatives and Guilds
− Renewable Energy Investment Funds
− Individual Ownership
− Government Aid and ‘soft’ Loans
− Third Party Finance
− Syndicated Loan Credit
Allocation of funds is significantly more available in Europe (developed countries).
Most European countries have some incentive mechanisms for renewable energy
generation.
Since classic market forces—i.e., price, demand, and supply—do not account for
environmental or other non-economical advantages of renewables, most European countries
have provided some sort of incentives to support renewable energies at various stages of
their development. In general, these incentives can be categorized as follows [49].
1) Public funds for research, development and demonstration programs.
2) Direct support of investment costs (either in % of total costs or as a certain amount
per installed kW).
3) Support through premium prices for electricity from Renewables (an amount per
kWh delivered).
4) Other financial incentives—special loans, favorable interest rates, etc.
5) Tax incentives such as favorable depreciation terms, etc.
62
6) Other incentives, such as regional funds for structural support, which are not meant
exclusively for renewables [49].
In practice, a refined renewable energy introduction policy will not employ only one
of these incentives, but use a combination of different sorts of incentives. There is no single
or one-way strategy for success. Different approaches have led to different market
developments for different countries. According to the researches the premium fixed price
strategy is far more successful than the quota system.
Wind energy industry is capital intensive, and requires long term finance. For the
developed countries’ case, financing wind plant investment is relatively conventional from
traditional sources particularly from commercial finance sources. On the other hand, this
path does not apply to the developing countries. As the political and economic stability has
not established for most of the developing countries, external fund providers are generally
more reluctant to invest in these countries [45]. But renewable energy projects are still a
relatively minor or new element of the business activity of financial institutions. This
chapter will focus on overcoming financial constraints which have been widely
acknowledged as the most significant challenge faced by renewable energy projects.
Traditionally, when a developer asks for money from a bank, the borrower carries all
the risk of failure. The bank requires the borrower to provide some form of security like
property, land or equipment for recovering its debt if the borrower fails to maintain the
agreed loan repayments. The bank can use this security.
But the value is principally derived from the electricity it will generate rather than the
resale price of the second-hand turbines so such security is difficult to deliver for a wind
power development. Because of this, wind energy developers need (require) a different
approach from a bank/financier. By this new approach, banks or financial institutions have
to take on more risks associated with the success of the project. This is Project Finance. A
contract like ESA is generally a pre-requisite of project finance.
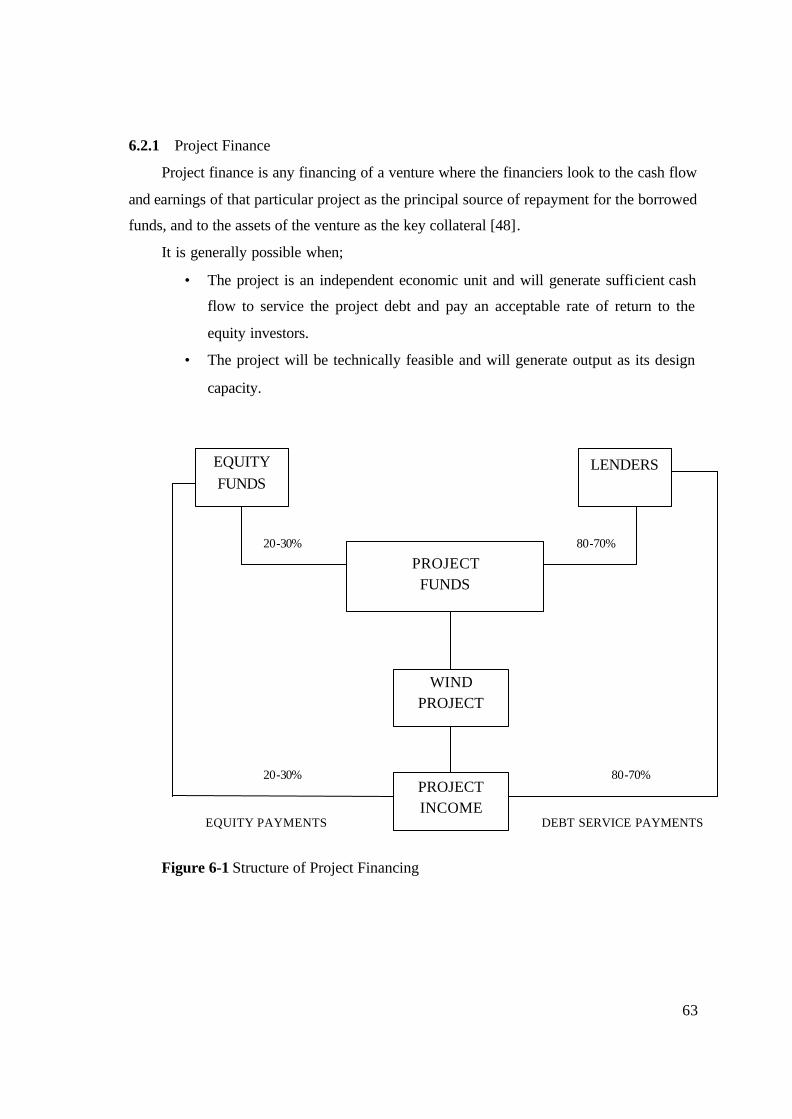
63
6.2.1 Project Finance
Project finance is any financing of a venture where the financiers look to the cash flow
and earnings of that particular project as the principal source of repayment for the borrowed
funds, and to the assets of the venture as the key collateral [48].
It is generally possible when;
• The project is an independent economic unit and will generate sufficient cash
flow to service the project debt and pay an acceptable rate of return to the
equity investors.
• The project will be technically feasible and will generate output as its design
capacity.
Figure 6-1 Structure of Project Financing
EQUITY FUNDS
WIND PROJECT
LENDERS
PROJECT FUNDS
PROJECT INCOME
EQUITY PAYMENTS DEBT SERVICE PAYMENTS
20-30% 80-70%
80-70% 20-30%
64
With project financing, banks/financial institutions have to take more of the project
risk than in traditional lending, so they need to have a special risk management approach
for wind energy projects.
There may be construction risk, currency risk, political risk, market risk, timing risk,
along with many other types of risk. A successful project finance structure will efficiently
allocate these various types of risks to those investors/participants most able and willing to
assess and bear the risk [50].
The banks and/or financial institutions have different risk management approaches.
But the general framework can be summarized as;
• Thoroughly evaluating the risk through a process of due diligence; Due diligence is a
fundamental requirement of project financing for wind power projects.
Due diligence can be defined as; the practice of researching the feasibility of a project
including evaluating contracts, visiting the project site, meeting with project participants,
building a financial model, and confirming key legal and regulatory aspects [48].
It examines the legal and technical robustness of a project and therefore provides
some guide to the level of risk being taken on by the investor/bank and banks are seeking to
find ways to control those risks [51]. A sample of due diligence requirement list for a wind
energy project is shown in Figure 6.2.
• controlling the risk through fixed cost and, ideally, turnkey construction contracts
and long-term power purchase contracts; construction contracts offer a broad range of
possibilities for allocating risk among project participants. Power purchase agreement
(PPA) would include an energy payment to cover the projects operating expenses.
• creating an element of security through debentures over assets and undertakings,
first charges over site leaseholds and issued share capital, and a debt service reserve, and;
• maintaining the commitment of the project owners to the project’s success through a
minimum equity stake of at least 20% of the total project cost.
There are some side benefits resulting from financing the wind projects as project
financing, which may have a bearing on the motives of the company seeking such a
structure [52] :
a) credit sources may be available to the project which would not be available to
the sponsor;
65
b) guarantees may be available to the project which would not be available to the
sponsor;
c) a project financing may enjoy better credit terms and interest costs in
situations in which a sponsor’s credit is weak;
d) higher leverage of debt to equity may be achieved;
e) investment protection for foreign investors may be improved by joining as
joint ventures with international parties, thus lessening the sovereign risk;
f) a more favorable labor contract or climate may be possible by separating the
operation from other activities of the sponsor; and / or
g) construction financing costs may not be reflected in the sponsor’s financial
statement until such time as the project begins producing revenue.
In some instances, any one of the reasons stated above may be the primary motivation
for structuring the wind projects as a project financing.
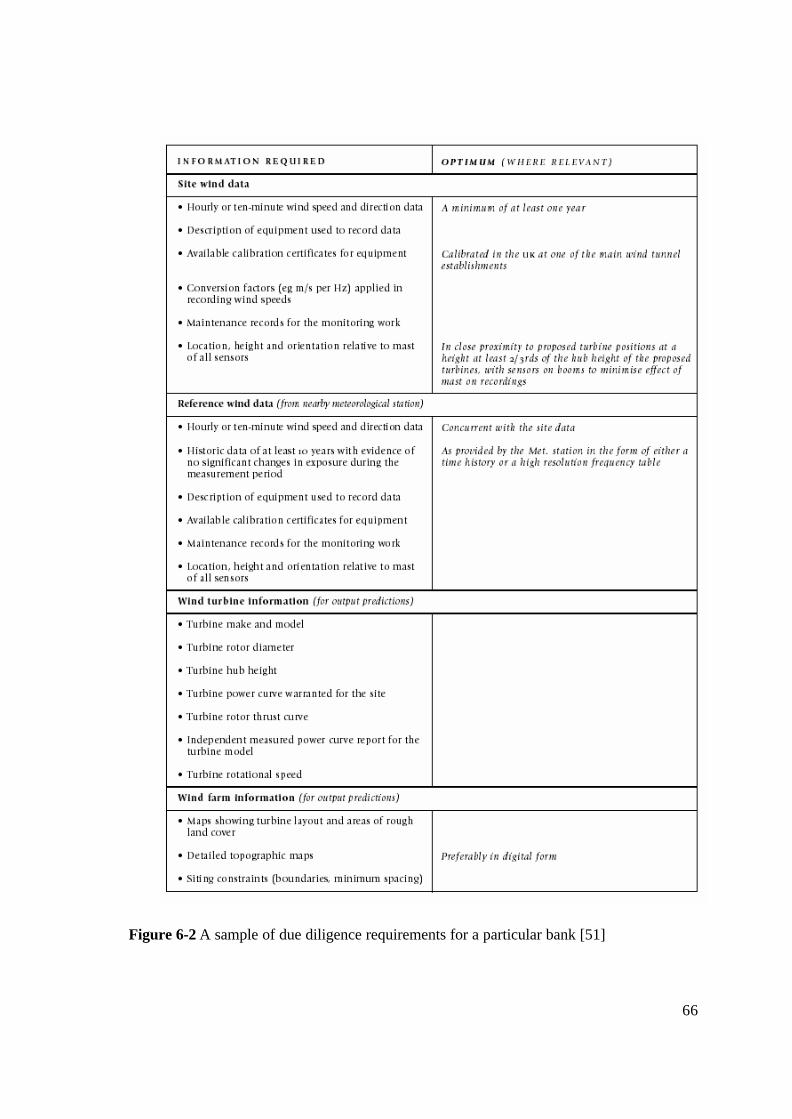
66
Figure 6-2 A sample of due diligence requirements for a particular bank [51]
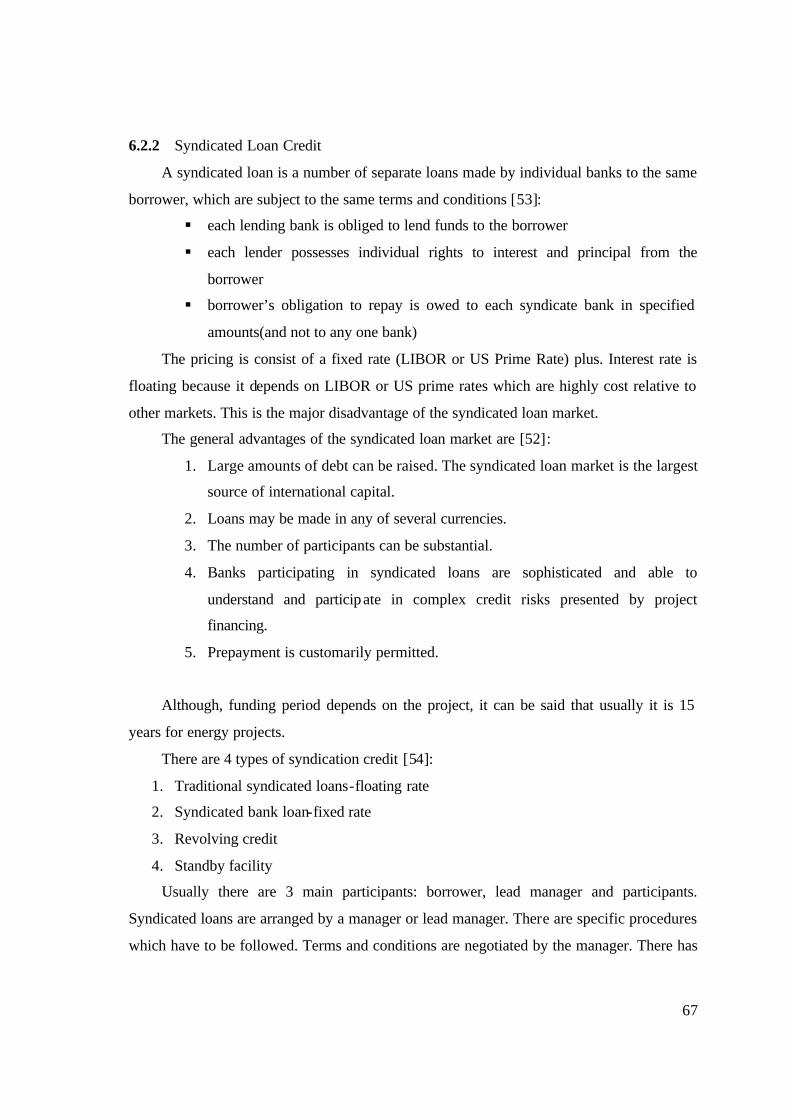
67
6.2.2 Syndicated Loan Credit
A syndicated loan is a number of separate loans made by individual banks to the same
borrower, which are subject to the same terms and conditions [53]:
§ each lending bank is obliged to lend funds to the borrower
§ each lender possesses individual rights to interest and principal from the
borrower
§ borrower’s obligation to repay is owed to each syndicate bank in specified
amounts(and not to any one bank)
The pricing is consist of a fixed rate (LIBOR or US Prime Rate) plus. Interest rate is
floating because it depends on LIBOR or US prime rates which are highly cost relative to
other markets. This is the major disadvantage of the syndicated loan market.
The general advantages of the syndicated loan market are [52]:
1. Large amounts of debt can be raised. The syndicated loan market is the largest
source of international capital.
2. Loans may be made in any of several currencies.
3. The number of participants can be substantial.
4. Banks participating in syndicated loans are sophisticated and able to
understand and participate in complex credit risks presented by project
financing.
5. Prepayment is customarily permitted.
Although, funding period depends on the project, it can be said that usually it is 15
years for energy projects.
There are 4 types of syndication credit [54]:
1. Traditional syndicated loans-floating rate
2. Syndicated bank loan-fixed rate
3. Revolving credit
4. Standby facility
Usually there are 3 main participants: borrower, lead manager and participants.
Syndicated loans are arranged by a manager or lead manager. There are specific procedures
which have to be followed. Terms and conditions are negotiated by the manager. There has
68
to be a consensus within all parties. Borrowers are able to find large size of financing with
syndicated loans. Their flexibility and accessibility to relatively quick and cheaper funds
are the major advantages of syndicated loans.
Figure6-3 Structure of a Syndicated Loan Structure
The main problem for developers in wind energy sector is financing a project. The
problems to obtain finance arise because many renewable energy projects are capital
intensive and require longer repayment periods than conventional technologies. As the
county struggles with inflation and unstable economic conditions, the financial sector can
not provide long term, low cost funds. Under this scope, the realization of projects can be
possible with the contribution of multinational agencies and foreign investors. Although,
there are many financial methods this stud y examined project finance and syndicated loan
credit which are the most suitable methods for energy project financing.
PROJECT (100 $)
MAJOR BANK (50 $)
Bank 1 Bank 2 Bank 3 Bank N
WIND PLANT
PROJECT INCOME
50 $
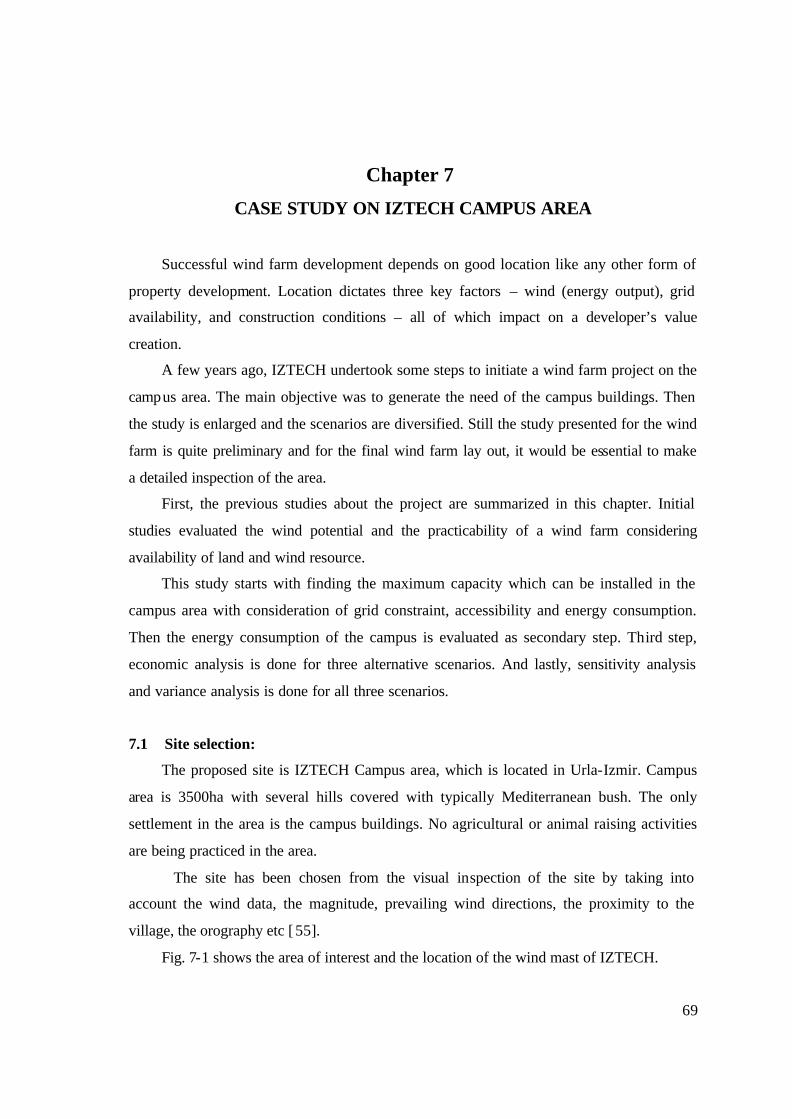
69
Chapter 7
CASE STUDY ON IZTECH CAMPUS AREA
Successful wind farm development depends on good location like any other form of
property development. Location dictates three key factors – wind (energy output), grid
availability, and construction conditions – all of which impact on a developer’s value
creation.
A few years ago, IZTECH undertook some steps to initiate a wind farm project on the
campus area. The main objective was to generate the need of the campus buildings. Then
the study is enlarged and the scenarios are diversified. Still the study presented for the wind
farm is quite preliminary and for the final wind farm lay out, it would be essential to make
a detailed inspection of the area.
First, the previous studies about the project are summarized in this chapter. Initial
studies evaluated the wind potential and the practicability of a wind farm considering
availability of land and wind resource.
This study starts with finding the maximum capacity which can be installed in the
campus area with consideration of grid constraint, accessibility and energy consumption.
Then the energy consumption of the campus is evaluated as secondary step. Third step,
economic analysis is done for three alternative scenarios. And lastly, sensitivity analysis
and variance analysis is done for all three scenarios.
7.1 Site selection:
The proposed site is IZTECH Campus area, which is located in Urla-Izmir. Campus
area is 3500ha with several hills covered with typically Mediterranean bush. The only
settlement in the area is the campus buildings. No agricultural or animal raising activities
are being practiced in the area.
The site has been chosen from the visual inspection of the site by taking into
account the wind data, the magnitude, prevailing wind directions, the proximity to the
village, the orography etc [55].
Fig. 7-1 shows the area of interest and the location of the wind mast of IZTECH.
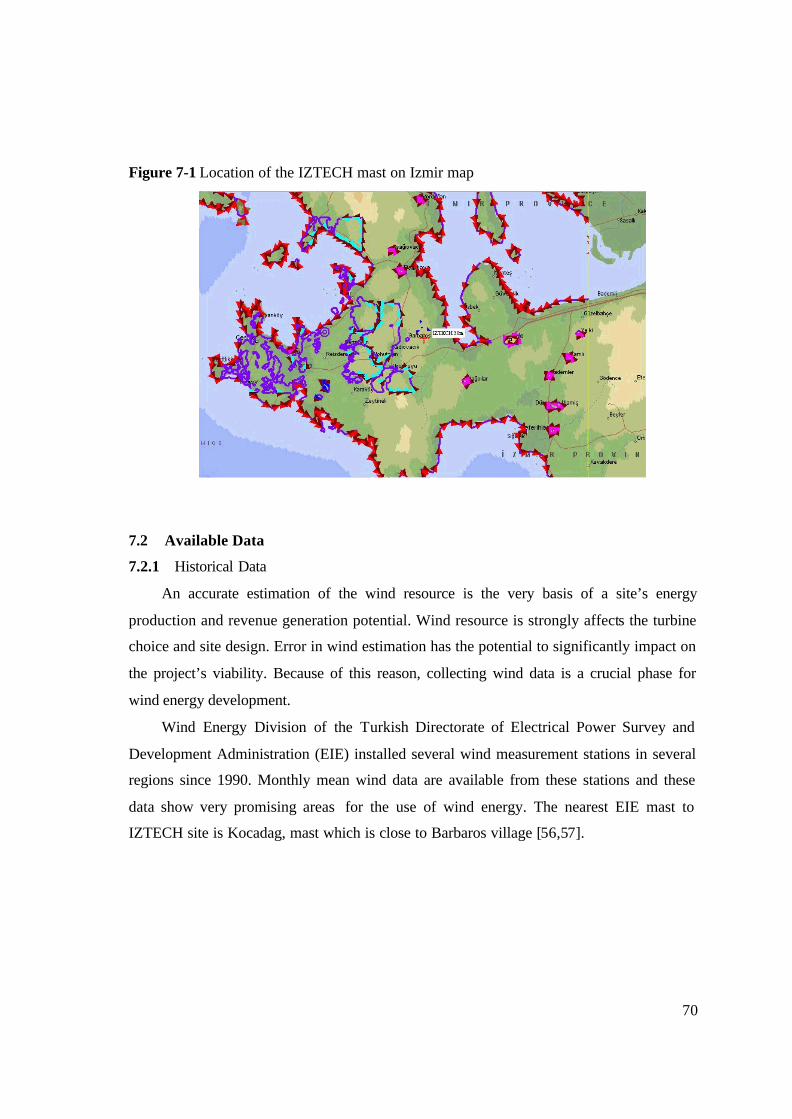
70
Figure 7-1 Location of the IZTECH mast on Izmir map
7.2 Available Data
7.2.1 Historical Data
An accurate estimation of the wind resource is the very basis of a site’s energy
production and revenue generation potential. Wind resource is strongly affects the turbine
choice and site design. Error in wind estimation has the potential to significantly impact on
the project’s viability. Because of this reason, collecting wind data is a crucial phase for
wind energy development.
Wind Energy Division of the Turkish Directorate of Electrical Power Survey and
Development Administration (EIE) installed several wind measurement stations in several
regions since 1990. Monthly mean wind data are available from these stations and these
data show very promising areas for the use of wind energy. The nearest EIE mast to
IZTECH site is Kocadag, mast which is close to Barbaros village [56,57].
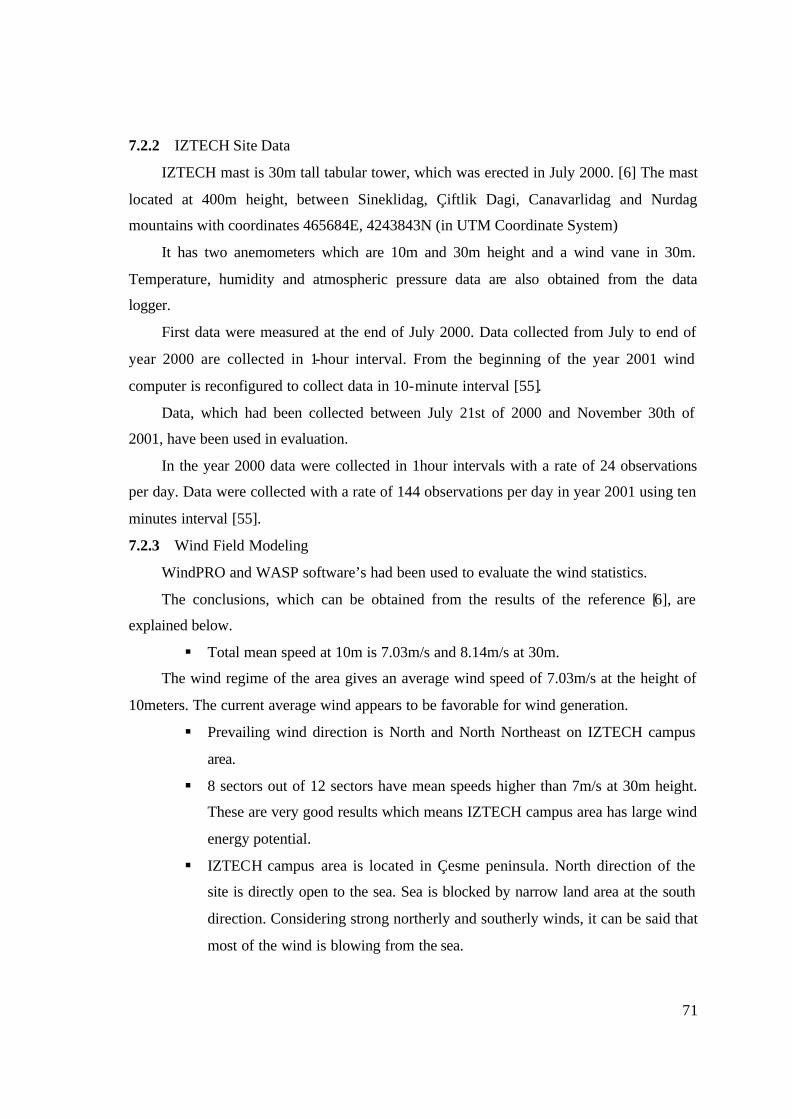
71
7.2.2 IZTECH Site Data
IZTECH mast is 30m tall tabular tower, which was erected in July 2000. [6] The mast
located at 400m height, between Sineklidag, Çiftlik Dagi, Canavarlidag and Nurdag
mountains with coordinates 465684E, 4243843N (in UTM Coordinate System)
It has two anemometers which are 10m and 30m height and a wind vane in 30m.
Temperature, humidity and atmospheric pressure data are also obtained from the data
logger.
First data were measured at the end of July 2000. Data collected from July to end of
year 2000 are collected in 1-hour interval. From the beginning of the year 2001 wind
computer is reconfigured to collect data in 10-minute interval [55].
Data, which had been collected between July 21st of 2000 and November 30th of
2001, have been used in evaluation.
In the year 2000 data were collected in 1hour intervals with a rate of 24 observations
per day. Data were collected with a rate of 144 observations per day in year 2001 using ten
minutes interval [55].
7.2.3 Wind Field Modeling
WindPRO and WASP software’s had been used to evaluate the wind statistics.
The conclusions, which can be obtained from the results of the reference [6], are
explained below.
§ Total mean speed at 10m is 7.03m/s and 8.14m/s at 30m.
The wind regime of the area gives an average wind speed of 7.03m/s at the height of
10meters. The current average wind appears to be favorable for wind generation.
§ Prevailing wind direction is North and North Northeast on IZTECH campus
area.
§ 8 sectors out of 12 sectors have mean speeds higher than 7m/s at 30m height.
These are very good results which means IZTECH campus area has large wind
energy potential.
§ IZTECH campus area is located in Çesme peninsula. North direction of the
site is directly open to the sea. Sea is blocked by narrow land area at the south
direction. Considering strong northerly and southerly winds, it can be said that
most of the wind is blowing from the sea.
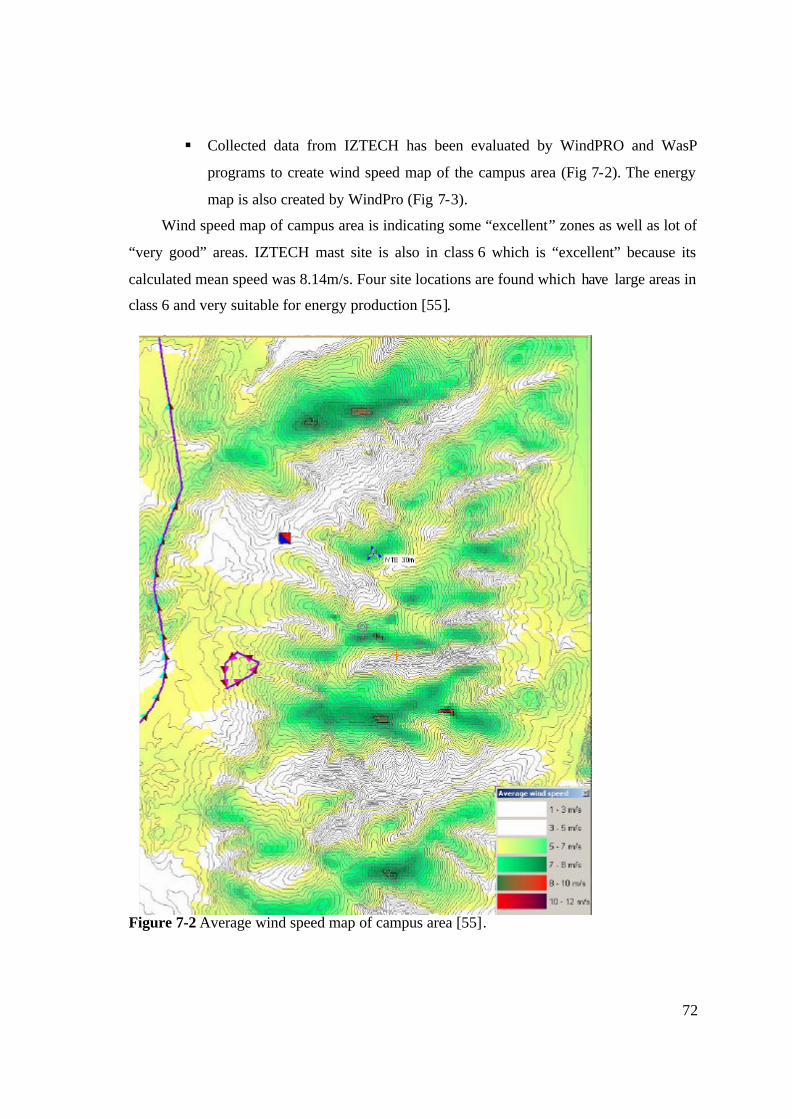
72
§ Collected data from IZTECH has been evaluated by WindPRO and WasP
programs to create wind speed map of the campus area (Fig 7-2). The energy
map is also created by WindPro (Fig 7-3).
Wind speed map of campus area is indicating some “excellent” zones as well as lot of
“very good” areas. IZTECH mast site is also in class 6 which is “excellent” because its
calculated mean speed was 8.14m/s. Four site locations are found which have large areas in
class 6 and very suitable for energy production [55].
Figure 7-2 Average wind speed map of campus area [55].
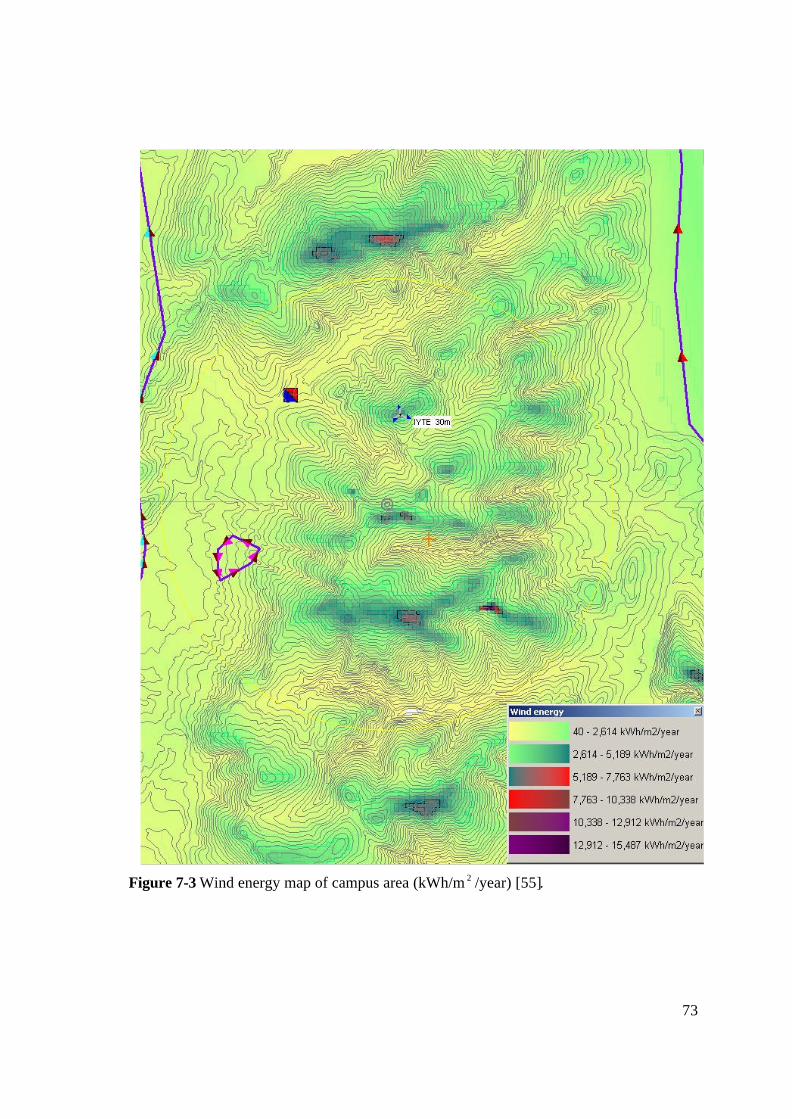
73
Figure 7-3 Wind energy map of campus area (kWh/m 2 /year) [55].
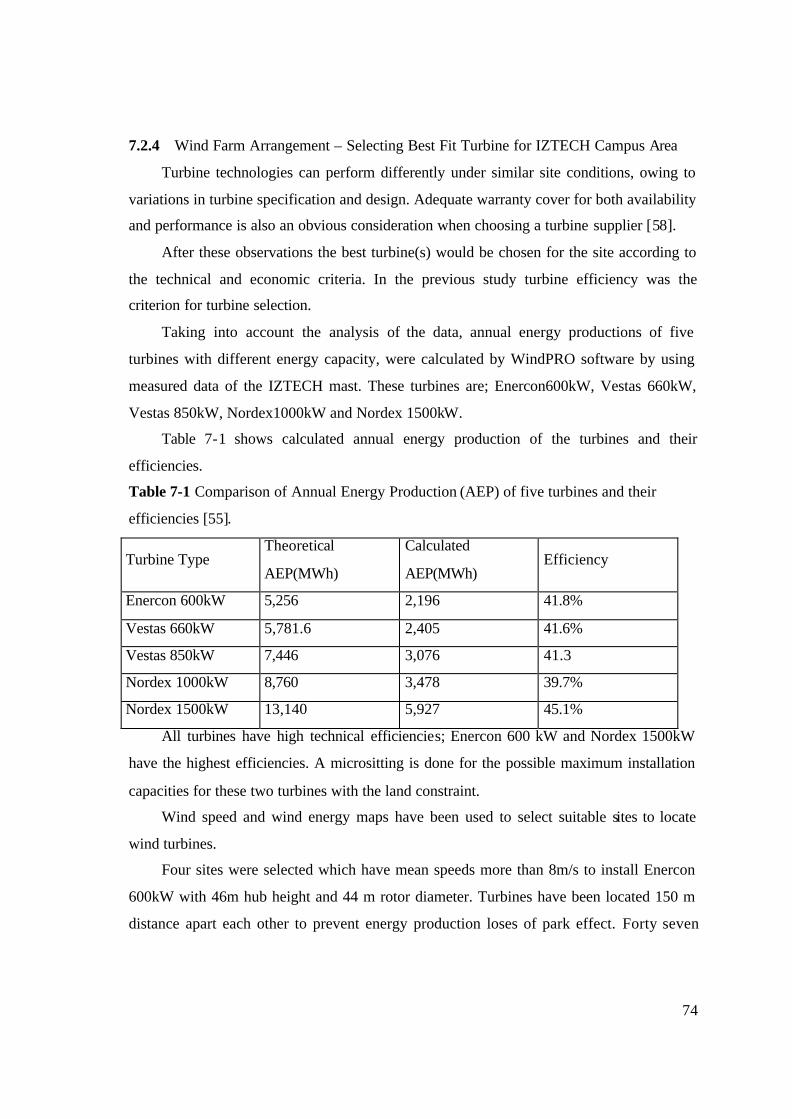
74
7.2.4 Wind Farm Arrangement – Selecting Best Fit Turbine for IZTECH Campus Area
Turbine technologies can perform differently under similar site conditions, owing to
variations in turbine specification and design. Adequate warranty cover for both availability
and performance is also an obvious consideration when choosing a turbine supplier [58].
After these observations the best turbine(s) would be chosen for the site according to
the technical and economic criteria. In the previous study turbine efficiency was the
criterion for turbine selection.
Taking into account the analysis of the data, annual energy productions of five
turbines with different energy capacity, were calculated by WindPRO software by using
measured data of the IZTECH mast. These turbines are; Enercon600kW, Vestas 660kW,
Vestas 850kW, Nordex1000kW and Nordex 1500kW.
Table 7-1 shows calculated annual energy production of the turbines and their
efficiencies.
Table 7-1 Comparison of Annual Energy Production (AEP) of five turbines and their
efficiencies [55].
Turbine Type Theoretical
AEP(MWh)
Calculated
AEP(MWh)
Efficiency
Enercon 600kW 5,256 2,196 41.8%
Vestas 660kW 5,781.6 2,405 41.6%
Vestas 850kW 7,446 3,076 41.3
Nordex 1000kW 8,760 3,478 39.7%
Nordex 1500kW 13,140 5,927 45.1%
All turbines have high technical efficiencies; Enercon 600 kW and Nordex 1500kW
have the highest efficiencies. A micrositting is done for the possible maximum installation
capacities for these two turbines with the land constraint.
Wind speed and wind energy maps have been used to select suitable sites to locate
wind turbines.
Four sites were selected which have mean speeds more than 8m/s to install Enercon
600kW with 46m hub height and 44 m rotor diameter. Turbines have been located 150 m
distance apart each other to prevent energy production loses of park effect. Forty seven
75
turbines have been located as aligned position in four sites according to the prevailing
direction [55].
Two sites were selected to install Nordex 1500 kW with 60m hub height and 64m
rotor diameter which have mean speeds more than 8 m/s and enough area to mount these
huge turbines. Twenty six turbines have been located 250 m distance apart and aligned
according to prevailing wind direction to prevent from park effect production loses [55].
WindPRO software calculated annual energy production of every individual turbine
and total production of all potential sites. Calculated energy production of located forty
seven Enercon 600kW turbines with total capacity of 28.2 MW, is 100.3 GWh. Calculated
energy production of twenty six Nordex 1500kW turbines with total capacity 39 MW, is
122.4GWh [55].
The next study done for the area is “Land Use Analysis”. [59] This survey evaluated
the previous micrositing in land use perspective.
7.2.4.1 Availability of land:
When the wind turbine layouts applied to the campus plan, it is seen that six turbines
of 600 kW sitting at the south of the Izmir-Çesme Road, and six more turbines of 600 kW
sitting at Kocadag, on the north of the mast are located out of the campus boundary. The
seven turbines of 1500kW, sitting on the north of the mast in the second alternative, is also
out of the campus boundary [60].
Due to the factor of availability of land, it is accepted that the wind farm project
would be developed on the land under/with the ownership of university, without exceeding
the campus boundaries. In accordance with the assumption, the size of the development
turns out to be smaller, including the numbers of turbines lessening to thirty five in the first
alternative, and to nineteen in the second [60].
76
7.2.4.2 Grid Availability:
The availability of cost-effective grid connection is critical, as it provides the lifeline
between generation and supply. Securing a grid connection has the potential to be
problematic, time-consuming and extremely costly [58].
The nearest connecting point is Urla Substation. It is 154/34.5kV line with 25MVA
transformer power. The short-circuit power at the network nodes has been calculated. It is
238MVA for Urla 34.5kV [56]. According to this, the maximum capacity which can be
connected to 34.5kV line is 12MW.
MWMVA 1205.0238 =× (7.1)
Next step should be financial assessment. This study presented here is an attempt to
cost analysis of a wind farm and a look to financial opportunities for wind energy projects.
7.3 Economic Analysis
The study presented for the wind farm is quite preliminary and it would be essential
for the final wind farm lay-out a detailed inspection of the area.
The economic analysis of the project was conducted by using RETScreen software,
version 2000, which developed by National Resource Canada’s CANMET Energy
Diversification Resource Laboratory. A brief summary of RETScreen software is given in
Appendix [61]. And the economic analyses which were performed for turbines mentioned
above.
Three scenarios are illustrated. First scenario is an autoproducer which establishes the
energy of the campus. Second scenario is another autoproducer which provides energy for
Campus and a second facility. And the third scenario is for an Independent Power Producer
(IPP) with maximum capacity which could be installed and connect in the campus area
according to the constraints.
The cost of WECS’s turbine prices are taken from the reference [62]. Although this
study intended to be the continuation of the previous stud ies [6, 59], different turbine types
had to be used for the financial evaluation because of the unavailability of turbine prices.
The economics of grid connected wind power depend very much upon the perspective
taken. How quickly investors want their loans repaid, what rate of returns they require,
what is the repayment period ext., can affect the feasibility of a wind project.
77
Public authorities and private investors have different perspectives. Public authorities
and energy planners tend to assess different energy sources on the basis of the levelised
cost. These calculations do not depend upon variables such as inflation or taxation system.
Public utility is the most important criterion for decision-makers. The private investors
make decisions on project cash flow and payback time. They take into account the variables
introduced by government policy and shifts in financial and foreign exchange markets.
Public authorities and energy planners require the capital to be paid off over the technical
lifetime of the wind turbine, i.e. 25 years, whereas the private investor would have to
recover the cost of the turbines during the length of the bank loan. The interest rates used
by public authorities and energy planners would typically be lower than those used by
private investors. This study uses “Private investor” perspective as a decision-maker.
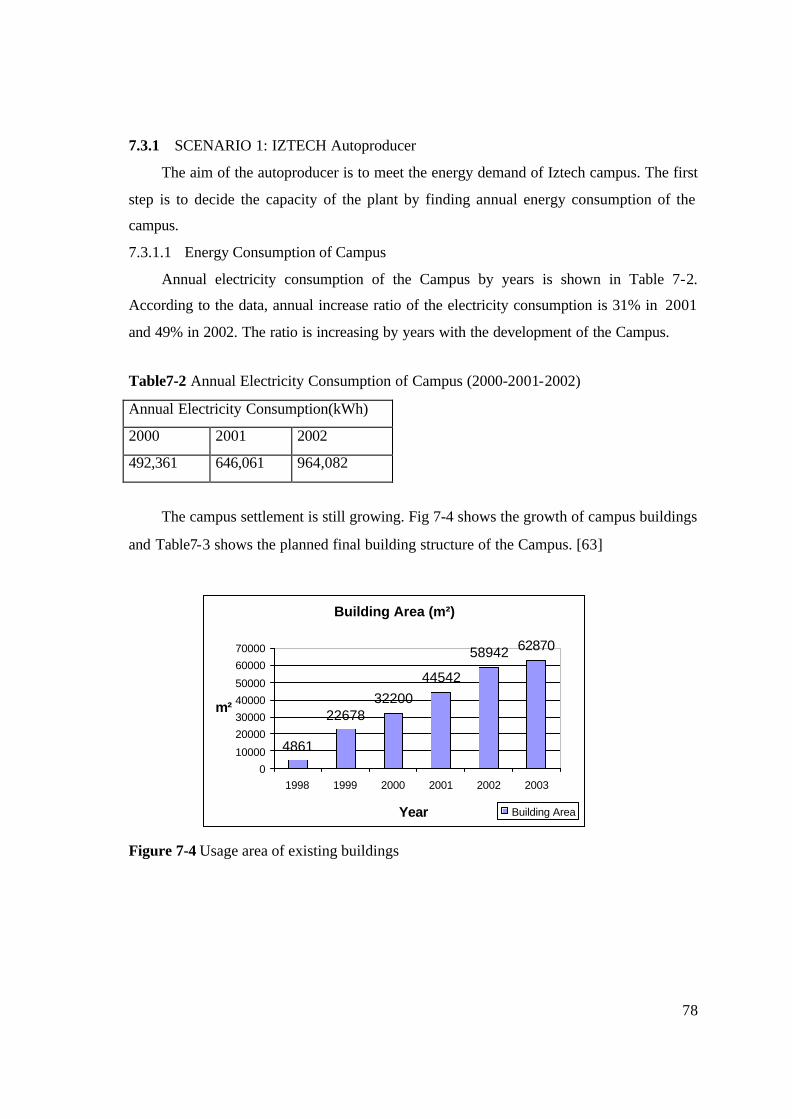
78
7.3.1 SCENARIO 1: IZTECH Autoproducer
The aim of the autoproducer is to meet the energy demand of Iztech campus. The first
step is to decide the capacity of the plant by finding annual energy consumption of the
campus.
7.3.1.1 Energy Consumption of Campus
Annual electricity consumption of the Campus by years is shown in Table 7-2.
According to the data, annual increase ratio of the electricity consumption is 31% in 2001
and 49% in 2002. The ratio is increasing by years with the development of the Campus.
Table7-2 Annual Electricity Consumption of Campus (2000-2001-2002)
Annual Electricity Consumption(kWh)
2000 2001 2002
492,361 646,061 964,082
The campus settlement is still growing. Fig 7-4 shows the growth of campus buildings
and Table7-3 shows the planned final building structure of the Campus. [63]
Figure 7-4 Usage area of existing buildings
Building Area (m²)
4861
2267832200
44542
58942 62870
0
10000
20000
30000
40000
50000
60000
70000
1998 1999 2000 2001 2002 2003
Year
m²
Building Area
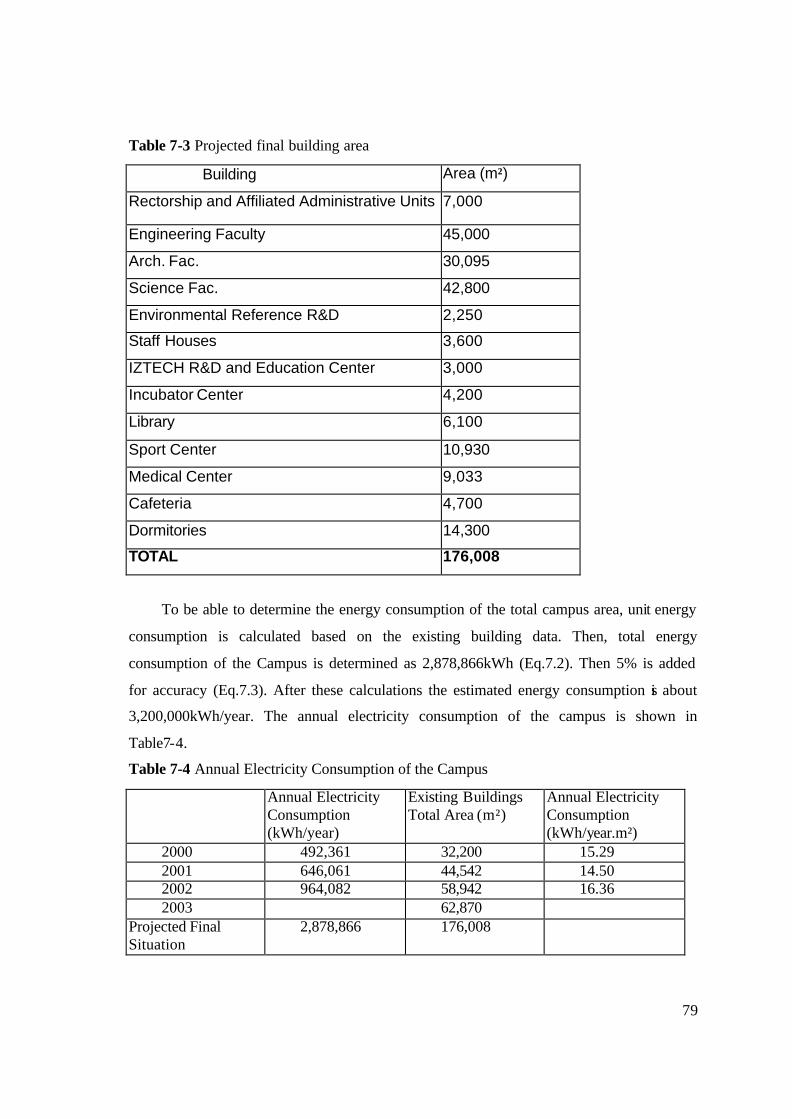
79
Table 7-3 Projected final building area
Building Area (m²)
Rectorship and Affiliated Administrative Units 7,000
Engineering Faculty 45,000
Arch. Fac. 30,095
Science Fac. 42,800
Environmental Reference R&D 2,250
Staff Houses 3,600
IZTECH R&D and Education Center 3,000
Incubator Center 4,200
Library 6,100
Sport Center 10,930
Medical Center 9,033
Cafeteria 4,700
Dormitories 14,300
TOTAL 176,008
To be able to determine the energy consumption of the total campus area, unit energy
consumption is calculated based on the existing building data. Then, total energy
consumption of the Campus is determined as 2,878,866kWh (Eq.7.2). Then 5% is added
for accuracy (Eq.7.3). After these calculations the estimated energy consumption is about
3,200,000kWh/year. The annual electricity consumption of the campus is shown in
Table7-4.
Table 7-4 Annual Electricity Consumption of the Campus
Annual Electricity Consumption (kWh/year)
Existing Buildings Total Area (m²)
Annual Electricity Consumption (kWh/year.m²)
2000 492,361 32,200 15.29 2001 646,061 44,542 14.50 2002 964,082 58,942 16.36 2003 62,870
Projected Final Situation
2,878,866 176,008
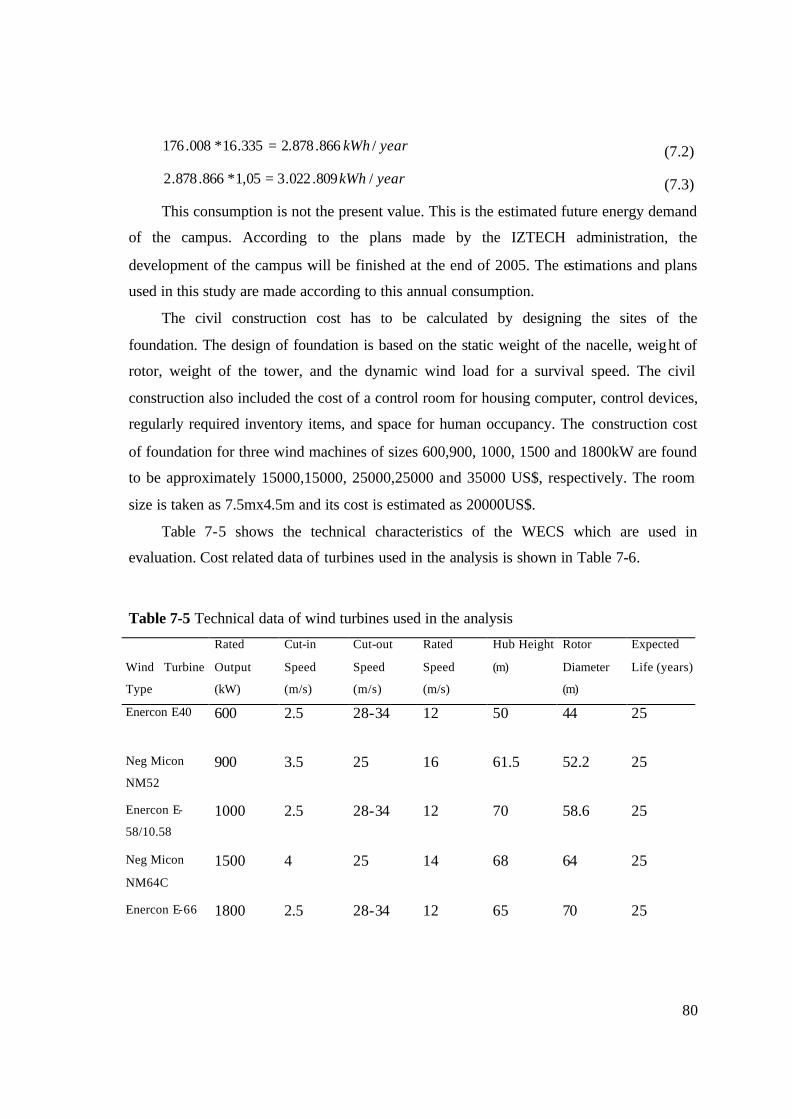
80
yearkWh /866.878.2335.16*008.176 = (7.2)
yearkWh /809.022.305,1*866.878.2 = (7.3)
This consumption is not the present value. This is the estimated future energy demand
of the campus. According to the plans made by the IZTECH administration, the
development of the campus will be finished at the end of 2005. The estimations and plans
used in this study are made according to this annual consumption.
The civil construction cost has to be calculated by designing the sites of the
foundation. The design of foundation is based on the static weight of the nacelle, weight of
rotor, weight of the tower, and the dynamic wind load for a survival speed. The civil
construction also included the cost of a control room for housing computer, control devices,
regularly required inventory items, and space for human occupancy. The construction cost
of foundation for three wind machines of sizes 600,900, 1000, 1500 and 1800kW are found
to be approximately 15000,15000, 25000,25000 and 35000 US$, respectively. The room
size is taken as 7.5mx4.5m and its cost is estimated as 20000US$.
Table 7-5 shows the technical characteristics of the WECS which are used in
evaluation. Cost related data of turbines used in the analysis is shown in Table 7-6.
Table 7-5 Technical data of wind turbines used in the analysis
Wind Turbine
Type
Rated
Output
(kW)
Cut-in
Speed
(m/s)
Cut-out
Speed
(m/s)
Rated
Speed
(m/s)
Hub Height
(m)
Rotor
Diameter
(m)
Expected
Life (years)
Enercon E40 600 2.5 28-34 12 50 44 25
Neg Micon
NM52
900 3.5 25 16 61.5 52.2 25
Enercon E-
58/10.58
1000 2.5 28-34 12 70 58.6 25
Neg Micon
NM64C
1500 4 25 14 68 64 25
Enercon E-66 1800 2.5 28-34 12 65 70 25
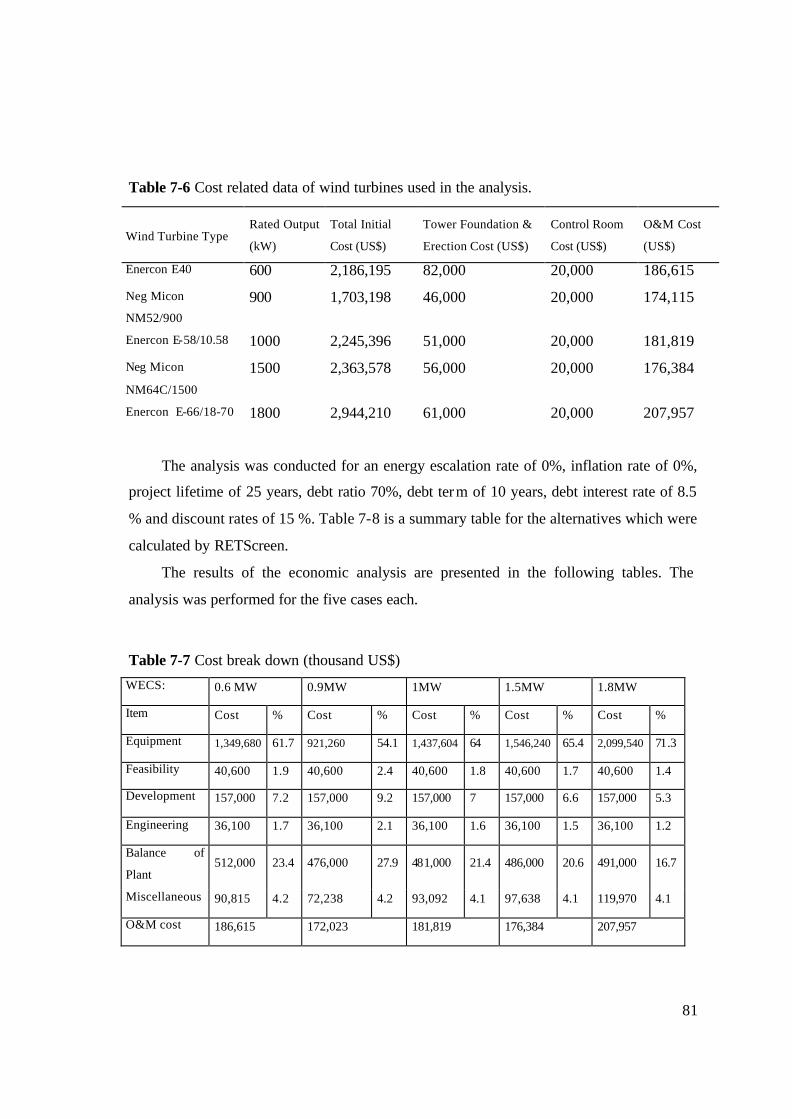
81
Table 7-6 Cost related data of wind turbines used in the analysis.
Wind Turbine Type
Rated Output
(kW)
Total Initial
Cost (US$)
Tower Foundation &
Erection Cost (US$)
Control Room
Cost (US$)
O&M Cost
(US$)
Enercon E40 600 2,186,195 82,000 20,000 186,615
Neg Micon
NM52/900
900 1,703,198 46,000 20,000 174,115
Enercon E-58/10.58 1000 2,245,396 51,000 20,000 181,819
Neg Micon
NM64C/1500
1500 2,363,578 56,000 20,000 176,384
Enercon E-66/18-70 1800 2,944,210 61,000 20,000 207,957
The analysis was conducted for an energy escalation rate of 0%, inflation rate of 0%,
project lifetime of 25 years, debt ratio 70%, debt term of 10 years, debt interest rate of 8.5
% and discount rates of 15 %. Table 7-8 is a summary table for the alternatives which were
calculated by RETScreen.
The results of the economic analysis are presented in the following tables. The
analysis was performed for the five cases each.
Table 7-7 Cost break down (thousand US$)
WECS: 0.6 MW 0.9MW 1MW 1.5MW 1.8MW
Item Cost % Cost % Cost % Cost % Cost %
Equipment 1,349,680 61.7 921,260 54.1 1,437,604 64 1,546,240 65.4 2,099,540 71.3
Feasibility 40,600 1.9 40,600 2.4 40,600 1.8 40,600 1.7 40,600 1.4
Development 157,000 7.2 157,000 9.2 157,000 7 157,000 6.6 157,000 5.3
Engineering 36,100 1.7 36,100 2.1 36,100 1.6 36,100 1.5 36,100 1.2
Balance of
Plant 512,000 23.4 476,000 27.9 481,000 21.4 486,000 20.6 491,000 16.7
Miscellaneous 90,815 4.2 72,238 4.2 93,092 4.1 97,638 4.1 119,970 4.1
O&M cost 186,615 172,023 181,819 176,384 207,957
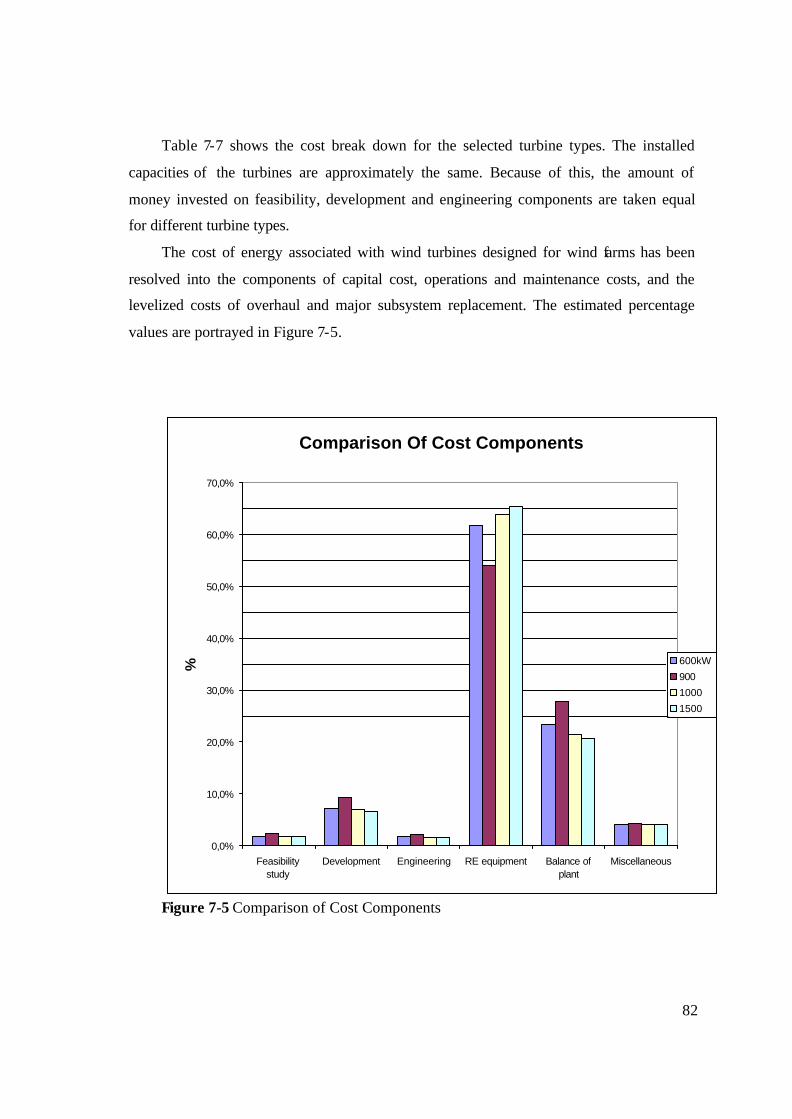
82
Table 7-7 shows the cost break down for the selected turbine types. The installed
capacities of the turbines are approximately the same. Because of this, the amount of
money invested on feasibility, development and engineering components are taken equal
for different turbine types.
The cost of energy associated with wind turbines designed for wind farms has been
resolved into the components of capital cost, operations and maintenance costs, and the
levelized costs of overhaul and major subsystem replacement. The estimated percentage
values are portrayed in Figure 7-5.
Comparison Of Cost Components
0,0%
10,0%
20,0%
30,0%
40,0%
50,0%
60,0%
70,0%
Feasibilitystudy
Development Engineering RE equipment Balance ofplant
Miscellaneous
% 600kW
900
1000
1500
Figure 7-5 Comparison of Cost Components
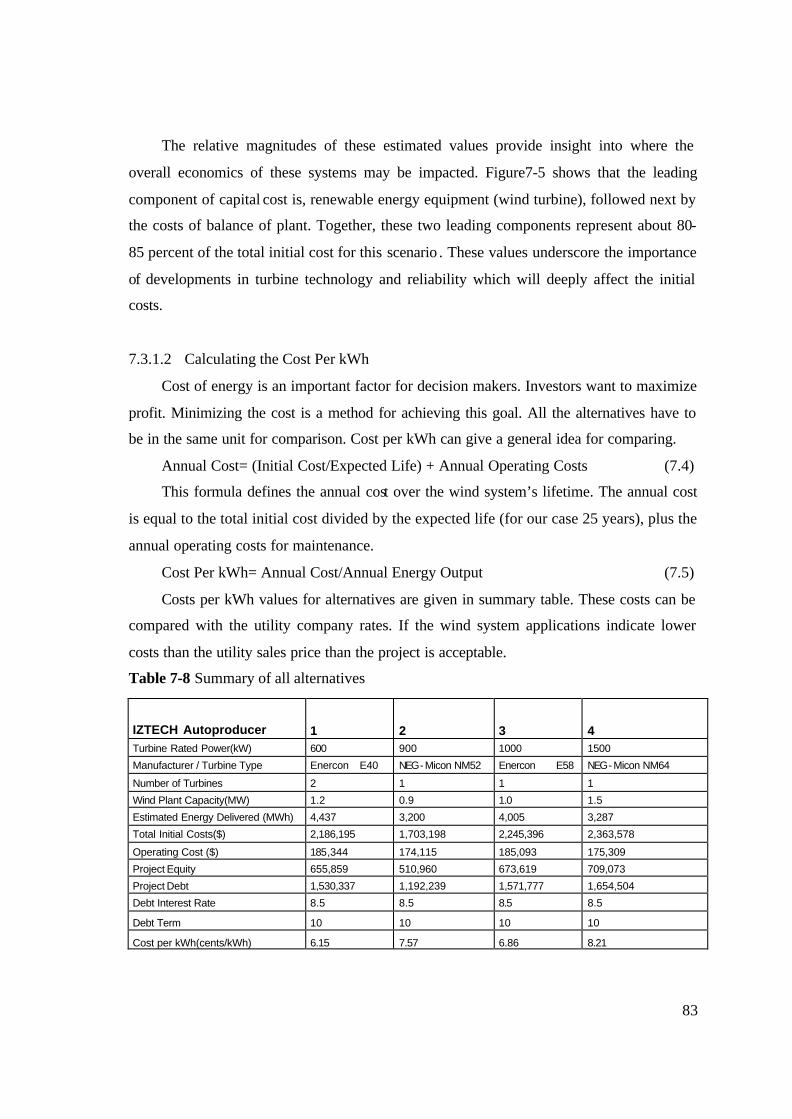
83
The relative magnitudes of these estimated values provide insight into where the
overall economics of these systems may be impacted. Figure7-5 shows that the leading
component of capital cost is, renewable energy equipment (wind turbine), followed next by
the costs of balance of plant. Together, these two leading components represent about 80-
85 percent of the total initial cost for this scenario . These values underscore the importance
of developments in turbine technology and reliability which will deeply affect the initial
costs.
7.3.1.2 Calculating the Cost Per kWh
Cost of energy is an important factor for decision makers. Investors want to maximize
profit. Minimizing the cost is a method for achieving this goal. All the alternatives have to
be in the same unit for comparison. Cost per kWh can give a general idea for comparing.
Annual Cost= (Initial Cost/Expected Life) + Annual Operating Costs (7.4)
This formula defines the annual cost over the wind system’s lifetime. The annual cost
is equal to the total initial cost divided by the expected life (for our case 25 years), plus the
annual operating costs for maintenance.
Cost Per kWh= Annual Cost/Annual Energy Output (7.5)
Costs per kWh values for alternatives are given in summary table. These costs can be
compared with the utility company rates. If the wind system applications indicate lower
costs than the utility sales price than the project is acceptable.
Table 7-8 Summary of all alternatives
IZTECH Autoproducer 1 2 3 4 Turbine Rated Power(kW) 600 900 1000 1500
Manufacturer / Turbine Type Enercon E40 NEG-Micon NM52 Enercon E58 NEG-Micon NM64
Number of Turbines 2 1 1 1
Wind Plant Capacity(MW) 1.2 0.9 1.0 1.5
Estimated Energy Delivered (MWh) 4,437 3,200 4,005 3,287
Total Initial Costs($) 2,186,195 1,703,198 2,245,396 2,363,578
Operating Cost ($) 185,344 174,115 185,093 175,309
Project Equity 655,859 510,960 673,619 709,073
Project Debt 1,530,337 1,192,239 1,571,777 1,654,504
Debt Interest Rate 8.5 8.5 8.5 8.5
Debt Term 10 10 10 10
Cost per kWh(cents/kWh) 6.15 7.57 6.86 8.21
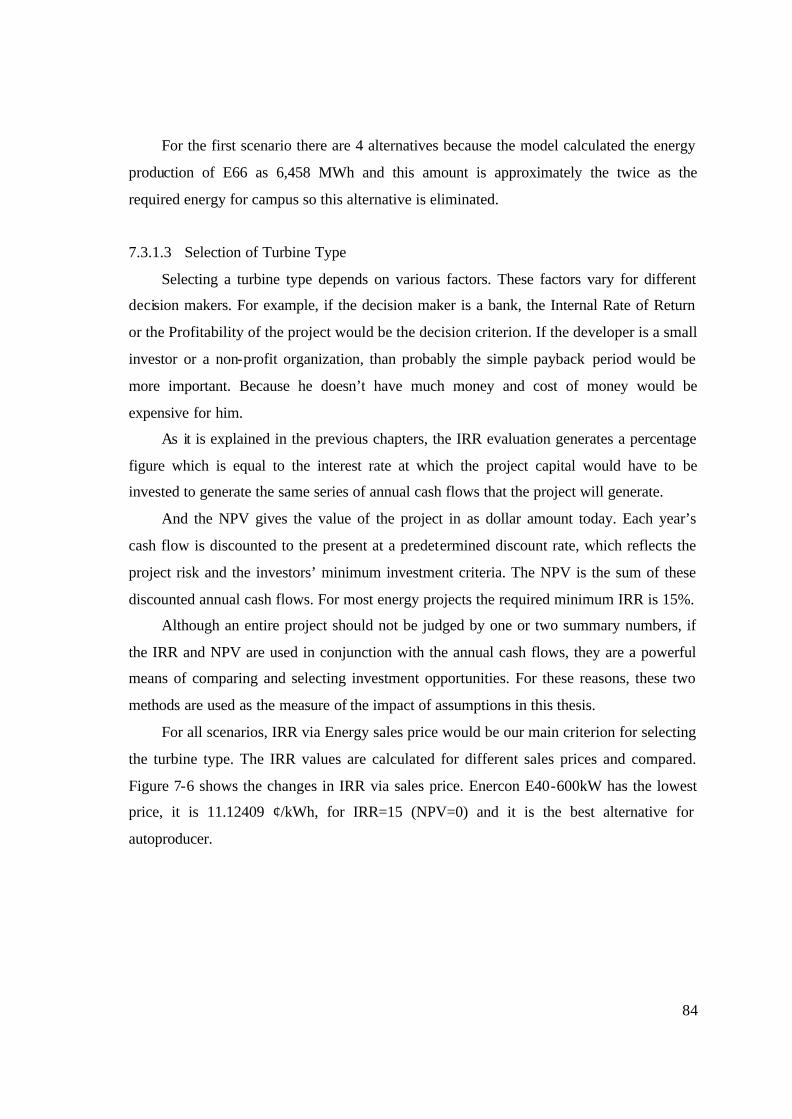
84
For the first scenario there are 4 alternatives because the model calculated the energy
production of E66 as 6,458 MWh and this amount is approximately the twice as the
required energy for campus so this alternative is eliminated.
7.3.1.3 Selection of Turbine Type
Selecting a turbine type depends on various factors. These factors vary for different
decision makers. For example, if the decision maker is a bank, the Internal Rate of Return
or the Profitability of the project would be the decision criterion. If the developer is a small
investor or a non-profit organization, than probably the simple payback period would be
more important. Because he doesn’t have much money and cost of money would be
expensive for him.
As it is explained in the previous chapters, the IRR evaluation generates a percentage
figure which is equal to the interest rate at which the project capital would have to be
invested to generate the same series of annual cash flows that the project will generate.
And the NPV gives the value of the project in as dollar amount today. Each year’s
cash flow is discounted to the present at a predetermined discount rate, which reflects the
project risk and the investors’ minimum investment criteria. The NPV is the sum of these
discounted annual cash flows. For most energy projects the required minimum IRR is 15%.
Although an entire project should not be judged by one or two summary numbers, if
the IRR and NPV are used in conjunction with the annual cash flows, they are a powerful
means of comparing and selecting investment opportunities. For these reasons, these two
methods are used as the measure of the impact of assumptions in this thesis.
For all scenarios, IRR via Energy sales price would be our main criterion for selecting
the turbine type. The IRR values are calculated for different sales prices and compared.
Figure 7-6 shows the changes in IRR via sales price. Enercon E40-600kW has the lowest
price, it is 11.12409 ¢/kWh, for IRR=15 (NPV=0) and it is the best alternative for
autoproducer.
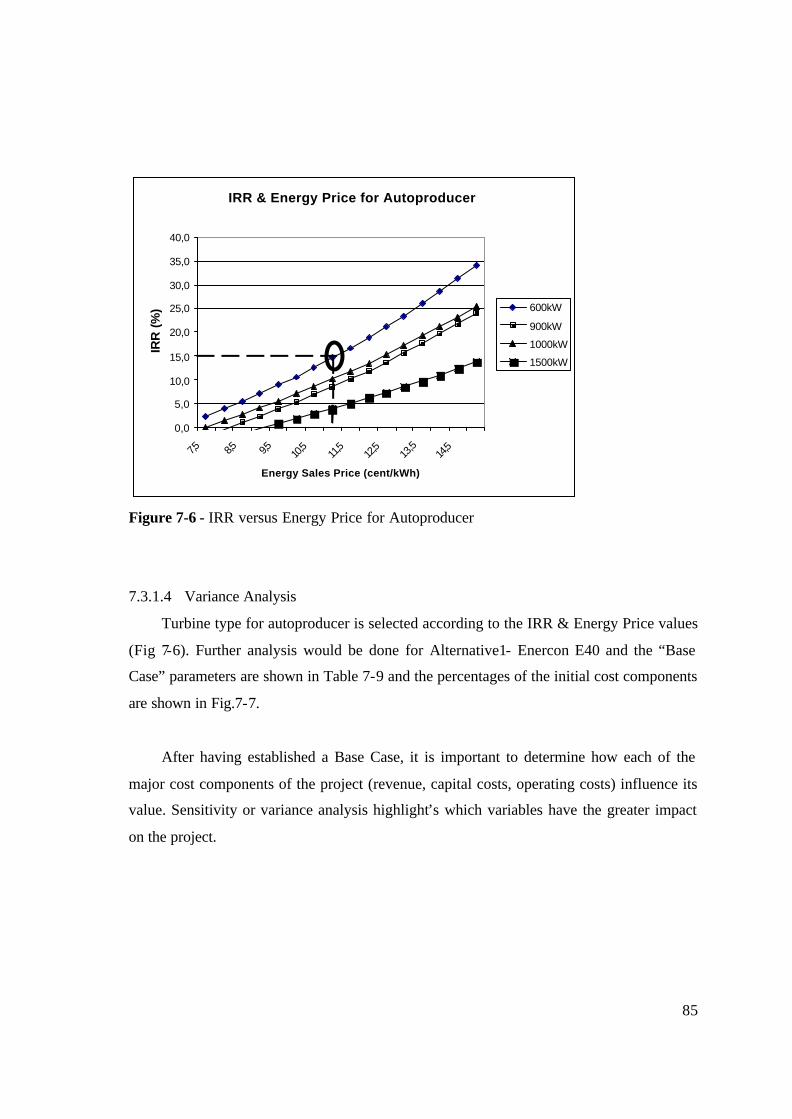
85
Figure 7-6 - IRR versus Energy Price for Autoproducer
7.3.1.4 Variance Analysis
Turbine type for autoproducer is selected according to the IRR & Energy Price values
(Fig 7-6). Further analysis would be done for Alternative1- Enercon E40 and the “Base
Case” parameters are shown in Table 7-9 and the percentages of the initial cost components
are shown in Fig.7-7.
After having established a Base Case, it is important to determine how each of the
major cost components of the project (revenue, capital costs, operating costs) influence its
value. Sensitivity or variance analysis highlight’s which variables have the greater impact
on the project.
IRR & Energy Price for Autoproducer
0,0
5,0
10,0
15,0
20,0
25,0
30,0
35,0
40,0
7,5 8,5 9,5 10,5
11,5
12,5
13,5
14,5
Energy Sales Price (cent/kWh)
IRR
(%
) 600kW
900kW
1000kW
1500kW
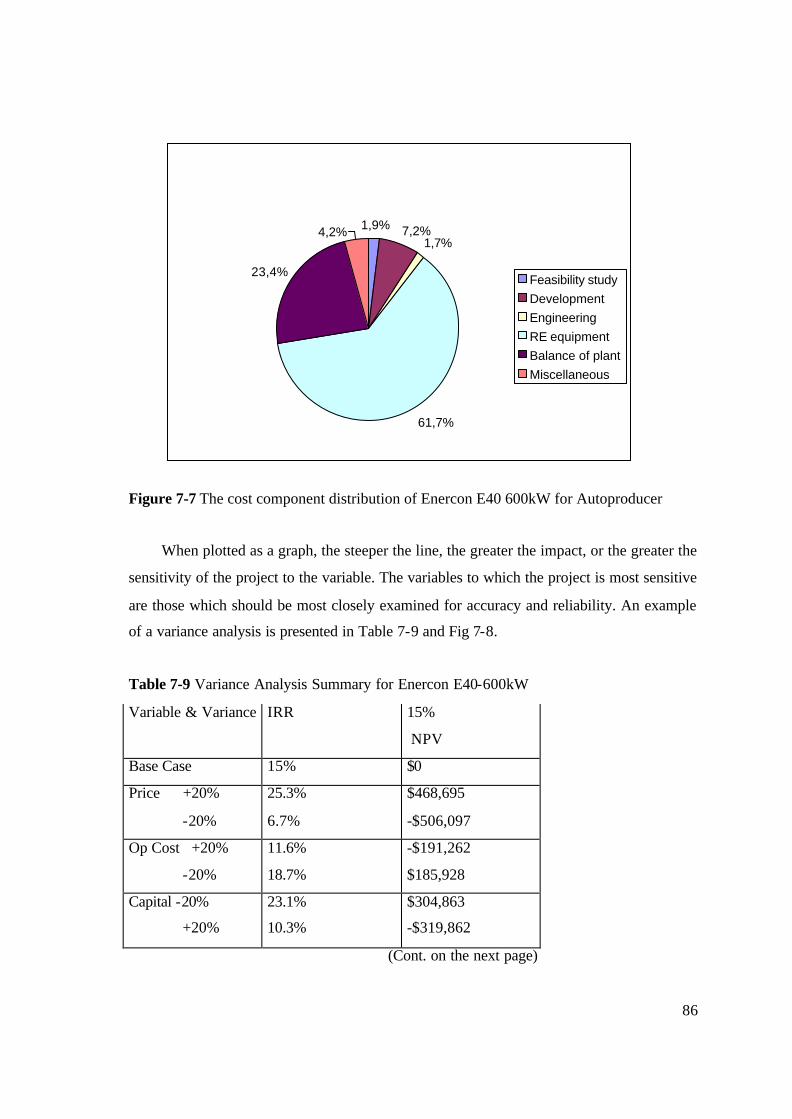
86
1,9% 7,2%1,7%
61,7%
23,4%
4,2%
Feasibility studyDevelopmentEngineeringRE equipmentBalance of plantMiscellaneous
Figure 7-7 The cost component distribution of Enercon E40 600kW for Autoproducer
When plotted as a graph, the steeper the line, the greater the impact, or the greater the
sensitivity of the project to the variable. The variables to which the project is most sensitive
are those which should be most closely examined for accuracy and reliability. An example
of a variance analysis is presented in Table 7-9 and Fig 7-8.
Table 7-9 Variance Analysis Summary for Enercon E40-600kW
Variable & Variance IRR 15%
NPV
Base Case 15% $0
Price +20%
-20%
25.3%
6.7%
$468,695
-$506,097
Op Cost +20%
-20%
11.6%
18.7%
-$191,262
$185,928
Capital -20%
+20%
23.1%
10.3%
$304,863
-$319,862
(Cont. on the next page)
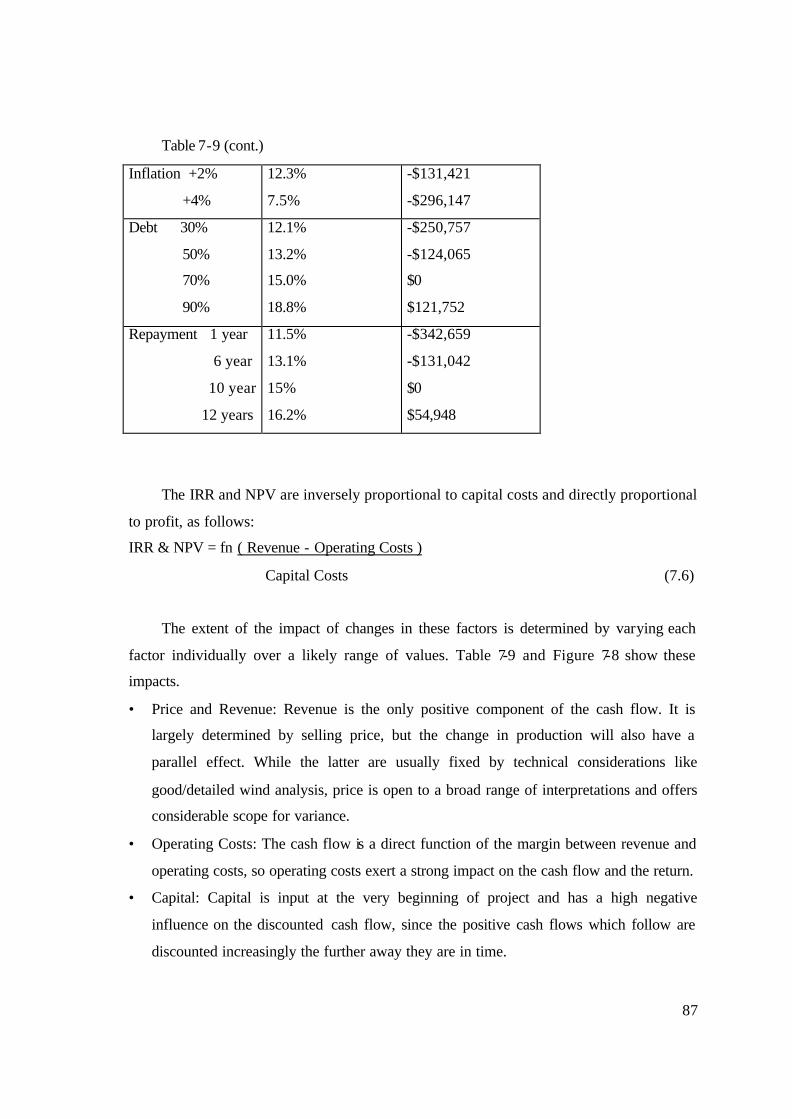
87
Table 7-9 (cont.)
Inflation +2%
+4%
12.3%
7.5%
-$131,421
-$296,147
Debt 30%
50%
70%
90%
12.1%
13.2%
15.0%
18.8%
-$250,757
-$124,065
$0
$121,752
Repayment 1 year
6 year
10 year
12 years
11.5%
13.1%
15%
16.2%
-$342,659
-$131,042
$0
$54,948
The IRR and NPV are inversely proportional to capital costs and directly proportional
to profit, as follows:
IRR & NPV = fn ( Revenue - Operating Costs )
Capital Costs (7.6)
The extent of the impact of changes in these factors is determined by varying each
factor individually over a likely range of values. Table 7-9 and Figure 7-8 show these
impacts.
• Price and Revenue: Revenue is the only positive component of the cash flow. It is
largely determined by selling price, but the change in production will also have a
parallel effect. While the latter are usually fixed by technical considerations like
good/detailed wind analysis, price is open to a broad range of interpretations and offers
considerable scope for variance.
• Operating Costs: The cash flow is a direct function of the margin between revenue and
operating costs, so operating costs exert a strong impact on the cash flow and the return.
• Capital: Capital is input at the very beginning of project and has a high negative
influence on the discounted cash flow, since the positive cash flows which follow are
discounted increasingly the further away they are in time.
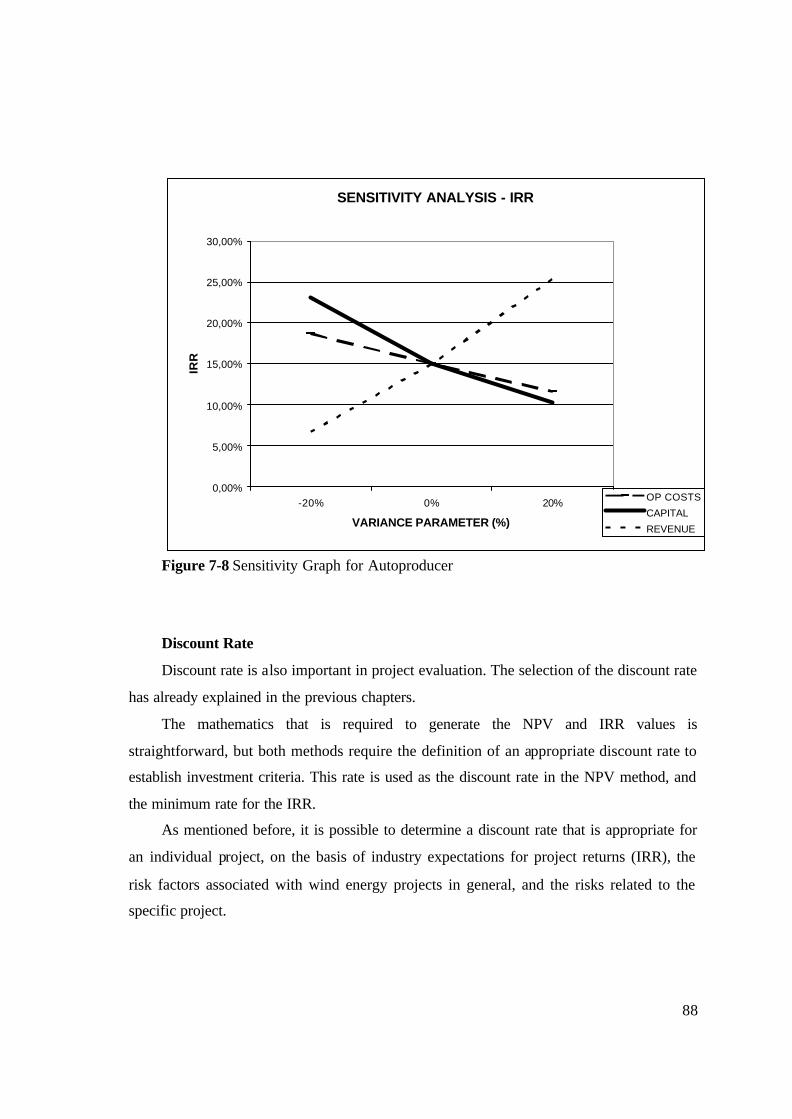
88
SENSITIVITY ANALYSIS - IRR
0,00%
5,00%
10,00%
15,00%
20,00%
25,00%
30,00%
-20% 0% 20%
VARIANCE PARAMETER (%)
IRR
OP COSTS
CAPITAL
REVENUE
Figure 7-8 Sensitivity Graph for Autoproducer
Discount Rate
Discount rate is also important in project evaluation. The selection of the discount rate
has already explained in the previous chapters.
The mathematics that is required to generate the NPV and IRR values is
straightforward, but both methods require the definition of an appropriate discount rate to
establish investment criteria. This rate is used as the discount rate in the NPV method, and
the minimum rate for the IRR.
As mentioned before, it is possible to determine a discount rate that is appropriate for
an individual project, on the basis of industry expectations for project returns (IRR), the
risk factors associated with wind energy projects in general, and the risks related to the
specific project.
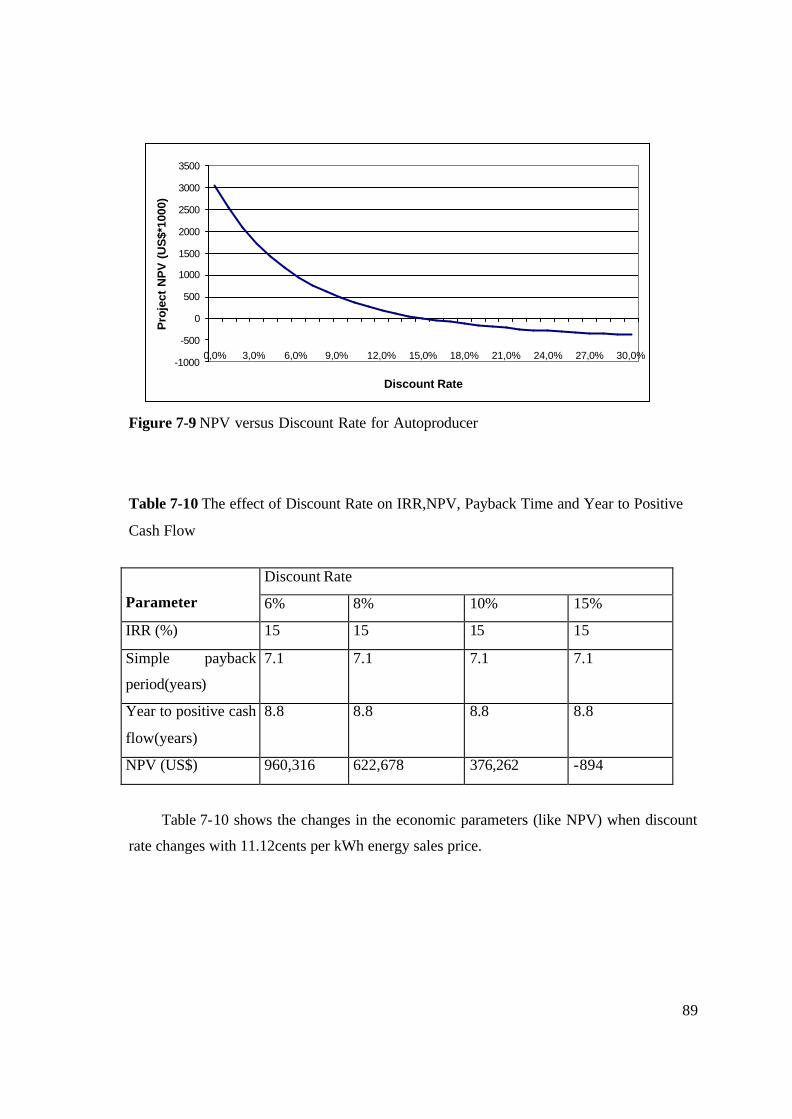
89
-1000
-500
0
500
1000
1500
2000
2500
3000
3500
0,0% 3,0% 6,0% 9,0% 12,0% 15,0% 18,0% 21,0% 24,0% 27,0% 30,0%
Discount Rate
Pro
ject
NP
V (
US
$*10
00)
Figure 7-9 NPV versus Discount Rate for Autoproducer
Table 7-10 The effect of Discount Rate on IRR,NPV, Payback Time and Year to Positive
Cash Flow
Discount Rate
Parameter 6% 8% 10% 15%
IRR (%) 15 15 15 15
Simple payback
period(years)
7.1 7.1 7.1 7.1
Year to positive cash
flow(years)
8.8 8.8 8.8 8.8
NPV (US$) 960,316 622,678 376,262 -894
Table 7-10 shows the changes in the economic parameters (like NPV) when discount
rate changes with 11.12cents per kWh energy sales price.
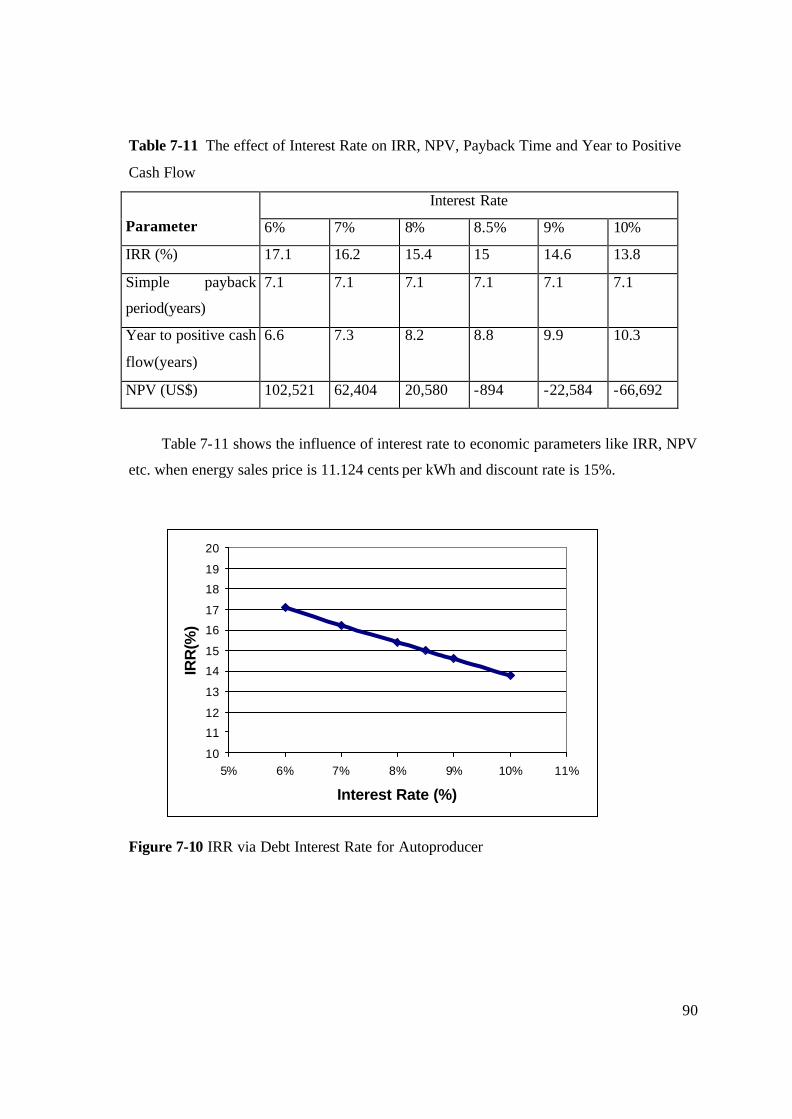
90
Table 7-11 The effect of Interest Rate on IRR, NPV, Payback Time and Year to Positive
Cash Flow
Interest Rate
Parameter 6% 7% 8% 8.5% 9% 10%
IRR (%) 17.1 16.2 15.4 15 14.6 13.8
Simple payback
period(years)
7.1 7.1 7.1 7.1 7.1 7.1
Year to positive cash
flow(years)
6.6 7.3 8.2 8.8 9.9 10.3
NPV (US$) 102,521 62,404 20,580 -894 -22,584 -66,692
Table 7-11 shows the influence of interest rate to economic parameters like IRR, NPV
etc. when energy sales price is 11.124 cents per kWh and discount rate is 15%.
10
11
12
13
14
15
16
17
18
19
20
5% 6% 7% 8% 9% 10% 11%
Interest Rate (%)
IRR
(%)
Figure 7-10 IRR via Debt Interest Rate for Autoproducer
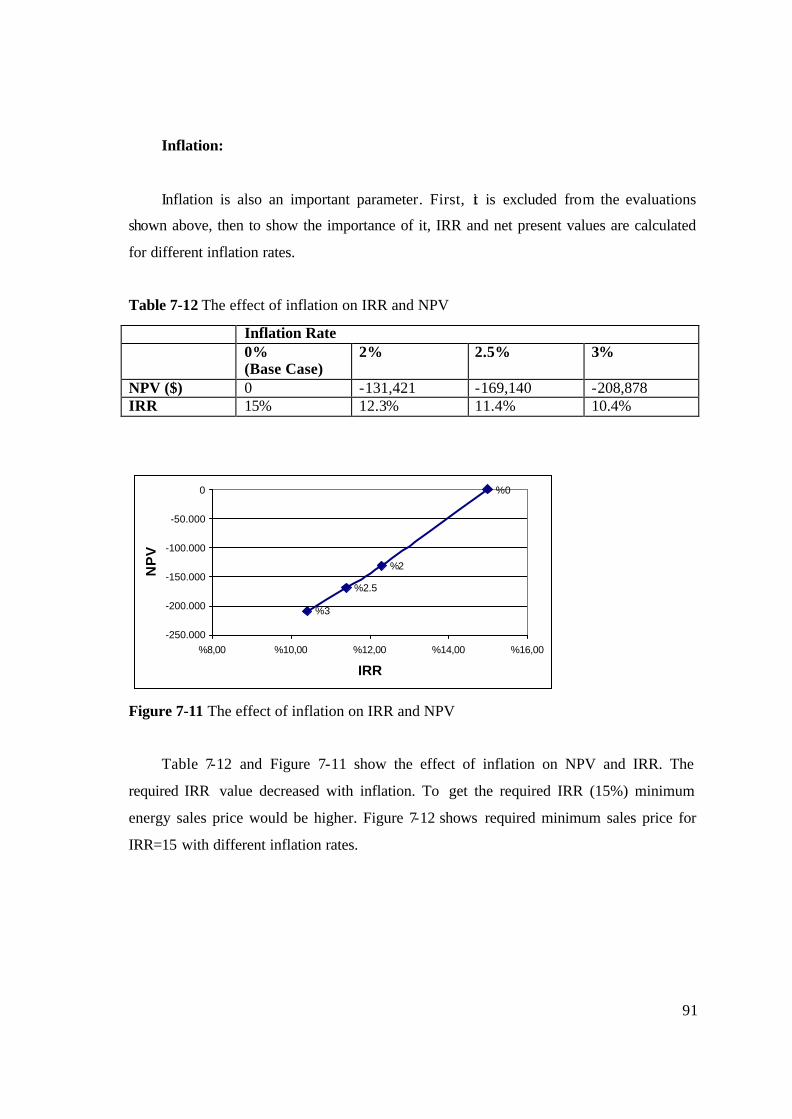
91
Inflation:
Inflation is also an important parameter. First, it is excluded from the evaluations
shown above, then to show the importance of it, IRR and net present values are calculated
for different inflation rates.
Table 7-12 The effect of inflation on IRR and NPV
Inflation Rate 0%
(Base Case) 2% 2.5% 3%
NPV ($) 0 -131,421 -169,140 -208,878 IRR 15% 12.3% 11.4% 10.4%
%2
%0
%2.5
%3
-250.000
-200.000
-150.000
-100.000
-50.000
0
%8,00 %10,00 %12,00 %14,00 %16,00
IRR
NP
V
Figure 7-11 The effect of inflation on IRR and NPV
Table 7-12 and Figure 7-11 show the effect of inflation on NPV and IRR. The
required IRR value decreased with inflation. To get the required IRR (15%) minimum
energy sales price would be higher. Figure 7-12 shows required minimum sales price for
IRR=15 with different inflation rates.
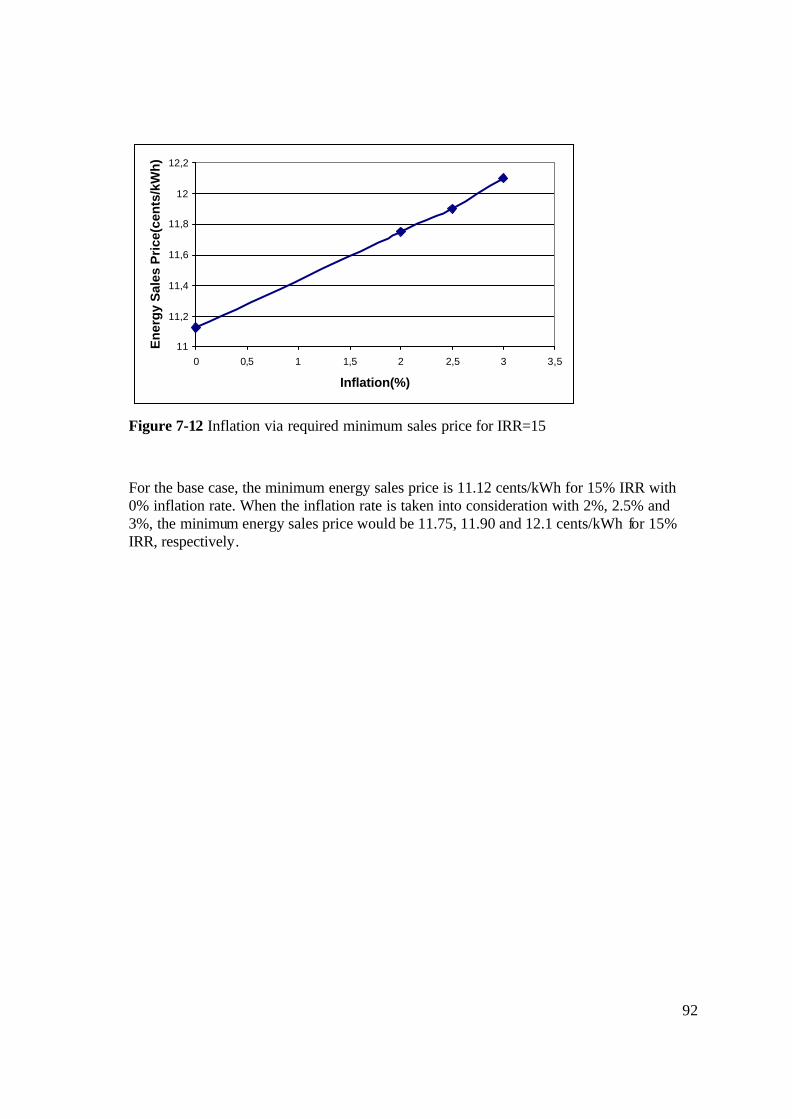
92
11
11,2
11,4
11,6
11,8
12
12,2
0 0,5 1 1,5 2 2,5 3 3,5
Inflation(%)
En
erg
y S
ales
Pri
ce(c
ents
/kW
h)
Figure 7-12 Inflation via required minimum sales price for IRR=15
For the base case, the minimum energy sales price is 11.12 cents/kWh for 15% IRR with 0% inflation rate. When the inflation rate is taken into consideration with 2%, 2.5% and 3%, the minimum energy sales price would be 11.75, 11.90 and 12.1 cents/kWh for 15% IRR, respectively.
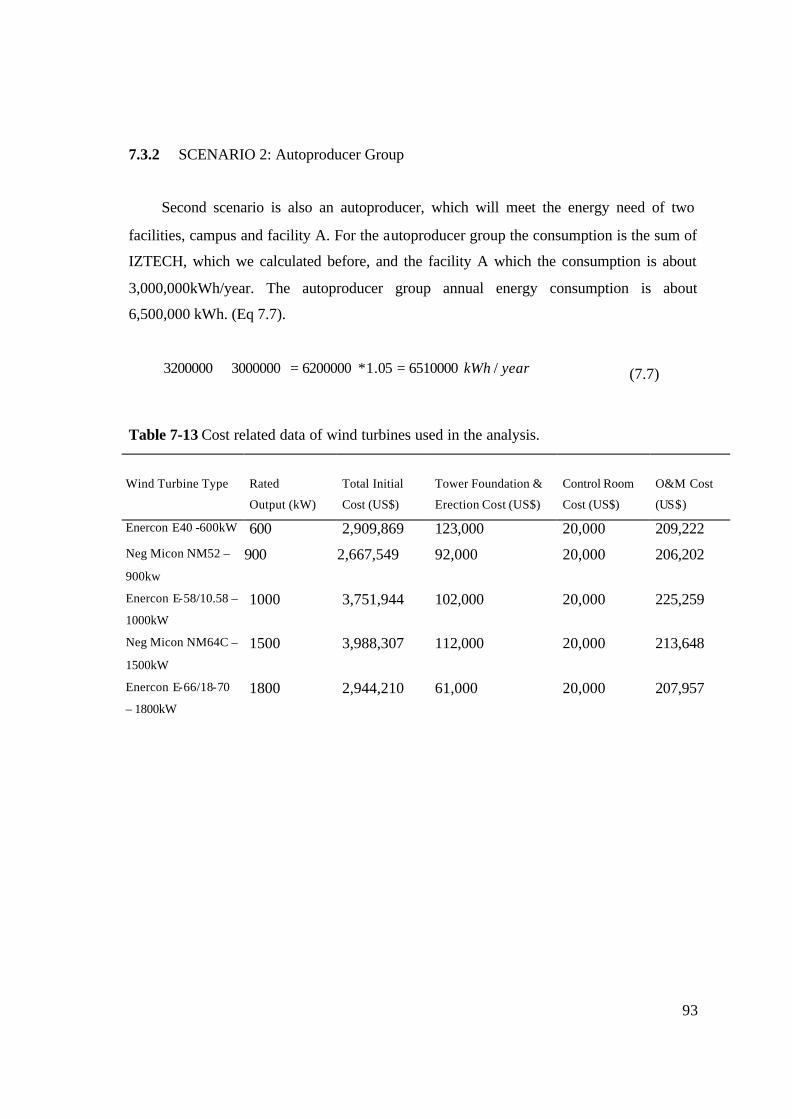
93
7.3.2 SCENARIO 2: Autoproducer Group
Second scenario is also an autoproducer, which will meet the energy need of two
facilities, campus and facility A. For the autoproducer group the consumption is the sum of
IZTECH, which we calculated before, and the facility A which the consumption is about
3,000,000kWh/year. The autoproducer group annual energy consumption is about
6,500,000 kWh. (Eq 7.7).
yearkWh /651000005.1*620000030000003200000 ==+ (7.7)
Table 7-13 Cost related data of wind turbines used in the analysis.
Wind Turbine Type
Rated
Output (kW)
Total Initial
Cost (US$)
Tower Foundation &
Erection Cost (US$)
Control Room
Cost (US$)
O&M Cost
(US$)
Enercon E40 -600kW 600 2,909,869 123,000 20,000 209,222
Neg Micon NM52 –
900kw
900 2,667,549 92,000 20,000 206,202
Enercon E-58/10.58 –
1000kW
1000 3,751,944 102,000 20,000 225,259
Neg Micon NM64C –
1500kW
1500 3,988,307 112,000 20,000 213,648
Enercon E-66/18-70
– 1800kW
1800 2,944,210 61,000 20,000 207,957
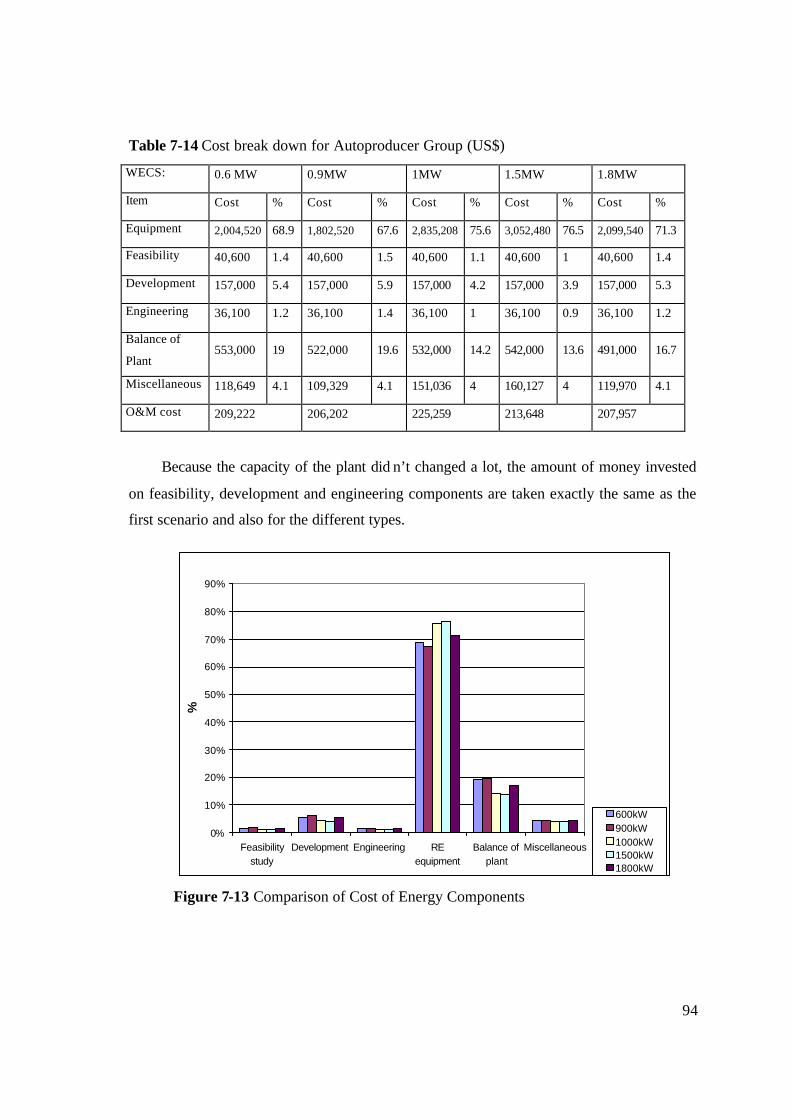
94
Table 7-14 Cost break down for Autoproducer Group (US$)
WECS: 0.6 MW 0.9MW 1MW 1.5MW 1.8MW
Item Cost % Cost % Cost % Cost % Cost %
Equipment 2,004,520 68.9 1,802,520 67.6 2,835,208 75.6 3,052,480 76.5 2,099,540 71.3
Feasibility 40,600 1.4 40,600 1.5 40,600 1.1 40,600 1 40,600 1.4
Development 157,000 5.4 157,000 5.9 157,000 4.2 157,000 3.9 157,000 5.3
Engineering 36,100 1.2 36,100 1.4 36,100 1 36,100 0.9 36,100 1.2
Balance of
Plant 553,000 19 522,000 19.6 532,000 14.2 542,000 13.6 491,000 16.7
Miscellaneous 118,649 4.1 109,329 4.1 151,036 4 160,127 4 119,970 4.1
O&M cost 209,222 206,202 225,259 213,648 207,957
Because the capacity of the plant did n’t changed a lot, the amount of money invested
on feasibility, development and engineering components are taken exactly the same as the
first scenario and also for the different types.
0%
10%
20%
30%
40%
50%
60%
70%
80%
90%
Feasibilitystudy
Development Engineering REequipment
Balance ofplant
Miscellaneous
%
600kW900kW1000kW1500kW1800kW
Figure 7-13 Comparison of Cost of Energy Components
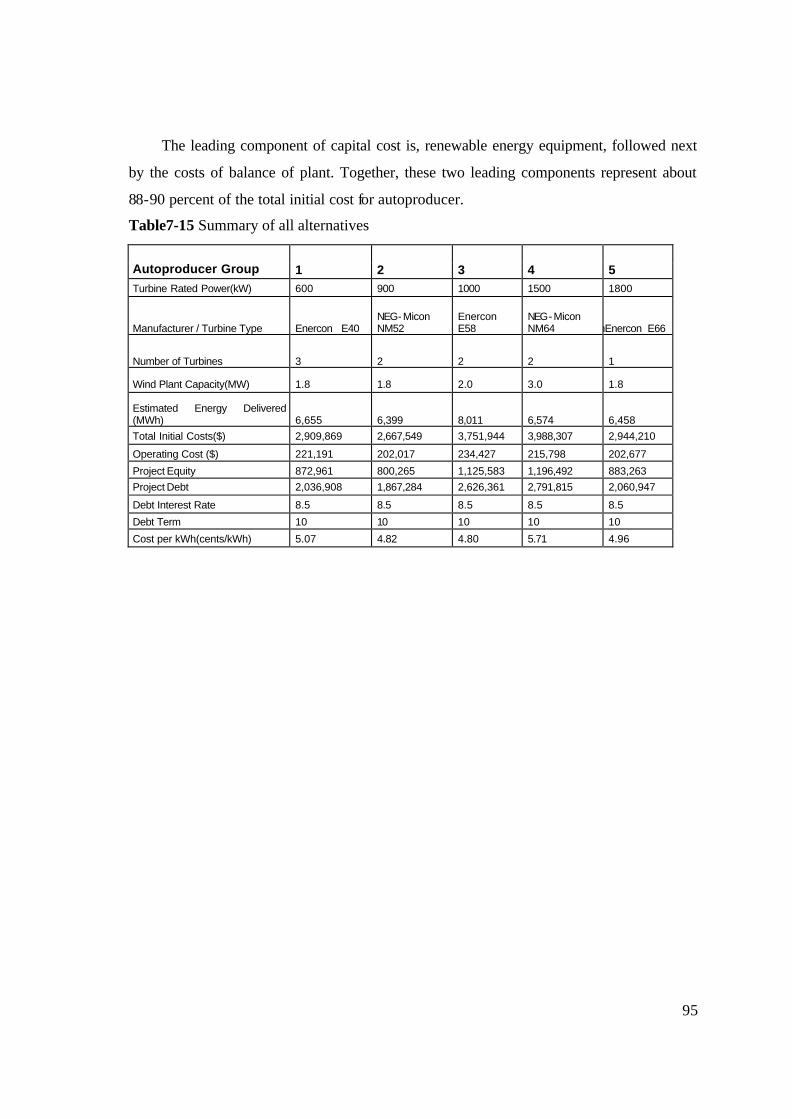
95
The leading component of capital cost is, renewable energy equipment, followed next
by the costs of balance of plant. Together, these two leading components represent about
88-90 percent of the total initial cost for autoproducer.
Table7-15 Summary of all alternatives
Autoproducer Group 1 2 3 4 5 Turbine Rated Power(kW) 600 900 1000 1500 1800
Manufacturer / Turbine Type Enercon E40 NEG-Micon NM52
Enercon E58
NEG-Micon NM64 EnEnercon E66
Number of Turbines 3 2 2 2 1
Wind Plant Capacity(MW) 1.8 1.8 2.0 3.0 1.8
Estimated Energy Delivered (MWh) 6,655 6,399 8,011 6,574 6,458 Total Initial Costs($) 2,909,869 2,667,549 3,751,944 3,988,307 2,944,210
Operating Cost ($) 221,191 202,017 234,427 215,798 202,677
Project Equity 872,961 800,265 1,125,583 1,196,492 883,263 Project Debt 2,036,908 1,867,284 2,626,361 2,791,815 2,060,947
Debt Interest Rate 8.5 8.5 8.5 8.5 8.5
Debt Term 10 10 10 10 10
Cost per kWh(cents/kWh) 5.07 4.82 4.80 5.71 4.96
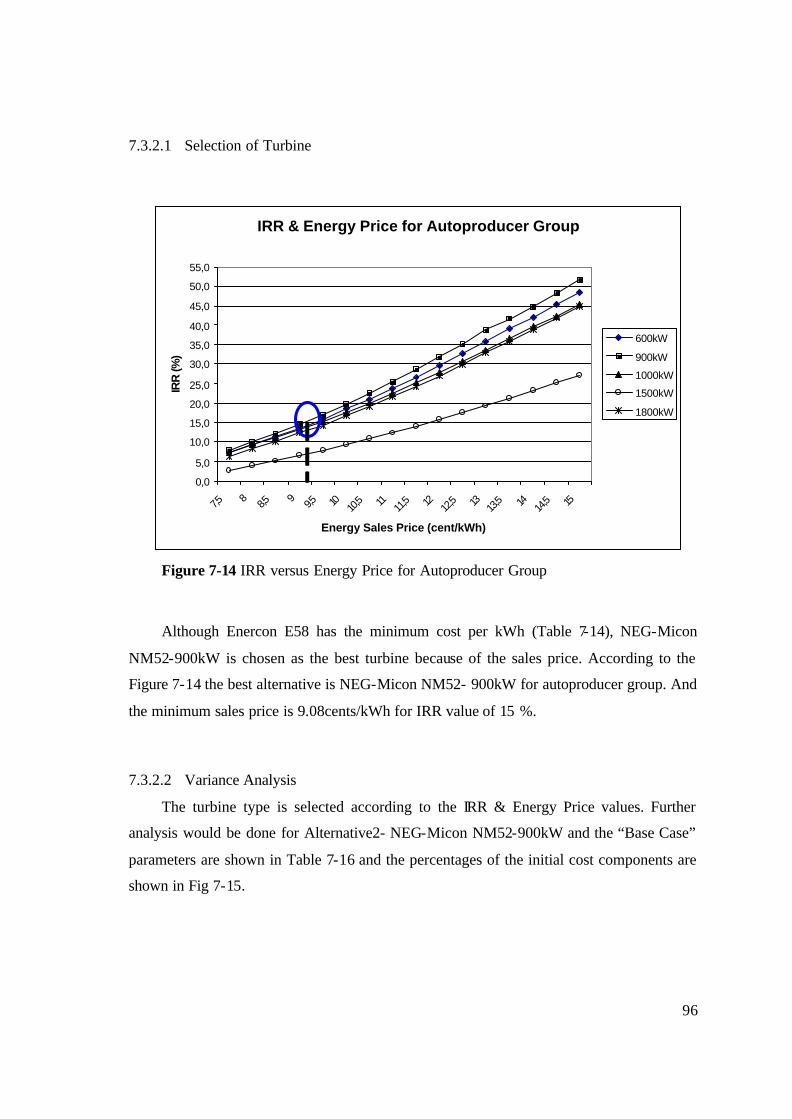
96
7.3.2.1 Selection of Turbine
Figure 7-14 IRR versus Energy Price for Autoproducer Group
Although Enercon E58 has the minimum cost per kWh (Table 7-14), NEG-Micon
NM52-900kW is chosen as the best turbine because of the sales price. According to the
Figure 7-14 the best alternative is NEG-Micon NM52- 900kW for autoproducer group. And
the minimum sales price is 9.08cents/kWh for IRR value of 15 %.
7.3.2.2 Variance Analysis
The turbine type is selected according to the IRR & Energy Price values. Further
analysis would be done for Alternative2- NEG-Micon NM52-900kW and the “Base Case”
parameters are shown in Table 7-16 and the percentages of the initial cost components are
shown in Fig 7-15.
IRR & Energy Price for Autoproducer Group
0,0
5,0
10,0
15,0
20,0
25,0
30,0
35,0
40,0
45,0
50,0
55,0
7,5 8 8,5 9 9,5 10 10,5 11 11
,5 12 12,5 13 13
,5 14 14,5 15
Energy Sales Price (cent/kWh)
IRR
(%)
600kW
900kW
1000kW
1500kW
1800kW
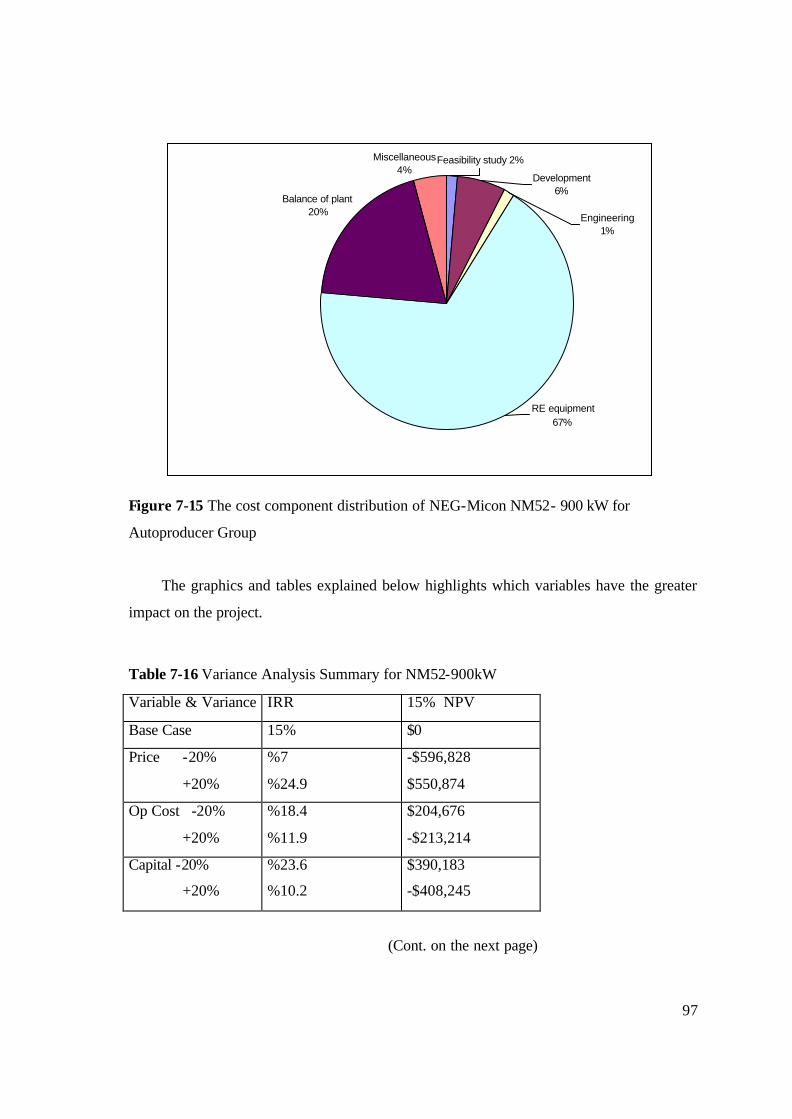
97
Balance of plant20%
RE equipment67%
Miscellaneous4%
Feasibility study 2%
Development6%
Engineering1%
Figure 7-15 The cost component distribution of NEG-Micon NM52- 900 kW for
Autoproducer Group
The graphics and tables explained below highlights which variables have the greater
impact on the project.
Table 7-16 Variance Analysis Summary for NM52-900kW
Variable & Variance IRR 15% NPV
Base Case 15% $0
Price -20%
+20%
%7
%24.9
-$596,828
$550,874
Op Cost -20%
+20%
%18.4
%11.9
$204,676
-$213,214
Capital -20%
+20%
%23.6
%10.2
$390,183
-$408,245
(Cont. on the next page)
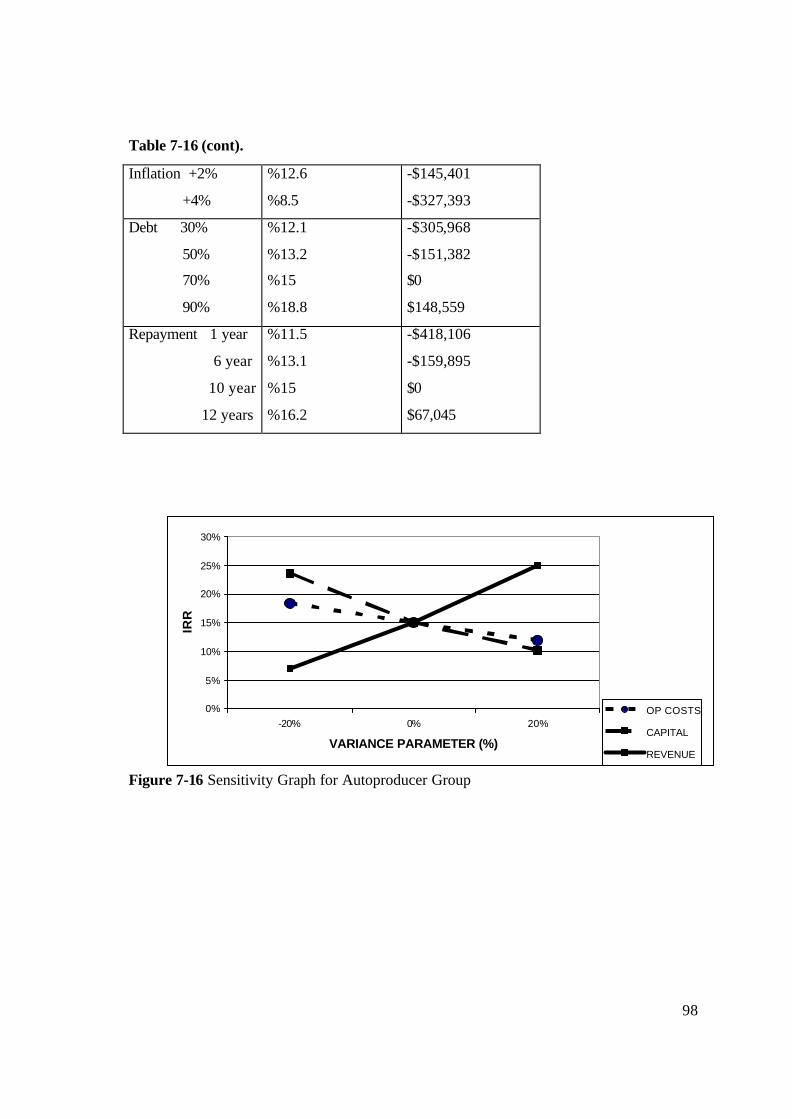
98
Table 7-16 (cont).
Inflation +2%
+4%
%12.6
%8.5
-$145,401
-$327,393
Debt 30%
50%
70%
90%
%12.1
%13.2
%15
%18.8
-$305,968
-$151,382
$0
$148,559
Repayment 1 year
6 year
10 year
12 years
%11.5
%13.1
%15
%16.2
-$418,106
-$159,895
$0
$67,045
0%
5%
10%
15%
20%
25%
30%
-20% 0% 20%
VARIANCE PARAMETER (%)
IRR
OP COSTS
CAPITAL
REVENUE
Figure 7-16 Sensitivity Graph for Autoproducer Group
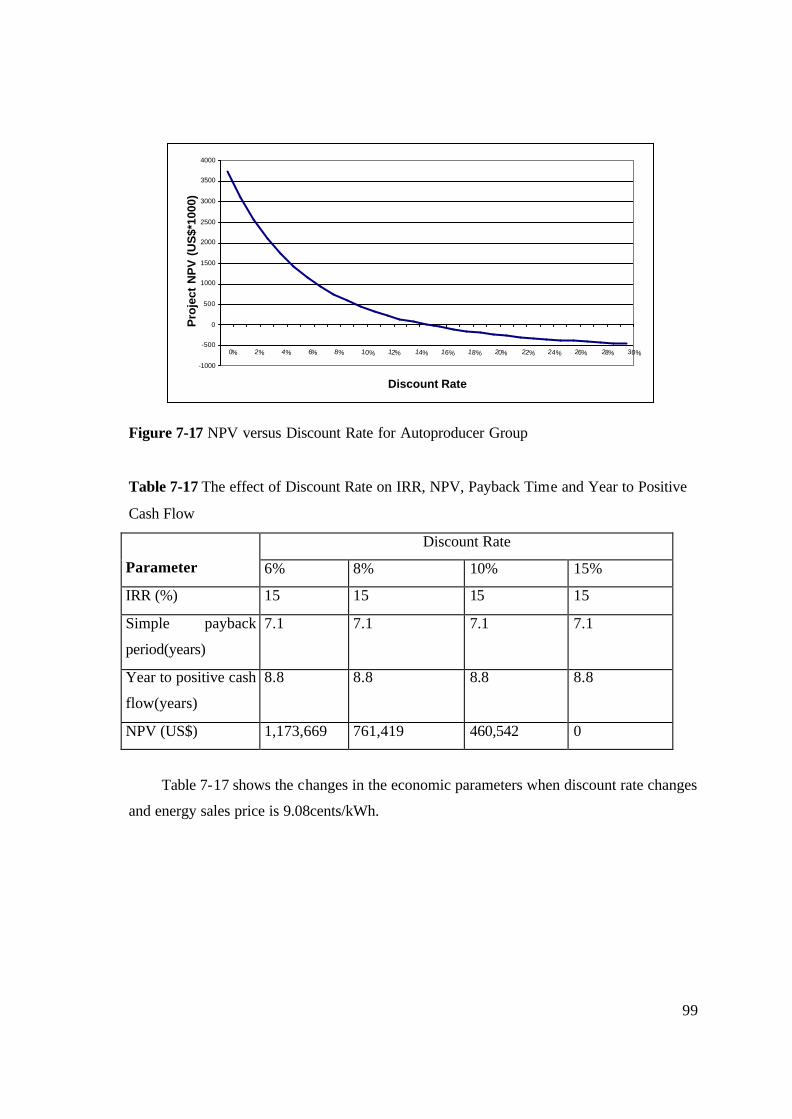
99
-1000
-500
0
500
1000
1500
2000
2500
3000
3500
4000
0% 2% 4% 6% 8% 10% 12% 14% 16% 18% 20% 22% 24% 26% 28% 30%
Discount Rate
Pro
ject
NP
V (
US
$*10
00)
Figure 7-17 NPV versus Discount Rate for Autoproducer Group
Table 7-17 The effect of Discount Rate on IRR, NPV, Payback Time and Year to Positive
Cash Flow
Discount Rate
Parameter 6% 8% 10% 15%
IRR (%) 15 15 15 15
Simple payback
period(years)
7.1 7.1 7.1 7.1
Year to positive cash
flow(years)
8.8 8.8 8.8 8.8
NPV (US$) 1,173,669 761,419 460,542 0
Table 7-17 shows the changes in the economic parameters when discount rate changes
and energy sales price is 9.08cents/kWh.
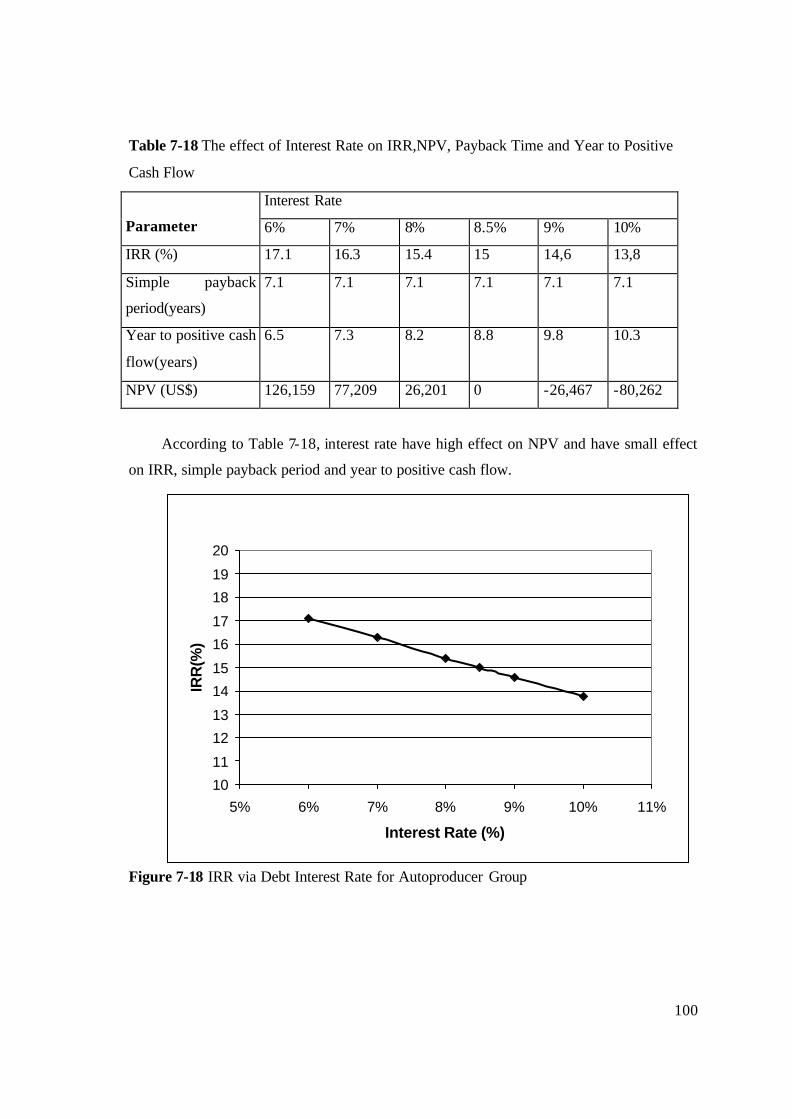
100
Table 7-18 The effect of Interest Rate on IRR,NPV, Payback Time and Year to Positive
Cash Flow
Interest Rate
Parameter 6% 7% 8% 8.5% 9% 10%
IRR (%) 17.1 16.3 15.4 15 14,6 13,8
Simple payback
period(years)
7.1 7.1 7.1 7.1 7.1 7.1
Year to positive cash
flow(years)
6.5 7.3 8.2 8.8 9.8 10.3
NPV (US$) 126,159 77,209 26,201 0 -26,467 -80,262
According to Table 7-18, interest rate have high effect on NPV and have small effect
on IRR, simple payback period and year to positive cash flow.
10
11
12
13
14
15
16
17
18
19
20
5% 6% 7% 8% 9% 10% 11%
Interest Rate (%)
IRR
(%)
Figure 7-18 IRR via Debt Interest Rate for Autoproducer Group
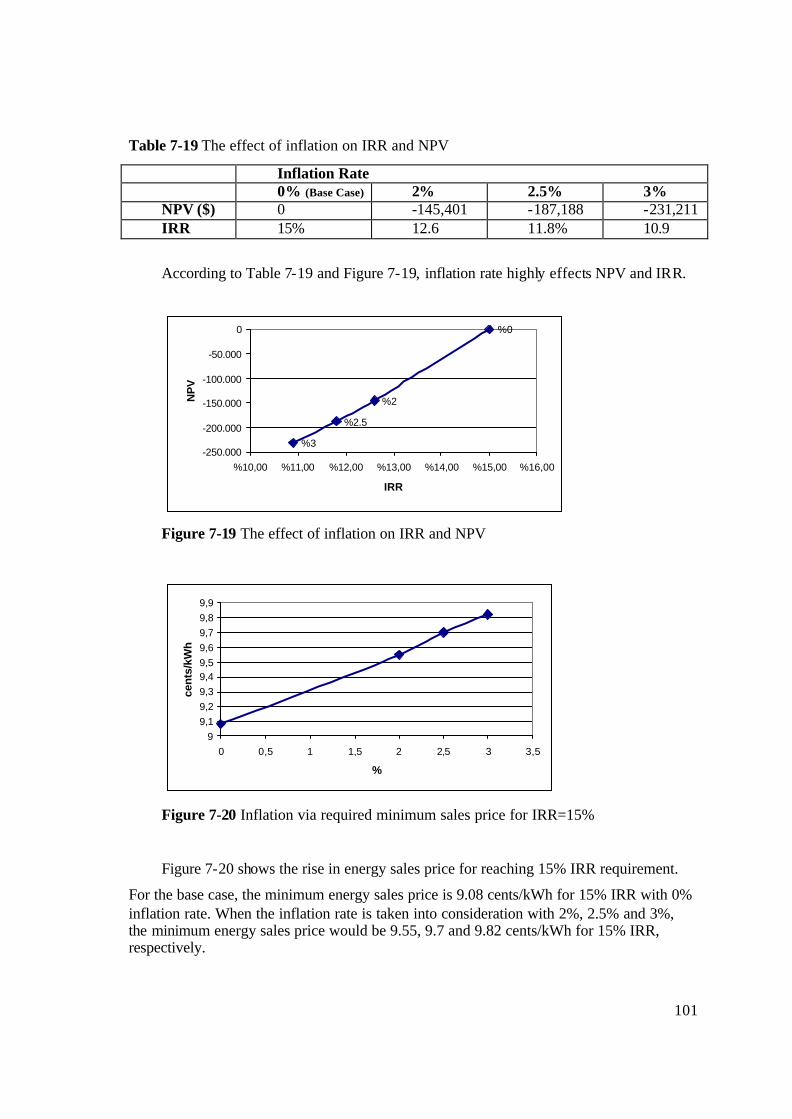
101
Table 7-19 The effect of inflation on IRR and NPV
Inflation Rate 0% (Base Case) 2% 2.5% 3% NPV ($) 0 -145,401 -187,188 -231,211 IRR 15% 12.6 11.8% 10.9
According to Table 7-19 and Figure 7-19, inflation rate highly effects NPV and IRR.
%2
%0
%2.5
%3-250.000
-200.000
-150.000
-100.000
-50.000
0
%10,00 %11,00 %12,00 %13,00 %14,00 %15,00 %16,00
IRR
NP
V
Figure 7-19 The effect of inflation on IRR and NPV
99,19,29,39,49,59,69,79,89,9
0 0,5 1 1,5 2 2,5 3 3,5
%
cen
ts/k
Wh
Figure 7-20 Inflation via required minimum sales price for IRR=15%
Figure 7-20 shows the rise in energy sales price for reaching 15% IRR requirement.
For the base case, the minimum energy sales price is 9.08 cents/kWh for 15% IRR with 0% inflation rate. When the inflation rate is taken into consideration with 2%, 2.5% and 3%, the minimum energy sales price would be 9.55, 9.7 and 9.82 cents/kWh for 15% IRR, respectively.
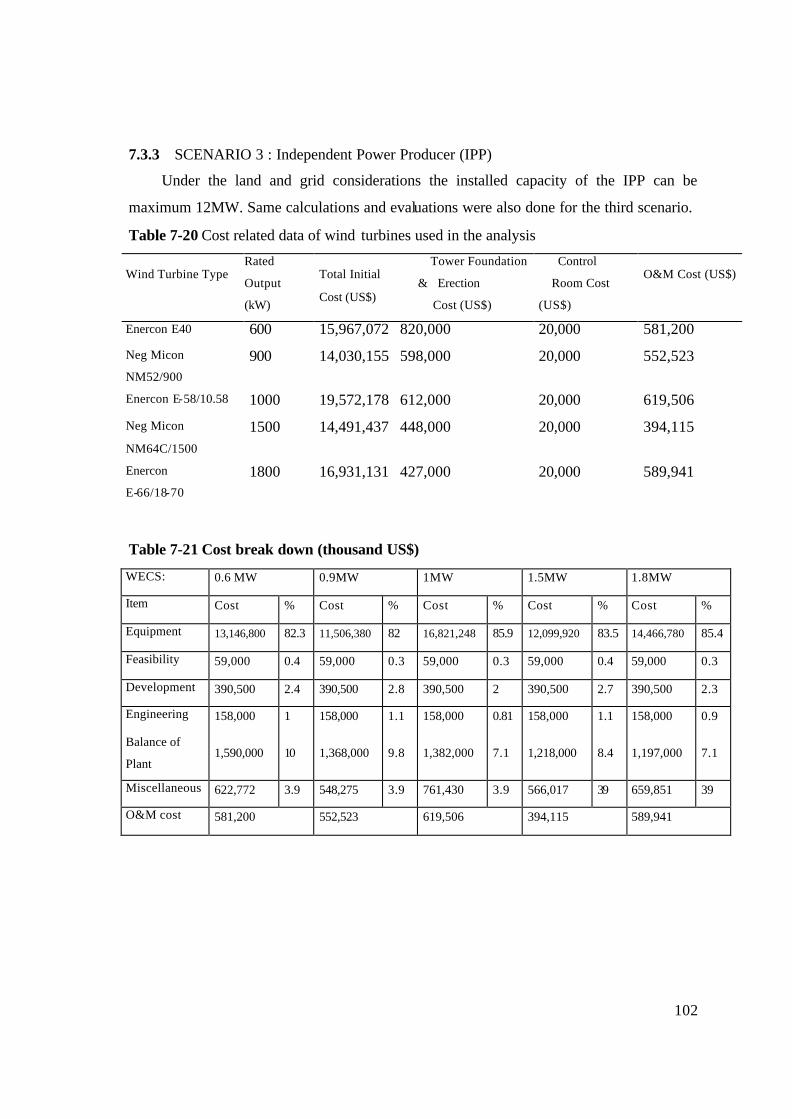
102
7.3.3 SCENARIO 3 : Independent Power Producer (IPP)
Under the land and grid considerations the installed capacity of the IPP can be
maximum 12MW. Same calculations and evaluations were also done for the third scenario.
Table 7-20 Cost related data of wind turbines used in the analysis
Wind Turbine Type Rated
Output
(kW)
Total Initial
Cost (US$)
Tower Foundation
& Erection
Cost (US$)
Control
Room Cost
(US$)
O&M Cost (US$)
Enercon E40 600 15,967,072 820,000 20,000 581,200
Neg Micon
NM52/900
900 14,030,155 598,000 20,000 552,523
Enercon E-58/10.58 1000 19,572,178 612,000 20,000 619,506
Neg Micon
NM64C/1500
1500 14,491,437 448,000 20,000 394,115
Enercon
E-66/18-70
1800 16,931,131 427,000 20,000 589,941
Table 7-21 Cost break down (thousand US$)
WECS: 0.6 MW 0.9MW 1MW 1.5MW 1.8MW
Item Cost % Cost % Cost % Cost % Cost %
Equipment 13,146,800 82.3 11,506,380 82 16,821,248 85.9 12,099,920 83.5 14,466,780 85.4
Feasibility 59,000 0.4 59,000 0.3 59,000 0.3 59,000 0.4 59,000 0.3
Development 390,500 2.4 390,500 2.8 390,500 2 390,500 2.7 390,500 2.3
Engineering 158,000 1 158,000 1.1 158,000 0.81 158,000 1.1 158,000 0.9
Balance of
Plant 1,590,000 10 1,368,000 9.8 1,382,000 7.1 1,218,000 8.4 1,197,000 7.1
Miscellaneous 622,772 3.9 548,275 3.9 761,430 3.9 566,017 39 659,851 39
O&M cost 581,200 552,523 619,506 394,115 589,941
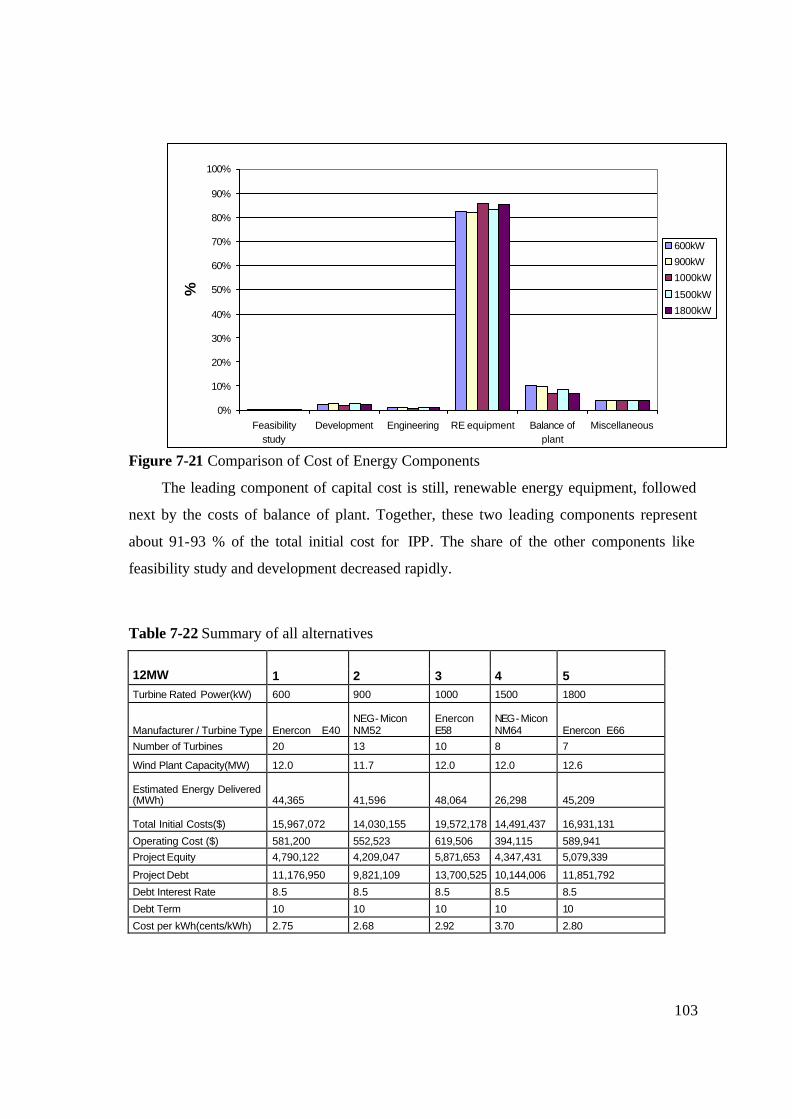
103
0%
10%
20%
30%
40%
50%
60%
70%
80%
90%
100%
Feasibilitystudy
Development Engineering RE equipment Balance ofplant
Miscellaneous
%
600kW
900kW
1000kW
1500kW
1800kW
Figure 7-21 Comparison of Cost of Energy Components
The leading component of capital cost is still, renewable energy equipment, followed
next by the costs of balance of plant. Together, these two leading components represent
about 91-93 % of the total initial cost for IPP. The share of the other components like
feasibility study and development decreased rapidly.
Table 7-22 Summary of all alternatives
12MW 1 2 3 4 5 Turbine Rated Power(kW) 600 900 1000 1500 1800
Manufacturer / Turbine Type Enercon E40 NEG-Micon NM52
Enercon E58
NEG-Micon NM64 Enercon E66
Number of Turbines 20 13 10 8 7
Wind Plant Capacity(MW) 12.0 11.7 12.0 12.0 12.6
Estimated Energy Delivered (MWh) 44,365 41,596 48,064 26,298 45,209
Total Initial Costs($) 15,967,072 14,030,155 19,572,178 14,491,437 16,931,131
Operating Cost ($) 581,200 552,523 619,506 394,115 589,941 Project Equity 4,790,122 4,209,047 5,871,653 4,347,431 5,079,339
Project Debt 11,176,950 9,821,109 13,700,525 10,144,006 11,851,792
Debt Interest Rate 8.5 8.5 8.5 8.5 8.5
Debt Term 10 10 10 10 10
Cost per kWh(cents/kWh) 2.75 2.68 2.92 3.70 2.80
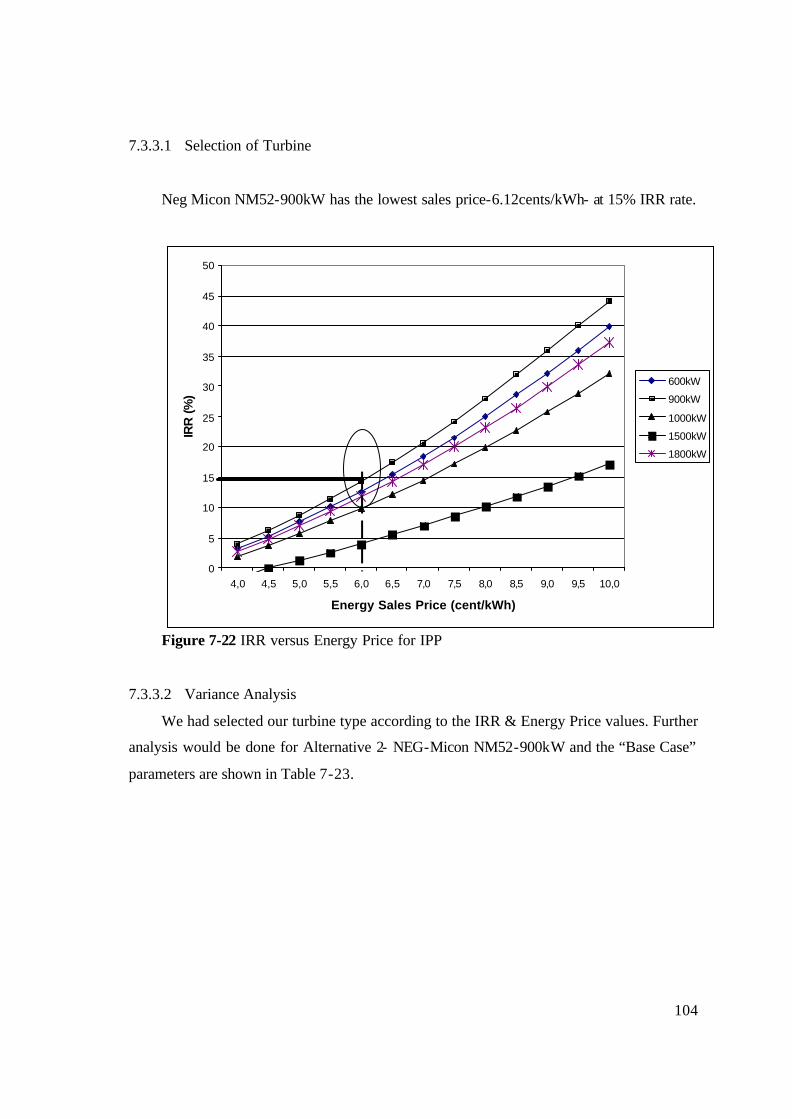
104
7.3.3.1 Selection of Turbine
Neg Micon NM52-900kW has the lowest sales price-6.12cents/kWh- at 15% IRR rate.
Figure 7-22 IRR versus Energy Price for IPP
7.3.3.2 Variance Analysis
We had selected our turbine type according to the IRR & Energy Price values. Further
analysis would be done for Alternative 2- NEG-Micon NM52-900kW and the “Base Case”
parameters are shown in Table 7-23.
0
5
10
15
20
25
30
35
40
45
50
4,0 4,5 5,0 5,5 6,0 6,5 7,0 7,5 8,0 8,5 9,0 9,5 10,0
Energy Sales Price (cent/kWh)
IRR
(%
)
600kW
900kW
1000kW
1500kW
1800kW
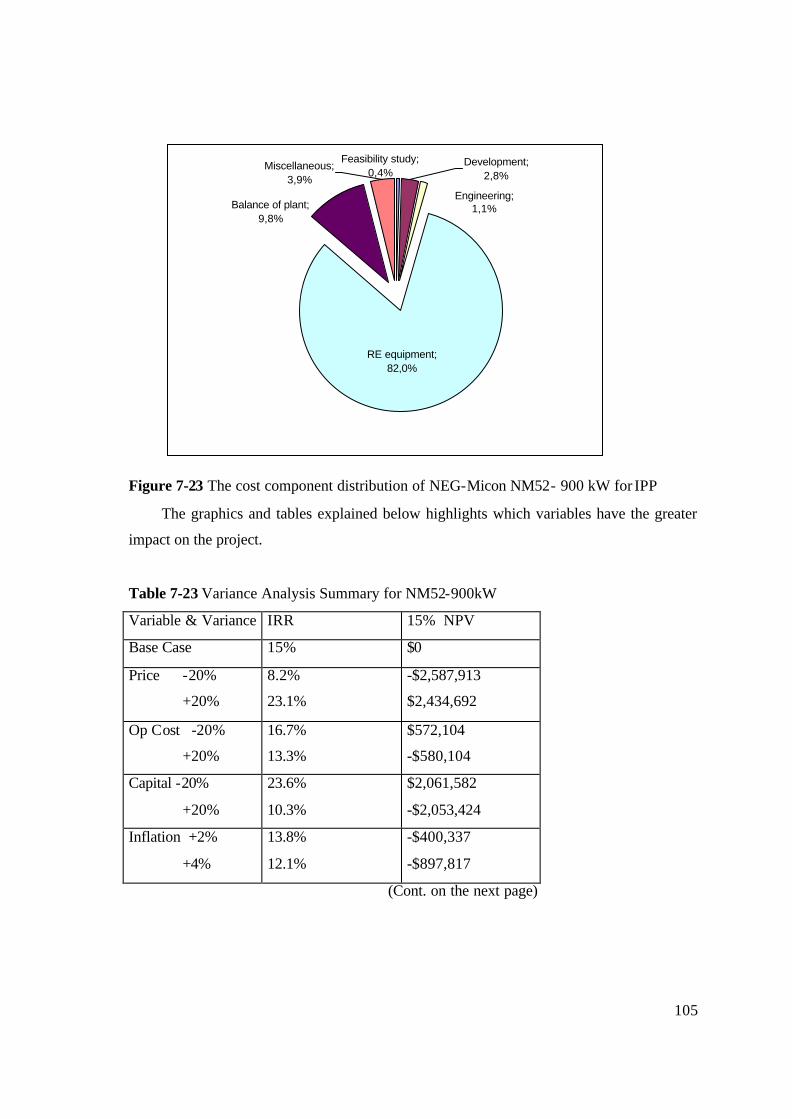
105
RE equipment; 82,0%
Engineering; 1,1%
Development; 2,8%
Feasibility study; 0,4%
Miscellaneous; 3,9%
Balance of plant; 9,8%
Figure 7-23 The cost component distribution of NEG-Micon NM52- 900 kW for IPP
The graphics and tables explained below highlights which variables have the greater
impact on the project.
Table 7-23 Variance Analysis Summary for NM52-900kW
Variable & Variance IRR 15% NPV
Base Case 15% $0
Price -20%
+20%
8.2%
23.1%
-$2,587,913
$2,434,692
Op Cost -20%
+20%
16.7%
13.3%
$572,104
-$580,104
Capital -20%
+20%
23.6%
10.3%
$2,061,582
-$2,053,424
Inflation +2%
+4%
13.8%
12.1%
-$400,337
-$897,817
(Cont. on the next page)
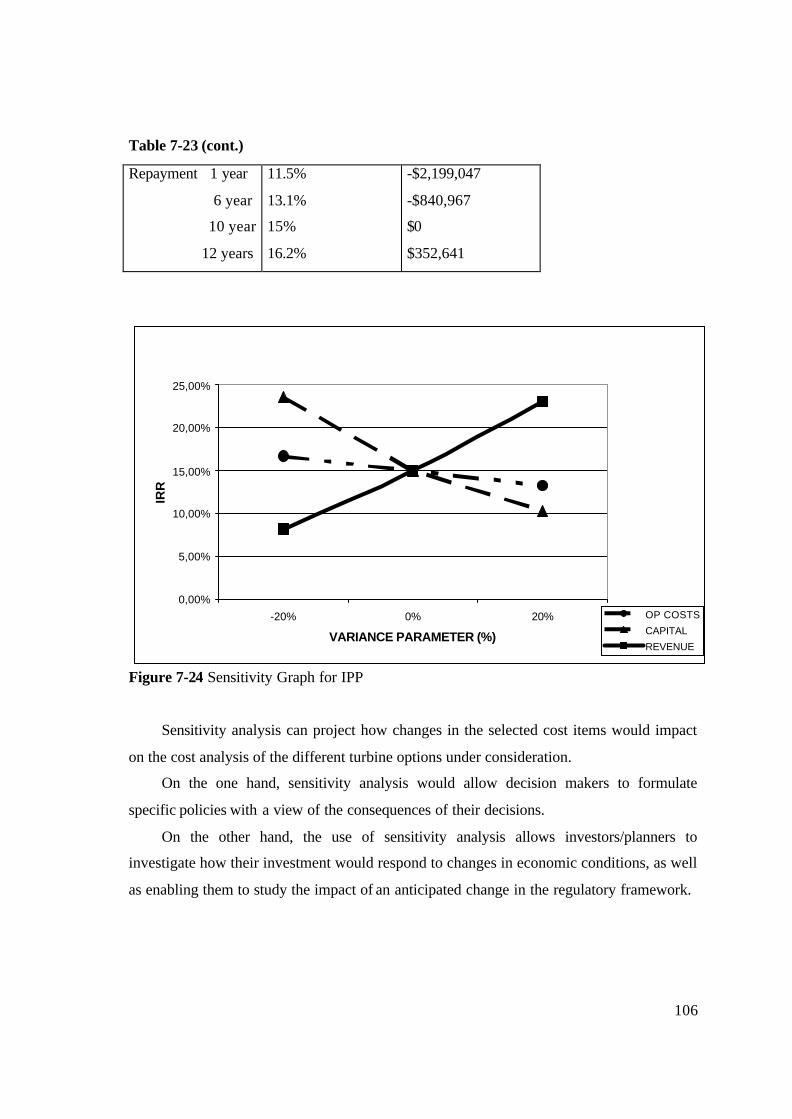
106
Table 7-23 (cont.)
Repayment 1 year
6 year
10 year
12 years
11.5%
13.1%
15%
16.2%
-$2,199,047
-$840,967
$0
$352,641
0,00%
5,00%
10,00%
15,00%
20,00%
25,00%
-20% 0% 20%
VARIANCE PARAMETER (%)
IRR
OP COSTS
CAPITAL
REVENUE
Figure 7-24 Sensitivity Graph for IPP
Sensitivity analysis can project how changes in the selected cost items would impact
on the cost analysis of the different turbine options under consideration.
On the one hand, sensitivity analysis would allow decision makers to formulate
specific policies with a view of the consequences of their decisions.
On the other hand, the use of sensitivity analysis allows investors/planners to
investigate how their investment would respond to changes in economic conditions, as well
as enabling them to study the impact of an anticipated change in the regulatory framework.
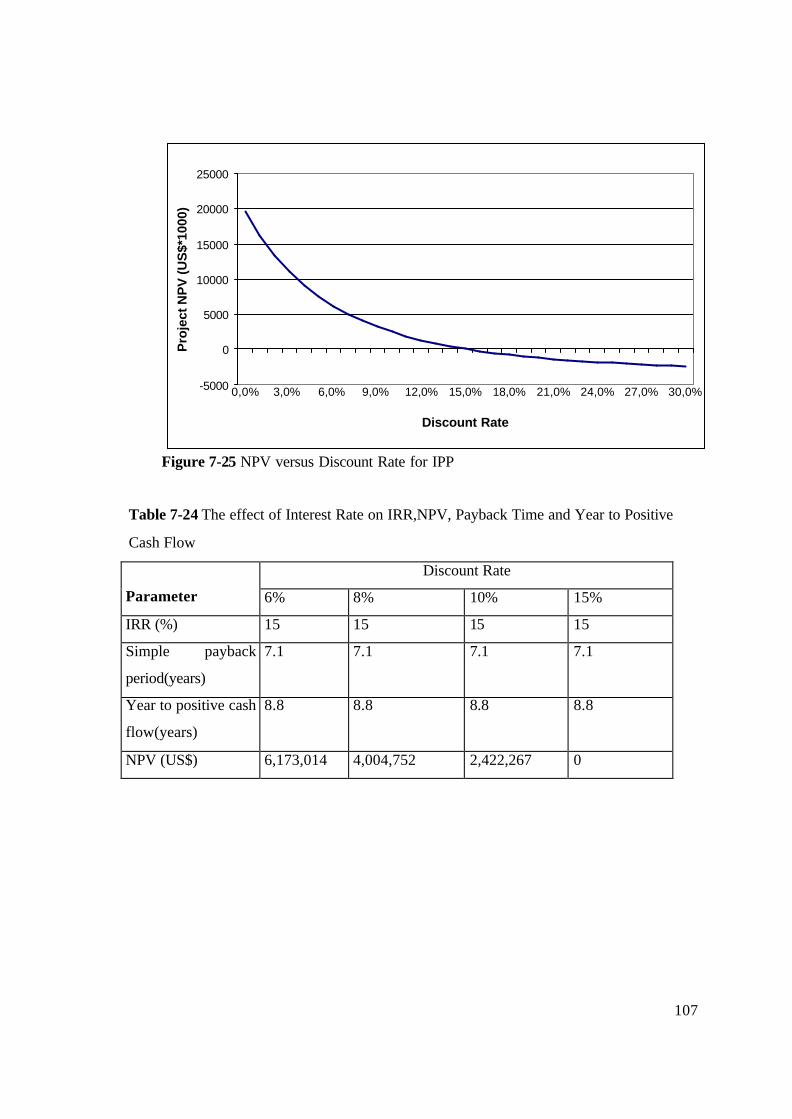
107
-5000
0
5000
10000
15000
20000
25000
0,0% 3,0% 6,0% 9,0% 12,0% 15,0% 18,0% 21,0% 24,0% 27,0% 30,0%
Discount Rate
Pro
ject
NP
V (U
S$*
1000
)
Figure 7-25 NPV versus Discount Rate for IPP
Table 7-24 The effect of Interest Rate on IRR,NPV, Payback Time and Year to Positive
Cash Flow
Discount Rate
Parameter 6% 8% 10% 15%
IRR (%) 15 15 15 15
Simple payback
period(years)
7.1 7.1 7.1 7.1
Year to positive cash
flow(years)
8.8 8.8 8.8 8.8
NPV (US$) 6,173,014 4,004,752 2,422,267 0
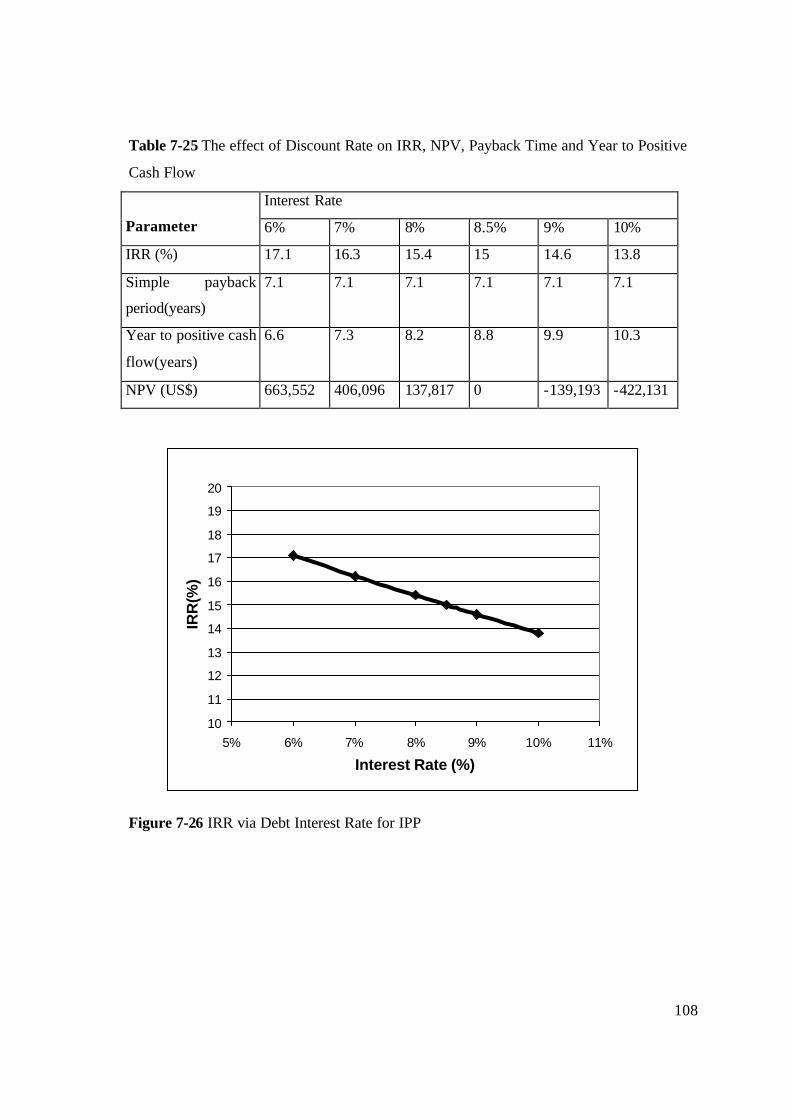
108
Table 7-25 The effect of Discount Rate on IRR, NPV, Payback Time and Year to Positive
Cash Flow
Interest Rate
Parameter 6% 7% 8% 8.5% 9% 10%
IRR (%) 17.1 16.3 15.4 15 14.6 13.8
Simple payback
period(years)
7.1 7.1 7.1 7.1 7.1 7.1
Year to positive cash
flow(years)
6.6 7.3 8.2 8.8 9.9 10.3
NPV (US$) 663,552 406,096 137,817 0 -139,193 -422,131
10
11
12
13
14
15
16
17
18
19
20
5% 6% 7% 8% 9% 10% 11%
Interest Rate (%)
IRR
(%)
Figure 7-26 IRR via Debt Interest Rate for IPP
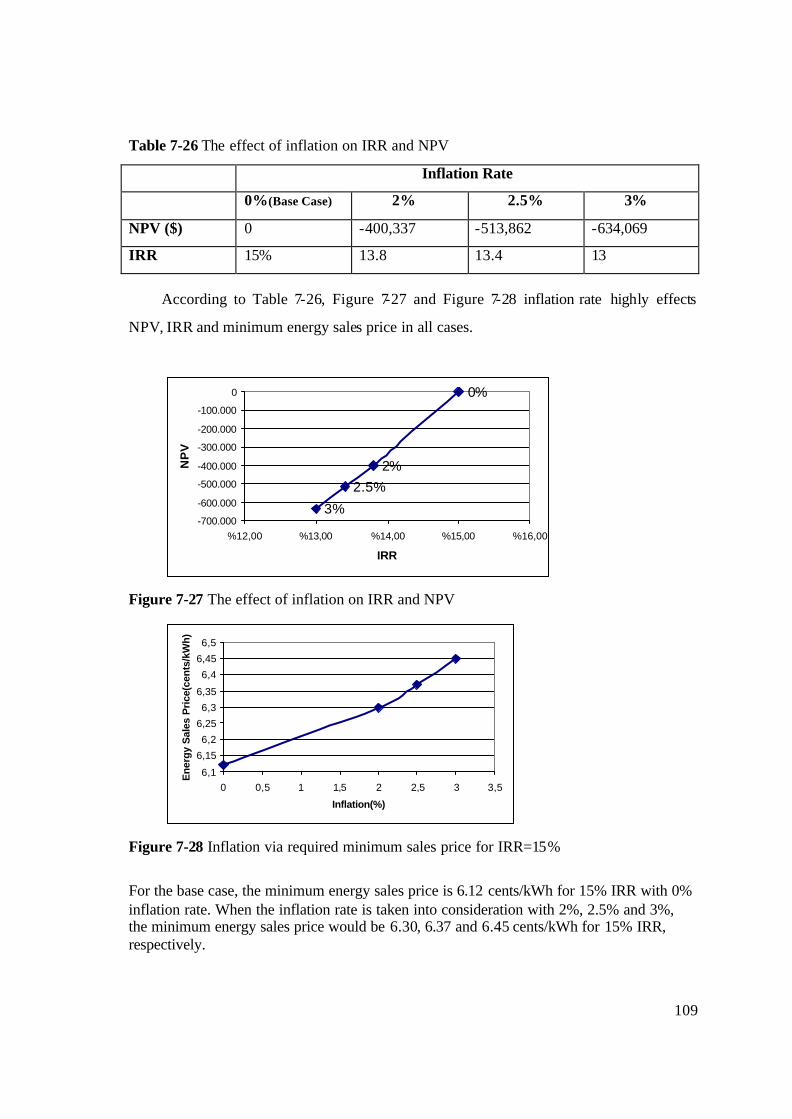
109
Table 7-26 The effect of inflation on IRR and NPV
Inflation Rate
0%(Base Case) 2% 2.5% 3%
NPV ($) 0 -400,337 -513,862 -634,069
IRR 15% 13.8 13.4 13
According to Table 7-26, Figure 7-27 and Figure 7-28 inflation rate highly effects
NPV, IRR and minimum energy sales price in all cases.
0%
2%2.5%
3%-700.000
-600.000
-500.000
-400.000
-300.000
-200.000
-100.000
0
%12,00 %13,00 %14,00 %15,00 %16,00
IRR
NP
V
Figure 7-27 The effect of inflation on IRR and NPV
6,1
6,15
6,2
6,25
6,3
6,35
6,4
6,45
6,5
0 0,5 1 1,5 2 2,5 3 3,5
Inflation(%)
Ene
rgy
Sal
es P
rice
(cen
ts/k
Wh)
Figure 7-28 Inflation via required minimum sales price for IRR=15%
For the base case, the minimum energy sales price is 6.12 cents/kWh for 15% IRR with 0% inflation rate. When the inflation rate is taken into consideration with 2%, 2.5% and 3%, the minimum energy sales price would be 6.30, 6.37 and 6.45 cents/kWh for 15% IRR, respectively.
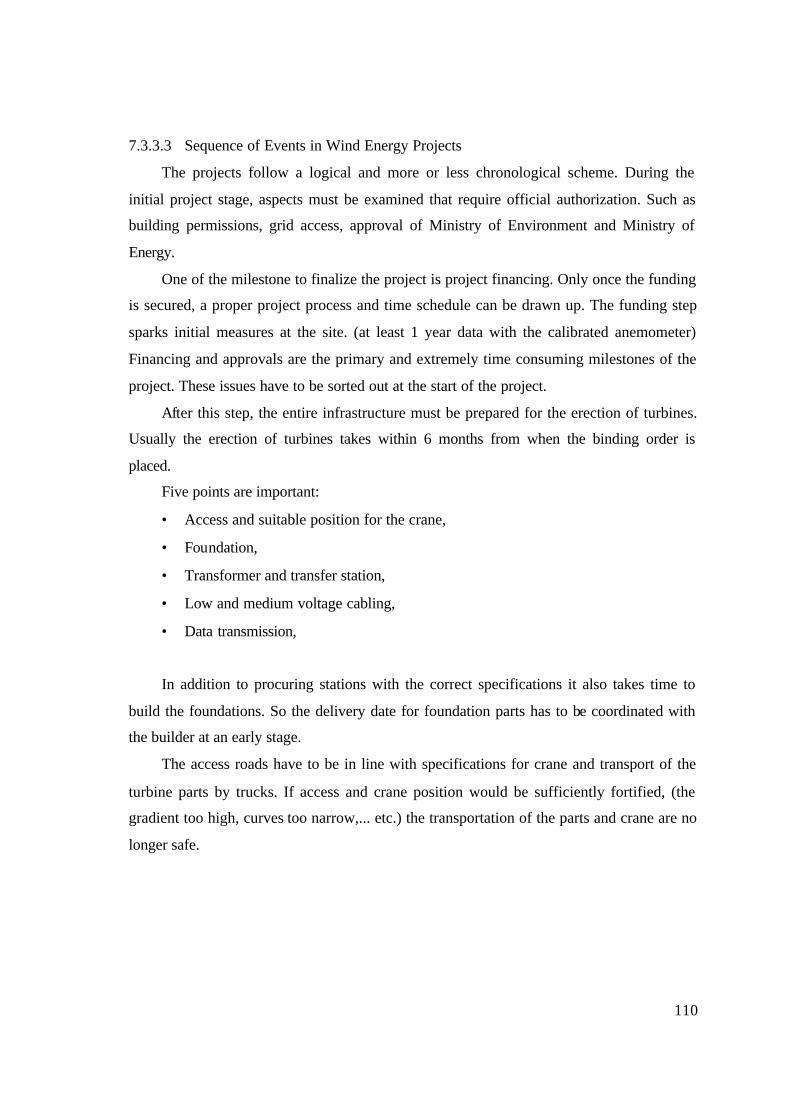
110
7.3.3.3 Sequence of Events in Wind Energy Projects
The projects follow a logical and more or less chronological scheme. During the
initial project stage, aspects must be examined that require official authorization. Such as
building permissions, grid access, approval of Ministry of Environment and Ministry of
Energy.
One of the milestone to finalize the project is project financing. Only once the funding
is secured, a proper project process and time schedule can be drawn up. The funding step
sparks initial measures at the site. (at least 1 year data with the calibrated anemometer)
Financing and approvals are the primary and extremely time consuming milestones of the
project. These issues have to be sorted out at the start of the project.
After this step, the entire infrastructure must be prepared for the erection of turbines.
Usually the erection of turbines takes within 6 months from when the binding order is
placed.
Five points are important:
• Access and suitable position for the crane,
• Foundation,
• Transformer and transfer station,
• Low and medium voltage cabling,
• Data transmission,
In addition to procuring stations with the correct specifications it also takes time to
build the foundations. So the delivery date for foundation parts has to be coordinated with
the builder at an early stage.
The access roads have to be in line with specifications for crane and transport of the
turbine parts by trucks. If access and crane position would be sufficiently fortified, (the
gradient too high, curves too narrow,... etc.) the transportation of the parts and crane are no
longer safe.
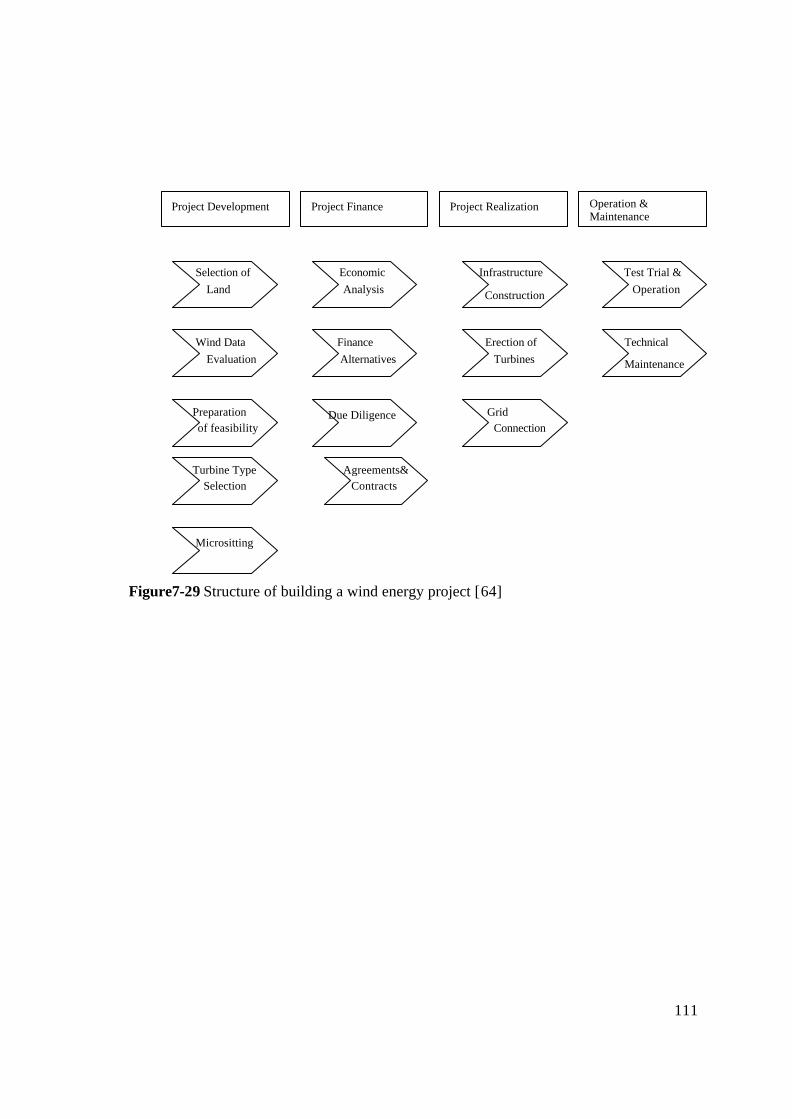
111
Figure7-29 Structure of building a wind energy project [64]
Project Development Project Finance Project Realization Operation & Maintenance
Selection of Land
Wind Data Evaluation
Preparation of feasibility
Turbine Type Selection
Micrositting
Economic Analysis
Finance Alternatives
Due Diligence
Agreements& Contracts
Infrastructure
Construction
Erection of Turbines
Grid Connection
Test Trial & Operation
Technical
Maintenance
112
Chapter 8 CONCLUSION
Most of the world energy demand is met by fossil fuel generated electricity. The fact
that the fossil fuels are going to be ended in 21st century, the energy sources have to be
verified. Wind energy is a good chose for verification. Another reason for using renewable
energy source is to lower dependency on foreign oil imports. Lastly, the green house gasses
and Kyoto Protocol are good reasons for renewable energy generation.
In most countries, hydro electricity generation is still the most dominant among all
Renewable energy technologies. Wind power generation took off in the mid 90s due to
technical progress and political incentives. Today, it is the most promising renewable
energy source (RES) in terms of market growth.
Also, wind energy is mature compared with many of the other renewables. Even at
today’s cost levels, it is close to being competitive with other power generation
technologies in some circumstances, and may even be cheaper at good sites as fuel prices
rise.
The electricity supply industry is highly capital intensive. It is probably more capital
intensive than any other sector, particularly in developing countries. Therefore, planning
and proper financial and economic evaluation of projects are important for rationalizing
investment and achieving economic efficiency. It is crucial that a more detailed feasibility
analysis has to be done after a potential cost-effective wind energy project has been
identified through the RETScreen.
According to the previous study, IZTECH campus has a mean speed of 8.14m/s at
30m. which is indicating “excellent” zone. The prevailing wind direction is North and
North Northeast. As far as wind potential of IZTECH site is acceptable, the economic
evaluation can be done for the site.
The economically feasible potential site is evaluated using estimations for the average
cost of electrical energy produced by each turbine and taking into account all the cost
parameters affecting the economics of Renewable Energy Technologies(RET)’s such as
installation cost, O&M costs, cost of grid interface, cost of civil works, etc. The influence
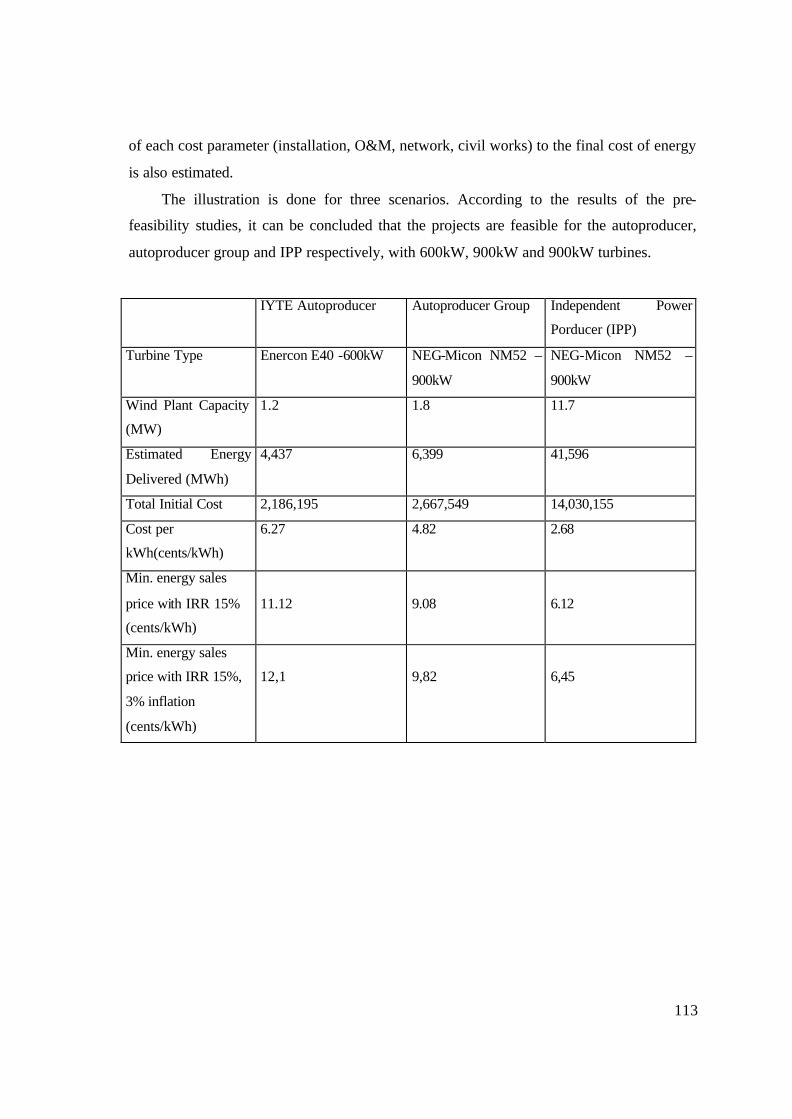
113
of each cost parameter (installation, O&M, network, civil works) to the final cost of energy
is also estimated.
The illustration is done for three scenarios. According to the results of the pre-
feasibility studies, it can be concluded that the projects are feasible for the autoproducer,
autoproducer group and IPP respectively, with 600kW, 900kW and 900kW turbines.
IYTE Autoproducer Autoproducer Group Independent Power
Porducer (IPP)
Turbine Type Enercon E40 -600kW NEG-Micon NM52 –
900kW
NEG-Micon NM52 –
900kW
Wind Plant Capacity
(MW)
1.2 1.8 11.7
Estimated Energy
Delivered (MWh)
4,437 6,399 41,596
Total Initial Cost 2,186,195 2,667,549 14,030,155
Cost per
kWh(cents/kWh)
6.27 4.82 2.68
Min. energy sales
price with IRR 15%
(cents/kWh)
11.12
9.08
6.12
Min. energy sales
price with IRR 15%,
3% inflation
(cents/kWh)
12,1
9,82
6,45
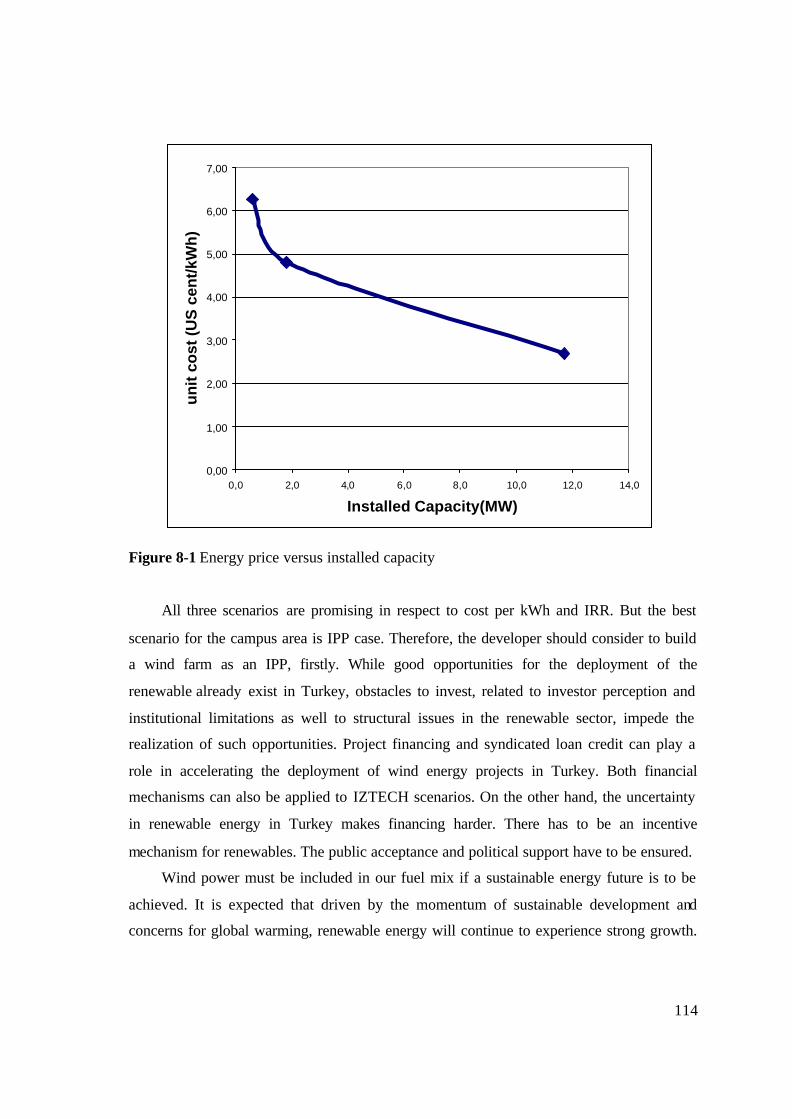
114
0,00
1,00
2,00
3,00
4,00
5,00
6,00
7,00
0,0 2,0 4,0 6,0 8,0 10,0 12,0 14,0
Installed Capacity(MW)
un
it c
ost
(U
S c
ent/
kWh
)
Figure 8-1 Energy price versus installed capacity
All three scenarios are promising in respect to cost per kWh and IRR. But the best
scenario for the campus area is IPP case. Therefore, the developer should consider to build
a wind farm as an IPP, firstly. While good opportunities for the deployment of the
renewable already exist in Turkey, obstacles to invest, related to investor perception and
institutional limitations as well to structural issues in the renewable sector, impede the
realization of such opportunities. Project financing and syndicated loan credit can play a
role in accelerating the deployment of wind energy projects in Turkey. Both financial
mechanisms can also be applied to IZTECH scenarios. On the other hand, the uncertainty
in renewable energy in Turkey makes financing harder. There has to be an incentive
mechanism for renewables. The public acceptance and political support have to be ensured.
Wind power must be included in our fuel mix if a sustainable energy future is to be
achieved. It is expected that driven by the momentum of sustainable development and
concerns for global warming, renewable energy will continue to experience strong growth.
115
Turkish electricity market has to make necessary regulatory arrangements for the
obligations of Kyoto Protocol.
The implementation of wind energy as a renewable energy source would reduce the
current national energy insecurity associated with the production and use of fossil fuels.
The immediate priority of Turkey should be to speed the transition from the reliance on
non-renewable fossil fuels to reliance on renewable energy sources.
In order to achieve this goal, governmental support is needed, and then legislative
system has to be formed. Technical progress of renewable energy generation technologies
and increasing cost of power generation from conventional energy sources are the other
factors that drive growth and value in the renewable energy market.
116
REFERENCES
[1] Hawai’i State Government, “Wind Energy Fact Sheet” , http://www.hawaii.gov [2] Navitas Energy, “Wind Power Info”, http://www.windpower.com [3] American Wind Energy Association, “Global Wind Energy Market Report: Wind
Energy Industry Grows at Steady Pace, Adds Over 8,000 MW in 2003”, http://www.awea.org
[4] D. Reiche and M.M. Bechberger, “Policy differences in the promotion of renewable
energies in the EU member states”, 843-849, Vol.32, Energy Policy, 2004 [5] TPAO National Oil and Gas Company of Turkey, “Energy Overview”,
http://www.tpao.gov.tr [6] TEIAS Turkish Electricity Transmission Co. Inc., “Turkish Electricity Generation-
Transmission Statistics(2001)”, http://www.teias.gov.tr [7] American Wind Energy Association, “Fact Sheet- 10 Step in Building a Wind
Farm”, AWEA, 2001 [8] L. FitzGerald , “Wind, risk and bankability – A developer’s view of financing large-
scale projects”, 94-100, Vol.6,No.5 , 2003, Renewable Energy World [9] United Nations, “Economic of Wind Energy”, http:www.un.org [10] H. Snodin, “Scotland’s Renewable Resources 2001”, Garrad Hassan and Partners
Ltd., 2001 [11] EWEA and Greenpeace, “Wind Force 12: A blueprint to achieve 12% of the
World’s electricity from Wind Power by 2020”, 2002, http://www.awea.org [12] R. Gross, M. Leach and A. Bauen, “Progress in Renewable Energy”, 987, 1-18,
Environment International , 2002 [13] N. Hatziargyriou and A. Zervas, “Wind Power Development in Europe”, 1765-
1782, Vol.89, No.12, 2001, Proceedings of the IEE [14] T. Ackermann and L. Söder, “Wind Energy Technology and Current Status: A
Review”, 315-374, Vol.4, Renewable & Sustainable Energy Reviews, 2000 [15] B. Özerdem, “Dünyada ve Türkiye’de Rüzgar Enerjisi Uygulamalarinin Gelisimi ve
Gelecegi”, 23-26, Çevre Teknolojisi, August 2002 [16] British Wind Energy Association, “EWEA Press Release: Global Wind Energy
Market Report”, March 20003, http://www.bwea.com
117
[17] Iowa Energy Center, “Wind Energy Manual- A history of Wind Energy”,
http://www.energy.iastate.edu [18] Biritish Wind Energy Association, “The economics of wind energy”,
http://www.bwea.com [19] European Renewable Energy Council(EREC), “Wind Energy-Clean Power for
Generations”, http://www.erec-renewables.org [20] L. Guey Lee, “Wind Energy Developments: Incentives In Selected Countries”, US
Energy Information Administration, Renewable Energy Annual, 1998 [21] “Market Status and Annual Growth”, Wind Power Monthly Newsletter, March 2004 [22] “Annual Survey Reports Another Strong Year”, 18-19, Vol.23, No.3, Wind
Directions, 2004 [23] Deutsche Gesellschaft für Technische Zusammenarbeit (GTZ) GmbH, “Producing
Electricity from Renewable Energy Sources: Energy Sector Framework in 15 Countries in Asia, Africa and Latin America”, 2002, http://www.gtz.de
[24] B. Özerdem, “Türkiye’de Rüzgar Enerjisi Uygulamalarinin Gelisimi ve Gelecegi”,
25-30, Vol.44, No.526, Mühendis ve Makine, 2003 [25] Foreign Economic Relations Board, “Energy Review”, http://www.deik.org.tr [26] F. Evrendilek and C. Ertekin, “Assessing the potential of renewable energy sources
in Turkey”, 2303-2315, Vol.28, Renewable Energy ,2003 [27] S.Çimen, “Opprtunities for Investing in the Turkish Energy Sector, 22nd Annual
Conference on U.S. – Turkish Relations, 16-19March 2003 [28] US Department of Energy, “Turkey Country Analysis Brief”, May 2003,
http://www.doe.gov [29] US Department of Energy-Office of Fossil Energy, “An Energy Overview of the
Republic of Turkey”, http://www.fossil.energy.gov [30] National Wind Energy Coordinating Committee, “Permitting Wind Energy
Facilities- A Handbook”, NWCC Siting Subcommittee, March 1998, http://www.nationalwind.org
[31] European Wind Energy Association, “European Best Practice Guidelines for Wind
Energy Development” [32] T. Teoh, “Stakeholder Management- A Pre-Requisite for Successful Wind Farm
Development”, Murdock University, Perth- Australia, January 2000
118
[33] American Wind Energy Association, “Wind Energy Application Guide”, January
2001, http://www.awea.org [34] M. Durstewitz, M.Hoppe-Kilpper, J. Schmid, N. Stump and R. Windheim,
“Practical Experience with 3000MW Wind Power Installed in Germany”, Institut für Solare Energieversorgungstechnik, http://www.iset-uni-kassel.de
[35] European Wind Energy Association, “Wind Energy The Facts”, EWEA, London,
1998 [36] “Economics of Wind Energy- Prospects and Directions”, Vol.4, No.4, Renewable
Energy World, 2003 [37] United Nations Environment Programme-Division of Technology Industry and
Economics (DTIE), “UNEP Energy Technology Fact Sheet- Wind Power”, http://www.uneptie.org
[38] German Wind Energy Institute, European Wind Energy Brochure, DEWI, Munich,
1998 [39] International Energy Agency, Wind Energy Annual Report, IEA, Colorado, May
2000 [40] The Institution of Electrical Engineers, Financial and Economic Evaluation of
Projects in the Electricity Supply Industry, IEE Power Series 23, London, 1997, p.14-21
[41] D.P. Papodopolus and J. Ch. Dermentzoglu, “Economic Viability Analysis of
Planned WEC System Installations for Electrical Power Production, Renewable Energy, 2001
[42] Pitt Meadows Business Planning Committee, “Financial Evaluation Guidebook”,
The Corporation of the District of Pitt Meadows, British Columbia, 2002, http://www.pittmeadows.bc.ca
[43] Washington State Department of Ecology, “Cost Analysis for Pollution Prevention”,
August 2000, http://www.ecy.wa.gov [44] Iowa Energy Center, “Wind Energy Manual-Economic Issues”,
http://www.energy.iastate.edu [45] S. Karaata, Wind Energy and It’s Finance, a Turkish Overview, MA Thesis, The
European Inter-University Association on Society, p.55-57, 2002 [46] V.Sonntag O’Brien, “Mobilizing Private Investment in Sustainable Energy”, 179-
180, Vol.6, No.4, Renewable Energy World, 2003
119
[47] M. Ar, “Financing Energy Projects in Turkey”, Wind Energy Investment in Turkey
Workshop Proceedings, 2002 [48] D. Lindley, “Planning for Investment in Wind Energy”, p.6, Wind Energy
Investment in Turkey Workshop Proceedings, 2002 [49] N. Hatziargyriou and A. Zervos, “Wind Power Development in Europe”, 1765-
1782, V.89, No.13, Proceedings of the IEE, December 2001 [50] K. Kaiser, “Corporate Restructuring: Project Finance Electronic Edition, March
1996 [51] Triodos Bank, “A breath of fresh air- Project finance and equity investment for
smaller-scale wind power”, http://www.triodos.co.uk [52] P.K. Nevitt, F. Fabozzi, Project Financing, Euromoney Publications, Rochester-UK,
1995, p.18-65 [53] J. A. Sepulveda, W.E. Souder, B.S. Gottfried, Schaum’s outline of theory and
Problems of Engineering Economics, McGraw-Hill Company, 1984,USA [54] M. Durak, “Yenilenebilir Enerji Santrallari (YES) için Finansman Modelleri: Proje
ve Sendikasyon Kredisi, V. Ulusal Temiz Enerji Sempozyumu, 26-28 May 2004 [55] M. Türkeli, “An Experimental Investigation of the Parameters to Classify Wind
Sites”, MA Thesis, IZTECH, January 2002 [56] H. Sezer and M. Alanso, “Task 3: Wind Energy Turkey”, Endesa and Tedas Draft
Report [57] General Directorate of Electrical Power Resources Survey and Development
administration, “The Wind Projects of EIE”, http://www.eie.gov.tr [58] “Wind, risk and bankability - A developer’s view of financing large- scale projects”,
Vol. 6, No.5, Renewable Energy World, Sept.-Oct. 2003 [59] American Wind Energy Association, “Wind Energy: The Fuel of the Future is
Ready Today”, AWEA, 2001 [60] Z. Peker and B. Özerdem, “Analyzing the Visual Impact of Wind Farm Proposals
for Izmir Institute of Technology(IZTECH) Campus Area”, Proceedings of the First International Exergy, Energy and Environment Symposium, 13-17 July 2003
[61] www.retscreen.net [62] “Wind Turbine Market: Types, Technical Characteristics, Prices”, 2003,
Erneuerbare Energien

120
[63] A. Sesli, Vice President of Iztech Head of Construction Department, meeting notes
taken on March 2003 with the thesis writer. [64] M. Durak, “Gelecegin Enerjisi Rüzgar”, ITÜ Meteorology Engineering Seminar,
Istanbul, 2002
APPENDIX
RETScreen - Renewable Energy Technology Screen
RETScreen International was developed by Natural Resources Canada's (NRCan)
CANMET Energy Diversification Research Laboratory (CEDRL) with the contribution
of several experts from industry and government. RETScreen is funded in part by
NRCan's Renewable and Electrical Energy Division (REED) through the Renewable
Energy Deployment Initiative (REDI). RETScreen is being further developed in
collaboration with the United Nations Environment Programme's (UNEP) Division of
Technology, Industry and Economics (DTIE) and the National Aeronautics & Space
Administration's (NASA) Earth Science Enterprise Program.
RETScreen is a pre-feasibility analysis software for renewable energy projects.
The software can be used to evaluate the annual energy production, costs and financial
viability of the following renewable energy technologies (RETs):
Wind energy
Small hydro
Photovoltaics
Solar air heating
Biomass heating
Solar water heating
Passive solar heating
Ground source heat pumps
This model can be used world-wide to easily evaluate the energy production, life-
cycle costs and greenhouse gas emissions reduction for central-grid, isolated-grid and
off-grid wind energy projects, ranging in size from large scale multi-turbine wind farms
to small scale single-turbine wind-diesel hybrid systems.
122
RETSCREEN WIND ENERGY PROJECT MODEL
Each RETScreen renewable energy technology model (e.g. Wind Energy Project,
etc.) is developed within an individual Microsoft® Excel spreadsheet "Workbook" file.
The Workbook file is in-turn composed of a series of worksheets. These worksheets
have a common look and follow a standard approach for all RETScreen models.
Five worksheets, Energy Model, Equipment Data, Cost Analysis, Greenhouse Gas
(GHG) Emission Reduction Analysis, Financial Summary Worksheets, are used for the
evaluation.
Energy Model
The Energy Model worksheet is used to help the user calculate the annual energy
production for a wind energy project based upon local site conditions and system
characteristics. Results are calculated in common megawatt-hour (MWh) units for easy
comparison of different technologies.
Equipment Data
The Equipment Data worksheet is used to specify the wind equipment for the
project. The results of this worksheet are transferred to the Energy Model worksheet.
The user should return to the Energy Model worksheet after completing the Equipment
Data worksheet.
Cost Analysis
The Cost Analysis worksheet is used to help the user estimate costs associated
with a wind energy project. These costs are addressed from the initial, or investment,
cost standpoint and from the annual, or recurring, cost standpoint.
Greenhouse Gas (GHG) Emission Reduction Analysis
A GHG Analysis worksheet is provided to help the user estimate the greenhouse
gas emission reduction potential of the proposed project. This common GHG emission
reduction analysis worksheet contains four main sections: Background Information,
Base Case System (Reference), Proposed Case System (Mitigation) and GHG Emission
Reduction Summary. This is an optional analysis - inputs entered in this worksheet will
123
not affect results reported in other worksheets, except for the GHG related items that
appear in the Financial Summary worksheet.
Financial Summary
As part of the RETScreen Renewable Energy Project Analysis Software, a
Financial Summary worksheet is provided for each RET project evaluated. This
common financial analysis worksheet contains five sections: Annual Energy Balance,
Financial Parameters, Project Costs and Savings, Financial Feasibility and Yearly Cash
Flows. The Annual Energy Balance and the Project Costs and Savings sections provide
a summary of the Energy Model, Cost Analysis and GHG Analysis worksheets
associated with each project studied. In addition to this summary information, the
Financial Feasibility section provides financial indicators of the RET project analyzed,
based on the data entered by the user in the Financial Parameters section. The Yearly
Cash Flows section allows the user to visualize the stream of pre-tax, after-tax and
cumulative cash flows over the project life. The Financial Summary worksheet of each
RET Workbook file has been developed with a common framework so the task of the
user in analyzing the viability of different project types is made simpler. This also
means the description of each parameter is common for most of the items appearing in
the worksheet.
One of the primary benefits of using the RETScreen software is that it facilitates
the project evaluation process for decision-makers. The Financial Summary worksheet,
with its financial parameters input items (e.g. avoided cost of energy, discount rate, debt
ratio, etc.), and its calculated financial feasibility output items (e.g. IRR, simple
payback, NPV etc.), allows the project decision-maker to consider various financial
parameters with relative ease.
DATABASES
Product Data
Some of the product data requirements for the model are provided in the
RETScreen Online Product Database. To access the product database the user may refer
to "Access to the Online User Manual, Product and Weather Database." The product
database provides information on the equipment associated with the Wind Energy
Project. From the Online Product Database dialogue box the user may obtain product
specification and performance data, as well as company contact information.
124
Weather Data
This database includes some of the weather data required in the model. To access
the weather database the user may refer to "Access to the Online User Manual, Product
and Weather Database." While running the software the user may obtain weather data
from ground monitoring stations and/or from NASA's satellite data. Ground monitoring
stations data is obtained by making a selection for a specific location from the Online
Weather Database dialogue box. NASA's satellite data is obtained via a link to NASA's
Website from the dialogue box.
Cost Data
Typical cost data required to prepare RETScreen studies are provided in the
RETScreen online cost database and in the online manual. This database is built into the
"right-hand column" of the Cost Analysis worksheet. Data are provided for Canadian
costs with 2000 as a baseline year. The user also has the ability to create a custom cost
database.


![[library.iyte.edu.tr] - İYTE Kütüphanesi - Ana Sayfalibrary.iyte.edu.tr/tezler/master/makinamuh/T000515.pdf · 2012-01-05[library.iyte.edu.tr] - İYTE Kütüphanesi - Ana Sayfa](https://img.pdfslide.us/doc/110x75/5ab633697f8b9a1a048d927e/-iyte-ktphanesi-ana-sayfa-iyte-ktphanesi-ana-sayfa.jpg)