Embed Size (px)
Citation preview
A fast algorithm for generating smooth molecular dot surface representations
Joseph B. Moon and W. Jeffrey Howe
Computational Chemistry Unit, The Upjohn Company, Kalamazoo, MI, USA
The smooth molecular surface originally described by Richards and later implemented by Connolly in his MS program has become an important visualization technique in the field of molecular modeling. We describe here a new algorithm, called USURF, which approximates the MS dot surface, but with a twofold to sixfold enhancement of speed. The algorithm has been incorporated into our hTteractive modeling system, Mosaic. and is also available as a stand-alone program.
Kevwords: molecular surfaces, Connolly surfaces, elec- trostatic surfaces
I N T R O D U C T I O N
The representation of molecular surfaces through com- puter graphics has demonstrated broad utility in the field of molecular modeling. Because molecules interact at their surfaces, an understanding of molecular surface characteristics can be useful for studying these interac- tions. This is especially true in the "lock and key" sit- uation of macromolecule-ligand binding, in which surface shape can be a governing factor. With a graphic molecular surface representation, the shape comple- mentarity between a receptor and ligand can be ana- lyzed to help understand binding requirements of pro- teins or nucleic acids, and can provide valuable insights for the rational design of ligands with high specificity for a particular binding site.
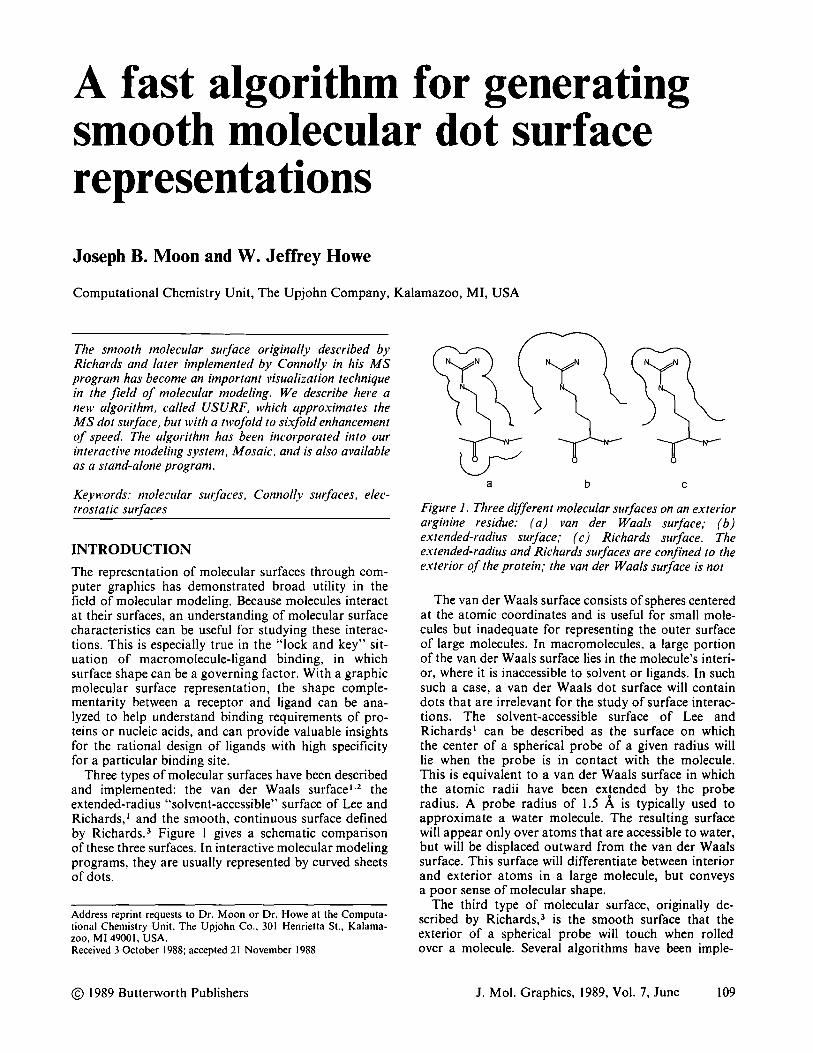
Three types of molecular surfaces have been described and implemented: the van der Waals surface ~'2 the extended-radius "solvent-accessible" surface of Lee and Richards, ~ and the smooth, continuous surface defined by Richards. 3 Figure i gives a schematic comparison of these three surfaces. In interactive molecular modeling programs, they are usually represented by curved sheets of dots.
Address reprint requests to Dr. Moon or Dr. Howe at the Computa- tional Chemistry Unit, The Upjohn Co., 301 Henrietta St., Kalama- zoo, MI 49001, USA. Received 3 October 1988; accepted 21 November 1988
a b c
Figure 1. Three different molecular surfaces on an exterior arginine residue." (a) van der Waals surface; (b) extended-radius surface; (c) Richards surface. The extended-radius and Richards surfaces are confined to the exterior of the protein; the van der Waals surface is not
The van der Waals surface consists of spheres centered at the atomic coordinates and is useful for small mole- cules but inadequate for representing the outer surface of large molecules. In macromolecules, a large portion of the van der Waals surface lies in the molecule's interi- or, where it is inaccessible to solvent or ligands. In such such a case, a van der Waals dot surface will contain dots that are irrelevant for the study of surface interac- tions. The solvent-accessible surface of Lee and Richards ~ can be described as the surface on which the center of a spherical probe of a given radius will lie when the probe is in contact with the molecule. This is equivalent to a van der Waals surface in which the atomic radii have been extended by the probe radius. A probe radius of 1.5 /~ is typically used to approximate a water molecule. The resulting surface will appear only over atoms that are accessible to water, but will be displaced outward from the van der Waals surface. This surface will differentiate between interior and exterior atoms in a large molecule, but conveys a poor sense of molecular shape.
The third type of molecular surface, originally de- scribed by Richards, s is the smooth surface that the exterior of a spherical probe will touch when rolled over a molecule. Several algorithms have been imple-
© 1989 Butterworth Publishers J. Mol. Graphics, 1989, Vol. 7, June 109
mented that approximate the Richards surface. Greer and Bush'* developed a method in which a two-dimen- sional grid of overlapping probe spheres is dropped onto one face of a protein, so that the lowest point on each sphere lies on the molecular surface. Pearl and Honegger s described a procedure in which a surface is created by turning on and off points in a rectangular lattice. First an extended-radius surface is generated. The Richards surface is then produced by turning on a layer of lattice points at a distance just greater than the probe radius inside the first surface. Perhaps the most well-known molecular surface implementation is that of Connolly. ~-9 His algorithm uses extensive analy- tic geometry to calculate accurately the surface which Richards described. Connolly's surface program, MS, generates a representation that gives an excellent sense of shape and accessibility of a molecular surface.
Smooth surface algorithms, while quite useful, have generally suffered from problems with poor surface quality or speed. The surface of Greet and Bush is a very rough approximation of the Richards surface, and its shape is dependent on the choice of axes. Atoms with accessible surfaces can be shielded from the probes by atoms that lie nearer to the probe grid along the axis of approach, sometimes causing cavities to be omit- ted entirely. The surface of Pearl and Honegger, because the points are confined to a lattice, has a jagged appear- ance unless a very fine lattice is specified, in which case the algorithm becomes prohibitively slow. The quality of the Connolly surface is excellent, but genera- tion of this surface is slow due to the complexity of the calculations, so that usually it must be calculated in an off-line process. We describe here a new program, USURF, which approximates the dot surface of Con- nolly with a two- to sixfold enhancement of speed. The algorithm is sufficiently fast for incorporation into interactive systems.
A L G O R I T H M
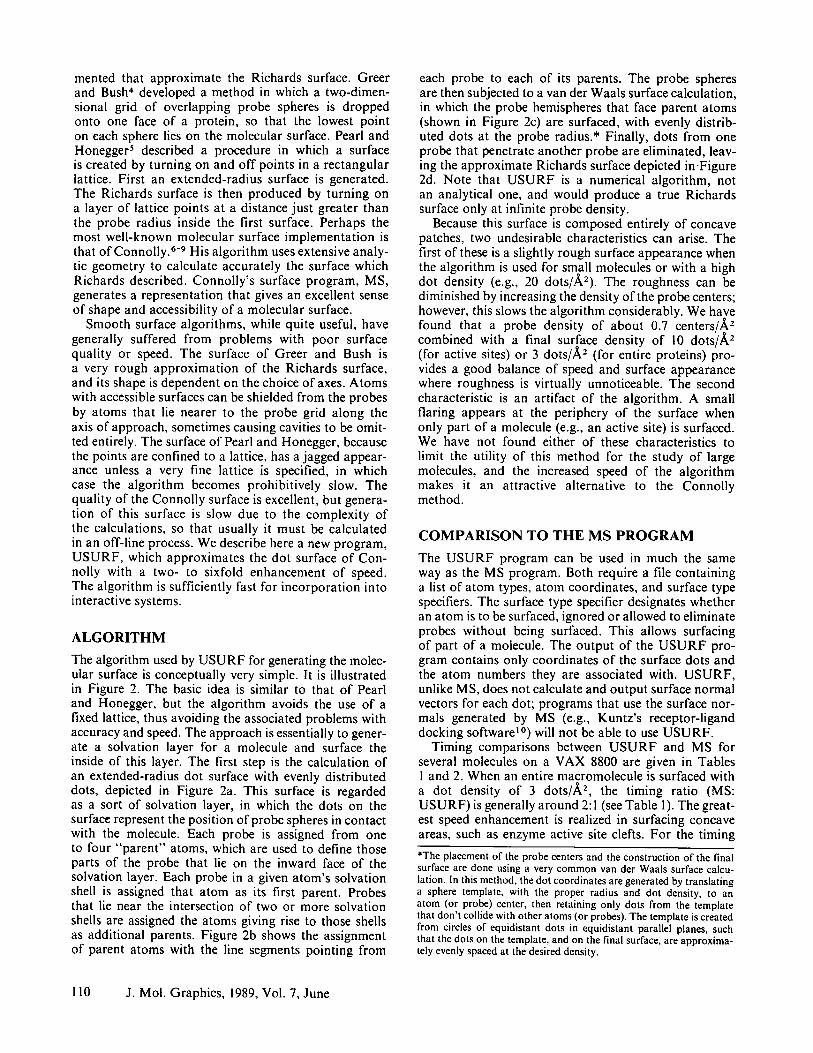
The algorithm used by USURF for generating the molec- ular surface is conceptually very simple. It is illustrated in Figure 2. The basic idea is similar to that of Pearl and Honegger, but the algorithm avoids the use of a fixed lattice, thus avoiding the associated problems with accuracy and speed. The approach is essentially to gener- ate a solvation layer for a molecule and surface the inside of this layer. The first step is the calculation of an extended-radius dot surface with evenly distributed dots, depicted in Figure 2a. This surface is regarded as a sort of solvation layer, in which the dots on the surface represent the position of probe spheres in contact with the molecule. Each probe is assigned from one to four "parent" atoms, which are used to define those parts of the probe that lie on the inward face of the solvation layer. Each probe in a given atom's solvation shell is assigned that atom as its first parent. Probes that lie near the intersection of two or more solvation shells are assigned the atoms giving rise to those shells as additional parents. Figure 2b shows the assignment of parent atoms with the line segments pointing from
each probe to each of its parents. The probe spheres are then subjected to a van der Waals surface calculation, in which the probe hemispheres that face parent atoms (shown in Figure 2c) are surfaced, with evenly distrib- uted dots at the probe radius.* Finally, dots from one probe that penetrate another probe are eliminated, leav- ing the approximate Richards surface depicted in.Figure 2d. Note that USURF is a numerical algorithm, not an analytical one, and would produce a true Richards surface only at infinite probe density.
Because this surface is composed entirely of concave patches, two undesirable characteristics can arise. The first of these is a slightly rough surface appearance when the algorithm is used for small molecules or with a high dot density (e.g., 20 dots/~2). The roughness can be diminished by increasing the density of the probe centers; however, this slows the algorithm considerably. We have found that a probe density of about 0.7 centers/,~ 2 combined with a final surface density of l0 dots/,~ 2 (for active sites) or 3 dots/,~ 2 (for entire proteins) pro- vides a good balance of speed and surface appearance where roughness is virtually unnoticeable. The second characteristic is an artifact of the algorithm. A small flaring appears at the periphery of the surface when only part of a molecule (e.g., an active site) is surfaced. We have not found either of these characteristics to limit the utility of this method for the study of large molecules, and the increased speed of the algorithm makes it an attractive alternative to the Connolly method.
C O M P A R I S O N T O T H E M S P R O G R A M
The USURF program can be used in much the same way as the MS program. Both require a file containing a list of atom types, atom coordinates, and surface type specifiers. The surface type specifier designates whether an atom is to be surfaced, ignored or allowed to eliminate probes without being surfaced. This allows surfacing of part of a molecule. The output of the USURF pro- gram contains only coordinates of the surface dots and the atom numbers they are associated with. USURF, unlike MS, does not calculate and output surface normal vectors for each dot; programs that use the surface nor- mals generated by MS (e.g., Kuntz's receptor-ligand docking software 1°) will not be able to use USURF.
Timing comparisons between USURF and MS for several molecules on a VAX 8800 are given in Tables I and 2. When an entire macromolecule is surfaced with a dot density of 3 dots/,~ 2, the timing ratio (MS: USURF) is generally around 2:1 (see Table 1). The great- est speed enhancement is realized in surfacing concave areas, such as enzyme active site clefts. For the timing
*The placement of the probe centers and the construction of the final surface are done using a very common van der Waals surface calcu- lation. In this method, the dot coordinates are generated by translating a sphere template, with the proper radius and dot density, to an atom (or probe) center, then retaining only dots from the template that don't collide with other atoms (or probes). The template is created from circles of equidistant dots in equidistant parallel planes, such that the dots on the template, and on the final surface, are approxima- tely evenly spaced at the desired density.
110 J. Mol. Graphics, 1989, Vol. 7, June
• <\ili l/Cj • , ° . - - ' - - ~ °
/
. • . f °
• £,,\ I
a o b o
c o d o
Figure 2. Steps in the USURF algorithm. (a) Probe positions are generated using an extended-radius surface calculation. (b) Each probe is assigned parent atoms. The assignments are represented by lines between probes and their parents. (c) Hemispheres on each probe are surfaced along probe-to-parent vectors. (d) Probe intersections are removed, leaving the molecular surface
comparisons, an active site was defined for each of several proteins as the set of atoms within 6 /~ of a bound ligand. Atoms in such a set were then surfaced
Table 1. Timing comparisons between M S and U S U R F on a VAX 8800 for several macromolecules
Molecule Code* Atoms t(MS),s t(USURF),s Ratio
Z DNA (CGCGCG) 2ZNA 756 133 47 2.8
Papain 9PAP 1652 226 1 i 8 1.9 Insulin 2INS 772 101 50 2.0
Rhizopus- pepsin 2APR 2403 342 207 1.7
Lysozyme 6LYZ 1001 139 67 2.1
NOTE: Molecules were surfaced with a dot density of 3 dots/A3 and a probe radius of 1.5 ~,, using formatted output files. Timing ratios increase by about 7% if unformatted output files are used. Equivalent timings on a VAX 11/780 would be approximately 6 times slower than those on a VAX 8800; timing ratios would be unchanged *Brookhaven Protein Data Bank entry code
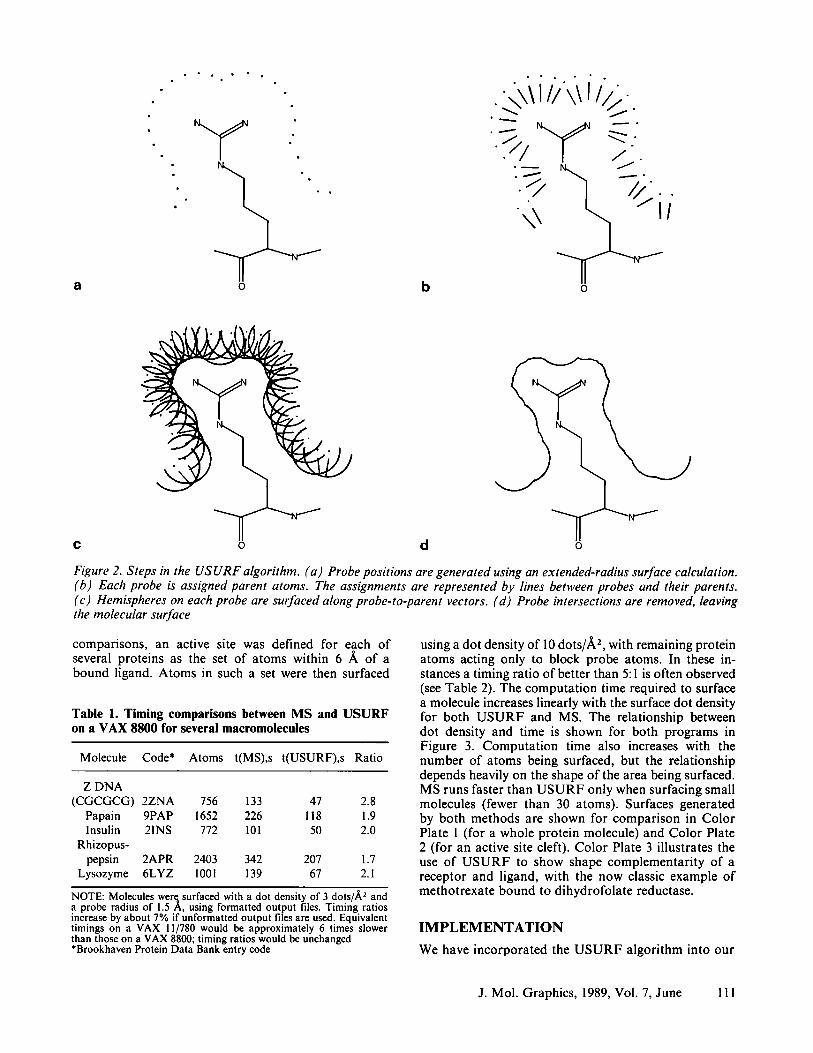
using a dot density of l0 dots/,~ 2, with remaining protein atoms acting only to block probe atoms. In these in- stances a timing ratio of better than 5:1 is often observed (see Table 2). The computat ion time required to surface a molecule increases linearly with the surface dot density for both U S U R F and MS. The relationship between dot density and time is shown for both programs in Figure 3. Computat ion time also increases with the number of atoms being surfaced, but the relationship depends heavily on the shape of the area being surfaced. MS runs faster than U S U R F only when surfacing small molecules (fewer than 30 atoms). Surfaces generated by both methods are shown for comparison in Color Plate 1 (for a whole protein molecule) and Color Plate 2 (for an active site cleft). Color Plate 3 illustrates the use of U S U R F to show shape complementari ty of a receptor and ligand, with the now classic example of methotrexate bound to dihydrofolate reductase.
I M P L E M E N T A T I O N
We have incorporated the U S U R F algorithm into our
J. Mol. Graphics, 1989, Vol. 7, June 111
Table 2. Timing comparisons between MS and U S U R F on a VAX 8800 for several protein active sites
Molecule Code* Atoms t(MS),s t(USURF),s Ratio
Dihydrofolate reductase 3DFR 153 70 14.0 5.0
Rhizopuspepsin 3APR 517 80 19.2 4.1 Staphylococcal
nuclease 2SNS 80 47 I 1.6 4.0 Citrate
synthase ICTS 130 65 13.1 4.9 Beta trypsin ITPP 104 49 7.6 6.5
NOTE: Protein atoms within 6 A of a bound ligand were surfaced with a dot density of 10 dots/A-" and a probe radius of 1.5 A, using formatted output files. Timing ratios increase by an average of 30% if unformatted output files are used. Equivalent timings on a VAX 11/780 would be approximately 6 times slower than those on a VAX 8800: timing ratios would be unchanged *Brookhaven Protein Data Bank entry code
120
100
E 8 0 ¢ . .
.9 ~ 6 0 -. . t
Ct. E 840
2o . . ._. .o~J
o o 1'o l's 1o Surface densi ty , dots /A 2
Figure 3. Computation times vs. surface dot density for USURF (squares) and MS ( ch'cles ). Surfaces were calcu- lated.for the dihydrofolate reductase active site
interactive molecular modeling package, Mosaic,* where it is used in conjunction with a number of other functions that allow the generation and manipulat ion of surfaces. Graphical controls enable the user to select the desired dot density and the objects to be surfaced. This can include all molecules on the screen, a single molecule, or just a subset of a toms previously defined by the user (e.g., an active site of an enzyme). Dots are colored either according to current atom color or functional characteristics such as electrostatic potential or hydrophobicity.
We have also written a stand-alone version of U S U R F (in standard FORTRAN) , which is available through the Quantum Chemistry Program Exchange.~ 1 The pro- gram was developed on a VAX 8800 but will compile and run without modification on most systems. Output files contain coordinates for each dot and the atom
*The Mosaic interactive modeling system is based on the MacroModel system developed by W. C. Still and coworkers, Columbia University, New York. At present, 50% of Mosaic code has been developed at Upjohn and 50% is from MacroModel.
number with which each dot is associated. This informa- tion is kept in the format that is used by MS, although MS output files contain some additional information (e.g., surface normals and areas). U S U R F uses the same input files as Connolly's MS program, but the subroutine that reads the input files can be replaced easily or modi- fied to accommodate special file formats.
C O N C L U S I O N S The molecular dot surface has achieved broad acceptance in the worldwide scientific community as an exceptionally powerful medium for visualizing molecdles and their interactions. In the Mosaic modeling system, the U S U R F algorithm has been used very heavily for molecular studies since its development in mid-1987. In part, this is due to the power of the molecular dot surface as a visualization tool. But also it is due to the speed of the algorithm, which allows users to generate such surfaces whenever they want to in their modeling studies. Obviously, the processor speed of a host machine plays an important role in how long any given calculation takes and, in turn, whether a user will be willing to sit and wait for a surface during an interactive modeling session. The nature of the algorithm is a second important variable, however. We have found U S U R F to be quite valuable in bringing surface calculations into the elapsed time range where end users will willingly incorporate them into their interactive sessions, on standard scientific processors such as the mid-range VAX computers that are in widespread use today.
R E F E R E N C E S 1 Lee, B. and Richards, F.M. The interpretation of
protein structures: estimation of static accessibility. J. Mol. Biol 1971, 55, 379-400
2 Bash, P.A., Pattabiraman, N., Huang, C., Ferrin, T.E. and Langridge, R. Van der Waals surfaces in molecular modelling; implementation with real-time computer graphics. Science 1983, 222, 1325-1327
3 Richards, F.M. Areas, volumes, packing, and protein structure. Ann. Rev. Biophys. Bioeng. 1977, 6, 151-176
4 Greer, J. and Bush, B.L. Macromolecular shape and surface maps by solvent exclusion. Proc. Natl. Acad. Sci. USA 1978, 75 303-307
5 Pearl, L.H. and Honegger, A. Generation of molecu- lar surfaces for graphic display. J. Mol. Graphics 1983, 1, 9-12
6 Langridge, R., Ferrin, T.E., Kuntz, I.D. Connolly, M.L. Real-time color graphics in studies of molecular interactions. Science 1981,211, 661-666
7 Connolly, M.L. Solvent-accessible surfaces of pro- teins and nucleic acids. Science 1983, 221,709-713
8 Connolly, M.L. Analytical molecular surface calcu- lation. J. Appl. Cryst. 1983, 16, 548-558
9 Connolly, M.L. Quantum Chemistry Program Ex- change, Indiana University, Program 429
10 Kuntz, I.D., Blaney, J.M., Oatley, S.J., Langridge, R., and Ferrin, T.E. A geometric approach to macromole- cule-ligand interactions. J. Mol. Biol. 1982, 181,269-288
I I Moon, J.B. Quantum Chemistry Program Exchange, Indiana University, Program 566
112 J. Mol. Graphics, 1989, Vol. 7, June
![arXiv:0802.4086v2 [math.RT] 13 Mar 2008 · arXiv:0802.4086v2 [math.RT] 13 Mar 2008 METAPLECTIC TORI OVER LOCAL FIELDS MARTIN H. WEISSMAN Abstract. Smooth irreducible representations](https://img.pdfslide.us/doc/110x75/5c61dde609d3f2eb708b7767/arxiv08024086v2-mathrt-13-mar-2008-arxiv08024086v2-mathrt-13-mar-2008.jpg)


![Constant Risk Aversion - Boston College · 3. SMOOTH PREFERENCES Machina [19] introduced the concept of smooth representations, that is, representations that are Fre chet differentiable](https://img.pdfslide.us/doc/110x75/5ec1eadac1789a45ec14f6f4/constant-risk-aversion-boston-3-smooth-preferences-machina-19-introduced-the.jpg)