Embed Size (px)
Citation preview
A
Efficiently Estimating Motif Statistics of Large Networks
Pinghui Wang, Huawei Noah’s Ark LabJohn C.S. Lui, The Chinese University of Hong KongBruno Ribeiro, Carnegie Mellon UniversityDon Towsley, University of Massachusetts AmherstJunzhou Zhao, Xi’an Jiaotong UniversityXiaohong Guan, Xi’an Jiaotong University
Exploring statistics of locally connected subgraph patterns (also known as network motifs) has helped researchers betterunderstand the structure and function of biological and online social networks (OSNs). Nowadays the massive size of somecritical networks – often stored in already overloaded relational databases – effectively limits the rate at which nodes andedges can be explored, making it a challenge to accurately discover subgraph statistics. In this work, we propose samplingmethods to accurately estimate subgraph statistics from as few queried nodes as possible. We present sampling algorithmsthat efficiently and accurately estimate subgraph properties of massive networks. Our algorithms require no pre-computationor complete network topology information. At the same time, we provide theoretical guarantees of convergence. We performexperiments using widely known data sets, and show that for the same accuracy, our algorithms require an order of magnitudeless queries (samples) than the current state-of-the-art algorithms.
Categories and Subject Descriptors: J.4 [Social and Behavioral Sciences]: Miscellaneous
General Terms: Algorithms, Experimentation
Additional Key Words and Phrases: Social network, graph sampling, random walks, subgraph patterns, network motifs
ACM Reference Format:Pinghui Wang, John C.S. Lui, Bruno Ribeiro, Don Towsley, Junzhou Zhao, and Xiaohong Guan, 2014. Efficiently EstimatingMotif Statistics of Large Networks. ACM Trans. Knowl. Discov. Data. V, N, Article A (January YYYY), 26 pages.DOI = 10.1145/0000000.0000000 http://doi.acm.org/10.1145/0000000.0000000
1. INTRODUCTIONUnderstanding the structure and function of complex systems is of wide interest across many fieldsof science and technology, from sociology to physics and biology. Networks with similar topolog-ical features such as degree distribution or graph diameter can exhibit significantly different localstructure. Thus, there is much interest in exploring small connected subgraph patterns in networks,which are often shaped during their growth and have been used to characterize communicationand evolution patterns in OSNs [Chun et al. 2008; Kunegis et al. 2009; Zhao et al. 2011; Uganderet al. 2013]. For example, simple 3-node subgraph classes such as “the enemy of my enemy is my
This work was supported by the NSF grant CNS-1065133, ARL Cooperative Agreement W911NF-09-2-0053, and AROunder MURI W911NF-08-1-0233. The views and conclusions contained in this document are those of the authors and shouldnot be interpreted as representing the official policies, either expressed or implied of the NSF, ARL, or the U.S. Government.This work was also supported in part by the NSFC funding 60921003 and 863 Program 2012AA011003 of China.Author’s addresses: Pinghui Wang, HUAWEI Noah’s Ark lab in Hong Kong. A part of the research was done when he wasat Department of Computer Science and Engineering, The Chinese University of Hong Kong. John C.S. Lui, Department ofComputer Science and Engineering, The Chinese University of Hong Kong, Hong Kong; Bruno Ribeiro, School of ComputerScience, Carnegie Mellon University, PA, US; Don Towsley, Department of Computer Science, University of MassachusettsAmherst, MA, US; Junzhou Zhao and Xiaohong Guan, MOE Key Laboratory for Intelligent Networks and Network Security,Xi’an Jiaotong University, Shaanxi, China.Permission to make digital or hard copies of part or all of this work for personal or classroom use is granted without feeprovided that copies are not made or distributed for profit or commercial advantage and that copies show this notice on thefirst page or initial screen of a display along with the full citation. Copyrights for components of this work owned by othersthan ACM must be honored. Abstracting with credit is permitted. To copy otherwise, to republish, to post on servers, toredistribute to lists, or to use any component of this work in other works requires prior specific permission and/or a fee.Permissions may be requested from Publications Dept., ACM, Inc., 2 Penn Plaza, Suite 701, New York, NY 10121-0701USA, fax +1 (212) 869-0481, or [email protected]⃝ YYYY ACM 1556-4681/YYYY/01-ARTA $10.00
DOI 10.1145/0000000.0000000 http://doi.acm.org/10.1145/0000000.0000000
ACM Transactions on Knowledge Discovery from Data, Vol. V, No. N, Article A, Publication date: January YYYY.
A:2 P. Wang et al.
friend” and “the friend of my friend is my friend” are well known evolution patterns in social net-works. Kunegis et al. [Kunegis et al. 2009] considered the significance of these subgraph patternsin Slashdot Zoo1 evaluating the stability of signed friend/foe subgraphs. Other examples includecounting relative frequencies of closed triangle (i.e., three users connected with each other), whichare probably more prevalent in Facebook than Twitter, since Twitter serves more as a news mediathan an OSN service [Kwak et al. 2010]. More complex examples of k-node subgraph frequencies,k > 3, include Milo et al. [Milo et al. 2002] defined network motifs (or local subgraph patterns) assmall subgraph classes occurring in networks at numbers that are significantly larger than found inrandom networks. Network motifs have been used for pattern recognition in gene expression pro-filing [Shen-Orr et al. 2002], protein-protein interaction predication [Albert and Albert 2004], andcoarse-grained topology generation [Itzkovitz et al. 2005].
Unfortunately, characterizing the frequencies of subgraph patterns by searching and countingsubgraphs is computationally intensive since the number of possible k-node combinations in theoriginal graph increases exponentially with k. To address this problem, Kashtan et al. [Kashtanet al. 2004] proposes to sample subgraphs using random edge sampling but this method scalespoorly with the subgraph size and the results can be heavily biased. Wernicke [Wernicke 2006]proposes another approach (FANMOD) based on enumerating subgraph trees. The latter relies onrandom node sampling, which is either not supported by most OSN APIs or is too resource intensiveto be practical (with respect to cache misses and vacant user ID space [Ribeiro et al. 2012]).
ba
e
dc
(a) G
ea
ba
ca
da
cb
db
dc
(b) G(2)
ba
c
ba
d
da
c
cb
d
ae
c
ae
b
ae
d
(c) G(3)
ba
c e
ba
c d
ba
d e
da
c e
(d) G(4)
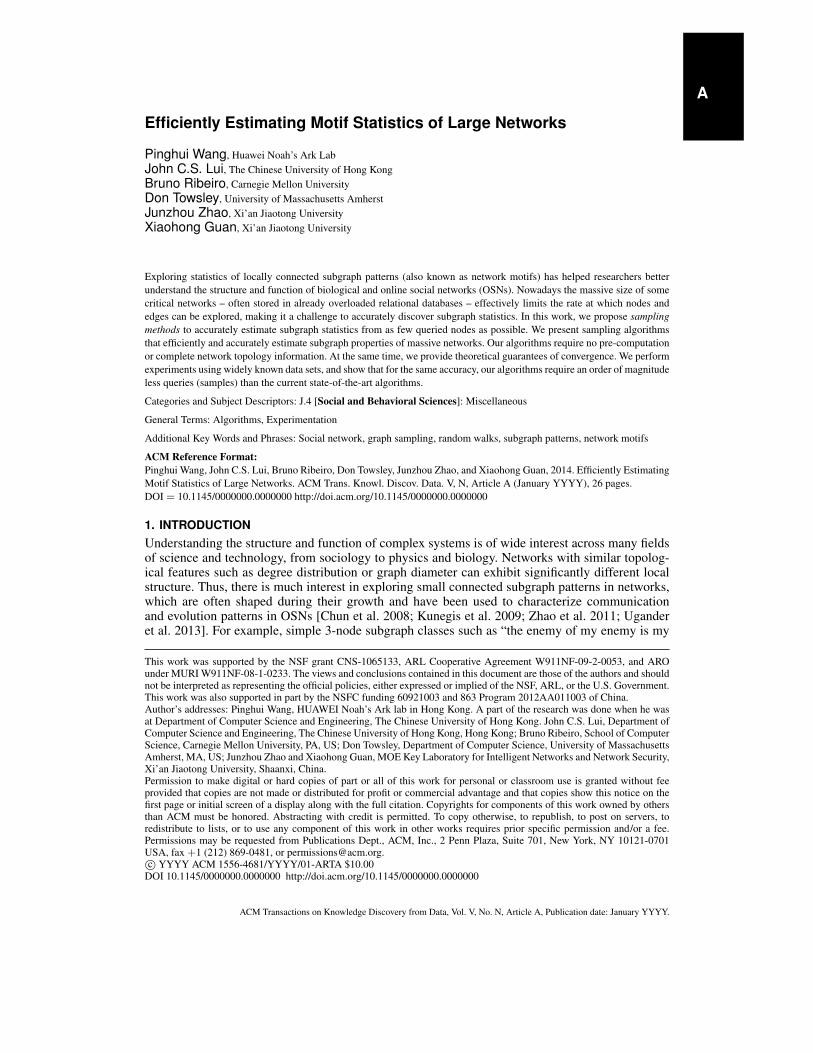
Fig. 1. An example of G, and CIS relationship graphs G(2), G(3), and G(4).
Thus, it is paramount for such algorithms to query the graph on-the-fly without knowledge of thecomplete topology. Moreover, such algorithms should output accurate high accuracy estimates ofsubgraph concentrations with as few queries as possible. Recently, Bhuiyan et al. [Bhuiyan et al.
1www.slashdot.org
ACM Transactions on Knowledge Discovery from Data, Vol. V, No. N, Article A, Publication date: January YYYY.
Efficiently Estimating Motif Statistics of Large Networks A:3
2012] proposed a Metropolis-Hastings-based algorithm (henceforth denoted GUISE) that jointly es-timates concentrations of 3-node, 4-node, and 5-node connected induced subgraphs (CISes). How-ever, the rejection sampling procedure of the Metropolis-Hastings random walk (MHRW) used inGUISE has received much criticism lately in the precise context of graph sampling [Gjoka et al.2011; Ribeiro and Towsley 2012]. Rejecting a sample incurs the cost of sampling without gatheringinformation in exchange. And, information-wise, the rejected samples may contain more informa-tion about the statistic of interest than the accepted samples. Recently, Ribeiro and Towsley [Ribeiroand Towsley 2012] shows that MHRW rejects information-rich samples when trying to estimate thedegree distribution of a graph. The end result is a sampling method that exhibits large estimationerrors. A new estimation method that does not suffer from the above mentioned problems is needed.
In this work we propose two algorithms to accurately estimate subgraph concentrations. The firstone, denoted PSRW, significantly improves upon GUISE in two fronts: (a) PSRW can estimatestatistics of CISes of any size, in contrast to GUISE that is limited to jointly estimating 3-node,4-node, and 5-node CISes; and (b) through careful design PSRW does not reject samples, makingthe estimation errors of PSRW significantly lower than those of GUISE. Most importantly, PSRWis not an incremental improvement over GUISE but rather a different type of random walk that isdesigned without the need to reject samples, using the Horvitz-Thompson estimator [Ribeiro andTowsley 2010] to unbias the observations. The second algorithm we propose, denoted Mix SubgraphSampling or MSS, can jointly estimate CISes of sizes k − 1, k, and k + 1 for any k ≥ 4, not onlygeneralizing GUISE (GUISE 3-node, 4-node, and 5-node CISes is the special case k = 4) but alsoachieving lower estimation errors. One of the main differences between GUISE and PSRW or MSSis that our random walk is designed to sample nodes that are important for the CIS estimation anduse all of the gathered samples in the estimation phase.
Through simulations we show that both of our methods (PSRW and MSS) are significantly moreaccurate than GUISE for either the same number queried nodes or the same walk clock time (usinga modern computer). The walk clock time is measured under the assumptions of access to a localdatabase or a remote database (assuming 100 milliseconds of query response delay). Our methodsrepresent the network as a CIS relationship graph, whose nodes are connected and induced sub-graphs (CISes) of the original network. Fig. 1 illustrates a CIS relationship graph for subgraphsof two, three, and four node subgraphs. Our algorithms consist of running a random walk (RW)on the CIS relationship graph. Besides its accuracy, our algorithms are lightweight. They requirelittle memory (more precisely, O(k2 + B) space where k is the subgraph size and B is the num-ber of queried nodes) and, more importantly, significantly fewer queries than the state-of-the-artmethods to achieve the same accuracy. Note that building the completely CIS relationship graph isprohibitively expensive, both in terms of queries and memory. Thus, our RW methods do not requirethe CIS relationship graph and there is no need to know the complete graph topology in advance,only the parts of the network already queried. We also prove that a RW on the CIS relationship graphachieves asymptotically unbiased concentration estimates of the distinct subgraphs on the originalnetwork.
This paper is organized as follows. The problem formulation is presented in Section 2. Section 3presents methods for estimating subgraph class concentrations. The performance evaluation andtesting results are presented in Section 4. Section 5 presents applications of our methods to two realOSN websites. Section 6 summarizes related work. Concluding remarks then follow.
2. PROBLEM FORMULATIONLet G = (V,E, L) be a labeled undirected graph where V is the set of nodes, E be a set of pairs ofV (edges), and L is a set of labels li,j associated with edges (i, j) ∈ E. If G represents a directednetwork, then we attach a label to each edge that indicates the direction of the edge (→, ←, ↔).Edges may have other labels too, for instance, in a signed network, edges have positive or negativelabels.
An induced subgraph of G, G′ = (V ′, E′, L′), V ′ ⊂ V , E′ ⊂ E and L′ ⊂ L, is a subgraphwhose edges and associated labels are all in G, i.e. E′ = {(i, j) : i, j ∈ V ′, (i, j) ∈ E}, L′ = {li,j :
ACM Transactions on Knowledge Discovery from Data, Vol. V, No. N, Article A, Publication date: January YYYY.

A:4 P. Wang et al.
i, j ∈ V ′, (i, j) ∈ E}. We define C(k) as the set of all connected and induced subgraphs (CISes)with k nodes in G. Then we partition C(k) into Tk equivalence classes C(k)
1 , . . . , C(k)Tk
where CISes
within C(k)i are isomorphic and any pair of CISes from C
(k)i , C(k)
j , i = j are not isomorphic. Toillustrate our notation, in what follows we present some simple examples. Fig. 2 (a) shows all three-node motifs of any unlabeled undirected network. When G is an unlabeled undirected network, thenthe number of three-node motifs is T3 = 2, and C
(3)1 and C
(3)2 are the sets of CISes in G isomorphic
to motifs 1 and 2 in Fig. 2 (a) respectively. Fig. 2 (b) shows all four-node motifs of any unlabeledundirected network, in this case T4 = 6. Fig. 3 shows all three-node motifs of any directed network,in this case T3 = 13. Fig. 4 shows all motifs when G is of any signed network, in this case T3 = 7.
� �
(a) 3-node
�������������������������������������������������������������������������������������
(b) 4-node
Fig. 2. All classes of three-node and four-node undirected and connected subgraphs (The numbers are the subgraph classIDs).
�����������������������������������������������������������������������������������������������������
���������������������������������������������������������������������������������
Fig. 3. All classes of three-node directed and connected subgraphs.
�
� �
�
��
�
� �
�
� �
��
� �
�
�
� �
�
� �
�
Fig. 4. All classes of three-node signed and undirected subgraphs.
The concentration of C(k)i is
ω(k)i =
|C(k)i ||C(k)|
, 1 ≤ i ≤ Tk,
where |C(k)i | is the number of CISes in C
(k)i . For example, we have |C(3)| = 7 for G in Fig. 1, and
C(3)1 includes three CISes: 1) CIS consisting of a, b, and e; 2) CIS consisting of a, c, and e; 3) CIS
consisting of a, d, and e. Then we have ω(3)1 = 3/7. In this work we are interested in accurately
estimating ω(k)i by querying a small number of nodes. Note that the network topology is unknown
ACM Transactions on Knowledge Discovery from Data, Vol. V, No. N, Article A, Publication date: January YYYY.

Efficiently Estimating Motif Statistics of Large Networks A:5
to us and we are only given one initial connected subgraph of size k > 1 in G to bootstrap ouralgorithm.
3. CONNECTED AND INDUCED SUBGRAPH SAMPLING METHODSIn this section we first introduce the notion of a “CIS relationship graph”. Then we propose twosubgraph sampling methods based on random walks (RWs) on CIS relationship graphs to estimatethe concentrations of subgraph classes of a specific size k. Finally, we propose a sampling methodto solve the problem of measuring the concentrations of subgraph classes of sizes k − 1, k, andk+ 1 simultaneously, where the special case k = 4 is equivalent to the problem studied in Bhuiyanet al. [Bhuiyan et al. 2012]. A list of notations used is shown in Table I.
Table I. Table of notations
G = (V,E, L) graph under studyd(v), v ∈ V degree of node v in G
G(k) = (C(k), R(k)) k-node CIS relationship graphV (s), s ∈ C(k) set of nodes for the k-node CIS s
E(s), s ∈ C(k) set of edges for the k-node CIS s
N(s), s ∈ C(k) N(s) ⊂ V , set of nodes in V \V (s) which are connected to nodes in the k-node CIS s
X(s), s ∈ C(k) X(s) ⊂ C(k), neighbors of k-node CIS s in graph G(k)
d(k)(s), s ∈ C(k) degree of the k-node CIS s in G(k)
C(s) subgraph class of the CIS s
C(k)i the i-th k-node subgraph class in GTk number of k-node subgraph classesω(k)i concentration of subgraph class C(k)
i
I(k)(x), x ∈ C(k+1) number of k-node CISes contained in (k + 1)-node CIS x
C(k−1)(s), s ∈ C(k) the set of (k − 1)-node CISes contained in the CIS s
O(k)(s′), s′ ∈ C(k−1) the set of k-node CISes that contain the CIS s′
B number of sampled CISesB∗ number of queries
3.1. CIS relationship graphLet C(k) (2 ≤ k < |V |) denote the set of all k-node CISes in G. Two different k-node CISes s1and s2 in C(k) are connected if and only if they have exactly k−1 nodes in common. Formally, theundirected graph G(k) = (C(k), R(k)) represents the CIS relationships between all k-node CISesin G, where C(k) and R(k) are the node and edge sets for graph G(k) respectively. When two k-node CISes si and sj in C(k) differ in one and only one node, there exists an edge (si, sj) in graphG(k). We say that two k-node CISes si and sj are reachable if and only if there is at least one pathbetween them in graph G(k), and G(k) is connected if and only if every pair of subgraphs in C(k) isreachable. Fig. 1 shows an example of an original unlabeled graph G and its associated CIS graphsG(2), G(3), and G(4). Then we have the following theorems.
THEOREM 3.1. If the graph G is connected, then the k-node CIS graph G(k) is connected,2 ≤ k < |V |. �
THEOREM 3.2. If the graph G is connected and either non-bipartite, or contains a node withdegree larger than two, all k-node CIS graphs G(k) are non-bipartite, where 2 ≤ k < |V |. �The proofs of all Theorems in this section are included in the Appendix for completeness.Remark: Theorems 3.2 states that G(k) is non-bipartite for most connected graph G. Connectednessis critical for removing biases from RW sampling of G(k). Biases introduced through samplinga bipartite graph using a lazy RW are easily removed. Biases introduced though sampling via aclassical RW can only be removed if the graph is non-bipartite.
ACM Transactions on Knowledge Discovery from Data, Vol. V, No. N, Article A, Publication date: January YYYY.
A:6 P. Wang et al.
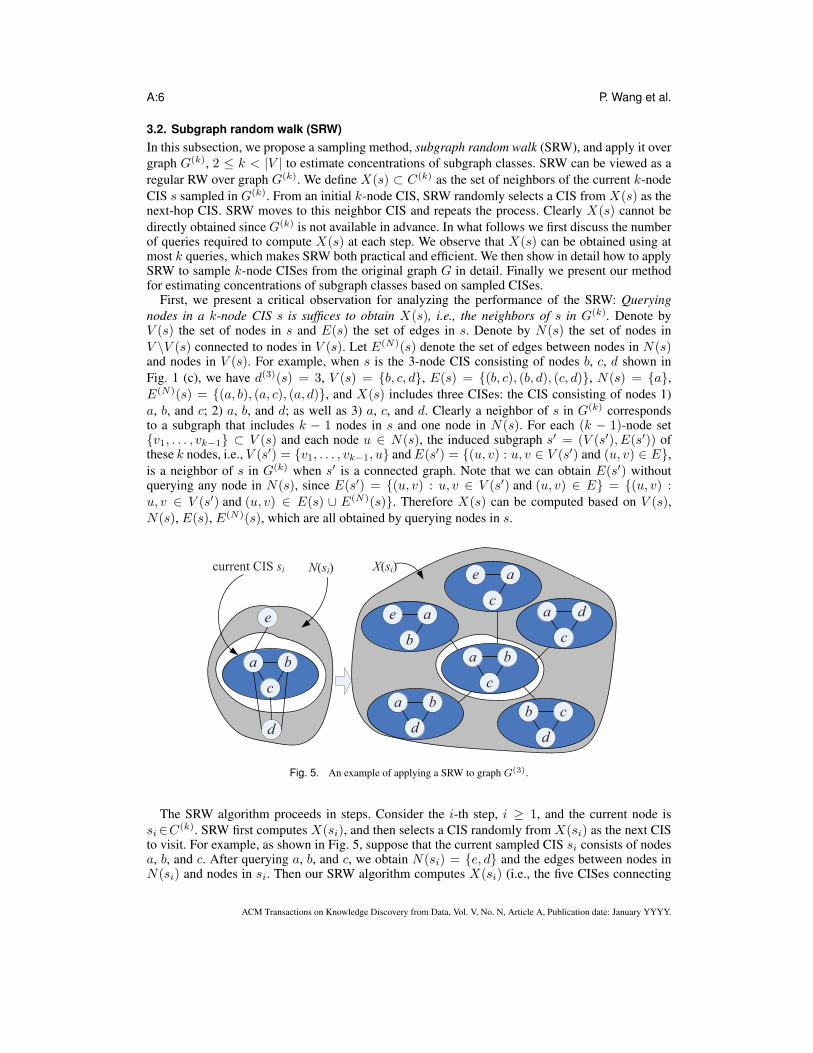
3.2. Subgraph random walk (SRW)In this subsection, we propose a sampling method, subgraph random walk (SRW), and apply it overgraph G(k), 2 ≤ k < |V | to estimate concentrations of subgraph classes. SRW can be viewed as aregular RW over graph G(k). We define X(s) ⊂ C(k) as the set of neighbors of the current k-nodeCIS s sampled in G(k). From an initial k-node CIS, SRW randomly selects a CIS from X(s) as thenext-hop CIS. SRW moves to this neighbor CIS and repeats the process. Clearly X(s) cannot bedirectly obtained since G(k) is not available in advance. In what follows we first discuss the numberof queries required to compute X(s) at each step. We observe that X(s) can be obtained using atmost k queries, which makes SRW both practical and efficient. We then show in detail how to applySRW to sample k-node CISes from the original graph G in detail. Finally we present our methodfor estimating concentrations of subgraph classes based on sampled CISes.
First, we present a critical observation for analyzing the performance of the SRW: Queryingnodes in a k-node CIS s is suffices to obtain X(s), i.e., the neighbors of s in G(k). Denote byV (s) the set of nodes in s and E(s) the set of edges in s. Denote by N(s) the set of nodes inV \V (s) connected to nodes in V (s). Let E(N)(s) denote the set of edges between nodes in N(s)and nodes in V (s). For example, when s is the 3-node CIS consisting of nodes b, c, d shown inFig. 1 (c), we have d(3)(s) = 3, V (s) = {b, c, d}, E(s) = {(b, c), (b, d), (c, d)}, N(s) = {a},E(N)(s) = {(a, b), (a, c), (a, d)}, and X(s) includes three CISes: the CIS consisting of nodes 1)a, b, and c; 2) a, b, and d; as well as 3) a, c, and d. Clearly a neighbor of s in G(k) correspondsto a subgraph that includes k − 1 nodes in s and one node in N(s). For each (k − 1)-node set{v1, . . . , vk−1} ⊂ V (s) and each node u ∈ N(s), the induced subgraph s′ = (V (s′), E(s′)) ofthese k nodes, i.e., V (s′) = {v1, . . . , vk−1, u} and E(s′) = {(u, v) : u, v ∈ V (s′) and (u, v) ∈ E},is a neighbor of s in G(k) when s′ is a connected graph. Note that we can obtain E(s′) withoutquerying any node in N(s), since E(s′) = {(u, v) : u, v ∈ V (s′) and (u, v) ∈ E} = {(u, v) :u, v ∈ V (s′) and (u, v) ∈ E(s) ∪ E(N)(s)}. Therefore X(s) can be computed based on V (s),N(s), E(s), E(N)(s), which are all obtained by querying nodes in s.
ba
c
e
d
N(si)current CIS si
ba
d
ae
c
cb
d
ae
b
da
c
ba
c
X(si)
Fig. 5. An example of applying a SRW to graph G(3).
The SRW algorithm proceeds in steps. Consider the i-th step, i ≥ 1, and the current node issi∈C(k). SRW first computes X(si), and then selects a CIS randomly from X(si) as the next CISto visit. For example, as shown in Fig. 5, suppose that the current sampled CIS si consists of nodesa, b, and c. After querying a, b, and c, we obtain N(si) = {e, d} and the edges between nodes inN(si) and nodes in si. Then our SRW algorithm computes X(si) (i.e., the five CISes connecting
ACM Transactions on Knowledge Discovery from Data, Vol. V, No. N, Article A, Publication date: January YYYY.
Efficiently Estimating Motif Statistics of Large Networks A:7
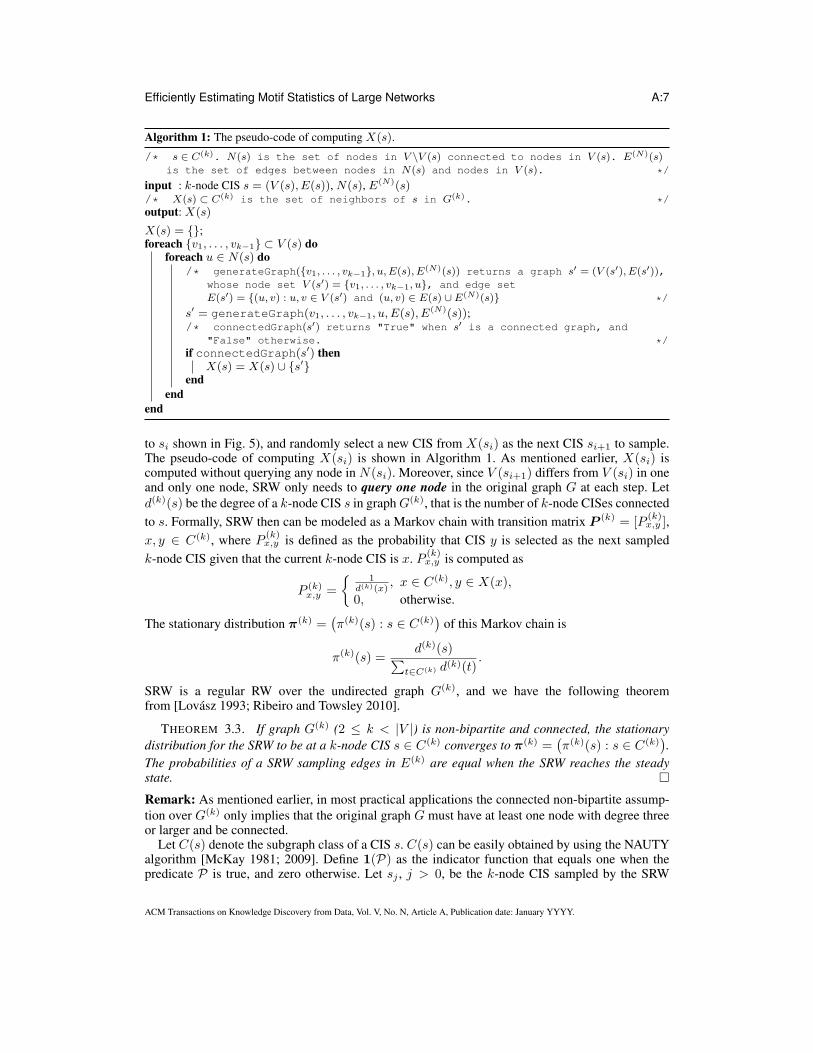
Algorithm 1: The pseudo-code of computing X(s).
/* s ∈ C(k). N(s) is the set of nodes in V \V (s) connected to nodes in V (s). E(N)(s)is the set of edges between nodes in N(s) and nodes in V (s). */
input : k-node CIS s = (V (s), E(s)), N(s), E(N)(s)/* X(s) ⊂ C(k) is the set of neighbors of s in G(k). */output: X(s)
X(s) = {};foreach {v1, . . . , vk−1} ⊂ V (s) do
foreach u ∈ N(s) do/* generateGraph({v1, . . . , vk−1}, u, E(s), E(N)(s)) returns a graph s′ = (V (s′), E(s′)),
whose node set V (s′) = {v1, . . . , vk−1, u}, and edge setE(s′) = {(u, v) : u, v ∈ V (s′) and (u, v) ∈ E(s) ∪ E(N)(s)} */
s′ = generateGraph(v1, . . . , vk−1, u, E(s), E(N)(s));/* connectedGraph(s′) returns "True" when s′ is a connected graph, and
"False" otherwise. */if connectedGraph(s′) then
X(s) = X(s) ∪ {s′}end
endend
to si shown in Fig. 5), and randomly select a new CIS from X(si) as the next CIS si+1 to sample.The pseudo-code of computing X(si) is shown in Algorithm 1. As mentioned earlier, X(si) iscomputed without querying any node in N(si). Moreover, since V (si+1) differs from V (si) in oneand only one node, SRW only needs to query one node in the original graph G at each step. Letd(k)(s) be the degree of a k-node CIS s in graph G(k), that is the number of k-node CISes connectedto s. Formally, SRW then can be modeled as a Markov chain with transition matrix P (k) = [P
(k)x,y ],
x, y ∈ C(k), where P(k)x,y is defined as the probability that CIS y is selected as the next sampled
k-node CIS given that the current k-node CIS is x. P (k)x,y is computed as
P (k)x,y =
{1
d(k)(x), x ∈ C(k), y ∈ X(x),
0, otherwise.
The stationary distribution π(k) =(π(k)(s) : s ∈ C(k)
)of this Markov chain is
π(k)(s) =d(k)(s)∑
t∈C(k) d(k)(t).
SRW is a regular RW over the undirected graph G(k), and we have the following theoremfrom [Lovasz 1993; Ribeiro and Towsley 2010].
THEOREM 3.3. If graph G(k) (2 ≤ k < |V |) is non-bipartite and connected, the stationarydistribution for the SRW to be at a k-node CIS s ∈ C(k) converges to π(k) =
(π(k)(s) : s ∈ C(k)
).
The probabilities of a SRW sampling edges in E(k) are equal when the SRW reaches the steadystate. �Remark: As mentioned earlier, in most practical applications the connected non-bipartite assump-tion over G(k) only implies that the original graph G must have at least one node with degree threeor larger and be connected.
Let C(s) denote the subgraph class of a CIS s. C(s) can be easily obtained by using the NAUTYalgorithm [McKay 1981; 2009]. Define 1(P) as the indicator function that equals one when thepredicate P is true, and zero otherwise. Let sj , j > 0, be the k-node CIS sampled by the SRW
ACM Transactions on Knowledge Discovery from Data, Vol. V, No. N, Article A, Publication date: January YYYY.

A:8 P. Wang et al.
at step j. Using the CISes visited by a SRW after B > 1 steps, we use the Horvitz-Thompsonestimator [Ribeiro and Towsley 2010] to estimate the concentration of subgraph class C(k)
i as:
ω(k)i =
1
L
B∑j=1
1(C(sj) = C(k)i )
d(k)(sj), 1 ≤ i ≤ Tk, (1)
where L =∑B
j=11
d(k)(sj).
THEOREM 3.4. If G(k) (2 ≤ k < |V |) is non-bipartite and connected, then ω(k)i (1 ≤ i ≤ Tk)
in Eq. (1) is an asymptotically unbiased estimator of ω(k)i . �
Remark: Theorem 3.4 provides the theoretical basis for producing unbiased estimates of the con-centration of each CIS class in the graph under study. Proof is found in the appendix.
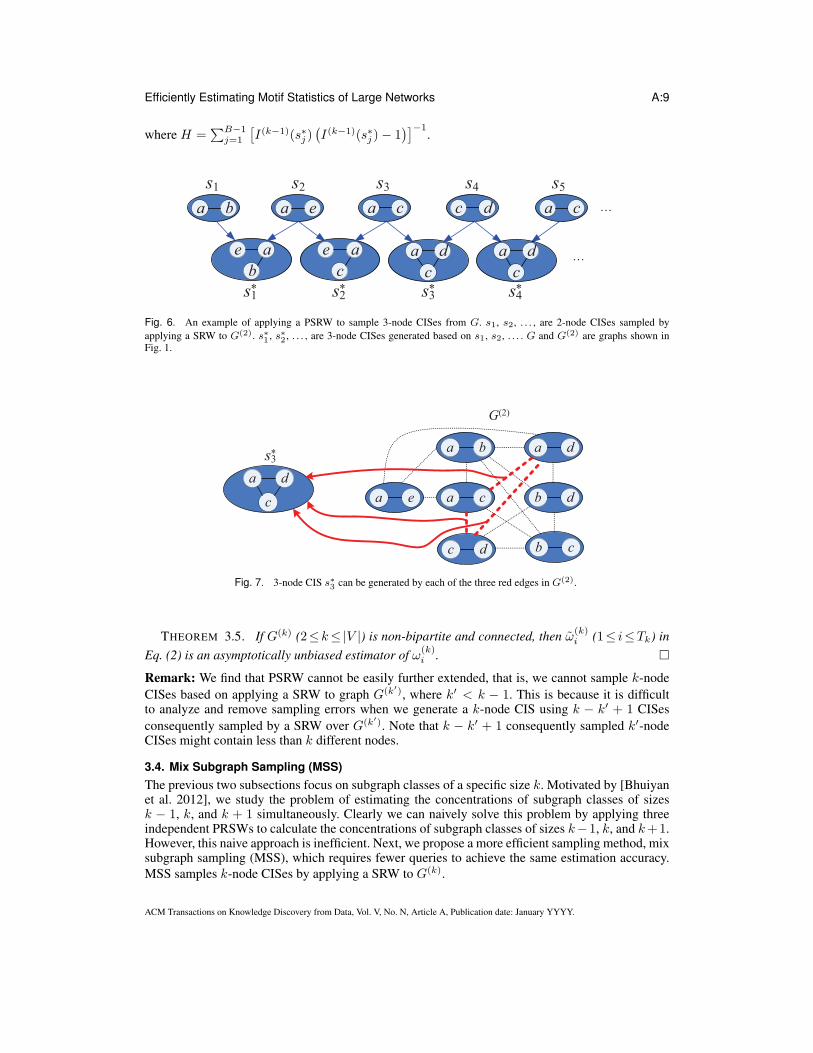
3.3. Pairwise subgraph random walk (PSRW)In this subsection, we use SRW as a building block for our next subgraph statistics method. Insteadof sampling over graph G(k), we apply SRW to G(k−1), and observe that two adjacent sampled(k − 1)-node CISes (i.e., an edge in G(k−1)) contains exactly k distinct nodes. Thus, we showhow to obtain k-node CISes by sampling edges from G(k−1). Using this property we propose abetter sampling method than SRW, which we denote pairwise subgraph random walk (PSRW).PSRW samples k-node CISes by applying SRW to G(k−1), 2 < k ≤ |V |. In what follows we showthat PSRW produces more accurate estimates than SRW as observed from experimental results inSection 4. It remains an open theoretical problem why PSRW significantly outperforms SRW. Ourconjecture is that it is due to the fact that a RW on G(k−1) converges to its stationary behaviormore quickly than G(k). Let sj (1 ≤ j ≤ B) be the j-th (k − 1)-node CIS sampled by applying aSRW to G(k−1). Consider the edge (sj , sj+1) in G(k−1). This edge is associated with a k-node CISconsisting all nodes contained in sj and sj+1. Therefore we obtain k-node CISes s∗j (1 ≤ j < B),where s∗j is the k-node CIS generated by (sj , sj+1). Fig. 6 shows an example of applying a PSRWto sample 3-node CISes s∗1, s∗2, . . . from G. We can see that s∗1, s∗2, . . . are generated based on 2-node CISes s1, s2 sampled by applying a SRW to G(2), where G and G(2) are shown in Fig. 1.For any k-node CIS x ∈ C(k), let I(k−1)(x) denote the number of (k − 1)-node CISes containedby x. For example, 3-node CIS s∗1 in Fig. 1 contains two 2-node CISes: 1) the CIS consisting ofnodes A and B, and 2) the CIS consisting of nodes A and E. Thus, I(2)(s∗1) = 2. Similarly we
have I(2)(s∗3) = 3. It is easy to show that a k-node CIS x associates with (I(k−1)(x))(I(k−1)(x)−1)2
edges in graph G(k−1) and x is sampled by PSRW if and only if at least one of its associated edgesin G(k−1) is sampled. For example, as shown in Fig. 7 where k = 3, s∗3 is sampled when PSRW
samples at least one of its associated edges in G(2), i.e., the (I(2)(s∗3))(I(2)(s∗3)−1)
2 = 3 red edges inFig. 7. From Theorem 3.3, we know that SRW samples each edge in G(k−1) with equal probabilityat steady state, therefore k-node CIS x is sampled with the following probability
π(k)E (x) =
I(k−1)(x)(I(k−1)(x)− 1
)∑y∈C(k) I(k−1)(y)
(I(k−1)(y)− 1
) .Thus, using the Horvitz-Thompson estimator, we estimate the concentration of subgraph class C(k)
ias follows,
ω(k)i =
1
H
B−1∑j=1
1(C(s∗j ) = C(k)i )
I(k−1)(s∗j )(I(k−1)(s∗j )− 1
) , 1 ≤ i ≤ Tk, (2)
ACM Transactions on Knowledge Discovery from Data, Vol. V, No. N, Article A, Publication date: January YYYY.
Efficiently Estimating Motif Statistics of Large Networks A:9
where H =∑B−1
j=1
[I(k−1)(s∗j )
(I(k−1)(s∗j )− 1
)]−1.
ba ea ca dc
ae
b
ae
c
da
c
…
s1 s2 s3 s4 s5
s1* s2
* s3* s4
*
…
ca
da
c
Fig. 6. An example of applying a PSRW to sample 3-node CISes from G. s1, s2, . . . , are 2-node CISes sampled byapplying a SRW to G(2). s∗1 , s∗2 , . . . , are 3-node CISes generated based on s1, s2, . . . . G and G(2) are graphs shown inFig. 1.
ea
ba
ca
da
cb
db
dc
da
c
s3*
G(2)
Fig. 7. 3-node CIS s∗3 can be generated by each of the three red edges in G(2).
THEOREM 3.5. If G(k) (2≤k≤|V |) is non-bipartite and connected, then ω(k)i (1≤ i≤Tk) in
Eq. (2) is an asymptotically unbiased estimator of ω(k)i . �
Remark: We find that PSRW cannot be easily further extended, that is, we cannot sample k-nodeCISes based on applying a SRW to graph G(k′), where k′ < k − 1. This is because it is difficultto analyze and remove sampling errors when we generate a k-node CIS using k − k′ + 1 CISesconsequently sampled by a SRW over G(k′). Note that k − k′ + 1 consequently sampled k′-nodeCISes might contain less than k different nodes.
3.4. Mix Subgraph Sampling (MSS)The previous two subsections focus on subgraph classes of a specific size k. Motivated by [Bhuiyanet al. 2012], we study the problem of estimating the concentrations of subgraph classes of sizesk − 1, k, and k + 1 simultaneously. Clearly we can naively solve this problem by applying threeindependent PRSWs to calculate the concentrations of subgraph classes of sizes k−1, k, and k+1.However, this naive approach is inefficient. Next, we propose a more efficient sampling method, mixsubgraph sampling (MSS), which requires fewer queries to achieve the same estimation accuracy.MSS samples k-node CISes by applying a SRW to G(k).
ACM Transactions on Knowledge Discovery from Data, Vol. V, No. N, Article A, Publication date: January YYYY.
A:10 P. Wang et al.
Let sj , j > 0, be the k-node CIS sampled by the SRW at step j. Using the CISes visited by aSRW after B > 1 steps, MSS estimates the concentrations of k-node subgraph classes using Eq. (1).Similar to PSRW, MSS uses sj (1 ≤ j ≤ B) to generate (k+1)-node CISes, and then estimates theconcentrations of (k + 1)-node subgraph classes using Eq. (2). Last, we show how MSS estimatesthe concentrations of (k− 1)-node subgraph classes based on sj , 1 ≤ j ≤ B. Let C(k−1)(s) denotethe set of (k − 1)-node CISes contained in a CIS s. For example, if s is the 4-node CIS consistingof nodes a, b, c, and e shown in Fig. 1, then S(3)(s) consists of three 3-node CISes: 1) the CISconsisting of nodes a, b, and c; 2) the CIS consisting of nodes a, b, and e; 3) the CIS consisting ofnodes b, c, and e. Define O(k)(s′) as the set of k-node CISes that contain a CIS s′. For example, ifs′ is the 3-node CIS consisting of nodes a, c, and e shown in Fig. 1, then O(4)(s′) consists of two4-node CISes: 1) the CIS consisting of nodes a, b, c, and e; 2) the CIS consisting of nodes a, c, d,and e. Finally MSS estimates the concentration of subgraph class C(k−1)
i as follows,
ω(k−1)i =
1
Q
B∑j=1
1
d(k)(sj)
∑s′∈C(k−1)(sj)
1(C(k−1)(s′) = C(k−1)i )
|O(k)(s′)|, 1 ≤ i ≤ Tk−1, (3)
where Q =∑B
j=11
d(k)(sj)
∑s′∈C(k−1)(sj)
1|O(k)(s′)| .
THEOREM 3.6. If G(k) (3≤k≤|V |) is non-bipartite and connected, then ω(k−1)i (1≤ i≤Tk−1)
in Eq. (3) is an asymptotically unbiased estimator of ω(k−1)i . �
4. DATA EVALUATIONIn this section, we first introduce our experimental datasets and a comparison model, which is usedto evaluate the performance of our methods for characterizing CIS classes of a specific size k incomparison with state-of-the-art methods. Then we present the experimental results of PSRW fork ∈ {3, . . . , 6}. Last, we compare the special case MSS k = 3, 4, 5 against GUISE [Bhuiyan et al.2012]. Our experiments are conducted on a Dell Precision T1650 workstation with an Intel Corei7-3770 CPU 3.40 GHz processor and 8 GB DRAM memory.
4.1. DatasetsOur experiments are performed on a variety of publicly available datasets taken from the Stan-ford Network Analysis Platform (SNAP)2. We start by evaluating the performance of our meth-ods in characterizing 3-node CISes over four million-node graphs: Flickr, Pokec, LiveJournal, andYouTube, contrasting our results with ground truth computed through brute force. Since it is com-putationally intensive to calculate the ground-truth of k-node CIS classes for k≥4 in large graphs,the experiments for k-CISes, k ≥ 4, are performed on three relatively small graphs Epinions, Slash-dot, and Gnutella, where computing the ground-truth by brute force is feasible. We also specificallyevaluate the performance of our methods for characterizing signed CIS classes in the Epinions andSlashdot signed graphs. Flickr, LiverJournal, and YouTube are popular photo, blog, and video shar-ing websites respectively, where a user can subscribe to other user updates such as photos, blogs,and videos. Pokec is the most popular on-line social network in Slovakia, and has been in existencefor more than ten years. These four networks can be represented by directed graphs, where nodesrepresenting users and a directed edge from u to v represents that user u subscribes to user v or utags user v as a friend. Epinions is a who-trust-whom OSN providing consumer reviews, where adirected edge from u to v represents that user u trusts user v. Slashdot is a technology-related newswebsite for its specific user community, where a directed edge from u to v represents that user utags user v as a friend or foe. Epinions and Slashdot networks can be represented by signed graphs,where a positive edge from u to v indicates that u trusts v or u tags user v a friend, and a negative
2www.snap.stanford.edu
ACM Transactions on Knowledge Discovery from Data, Vol. V, No. N, Article A, Publication date: January YYYY.
Efficiently Estimating Motif Statistics of Large Networks A:11
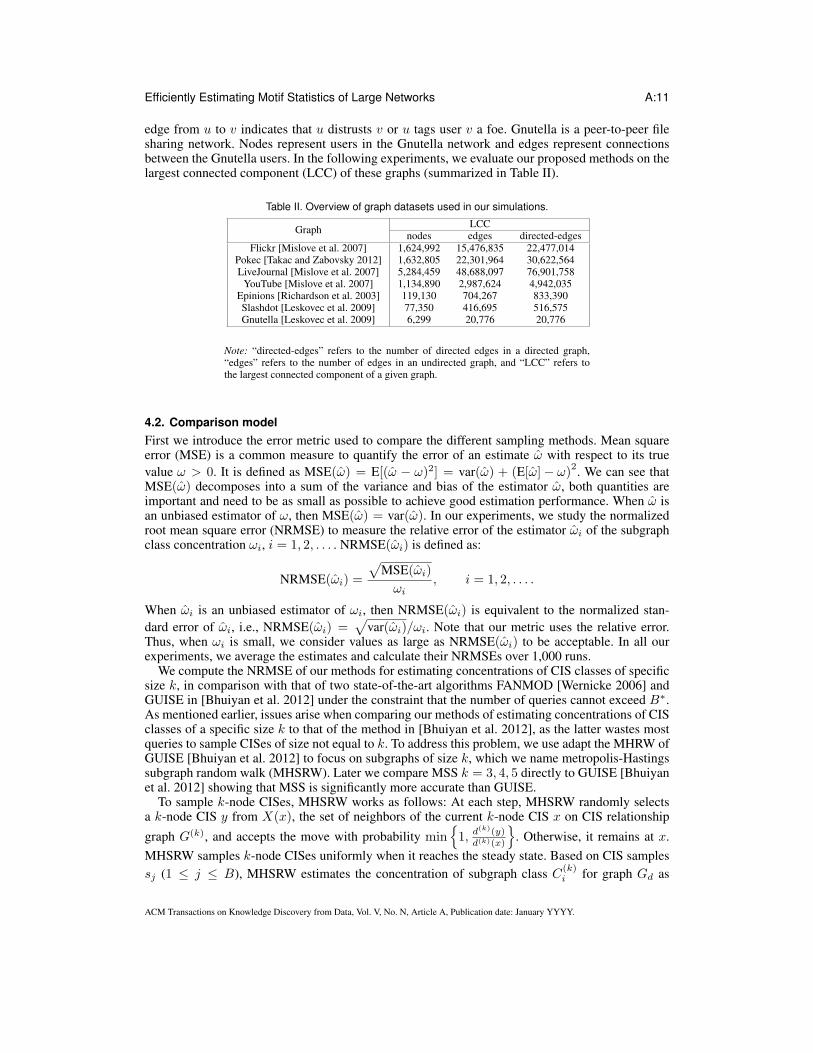
edge from u to v indicates that u distrusts v or u tags user v a foe. Gnutella is a peer-to-peer filesharing network. Nodes represent users in the Gnutella network and edges represent connectionsbetween the Gnutella users. In the following experiments, we evaluate our proposed methods on thelargest connected component (LCC) of these graphs (summarized in Table II).
Table II. Overview of graph datasets used in our simulations.
Graph LCCnodes edges directed-edges
Flickr [Mislove et al. 2007] 1,624,992 15,476,835 22,477,014Pokec [Takac and Zabovsky 2012] 1,632,805 22,301,964 30,622,564LiveJournal [Mislove et al. 2007] 5,284,459 48,688,097 76,901,758
YouTube [Mislove et al. 2007] 1,134,890 2,987,624 4,942,035Epinions [Richardson et al. 2003] 119,130 704,267 833,390Slashdot [Leskovec et al. 2009] 77,350 416,695 516,575Gnutella [Leskovec et al. 2009] 6,299 20,776 20,776
Note: “directed-edges” refers to the number of directed edges in a directed graph,“edges” refers to the number of edges in an undirected graph, and “LCC” refers tothe largest connected component of a given graph.
4.2. Comparison modelFirst we introduce the error metric used to compare the different sampling methods. Mean squareerror (MSE) is a common measure to quantify the error of an estimate ω with respect to its truevalue ω > 0. It is defined as MSE(ω) = E[(ω − ω)2] = var(ω) + (E[ω]− ω)
2. We can see thatMSE(ω) decomposes into a sum of the variance and bias of the estimator ω, both quantities areimportant and need to be as small as possible to achieve good estimation performance. When ω isan unbiased estimator of ω, then MSE(ω) = var(ω). In our experiments, we study the normalizedroot mean square error (NRMSE) to measure the relative error of the estimator ωi of the subgraphclass concentration ωi, i = 1, 2, . . . . NRMSE(ωi) is defined as:
NRMSE(ωi) =
√MSE(ωi)
ωi, i = 1, 2, . . . .
When ωi is an unbiased estimator of ωi, then NRMSE(ωi) is equivalent to the normalized stan-dard error of ωi, i.e., NRMSE(ωi) =
√var(ωi)/ωi. Note that our metric uses the relative error.
Thus, when ωi is small, we consider values as large as NRMSE(ωi) to be acceptable. In all ourexperiments, we average the estimates and calculate their NRMSEs over 1,000 runs.
We compute the NRMSE of our methods for estimating concentrations of CIS classes of specificsize k, in comparison with that of two state-of-the-art algorithms FANMOD [Wernicke 2006] andGUISE in [Bhuiyan et al. 2012] under the constraint that the number of queries cannot exceed B∗.As mentioned earlier, issues arise when comparing our methods of estimating concentrations of CISclasses of a specific size k to that of the method in [Bhuiyan et al. 2012], as the latter wastes mostqueries to sample CISes of size not equal to k. To address this problem, we use adapt the MHRW ofGUISE [Bhuiyan et al. 2012] to focus on subgraphs of size k, which we name metropolis-Hastingssubgraph random walk (MHSRW). Later we compare MSS k = 3, 4, 5 directly to GUISE [Bhuiyanet al. 2012] showing that MSS is significantly more accurate than GUISE.
To sample k-node CISes, MHSRW works as follows: At each step, MHSRW randomly selectsa k-node CIS y from X(x), the set of neighbors of the current k-node CIS x on CIS relationship
graph G(k), and accepts the move with probability min{1, d(k)(y)
d(k)(x)
}. Otherwise, it remains at x.
MHSRW samples k-node CISes uniformly when it reaches the steady state. Based on CIS samplessj (1 ≤ j ≤ B), MHSRW estimates the concentration of subgraph class C
(k)i for graph Gd as
ACM Transactions on Knowledge Discovery from Data, Vol. V, No. N, Article A, Publication date: January YYYY.

A:12 P. Wang et al.
follows,
ω(k)i =
1
B
B∑j=1
1(C(sj) = C(k)i ), 1 ≤ i ≤ Tk.
4.3. Results of estimating 3-node CIS class concentrationsIn this subsection we show results of estimating 3-node CIS class concentrations for undirected,directed, and signed graphs respectively.
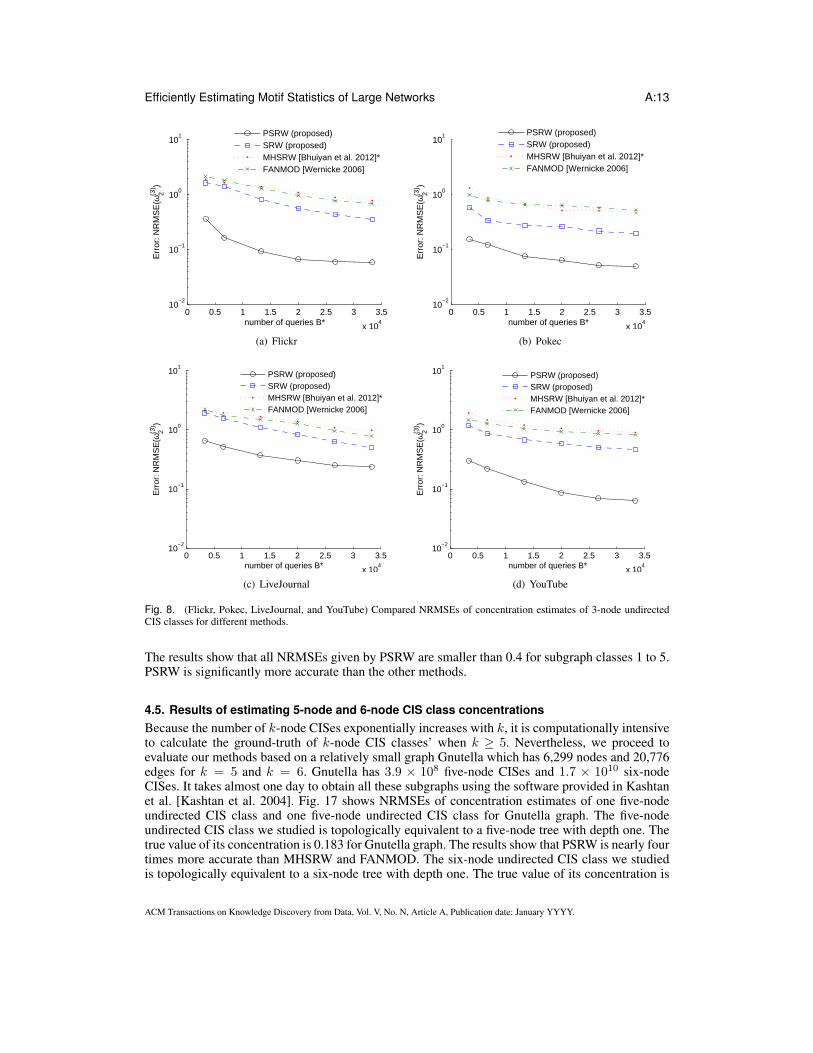
1) 3-node undirected CIS classes: Fig. 8 shows the results of estimating ω(3)2 , the concentration
of the 3-node undirected CIS class 2 (or the triangle as shown in Fig. 2 (a)) for Flickr, Pokec, Live-Journal, and YouTube graphs, where B∗ is the number of queries, i.e., the number of distinct nodesrequired to query in the original graph G. The true value of ω(3)
2 for Flickr, Pokec, LiveJournal, andYouTube are 0.0404, 0.0161, 0.0451, and 0.0021 respectively. The results show that PSRW exhibitsthe smallest errors, which are almost an order of magnitude less than errors of MHSRW and FAN-MOD for Flickr and Pokec graphs. SRW is more accurate than MHSRW and FANMOD but lessaccurate than PSRW. Note that PSRW uses only B∗ = 3 × 10³ queries and still exhibits smallererrors than the other methods that use one order of magnitude more queries B∗> 3 × 10⁴. Hence,PSRW reduces more than 10-fold the number of queries required to achieve the same estimationaccuracy. Meanwhile we observe that an order of magnitude increase in B∗ roughly decreases theerror by 1/
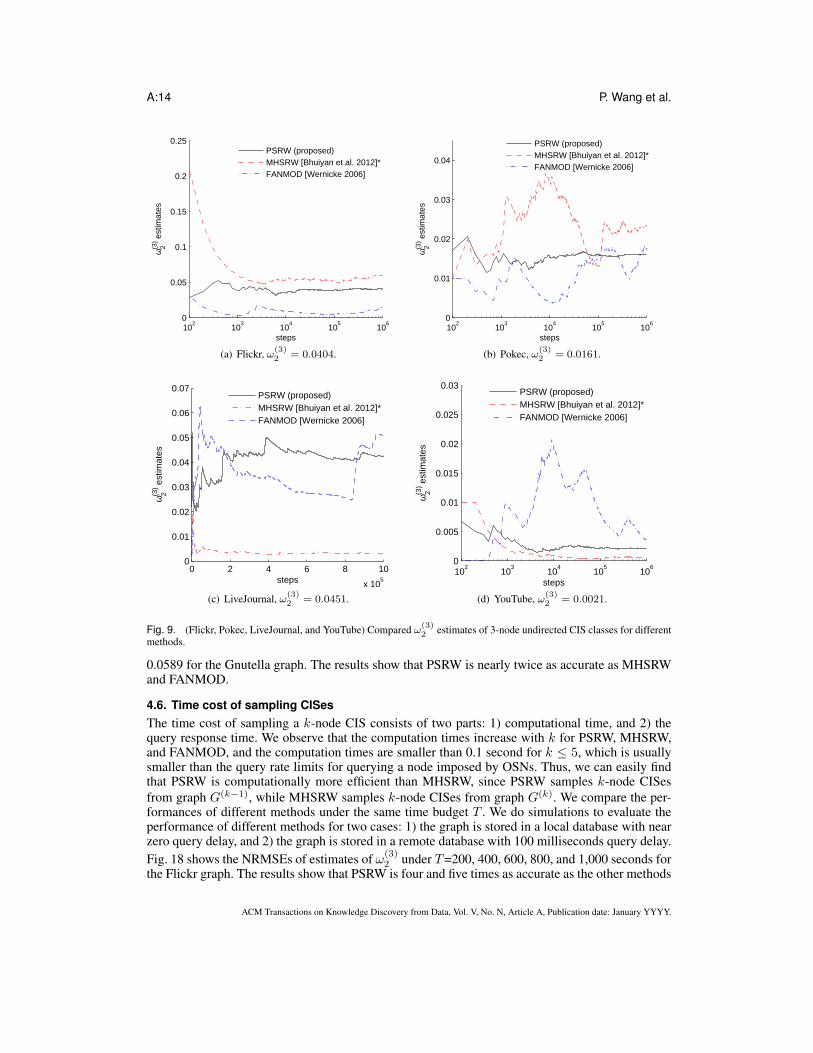
√10 for all methods studied. Fig. 9 plots the evolution of ω(3)
2 estimates as a function ofB (the number of sampling steps) for one run. We observe that PSRW converges to the value of ω(3)
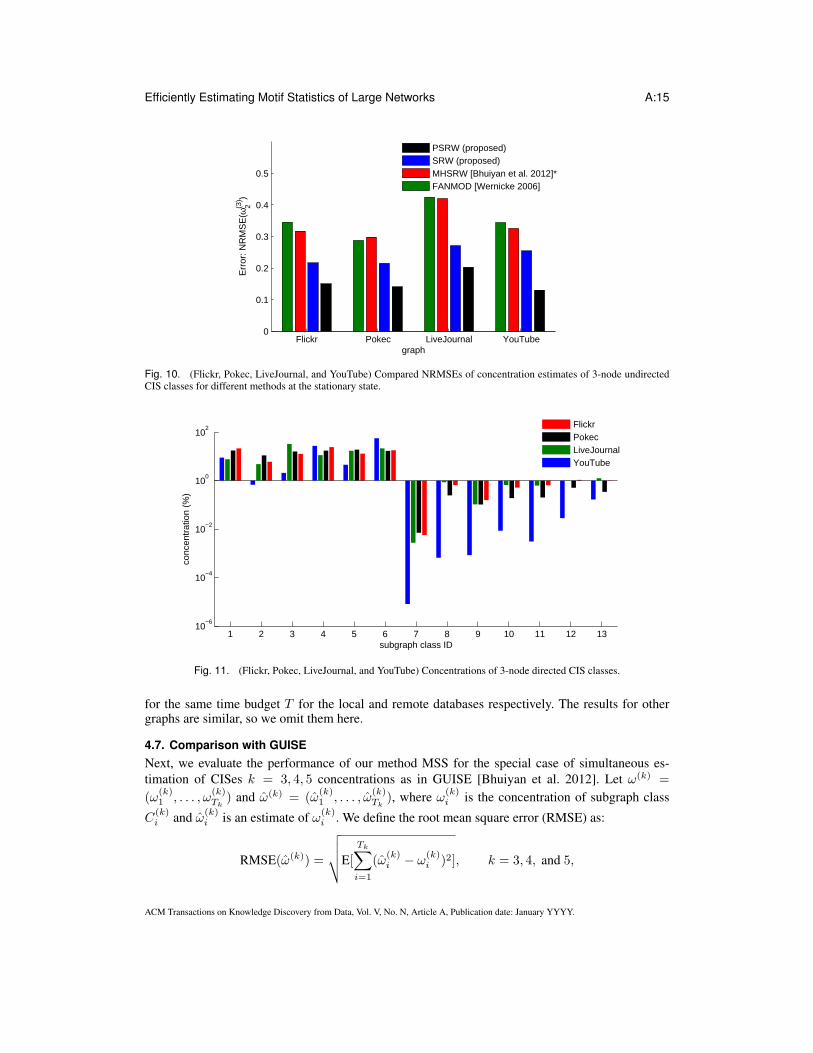
2when 103, 103, 2 × 10⁵, and 104 CISes are sampled for Flickr, Pokec, LiveJournal, and YouTuberespectively, and is much more quickly than the other methods. To compare the performances ofthese methods after the random walks have entered the stationary regime, Fig. 10 shows the resultsof estimating ω
(3)2 based on 104 CISes sampled after 106 steps. We can see that PSRW outperforms
the other methods at steady state.2) 3-node directed CIS classes: Fig. 11 shows the concentrations of 3-node directed CIS classes
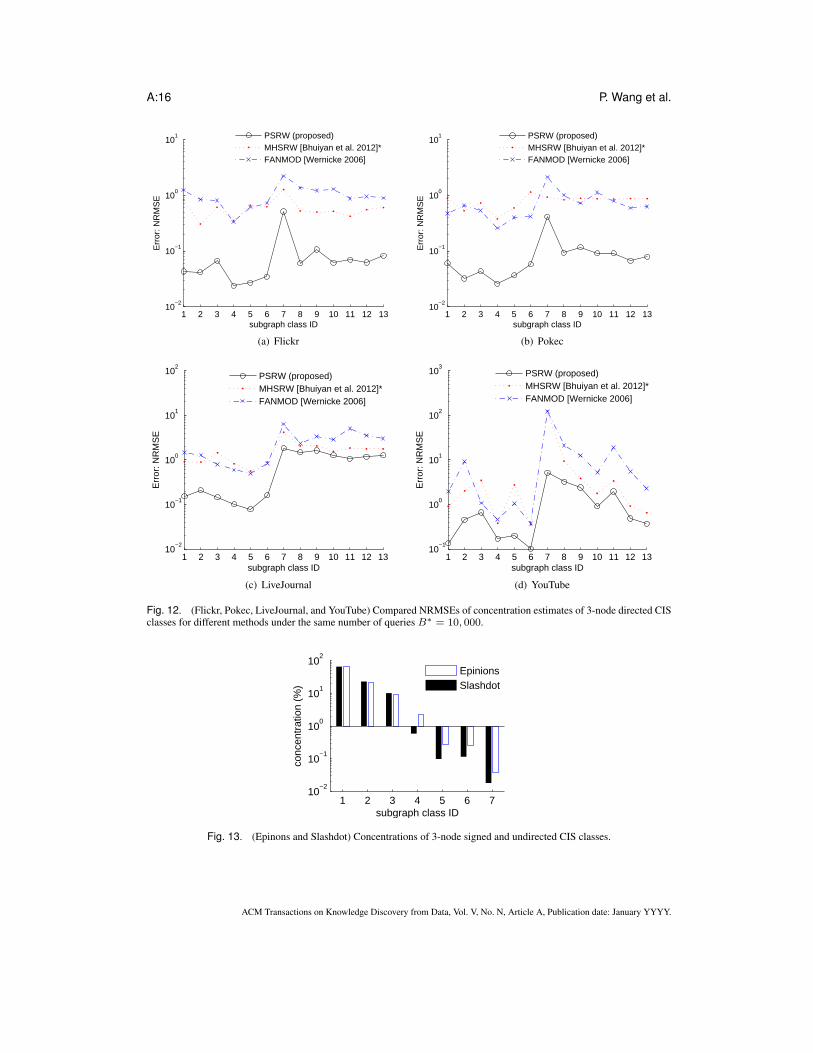
for Flickr, Pokec, LiveJournal, and YouTube graphs, and the subgraph classes and their associatedIDs are listed in Fig. 3. The total numbers of 3-node CISes are 1.4 × 10¹⁰, 2.0 × 10⁹, 6.9 × 10⁹,and 1.5 × 10⁹ for Flickr, Pokec, LiveJournal, and YouTube respectively. Fig. 12 compares con-centrations estimates of 3-node directed CIS classes for different methods under the same numberof queries B∗ = 10, 000. The results show that subgraph classes with smaller concentrations havelarger NRMSEs. PSRW is significantly more accurate than the other methods for most subgraphclasses. SRW is not shown in the plots but its performance lies again somewhere between MHSRWand FANMOD.
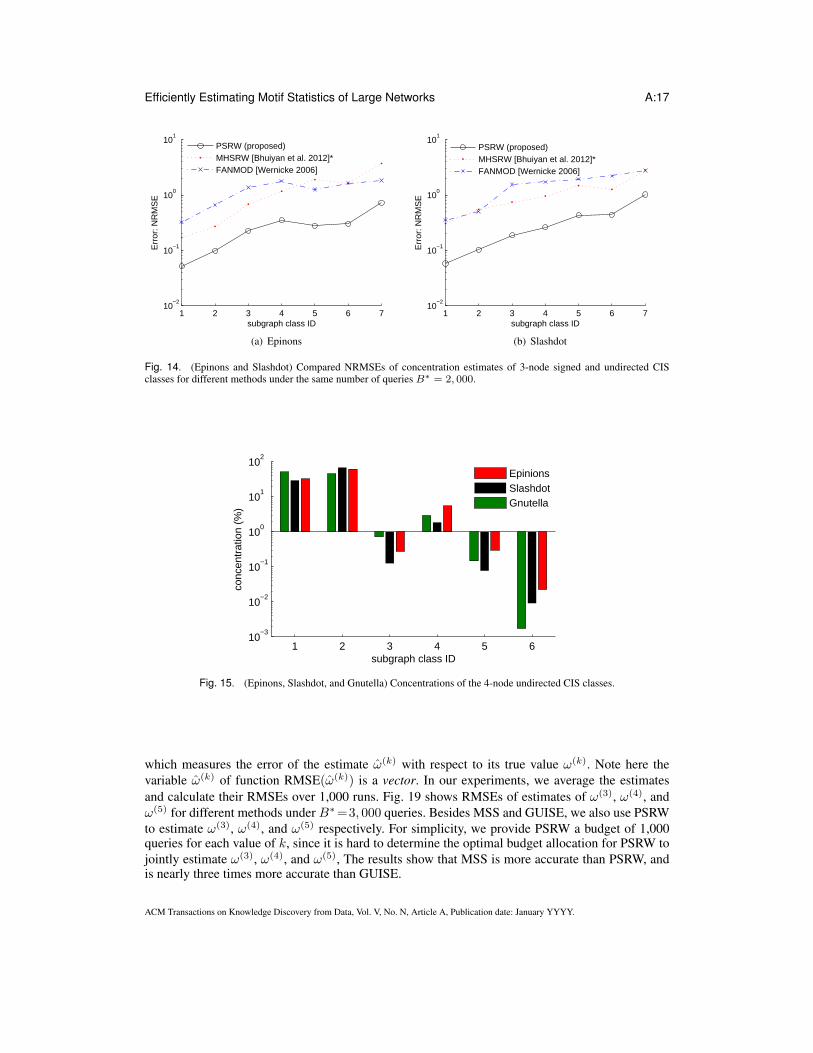
3) 3-node signed and undirected CIS classes: Figure 13 shows the concentrations of 3-nodesigned and undirected CIS classes (as listed in Fig. 4) for Epinions and Slashdot graphs. Epinionsand Slashdot graphs have 1.7 × 10⁸ and 6.7 × 10⁷ signed and undirected 3-node CISes respec-tively. Fig. 14 shows the estimated concentrations of signed and undirected 3-node CIS classes fordifferent methods under B∗ = 2, 000 queries. The results show that subgraph classes with smallerconcentrations have larger NRMSEs. All NRMSEs given by PSRW are much smaller than onefor all subgraph classes. PSRW is almost four times more accurate than MHSRW and FANMOD.MHSRW exhibits slightly smaller errors than FANMOD for most subgraph classes.
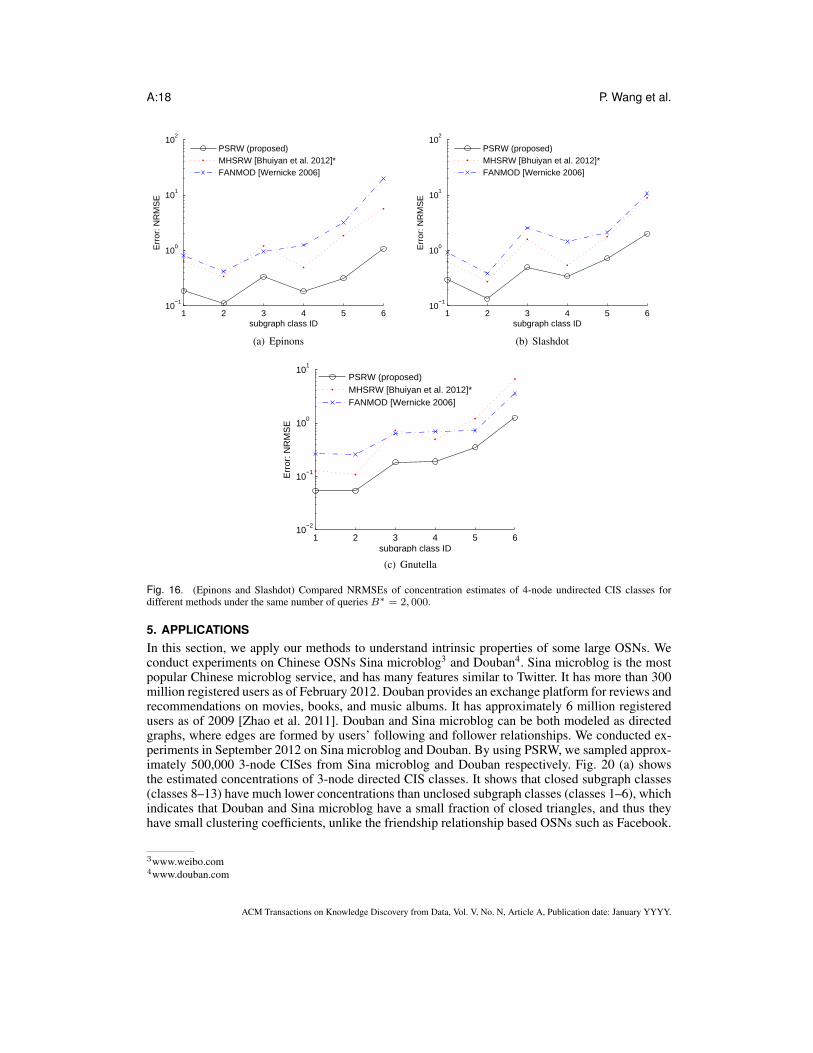
4.4. Results of estimating 4-node CIS class concentrationsFigure 15 shows the concentrations of 4-node undirected CIS classes (as listed in Fig. 2 (b)) forEpinions, Slashdot, and Gnutella graphs. Epinions, Slashdot, and Gnutella graphs have 2.5× 1010,2.1 × 1010, and 1.0 × 10⁷ undirected four-node CISes respectively. Fig. 16 shows the estimatedconcentrations of undirected four-node CIS classes for different methods under B∗=2, 000 queries.
ACM Transactions on Knowledge Discovery from Data, Vol. V, No. N, Article A, Publication date: January YYYY.
Efficiently Estimating Motif Statistics of Large Networks A:13
0 0.5 1 1.5 2 2.5 3 3.5
x 104
10−2
10−1
100
101
number of queries B*
Err
or: N
RM
SE
(ω2(3
) )
PSRW (proposed)SRW (proposed)MHSRW [Bhuiyan et al. 2012]*FANMOD [Wernicke 2006]
(a) Flickr
0 0.5 1 1.5 2 2.5 3 3.5
x 104
10−2
10−1
100
101
number of queries B*
Err
or: N
RM
SE
(ω2(3
) )
PSRW (proposed)SRW (proposed)MHSRW [Bhuiyan et al. 2012]*FANMOD [Wernicke 2006]
(b) Pokec
0 0.5 1 1.5 2 2.5 3 3.5
x 104
10−2
10−1
100
101
number of queries B*
Err
or: N
RM
SE
(ω2(3
) )
PSRW (proposed)SRW (proposed)MHSRW [Bhuiyan et al. 2012]*FANMOD [Wernicke 2006]
(c) LiveJournal
0 0.5 1 1.5 2 2.5 3 3.5
x 104
10−2
10−1
100
101
number of queries B*
Err
or: N
RM
SE
(ω2(3
) )
PSRW (proposed)SRW (proposed)MHSRW [Bhuiyan et al. 2012]*FANMOD [Wernicke 2006]
(d) YouTube
Fig. 8. (Flickr, Pokec, LiveJournal, and YouTube) Compared NRMSEs of concentration estimates of 3-node undirectedCIS classes for different methods.
The results show that all NRMSEs given by PSRW are smaller than 0.4 for subgraph classes 1 to 5.PSRW is significantly more accurate than the other methods.
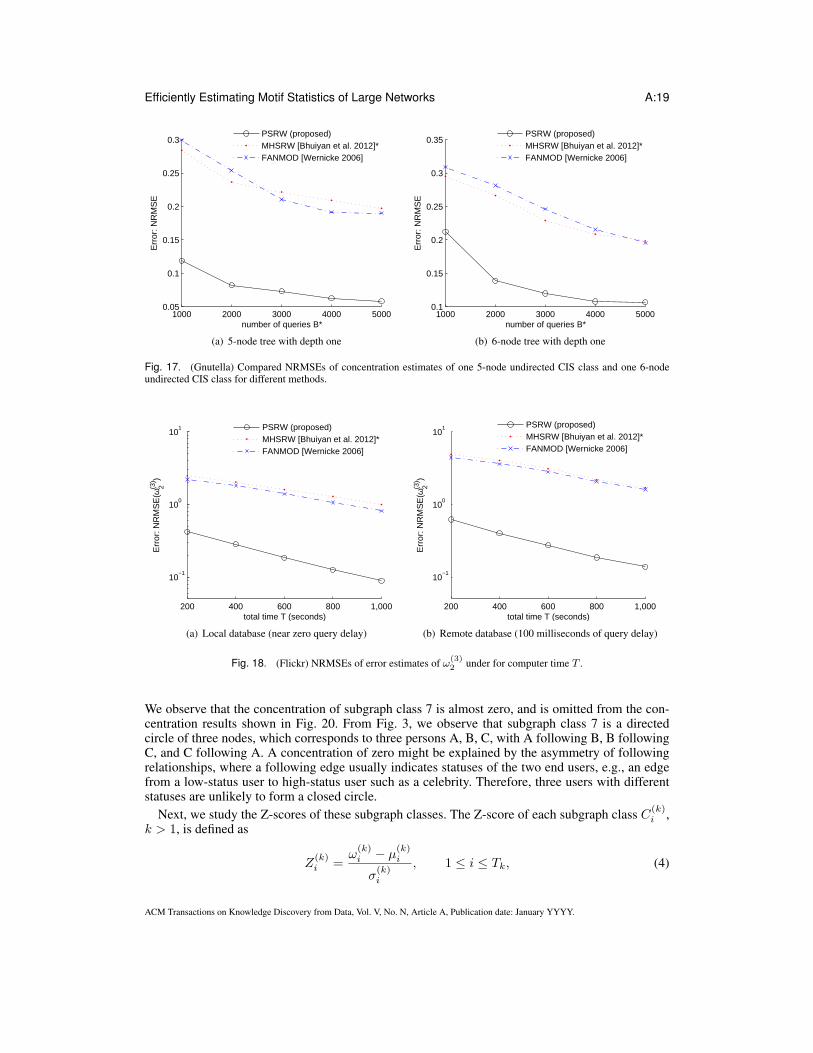
4.5. Results of estimating 5-node and 6-node CIS class concentrationsBecause the number of k-node CISes exponentially increases with k, it is computationally intensiveto calculate the ground-truth of k-node CIS classes’ when k ≥ 5. Nevertheless, we proceed toevaluate our methods based on a relatively small graph Gnutella which has 6,299 nodes and 20,776edges for k = 5 and k = 6. Gnutella has 3.9 × 10⁸ five-node CISes and 1.7 × 10¹⁰ six-nodeCISes. It takes almost one day to obtain all these subgraphs using the software provided in Kashtanet al. [Kashtan et al. 2004]. Fig. 17 shows NRMSEs of concentration estimates of one five-nodeundirected CIS class and one five-node undirected CIS class for Gnutella graph. The five-nodeundirected CIS class we studied is topologically equivalent to a five-node tree with depth one. Thetrue value of its concentration is 0.183 for Gnutella graph. The results show that PSRW is nearly fourtimes more accurate than MHSRW and FANMOD. The six-node undirected CIS class we studiedis topologically equivalent to a six-node tree with depth one. The true value of its concentration is
ACM Transactions on Knowledge Discovery from Data, Vol. V, No. N, Article A, Publication date: January YYYY.
A:14 P. Wang et al.
102
103
104
105
106
0
0.05
0.1
0.15
0.2
0.25
steps
ω2(3
) est
imat
es
PSRW (proposed)MHSRW [Bhuiyan et al. 2012]*FANMOD [Wernicke 2006]
(a) Flickr, ω(3)2 = 0.0404.
102
103
104
105
106
0
0.01
0.02
0.03
0.04
steps
ω2(3
) est
imat
es
PSRW (proposed)MHSRW [Bhuiyan et al. 2012]*FANMOD [Wernicke 2006]
(b) Pokec, ω(3)2 = 0.0161.
0 2 4 6 8 10
x 105
0
0.01
0.02
0.03
0.04
0.05
0.06
0.07
steps
ω2(3
) est
imat
es
PSRW (proposed)MHSRW [Bhuiyan et al. 2012]*FANMOD [Wernicke 2006]
(c) LiveJournal, ω(3)2 = 0.0451.
102
103
104
105
106
0
0.005
0.01
0.015
0.02
0.025
0.03
steps
ω2(3
) est
imat
es
PSRW (proposed)MHSRW [Bhuiyan et al. 2012]*FANMOD [Wernicke 2006]
(d) YouTube, ω(3)2 = 0.0021.
Fig. 9. (Flickr, Pokec, LiveJournal, and YouTube) Compared ω(3)2 estimates of 3-node undirected CIS classes for different
methods.
0.0589 for the Gnutella graph. The results show that PSRW is nearly twice as accurate as MHSRWand FANMOD.
4.6. Time cost of sampling CISesThe time cost of sampling a k-node CIS consists of two parts: 1) computational time, and 2) thequery response time. We observe that the computation times increase with k for PSRW, MHSRW,and FANMOD, and the computation times are smaller than 0.1 second for k ≤ 5, which is usuallysmaller than the query rate limits for querying a node imposed by OSNs. Thus, we can easily findthat PSRW is computationally more efficient than MHSRW, since PSRW samples k-node CISesfrom graph G(k−1), while MHSRW samples k-node CISes from graph G(k). We compare the per-formances of different methods under the same time budget T . We do simulations to evaluate theperformance of different methods for two cases: 1) the graph is stored in a local database with nearzero query delay, and 2) the graph is stored in a remote database with 100 milliseconds query delay.Fig. 18 shows the NRMSEs of estimates of ω(3)
2 under T=200, 400, 600, 800, and 1,000 seconds forthe Flickr graph. The results show that PSRW is four and five times as accurate as the other methods
ACM Transactions on Knowledge Discovery from Data, Vol. V, No. N, Article A, Publication date: January YYYY.
Efficiently Estimating Motif Statistics of Large Networks A:15
Flickr Pokec LiveJournal YouTube0
0.1
0.2
0.3
0.4
0.5
graph
Err
or: N
RM
SE
(ω2(3
) )
PSRW (proposed)SRW (proposed)MHSRW [Bhuiyan et al. 2012]*FANMOD [Wernicke 2006]
Fig. 10. (Flickr, Pokec, LiveJournal, and YouTube) Compared NRMSEs of concentration estimates of 3-node undirectedCIS classes for different methods at the stationary state.
2 4 6 8 10 121 3 5 7 9 11 1310
−6
10−4
10−2
100
102
subgraph class ID
conc
entr
atio
n (%
)
FlickrPokecLiveJournalYouTube
Fig. 11. (Flickr, Pokec, LiveJournal, and YouTube) Concentrations of 3-node directed CIS classes.
for the same time budget T for the local and remote databases respectively. The results for othergraphs are similar, so we omit them here.
4.7. Comparison with GUISENext, we evaluate the performance of our method MSS for the special case of simultaneous es-timation of CISes k = 3, 4, 5 concentrations as in GUISE [Bhuiyan et al. 2012]. Let ω(k) =
(ω(k)1 , . . . , ω
(k)Tk
) and ω(k) = (ω(k)1 , . . . , ω
(k)Tk
), where ω(k)i is the concentration of subgraph class
C(k)i and ω
(k)i is an estimate of ω(k)
i . We define the root mean square error (RMSE) as:
RMSE(ω(k)) =
√√√√E[Tk∑i=1
(ω(k)i − ω
(k)i )2], k = 3, 4, and 5,
ACM Transactions on Knowledge Discovery from Data, Vol. V, No. N, Article A, Publication date: January YYYY.
A:16 P. Wang et al.
2 4 6 8 10 121 3 5 7 9 11 1310
−2
10−1
100
101
subgraph class ID
Err
or: N
RM
SE
PSRW (proposed)MHSRW [Bhuiyan et al. 2012]*FANMOD [Wernicke 2006]
(a) Flickr
2 4 6 8 10 121 3 5 7 9 11 1310
−2
10−1
100
101
subgraph class ID
Err
or: N
RM
SE
PSRW (proposed)MHSRW [Bhuiyan et al. 2012]*FANMOD [Wernicke 2006]
(b) Pokec
2 4 6 8 10 121 3 5 7 9 11 1310
−2
10−1
100
101
102
subgraph class ID
Err
or: N
RM
SE
PSRW (proposed)MHSRW [Bhuiyan et al. 2012]*FANMOD [Wernicke 2006]
(c) LiveJournal
2 4 6 8 10 121 3 5 7 9 11 1310
−1
100
101
102
103
subgraph class ID
Err
or: N
RM
SE
PSRW (proposed)MHSRW [Bhuiyan et al. 2012]*FANMOD [Wernicke 2006]
(d) YouTube
Fig. 12. (Flickr, Pokec, LiveJournal, and YouTube) Compared NRMSEs of concentration estimates of 3-node directed CISclasses for different methods under the same number of queries B∗ = 10, 000.
1 2 3 4 5 6 710
−2
10−1
100
101
102
subgraph class ID
conc
entr
atio
n (%
)
EpinionsSlashdot
Fig. 13. (Epinons and Slashdot) Concentrations of 3-node signed and undirected CIS classes.
ACM Transactions on Knowledge Discovery from Data, Vol. V, No. N, Article A, Publication date: January YYYY.
Efficiently Estimating Motif Statistics of Large Networks A:17
1 2 3 4 5 6 710
−2
10−1
100
101
subgraph class ID
Err
or: N
RM
SE
PSRW (proposed)MHSRW [Bhuiyan et al. 2012]*FANMOD [Wernicke 2006]
(a) Epinons
1 2 3 4 5 6 710
−2
10−1
100
101
subgraph class ID
Err
or: N
RM
SE
PSRW (proposed)MHSRW [Bhuiyan et al. 2012]*FANMOD [Wernicke 2006]
(b) Slashdot
Fig. 14. (Epinons and Slashdot) Compared NRMSEs of concentration estimates of 3-node signed and undirected CISclasses for different methods under the same number of queries B∗ = 2, 000.
1 2 3 4 5 610
−3
10−2
10−1
100
101
102
subgraph class ID
conc
entr
atio
n (%
)
EpinionsSlashdotGnutella
Fig. 15. (Epinons, Slashdot, and Gnutella) Concentrations of the 4-node undirected CIS classes.
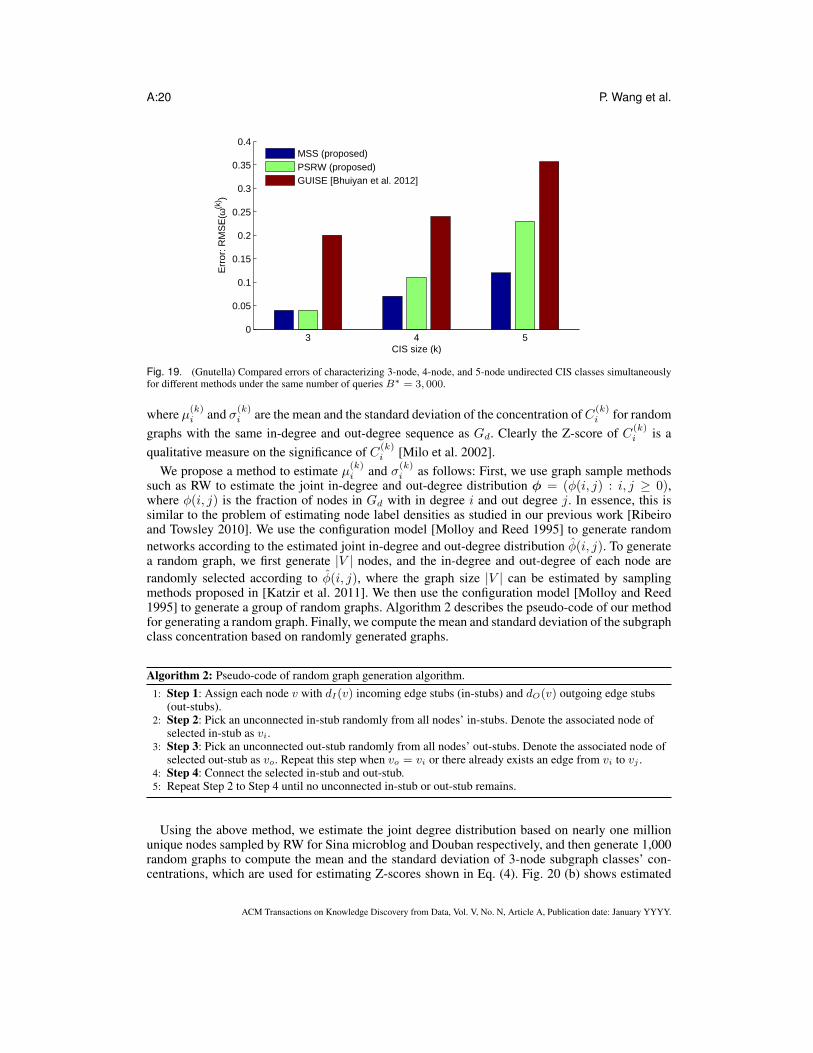
which measures the error of the estimate ω(k) with respect to its true value ω(k). Note here thevariable ω(k) of function RMSE(ω(k)) is a vector. In our experiments, we average the estimatesand calculate their RMSEs over 1,000 runs. Fig. 19 shows RMSEs of estimates of ω(3), ω(4), andω(5) for different methods under B∗=3, 000 queries. Besides MSS and GUISE, we also use PSRWto estimate ω(3), ω(4), and ω(5) respectively. For simplicity, we provide PSRW a budget of 1,000queries for each value of k, since it is hard to determine the optimal budget allocation for PSRW tojointly estimate ω(3), ω(4), and ω(5), The results show that MSS is more accurate than PSRW, andis nearly three times more accurate than GUISE.
ACM Transactions on Knowledge Discovery from Data, Vol. V, No. N, Article A, Publication date: January YYYY.
A:18 P. Wang et al.
1 2 3 4 5 610
−1
100
101
102
subgraph class ID
Err
or: N
RM
SE
PSRW (proposed)MHSRW [Bhuiyan et al. 2012]*FANMOD [Wernicke 2006]
(a) Epinons
1 2 3 4 5 610
−1
100
101
102
subgraph class ID
Err
or: N
RM
SE
PSRW (proposed)MHSRW [Bhuiyan et al. 2012]*FANMOD [Wernicke 2006]
(b) Slashdot
1 2 3 4 5 610
−2
10−1
100
101
subgraph class ID
Err
or: N
RM
SE
PSRW (proposed)MHSRW [Bhuiyan et al. 2012]*FANMOD [Wernicke 2006]
(c) Gnutella
Fig. 16. (Epinons and Slashdot) Compared NRMSEs of concentration estimates of 4-node undirected CIS classes fordifferent methods under the same number of queries B∗ = 2, 000.
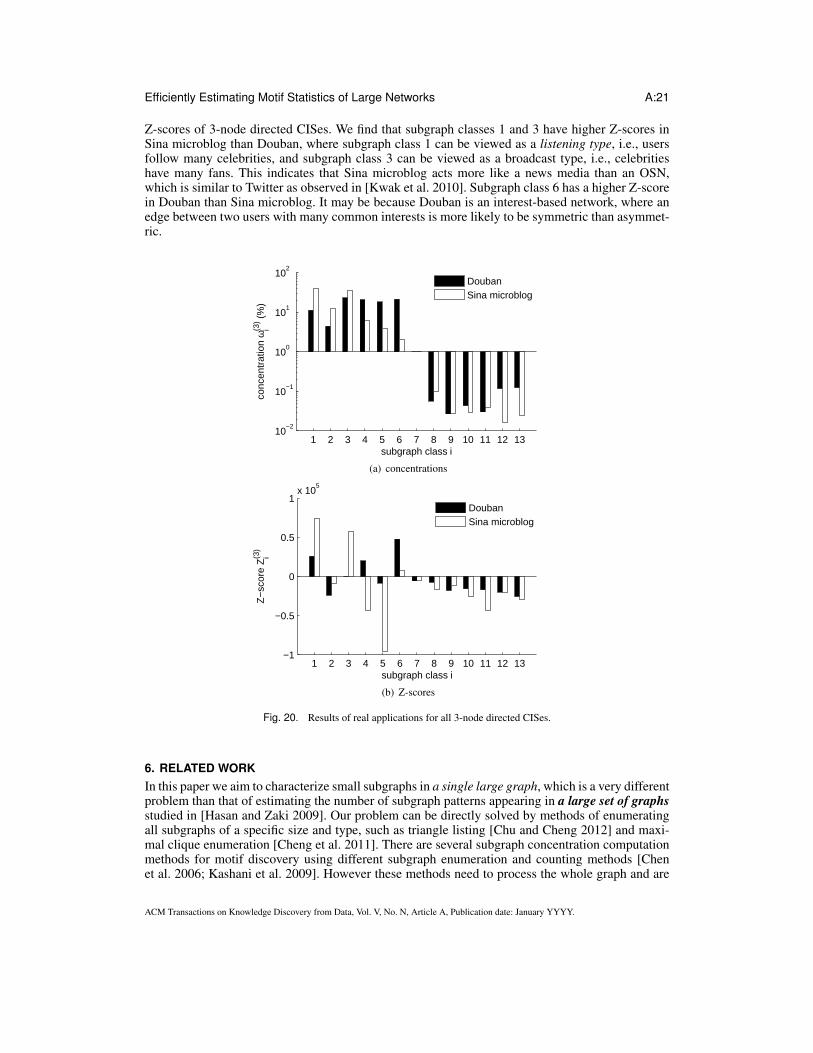
5. APPLICATIONSIn this section, we apply our methods to understand intrinsic properties of some large OSNs. Weconduct experiments on Chinese OSNs Sina microblog3 and Douban4. Sina microblog is the mostpopular Chinese microblog service, and has many features similar to Twitter. It has more than 300million registered users as of February 2012. Douban provides an exchange platform for reviews andrecommendations on movies, books, and music albums. It has approximately 6 million registeredusers as of 2009 [Zhao et al. 2011]. Douban and Sina microblog can be both modeled as directedgraphs, where edges are formed by users’ following and follower relationships. We conducted ex-periments in September 2012 on Sina microblog and Douban. By using PSRW, we sampled approx-imately 500,000 3-node CISes from Sina microblog and Douban respectively. Fig. 20 (a) showsthe estimated concentrations of 3-node directed CIS classes. It shows that closed subgraph classes(classes 8–13) have much lower concentrations than unclosed subgraph classes (classes 1–6), whichindicates that Douban and Sina microblog have a small fraction of closed triangles, and thus theyhave small clustering coefficients, unlike the friendship relationship based OSNs such as Facebook.
3www.weibo.com4www.douban.com
ACM Transactions on Knowledge Discovery from Data, Vol. V, No. N, Article A, Publication date: January YYYY.
Efficiently Estimating Motif Statistics of Large Networks A:19
1000 2000 3000 4000 50000.05
0.1
0.15
0.2
0.25
0.3
number of queries B*
Err
or: N
RM
SE
PSRW (proposed)MHSRW [Bhuiyan et al. 2012]*FANMOD [Wernicke 2006]
(a) 5-node tree with depth one
1000 2000 3000 4000 50000.1
0.15
0.2
0.25
0.3
0.35
number of queries B*
Err
or: N
RM
SE
PSRW (proposed)MHSRW [Bhuiyan et al. 2012]*FANMOD [Wernicke 2006]
(b) 6-node tree with depth one
Fig. 17. (Gnutella) Compared NRMSEs of concentration estimates of one 5-node undirected CIS class and one 6-nodeundirected CIS class for different methods.
200 400 600 800 1,000
10−1
100
101
total time T (seconds)
Err
or: N
RM
SE
(ω2(3
) )
PSRW (proposed)MHSRW [Bhuiyan et al. 2012]*FANMOD [Wernicke 2006]
(a) Local database (near zero query delay)
200 400 600 800 1,000
10−1
100
101
total time T (seconds)
Err
or: N
RM
SE
(ω2(3
) )
PSRW (proposed)MHSRW [Bhuiyan et al. 2012]*FANMOD [Wernicke 2006]
(b) Remote database (100 milliseconds of query delay)
Fig. 18. (Flickr) NRMSEs of error estimates of ω(3)2 under for computer time T .
We observe that the concentration of subgraph class 7 is almost zero, and is omitted from the con-centration results shown in Fig. 20. From Fig. 3, we observe that subgraph class 7 is a directedcircle of three nodes, which corresponds to three persons A, B, C, with A following B, B followingC, and C following A. A concentration of zero might be explained by the asymmetry of followingrelationships, where a following edge usually indicates statuses of the two end users, e.g., an edgefrom a low-status user to high-status user such as a celebrity. Therefore, three users with differentstatuses are unlikely to form a closed circle.
Next, we study the Z-scores of these subgraph classes. The Z-score of each subgraph class C(k)i ,
k > 1, is defined as
Z(k)i =
ω(k)i − µ
(k)i
σ(k)i
, 1 ≤ i ≤ Tk, (4)
ACM Transactions on Knowledge Discovery from Data, Vol. V, No. N, Article A, Publication date: January YYYY.
A:20 P. Wang et al.
3 4 50
0.05
0.1
0.15
0.2
0.25
0.3
0.35
0.4
CIS size (k)
Err
or: R
MS
E(ω
(k) )
MSS (proposed)PSRW (proposed)GUISE [Bhuiyan et al. 2012]
Fig. 19. (Gnutella) Compared errors of characterizing 3-node, 4-node, and 5-node undirected CIS classes simultaneouslyfor different methods under the same number of queries B∗ = 3, 000.
where µ(k)i and σ
(k)i are the mean and the standard deviation of the concentration of C(k)
i for randomgraphs with the same in-degree and out-degree sequence as Gd. Clearly the Z-score of C(k)
i is aqualitative measure on the significance of C(k)
i [Milo et al. 2002].We propose a method to estimate µ
(k)i and σ
(k)i as follows: First, we use graph sample methods
such as RW to estimate the joint in-degree and out-degree distribution ϕ = (ϕ(i, j) : i, j ≥ 0),where ϕ(i, j) is the fraction of nodes in Gd with in degree i and out degree j. In essence, this issimilar to the problem of estimating node label densities as studied in our previous work [Ribeiroand Towsley 2010]. We use the configuration model [Molloy and Reed 1995] to generate randomnetworks according to the estimated joint in-degree and out-degree distribution ϕ(i, j). To generatea random graph, we first generate |V | nodes, and the in-degree and out-degree of each node arerandomly selected according to ϕ(i, j), where the graph size |V | can be estimated by samplingmethods proposed in [Katzir et al. 2011]. We then use the configuration model [Molloy and Reed1995] to generate a group of random graphs. Algorithm 2 describes the pseudo-code of our methodfor generating a random graph. Finally, we compute the mean and standard deviation of the subgraphclass concentration based on randomly generated graphs.
Algorithm 2: Pseudo-code of random graph generation algorithm.1: Step 1: Assign each node v with dI(v) incoming edge stubs (in-stubs) and dO(v) outgoing edge stubs
(out-stubs).2: Step 2: Pick an unconnected in-stub randomly from all nodes’ in-stubs. Denote the associated node of
selected in-stub as vi.3: Step 3: Pick an unconnected out-stub randomly from all nodes’ out-stubs. Denote the associated node of
selected out-stub as vo. Repeat this step when vo = vi or there already exists an edge from vi to vj .4: Step 4: Connect the selected in-stub and out-stub.5: Repeat Step 2 to Step 4 until no unconnected in-stub or out-stub remains.
Using the above method, we estimate the joint degree distribution based on nearly one millionunique nodes sampled by RW for Sina microblog and Douban respectively, and then generate 1,000random graphs to compute the mean and the standard deviation of 3-node subgraph classes’ con-centrations, which are used for estimating Z-scores shown in Eq. (4). Fig. 20 (b) shows estimated
ACM Transactions on Knowledge Discovery from Data, Vol. V, No. N, Article A, Publication date: January YYYY.
Efficiently Estimating Motif Statistics of Large Networks A:21
Z-scores of 3-node directed CISes. We find that subgraph classes 1 and 3 have higher Z-scores inSina microblog than Douban, where subgraph class 1 can be viewed as a listening type, i.e., usersfollow many celebrities, and subgraph class 3 can be viewed as a broadcast type, i.e., celebritieshave many fans. This indicates that Sina microblog acts more like a news media than an OSN,which is similar to Twitter as observed in [Kwak et al. 2010]. Subgraph class 6 has a higher Z-scorein Douban than Sina microblog. It may be because Douban is an interest-based network, where anedge between two users with many common interests is more likely to be symmetric than asymmet-ric.
1 2 3 4 5 6 7 8 9 10 11 12 1310
−2
10−1
100
101
102
subgraph class i
conc
entr
atio
n ω
i(3) (
%)
DoubanSina microblog
(a) concentrations
1 2 3 4 5 6 7 8 9 10 11 12 13−1
−0.5
0
0.5
1x 10
5
subgraph class i
Z−
scor
e Z
i(3)
DoubanSina microblog
(b) Z-scores
Fig. 20. Results of real applications for all 3-node directed CISes.
6. RELATED WORKIn this paper we aim to characterize small subgraphs in a single large graph, which is a very differentproblem than that of estimating the number of subgraph patterns appearing in a large set of graphsstudied in [Hasan and Zaki 2009]. Our problem can be directly solved by methods of enumeratingall subgraphs of a specific size and type, such as triangle listing [Chu and Cheng 2012] and maxi-mal clique enumeration [Cheng et al. 2011]. There are several subgraph concentration computationmethods for motif discovery using different subgraph enumeration and counting methods [Chenet al. 2006; Kashani et al. 2009]. However these methods need to process the whole graph and are
ACM Transactions on Knowledge Discovery from Data, Vol. V, No. N, Article A, Publication date: January YYYY.

A:22 P. Wang et al.
computationally hard for large graphs. Meanwhile most of these methods are difficult to combinewith sampling techniques. OmidiGenes et al. [Omidi et al. 2009] proposed a subgraph enumerationand counting method using sampling. However this method suffers from unknown sampling bias. Toestimate subgraph class concentrations, Kashtan et al. [Kashtan et al. 2004] proposed a connectedsubgraph sampling method using random edge sampling. However their method is computationallyexpensive when calculating the weight of each sampled subgraph, which is used for correcting biasintroduced by edge sampling. To address this drawback, Wernicke [Wernicke 2006] proposed a newmethod named FANMOD based on enumerating subgraph trees to detect network motifs. To samplea k-node CIS, their method needs to explore more than k nodes, which is expensive when exploringgraph topology via crawling. Neither the method proposed in [Kashtan et al. 2004] nor [Wernicke2006] can be applied to detect motifs in OSNs without the complete knowledge of the graph topol-ogy, since they rely on uniform edge sampling and uniform node sampling techniques respectively,which may not be feasible because these sampling functions are not supported by most OSNs.
Similar to estimate subgraph class concentrations, Bhuiyan et al. [Bhuiyan et al. 2012] proposea method GUISE for estimating 3-node, 4-node, and 5-node subgraph frequency distribution, thatis, (nx
N : x is a 3-node, 4-node, or 5-node undirected and connected subgraph class), where nx bethe number of undirected CISes in subgraph class x, and N is the total number of 3-node, 4-node,and 5-node undirected CISes. GUISE builds a new graph Gmix, whose node set consists of all 3-node, 4-node, and 5-node CISes. For a 3-node CIS, all 3-node and 4-node CISes having 2 and 3nodes in common respectively are its neighbors in Gmix. For a 4-node CIS, all 3-node, 4-node, and5-node CISes having 3, 3, and 4 nodes in common respectively are its neighbors in Gmix. For a5-node CIS all 4-node and 5-node CISes with 4 nodes in common are its neighbors in Gmix. Toestimate subgraph frequency distribution, GUISE performs a Metropolis-Hastings based samplingmethod over Gmix. Hardiman and Katzir [Hardiman and Katzir 2013] propose random walk basedsampling methods for estimating the network average and global clustering coefficients. Gjoka etal. [Gjoka et al. 2013] propose a uniform node sampling based method for estimating the clique(i.e., complete subgraph) size distribution. The methods in [Hardiman and Katzir 2013; Gjoka et al.2013] are difficult to extend to measure concentrations of subgraph classes.
7. CONCLUSIONSIn this paper we propose two random walk based sampling methods to estimate subgraph classconcentrations when the complete graph topology is not available. The experimental results showthat our methods PSRW and SRW only need to sample a very small fraction of subgraphs to obtainan accurate and unbias estimate, and significant reduces the number of samples required to achievethe same estimation accuracy of state-of-the-art methods such as FANMOD. Also, simulation resultsshow that PSRW is much more accurate and computational efficient than SRW.
AppendixLEMMA 7.1. When a graph G = (V,E) is connected, for each node v ∈ V , we can generate a
(k + 1)-node tree with a root v that contains min{d(v), k} neighbors, where d(v) is the degree ofv in graph G, and 1 ≤ k ≤ |V | − 1.
PROOF. One can use breadth-first search (BFS) to traverse G starting from v, then build a treefrom the first k nodes visited by BFS, where 2 ≤ k ≤ |V |. This tree clearly contains min{d(v), k}neighbors of v and the root node is v.
LEMMA 7.2 ([ROBERTS AND ROSENTHAL 2004; JONES 2004; LEE ET AL. 2012]). LetG = (V,E) be connected and non-bipartite. Let uj be the j-th node sampled by a RW on G,where 1 ≤ j ≤ B and B be the number of samples. Denote by π = (πv, v ∈ V ) the stationarydistribution, where πv = dv
2|E| . Then, for any function f(v) : V → R, where∑
∀v∈V f(v) <∞, we
ACM Transactions on Knowledge Discovery from Data, Vol. V, No. N, Article A, Publication date: January YYYY.
Efficiently Estimating Motif Statistics of Large Networks A:23
have
limB→∞
1
B
B∑j=1
f(uj)a.s.−−→ 1
|V |∑∀v∈V
f(v)πv.
LEMMA 7.3 ([MEYN AND TWEEDIE 2009; RIBEIRO AND TOWSLEY 2010]). Let G =(V,E) be an undirected graph which is connected and non-bipartite. Let (uj , vj) (1 ≤ j ≤ B)be the j-th edge sampled by a RW, where B is the number of sampled edges. Denote functionf(u, v) :V ×V →R. Then, we have
limB→∞
1
B
B∑j=1
f(uj , vj)a.s.−−→ 1
|E|∑
∀(u,v)∈E
f(u, v),
for any function f with∑
∀(u,v)∈E f(u, v) <∞. �
7.1. Proof of Theorem 3.1We use induction to prove G(k) is connected.
Initial Step. Since G is connected, clearly there exists a path (edge sequence) between any twodisconnected edges. Therefore G(2) is connected. Inductive Step. Our inductive assumption is thatG(k) is connected, 2 ≤ k ≤ |V | − 2. We now prove that G(k+1) is also connected. For any twodifferent CISes x(k+1) and y(k+1) in C(k+1), from Lemma 7.1 we can easily show that there exists ak-node CIS x(k) contained by x(k+1), and a k-node CIS y(k) contained by y(k+1). When x(k+1) andy(k+1) are not connected, our inductive assumption shows that there exists a k-node CIS sequences(k)i (1 ≤ i ≤ l) in graph G(k), where s
(k)1 connects to x(k), s(k)l connects to y(k), and two adjacent
k-node CIS s(k)i and s
(k)i+1 are connected, where 2 ≤ i < l. Denote by s
(k+1)1 the (k + 1)-node CIS
consisting of k+1 different nodes appearing in s(k)1 and x(k), s(k+1)
l+1 the (k+1)-node CIS consisting
of k + 1 different nodes appearing in s(k)l and y(k), and s
(k+1)i the (k + 1)-node CIS consisting of
k + 1 different nodes appearing in s(k)i and s
(k)i+1, where 2 ≤ i < l. In graph G(k+1), we can easily
find that s(k+1)1 connects to x(k+1), s(k+1)
l+1 connects to y(k+1), and two adjacent (k+1)-node CISes
s(k+1)i and s
(k+1)i+1 (1 ≤ i ≤ l) are connected. This shows that there exists a path between any two
disconnected nodes ((k + 1)-node CISes) in G(k+1). Therefore graph G(k+1) is connected.
7.2. Proof of Theorem 3.2Denote by v the node with degree larger than two. Lemma 7.1 indicates that there exists a k-nodetree t with root v which contains at least three neighbors of v, where 4 ≤ k ≤ |V |. We easily findthat t has at least three leaves. Since t is still connected after we remove any leaf, there exist at leastthree different (k − 1)-node CISes consisting of k − 1 nodes in t obtained by removing one leaf oft, and these CISes are connected to each other in graph G(k−1). Similarly there exist at least three(k−2)-node CISes consisting of k−2 nodes in t by excluding two leaves of t, which are connectedto each other in G(k−2). Therefore, each G(k) (2 ≤ k < |V |) is non-bipartite since it has at leastone odd length loop. When G has no node with degree larger than two, since G is connected andnon-bipartite, we can easily show that G is a |V |-node circle and |V | is odd. For each node v ∈ V ,we can generate a k-node CIS consisting of v and k − 1 nodes close to v in clockwise direction,where 2 ≤ k < |V |. Finally there are |V | different k-node CISes, and they form an odd length loopin graph G(k). Therefore G(k) is non-bipartite.
7.3. Proof of Theorem 3.4SRW can be viewed as a regular RW over graph G(k), 2 ≤ k < |V |. For each ω
(k)i , 1 ≤ i ≤ Tk, we
then obtain following equations from Lemma 7.2 and Theorem 3.3 for non-bipartite and connected
ACM Transactions on Knowledge Discovery from Data, Vol. V, No. N, Article A, Publication date: January YYYY.

A:24 P. Wang et al.
G(k),
limB→∞
1
B
B∑j=1
1(C(sj) = C(k)i )
d(k)(sj)
a.s.−−→ 1
|C(k)|∑
∀s∈C(k)
1(C(s) = C(k)i )
d(k)(s)π(k)(s)
=1
|C(k)|∑
t∈C(k) d(k)(t)
∑∀s∈C(k)
1(C(s) = C(k)i )
=ω(k)i∑
t∈C(k) d(k)(t).
Similarly, we have
limB→∞
1
B
B∑j=1
1
d(k)(sj)
a.s.−−→ 1∑t∈C(k) d(k)(t)
.
Thus, we can easily find that ω(k)i (1 ≤ i ≤ Tk) is an asymptotically unbiased estimator of ω(k)
i .
7.4. Proof of Theorem 3.5To estimate ω
(k)i , 1 ≤ i ≤ Tk, 2 ≤ k < |V |, PSRW can be viewed as a regular RW over the
graph G(k−1). Denote s∗(u,v) as the k-node CIS generated by (u, v) ∈ R(k−1), an edge in G(k−1),
where u, v ∈ C(k−1) are (k − 1)-node CISes. For each ω(k)i , 1 ≤ i ≤ Tk, we then obtain following
equations from Lemma 7.3,
limB→∞
1
B − 1
B−1∑j=1
1(C(s∗j ) = C(k)i )
I(k−1)(s∗j )(I(k−1)(s∗j )− 1
)a.s.−−→ 1
|R(k−1)|∑
∀(u,v)∈R(k−1)
1(C(s∗(u,v)) = C(k)i )
I(k−1)(s∗(u,v))(I(k−1)(s∗(u,v))− 1
)=
1
2|R(k−1)|∑
∀s∈C(k)
1(C(s) = C(k)i )
=ω(k)i |C(k)|2|R(k−1)|
.
The last equation holds because the k-node CIS s is generated by (I(k−1)(s))(I(k−1)(s)−1)2 edges in
R(k−1). Similarly, we have
limB→∞
∑B−1j=1
1
I(k−1)(s∗j )(I(k−1)(s∗j )−1)
B − 1
a.s.−−→ |C(k)|2|R(k−1)|
.
Thus, we can easily find that ω(k)i (1 ≤ i ≤ Tk) is an asymptotically unbiased estimator of ω(k)
i .
ACM Transactions on Knowledge Discovery from Data, Vol. V, No. N, Article A, Publication date: January YYYY.
Efficiently Estimating Motif Statistics of Large Networks A:25
7.5. Proof of Theorem 3.6For each ω
(k−1)i , 1 ≤ i ≤ Tk−1, we obtain following equations from Lemma 7.2 and Theorem 3.3
for non-bipartite and connected G(k),
limB→∞
1
B
B∑j=1
1
d(k)(sj)
∑s′∈C(k−1)(sj)
1(C(k−1)(s′) = C(k−1)i )
|O(k)(s′)|
a.s.−−→ 1
|C(k)|∑
∀s∈C(k)
π(k)(s)
d(k)(s)
∑s′∈C(k−1)(s)
1(C(k−1)(s′) = C(k−1)i )
|O(k)(s′)|
=1
|C(k)|∑
t∈C(k) d(k)(t)
∑∀s∈C(k)
∑s′∈C(k−1)(s)
1(C(k−1)(s′) = C(k−1)i )
|O(k)(s′)|
=1
|C(k)|∑
t∈C(k) d(k)(t)
∑∀s′∈C(k−1)
∑s∈O(k)(s′)
1(C(k−1)(s′) = C(k−1)i )
|O(k)(s′)|
=ω(k−1)i |C(k−1)|
|C(k)|∑
t∈C(k) d(k)(t).
Similarly, we have
limB→∞
∑Bj=1
1d(k)(sj)
∑s′∈C(k−1)(sj)
1|O(k)(s′)|
B
a.s.−−→ |C(k−1)||C(k)|
∑t∈C(k) d(k)(t)
.
Thus, we can easily find that ω(k−1)i (1 ≤ i ≤ Tk−1) is an asymptotically unbiased estimator of
ω(k−1)i .
ReferencesIstvan Albert and Reka Albert. 2004. Conserved network motifs allow protein–protein interaction prediction. Bioinformatics
4863, 13 (2004), 3346–3352.Mansurul A Bhuiyan, Mahmudur Rahman, Mahmuda Rahman, and Mohammad Al Hasan. 2012. GUISE: Uniform Sampling
of Graphlets for Large Graph Analysis. In Proceedings of IEEE ICDM 2012. 91–100.Jin Chen, Wynne Hsu, Mong-Li Lee, and See-Kiong Ng. 2006. NeMoFinder: dissecting genome-wide protein-protein inter-
actions with meso-scale network motifs. In Proceedings of ACM SIGKDD 2006. 106–115.James Cheng, Yiping Ke, Ada Wai-Chee Fu, Jeffrey Xu Yu, and Linhong Zhu. 2011. Finding maximal cliques in massive
networks. ACM Transactions on Database Systems 36, 4 (dec 2011), 21:1–21:34.Shumo Chu and James Cheng. 2012. Triangle listing in massive networks. ACM Transactions on Knowledge Discovery from
Data 6, 4, Article 17 (December 2012), 32 pages.Hyunwoo Chun, Yong yeol Ahn, Haewoon Kwak, Sue Moon, Young ho Eom, and Hawoong Jeong. 2008. Comparison
of Online Social Relations in Terms of Volume vs. Interaction: A Case Study of Cyworld. In Proceedings of ACMSIGCOMM Internet Measurement Conference 2008. 57–59.
Minas Gjoka, Maciej Kurant, Carter T Butts, and Athina Markopoulou. 2011. Practical recommendations on crawling onlinesocial networks. Selected Areas in Communications, IEEE Journal on 29, 9 (2011), 1872–1892.
Minas Gjoka, Emily Smith, and Carter T. Butts. 2013. Estimating Clique Composition and Size Distributions from SampledNetwork Data. ArXiv e-prints (Aug. 2013).
Stephen J. Hardiman and Liran Katzir. 2013. Estimating clustering coefficients and size of social networks via random walk.In Proceedings of the 22nd international conference on World Wide Web (WWW 2013). 539–550.
Mohammad Al Hasan and Mohammed J. Zaki. 2009. Output Space Sampling for Graph Patterns. In Proceedings of theVLDB Endowment 2009. 730–741.
Shalev Itzkovitz, Reuven Levitt, Nadav Kashtan, Ron Milo, Michael Itzkovitz, and Uri Alon. 2005. Coarse-Graining andSelf-Dissimilarity of Complex Networks. Physica Rev.E 71 (2005), 016127.
Galin L. Jones. 2004. On the Markov chain central limit theorem. Probability Surveys 1 (2004), 299–320.
ACM Transactions on Knowledge Discovery from Data, Vol. V, No. N, Article A, Publication date: January YYYY.

A:26 P. Wang et al.
Zahra Razaghi Moghadam Kashani, Hayedeh Ahrabian, Elahe Elahi, Abbas Nowzari-Dalini, Elnaz Saberi Ansari, SaharAsadi, Shahin Mohammadi, Falk Schreiber, and Ali Masoudi-Nejad. 2009. Kavosh: a new algorithm for finding networkmotifs. BMC Bioinformatics 10 (2009), 318.
Nadav Kashtan, Shalev Itzkovitz, Ron Milo, and Uri Alon. 2004. Efficient sampling algorithm for estimating subgraphconcentrations and detecting network motifs. Bioinformatics 20, 11 (2004), 1746–1758.
Liran Katzir, Edo Liberty, and Oren Somekh. 2011. Estimating Sizes of Social Networks via Biased Sampling. In Proceed-ings of WWW 2011. 597–606.
Jerome Kunegis, Andreas Lommatzsch, and Christian Bauckhage. 2009. The slashdot zoo: mining a social network withnegative edges. In Proceedings of WWW 2009. 741–750.
Haewoon Kwak, Changhyun Lee, Hosung Park, and Sue Moon. 2010. What is Twitter, a Social Network or a News Media?.In Proceedings of WWW 2010. 591–600.
Chul-Ho Lee, Xin Xu, and Do Young Eun. 2012. Beyond Random Walk and Metropolis-Hastings Samplers: Why You ShouldNot Backtrack for Unbiased Graph Sampling. In Proceedings of ACM SIGMETRICS/Performance 2012. 319–330.
Jure Leskovec, Kevin J. Lang, Anirban Dasgupta, and Michael W. Mahoney. 2009. Community Structure in Large Networks:Natural Cluster Sizes and the Absence of Large Well-Defined Clusters. Internet Mathematics 6, 1 (2009), 29–123.
L. Lovasz. 1993. Random walks on graphs: a survey. Combinatorics 2 (1993), 1–46. Issue Paul Erdos is Eighty.Brendan D. McKay. 1981. Practical Graph Isomorphism. Congressus Numerantium 30 (1981), 45–87.Brendan D. McKay. 2009. nauty User’s Guide, Version 2.4. Technical Report. Department of Computer Science, Australian
National University.Sean Meyn and Richard L. Tweedie. 2009. Markov Chains and Stochastic Stability. Cambridge University Press.R. Milo, Et Al, and Cell Biology. 2002. Network motifs: Simple building blocks of complex networks. Science 298, 5549
(October 2002), 824–827.Alan Mislove, Massimiliano Marcon, Krishna P. Gummadi, Peter Druschel, and Bobby Bhattacharjee. 2007. Measurement
and Analysis of Online Social Networks. In Proceedings of ACM SIGCOMM Internet Measurement Conference 2007.29–42.
Michael Molloy and Bruce Reed. 1995. A critical point for random graphs with a given degree sequence, Random Structures& Algorithms. Random Structures and Algorithms 6, 2-3 (1995), 161–179.
Saeed Omidi, Falk Schreiber, and Ali Masoudi-nejad. 2009. MODA: An efficient algorithm for network motif discovery inbiological networks. Genes and Genet systems 84, 5 (2009), 385–395.
Bruno Ribeiro and Don Towsley. 2010. Estimating and Sampling Graphs with Multidimensional Random Walks. In Pro-ceedings of ACM SIGCOMM Internet Measurement Conference 2010. 390–403.
Bruno Ribeiro, Pinghui Wang, Fabricio Murai, and Don Towsley. 2012. Sampling Directed Graphs with Random Walks. InProceedings of IEEE INFOCOM 2012. 1692–1700.
Bruno F. Ribeiro and Don Towsley. 2012. On the estimation accuracy of degree distributions from graph sampling. In CDC.5240–5247.
Matthew Richardson, Rakesh Agrawal, and Pedro Domingos. 2003. Trust Management for the Semantic Web. In Proceedingsof the 2nd International Semantic Web Conference. 351–368.
Gareth O. Roberts and Jeffrey S. Rosenthal. 2004. General state space Markov chains and MCMC algorithms. ProbabilitySurveys 1 (2004), 20–71.
Shai S. Shen-Orr, Ron Milo, Shmoolik Mangan, and Uri Alon. 2002. Network motifs in the transcriptional regulation networkof Escherichia coli. Nature Genetics 31, 1 (May 2002), 64–68.
Lubos Takac and Michal Zabovsky. 2012. Data Analysis in Public Social Networks.. In International Scientific Conferenceand International Workshop Present Day Trends of Innovations. 1–6.
Johan Ugander, Lars Backstrom, and Jon Kleinberg. 2013. Subgraph frequencies: mapping the empirical and extremal ge-ography of large graph collections. In Proceedings of the 22nd international conference on World Wide Web (WWW2013). 1307–1318.
Sebastian Wernicke. 2006. Efficient Detection of Network Motifs. IEEE/ACM Transactions on Computational Biology andBioinformatics 3, 4 (2006), 347–359.
Junzhou Zhao, John C. S. Lui, Don Towsley, Xiaohong Guan, and Yadong Zhou. 2011. Empirical Analysis of the Evolutionof Follower Network: A Case Study on Douban. In Proceedings of IEEE INFOCOM NetSciCom 2011. 941–946.
ACM Transactions on Knowledge Discovery from Data, Vol. V, No. N, Article A, Publication date: January YYYY.