Embed Size (px)
Citation preview

« Economics of Risk andUncertainty »
Nicolas TREICHLERNA, Toulouse School of Economics
www.toulouse.inra.fr/lerna/treich/indextreichd.htm

Objectives
- Introduce main concepts of risk theory (riskaversion..)- Manipulate basic techniques (comparative statics..)- Focus on economic principles andintuitions (rather than on, e.g., axiomatics) - Theory-oriented but empirical (andexperimental) aspects won’t be ignored- Will present behavioral models

Organization- 1:30 hour-class on Mondays at 18:30 and Tuesdays at 17:00- Last-year class slides may be downloaded on mywebpage- This year slides will be marginally and progressivelyupdated- Some exercises during the class ; questions welcome!- M2 Environment + option for M2 finance and Deeqastudents: compromise in the difficulty (class / exam) and in the selection of applied topics- Advise for M2 students: please catch up at thebeginning, early parts of the class most difficult ones- Work out with using the references (books, papers)- Written exam in march, oral in september

Some Excellent Books1. * Mas-Colell et al., 1995, Microeconomic Theory, Oxford UP,
Chapter 62. * Kreps, 1988, Notes on the Theory of Choice.3. ** Gollier, 2001, The Economics of Risk and Time, MIT Press4. ** Hirshleifer and Riley, 1994, The Analytics of Uncertainty
and Information, Cambridge UP 5. *** Kahneman, Slovic and Tversky, 1982, Judgment under
Uncertainty: Heuristics and Biases, Cambridge UP.6. *** Ingersoll, 1987, Theory of Financial Decision-Making, R &
F Editors7. *** Dixit and Pindyck, 1994, Investment under Uncertainty,
Princeton UP8. *** Viscusi, 1998, Rational Risk Policy, Princeton UP.
* Foundations (but difficult)** Most useful for this class*** Further explorations

Most Relevant ScientificJournals
• Top theory Journals: Econometrica, Reviewof Economic Studies, American EconomicReview, Journal of Economic Theory..
• Top field Journal: Journal of Risk andUncertainty, Journal of Finance, JEEM, Journal of Public Economics
• Other Approaches: Management Science, Risk Analysis, Journal of Legal Studies

Outline1. Introduction (#1h30)2. Basics on Expected Utility (#4h30)3. The Standard Portfolio Model (#3h)4. Consumption and Risk (#3h)5. Physical Risks (#3h)6. Option Values (#3h)7. Experimental Evidence (#3h)8. Uncertainty and Ambiguity (#3h)9. Behavioral Economics (#3h)

2. Basics on Expected Utility (EU)Outline- The EU paradigm- Risk-aversion- Certainty equivalent, risk premium- Comparative risk-aversion- Some utility functions- Stochastic dominance- Index of Riskiness- Diversification

3. The Standard Portfolio Model
Outline- The model and its basic properties- Impact of risk aversion- The equity premium puzzle- Insurance- Uncertain Pollution

4. Consumption and RiskOutline
- A simple two-period model- The notion of « prudence »- How large are precautionary savings?- Savings and portfolio choices- Recursive preferences
5. Physical RisksOutline- State-dependent utility- A prevention model- WTP/ WTA- The value-of-statistical-life- Human capital- Life insurance

6. Option ValuesOutline- The concept of information- Information value- The « irreversibility effect »- The precautionary principle- Application to climate change

7. Experimental Evidence
Outline- Tests of expected utility- Probability triangle- Preference reversal- The debate about incentives- Are subjects risk-averse?- Field experiments

8. Uncertainty and Ambiguity
Outline- Risk perceptions- Probability elicitation, scoring rule- Mistakes, heuristics and biases- Hindsight bias, overconfidence- Bounded rationality- Ellsberg’s paradox- A theory of ambiguity

9. Behavioral Economics
Outline- Rank-dependent expected utility- Prospect theory, loss aversion- Regret and disappointment- Anxiety and optimal beliefs- Emotional decision-making- Reference-dependent preferences

1. Introduction
Why is the study of risk important?
Most (if not all) decisions involve the future, and so involve risk:- Private decisions (education, occupation, health, savings, financial investments..)- Public decisions (fluctuations reduction, resources management, energy, global risks..)

Why is the Study of RiskImportant? (cont’d)
Huge risk-management sectors: insuranceand finance
Strengthen your education in theory
Risk theory models and concepts are instrumental for the economics of information

Introduction (cont’d)Does risk matter macroeconomically?Yes,- The management of risk is what best explainseconomic development (Bernstein, 1998)- Environmental risks (e.g., climate change, damages estimates may reach 5% to 20% of GDP, Stern, 2007)
But,- Macroeconomic risk rather small (Lucas, 1987):
standard deviation of the growth rate only about 3%- Governments can pool risks and are ‘risk-neutral’- Technically: Risk is a second-order effect

What is Risk?- Many definitions- Here: a risk will be a random variable; say(loosely) a probability distribution over outcomes
Distinction risk vs. uncertaintyKnown vs. unknown probability distribution overoutcomes
Two classical approaches to uncertainty:- Bayesian updating, starting from one prior, therewill be different (posterior) probability distributions- Ambiguity: multi-prior probability distributions
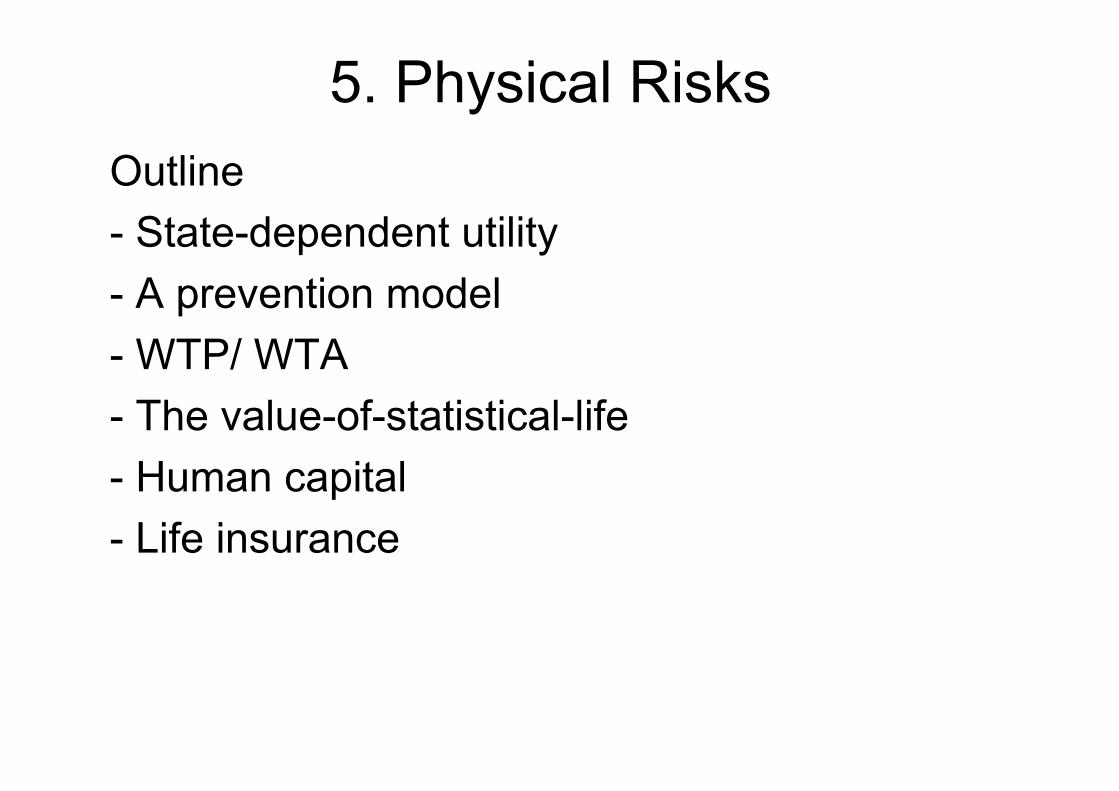
A brief history of someinfluential works on risk
- 1654: Pascal, Fermat: ‘discovery’ of the theory of probabilities- 1703: Jacob Bernouilli’s law of large numbers- 1730: De Moine’s bell curve- 1738: Dan Bernouilli’s decreasing marginal utility- 1750: Bayes’ law- 1875: Galton’s regression to the mean- 1921: Keynes’ and Knight’s books on uncertainty- 1944: von Neumann and Morgenstern’s seminal book- 1952: Markowitz’s portfolio approach- 1954: Savage’s foundations of statistics- 1964: Pratt’s coefficient of risk-aversion- 1979: Tversky and Kahneman’s prospect theory
Influential Research FieldNobel-awarded economists for theircontributions on risk-related issues:
- Allais (1988) - Markowitz, Miller and Sharpe (1990)- Merton and Sholes (1997)- Kahneman and Smith (2002)
Contributors: Samuelson (1970), Arrow (1972), Friedman (1976), Simon (1978), Tobin (1981), Modigliani (1985), Stiglitz (2001), Schelling (2005)…
Expected ValueWhy not taking the « expected value » afterall?
- Any other criterion, if used repeatedly will almost certainlyleave less well off at the end; but infinite repetition is rarely an option
- Would you bet $100 on the outcome of the flip of a coin? $100,000?
- People buy insurance (transform risk into its expected value and pay a premium for this)
- Risk premia on financial markets
- However, people gamble! (casino, PMU…)

Expected Value (cont’d)Why not taking the « expected value » after all?
- St Petersburg’s paradox (1713): A fair coin will be tossed until a head appears; if the first headappears on the nth toss, then the payoff is 2n ducats. Howmuch should one pay to play this game?
-The paradox is that expected value is infinite:
- Dan Bernouilli (1738)’s idea is twofold, i) utility depends on wealth u(w) and ii) diminishing marginal utility, e.g. u(w)=log(w):
1
(2 ) (1/2) 1 1 ....n n
n
∞
=
× = + + =∞∑
1
log(2 ) (1/2)n n
n
∞
=
× <∞∑

Another ArgumentWhy not taking the « expected value » after all?
- Multiplicative risks- Consider an investment offering a 50/50 chance of multiplying by 1.5 (a 50% return) or by 0.6 (a 40% loss) the amount invested- It has a positive expected value but, if repeated, will almost surely lead to ruin(because 0.6×1.5<1)

And the Variance?Why not adopting a « mean-variance » criterion?
Probably a good approximation in many cases (e.g., for fairly « small » risks)
A = (99.9%, -$1; 0.1%, $999), B = (99.9%, $1; 0.1%, -$999)Which one do you prefer?
Same mean, same variance. A is positively skewed, B negative skewed.Third moments (and others) may matter.The theory that will be presented may potentially account for preferences over any moments of the distribution

Risk Heuristics• Detection test of a disease (women’s breast
cancer)• Breast cancer prevalence at 40 years old: 1%• The test is imperfect:- 90% with a breast cancer are tested “positive”- 10% with no breast cancer are also tested
“positive”
• What is the probability that a person tested positive has actually the disease?

Base-Rate Fallacy
• Answer: about #8%
• Harvard Medical School students and staff: half people answer 90%
• Ignorance of the a priori distribution, misapplication of the Bayes’ law
• Framing effects=> “Irrationalities”, “Mistakes”...
Normative vs. Positive Approach
- Normative: How should people behave in face ofrisks? Which risk policies should the governmentimplement?
- Positive: How do people and governmentsactually behave in face of risks?
- The two approaches are different (e.g., due to « mistakes ») - Mostly concentrate on normative approach (basedon axioms of « rationality ») - Positive aspects won’t be ignored: seeexperimental evidence and behavioral economics

Important overlooked topics
- No strategic aspects (individual decision-making only)
- (Almost) nothing on markets, and thusnothing on risk-sharing, on asset pricing..
- (Almost) nothing on sophisticated financialproducts (derivatives..)

2. Basics on Expected Utility (EU)Outline- The EU paradigm- Risk-aversion- Certainty equivalent, risk premium- Comparative Risk-Aversion- Some utility functions- Stochastic dominance- Index of riskiness- Diversification

Choices and Consequences
Only consequences matter (the process doesnot count, framing irrelevant…)
Choices may affect consequences
Consequences will (most often) take the form ofa summary variable (eg, wealth)
LotteriesA (random variable or a) lottery X is described by avector : X= (p1,x1; p2,x2;….) with Si pi =1.
A compound lottery is a lottery whose outcomesare lotteries
Only probabilities and outcomes are relevant (no matterthey come from a simple or a compound lottery)
Remark: A lottery L can be exhaustively defined in termsof probabilities only

From Axioms to a Theory
• Which lotteries « should » individualsprefer?
• Introduce axioms, namely startingassumptions from which other statementsare logically derived
• The statements here will form a theory ofchoice: the expected utility theory
• It is the dominant decision theory of choicein risk sitations

Axioms of PreferencesLet R≥ denote a preference relation over lotteries
Axiom 1: CompletenessFor any pair of lotteries (La, Lb), either La R≥ Lb orLa R≤ Lb (or both)
Axiom 2: TransitivityLa R≥ Lb and Lb R≥ Lc implies La R≥ Lc
Axiom 3: ContinuityLet La R≥ Lb R≥ Lc, there exists a scalar αe[0,1] such thatαLa +(1- α)Lc R≥ Lb and αLa +(1- α)Lc R≤ Lb

Axioms of PreferencesAxiom 4: IndependenceFor all αe[0,1]:La R≥ Lb is equivalent to αLa+(1- α)Lc R≥ αLb+(1- α)Lc
- Remark: αLa+(1- α)Lc means having the lottery La
with probability α and Lc with probability 1- α- Hence the independence axiom means that the
preference ordering must be independent fromany lottery mixing
- No parallel in consumer theory under certainty

The Independence Axiom
The historical focus of the dispute around EU
Crucial for linearity in probabilities (and so crucialfor tractability!)
Normative appeal: Immune to « dutch books »Ex: Suppose La R≥ Lb and La R≥ Lc butLa R≤ 0.5 Lb + 0.5 Lc (contrary to the Ind. Axiom!)(More on this, see Green, QJE, 1987)

The vNM Utility FunctionTheorem: Suppose that the preference relation satisfies Axioms 1 to 4. Then it can berepresented by a preference functional that islinear in probabilities. That is, there exists a scalar us associated to each outcome xs suchthat La R≥ Lb if and only if:
a bs s s s
s s
p u p u≥∑ ∑

Remarks- Implication: Let two wealth distributions
Xa and Xb. By the Theorem, there exists a vNM utility u(.) such that Xa R≥ Xb iffEu(Xa) ≥ Eu(Xb)
- Ordering of lotteries is not affected by taking an increasing transformation of theexpected utility Eu (but may be affected by taking an increasing non lineartransformation of vNM utility u)
- Can be generalized to subjectiveprobabilities by Savage (1954)

Illustration
Consider a lottery X = (50%, $200; 50%,-$100)Do you accept it?
Evaluation of the lottery: There exists a vNMutility function u(.) such that:- u(w+X)=0.5u(w+200) + 0.5u(w-100) - which must be compared to u(w)
Remark: Theoretical foundation for the Bernouilli(1738)’s intuition of a utility function
Risk AversionDefinition: An agent is risk-averse (risk-lover) iff, for any level of initial wealth w, he never (always)prefers a random variable X to its mean EX
Jensen’s Inequality: For any random variable X,Ef(X)≤f(EX) iff f is concave.
⇒ An EU maximizer is risk-averse (risk-lover) iff hisvNM utility is concave (convex)
⇒ u linear « means » risk-neutrality

Risk PremiumDefinition (Pure risk) : A pure risk is a zero-mean
random variable
Definition (Risk Premium π) : Maximal amount ofmoney that an individual is willing to pay to escape a pure risku(w-π(u,X))= Eu(w+X) with EX=0
Certainty Equivalent C : Sure amount that makes theindividual indifferent between accepting a lottery or notw+C=u-1(Eu(w+Y)) or C=EY- π(u,Y)

Graph

Exercise 1: Lottery ComparisonsConsider 4 lotteries: X1 = (80%,4000; 20%,0), X2 = (100%,3200), X3 = (20%,4000; 80%, 0), X4 = (25%,3200; 75%,0).
i) Show that if an EU individual prefers X1 to X2 then he prefers X3 to X4.
ii) Show that any risk-averse EU individualprefers X2 to X1 (and so X4 to X3).

Exercise 2: InsuranceAn EU individual with initial wealth w may face a loss Lwith probability p. The loss L is random. An insurer proposes to fully cover this risk provided theindividual pays an insurance premium equal to(1+λ)pEL.
i) Show that if λ=0, any risk-averse individualpurchases insurance.
ii) Does this hold if initial wealth is random? (anddenoted W=w+X)

Exercise 2: Insurance (cont’d)An EU individual with initial wealth w may face a loss L with probability p. The loss L is random. An insurer proposes to fully cover this risk provided theindividual pays an insurance premium equal to(1+λ)pEL.
i) Show that if λ=0, any risk-averse individualpurchases insurance.
(1-p)u(w)+pEu(w-L) ≤(1-p)u(w)+pu(w-EL) ≤u(w-pEL)ii) Does this hold if initial wealth is random? (and
denoted W=w+X)No correlation, yes (hint: let v(w)=Eu(w+X) which is
concave). Correlation, less clear.

Ex 3: The Firm’s ProblemA firm is risk-neutral. After the firm learns the pricep, she chooses production q to maximize profit:
with c(q) convex. Show that the firm prefers a risk on prices.
( )pq c q−
Ex 3: The Firm’s ProblemA firm is risk-neutral. After the firm learns the pricep, she chooses production q to maximize profit:
with c(q) convex. Show that the firm prefers a risk on prices.
Let:
V(p) convex in p (=risk-loving)Even under risk-neutrality, the firm prefers a risk
on price!
( )pq c q−
( ) max ( )qV p pq c q= −
More Risk Aversion?
• A risk neutral individual: u linear• A risk averse individual: u concave• How to characterize a « more risk averse »
individual?
Risk-Aversion ‘in the Small’
• Eu(w+kX)=u(w- π[k]) with X a pure riskand u twice differentiable
• Compute the approximation of the riskpremium: π[k] ~ π[0] + kπ’[0] + 0.5k2 π’’[0]
• = 0.5k2π’’[0] = 0.5k2EX2(-u’’(w)/u’(w))

Risk-Aversion ‘in the Large’?• Yet we want a measure of the intensity of
risk-aversion for any risk (not only smallones).
• Does not exist!• But there is the following fundamental
theorem about comparative risk aversion

Pratt (1964, Etca)’s TheoremTheorem: The three following statements areequivalent. For all w and X,
i) -u’’(w)/u’(w) ≤ -v’’(w)/v’(w)ii) For all X, π[u,X] ≤ π[v,X] (larger risk premium)iii) There exists an increasing and concavetransformation function T such that v(w)=T(u(w))
An individual with a vNM v is said to be more risk-averse than u iff -u’’(.)/u’(.) ≤ -v’’(.)/v’(.)

Comparative Risk Aversion• -u’’/u’: often called the Arrow-Pratt coefficient of
risk-aversion• Comparison ceteris paribus, for all w and all X.• There exist other coefficients of curvature:- Jones-Lee (1980, EJ): u(.)’/(u*-u(.)) where u* is thesupremum of u(.) - Aumann and Kurz (1977, Etca): u(.)/u’(.)- Mathematics’ notion of curvature: -u’’(.)/(1+u’(.)2)3/2
• The Arrow-Pratt coefficient is economically andmathematically intuitive, and fairly tractable

Risk Tolerance and DARA
Definition: Risk Tolerance is the reciprocal ofrisk aversion, that is -u’/u’’
Definition: Relative Risk Aversion: -zu’’(z)/u’(z)
Definition: A utility function u(.) displays Decreasing(resp. Increasing) Absolute Risk Aversion – denotedDARA (resp. IARA) – iff -u’’(w)/u’(w) is decreasing(resp. increasing) in w
DARA more intuitive

Exercises• Exercise 4. Individual V is more risk-averse than
individual U, and both have the same initial wealth. Show that individual V rejects all lotteriesthat individual U rejects.
• Exercise 5. Show that DARA implies i) u’ convex, and ii) that u is less risk-averse than -u’
• Exercise 6.** Suppose at wealth w0 an individualis indifferent between accepting or rejecting a lottery. Show that, under strict DARA, the lotteryis accepted for all levels of wealth above w0. (hint: you may use Exercise 5)

Some Utility FunctionsLinear: wQuadratic: -(a-w)2; 0≤w≤aExponential: -Exp(-aw); a≥0 (or coined CARA)Logarithmic: Log(w)CRRA: (w)1-g/(1- g) with g≥0HARA: a(b+w/g)1-g with b+w/g≥0
• Exercise 7: Compute the Arrow-Pratt’scoefficient for these utility functions; Checkwhether DARA or not; check that HARA haslinear risk tolerance

Are Governments’ Risk Averse?
• No, governments should be « nearly » risk-neutral
• Standard argument: Governments can pool risks across the society (Arrow and Lind, 1970)
• Important implications for macroeconomicsand risk policy-making

Intuition for the Government’s Risk-Neutrality Argument
• Let an economy with n identical individuals, each with utility u(w)
• The government considers accepting a social risk Y, with EY>0 ; individuals will each takean equal share of social risk: V=Eu(w+Y/n)
• Second-order Taylor approximation of welfare: nV=nu(w)+EYu’(w)+(1/n)0.5EY2×u’’(w)
• Risk is a second order effect; moreover therisk term goes to 0 as n gets large
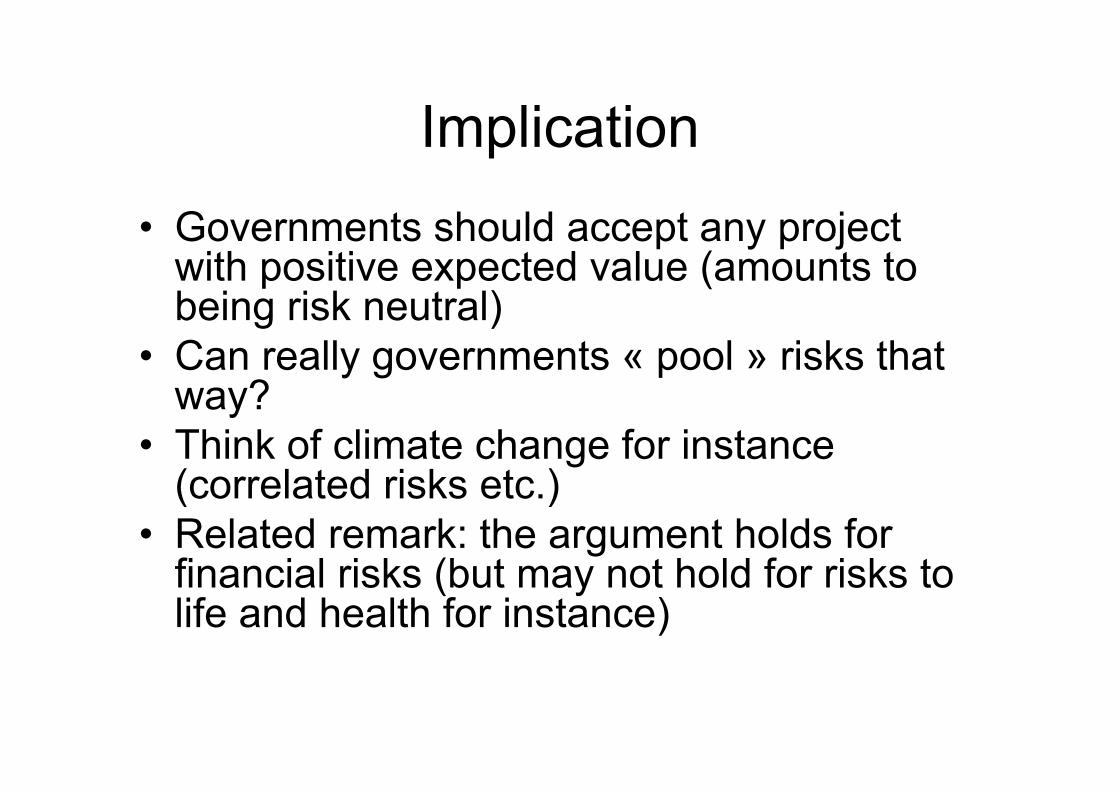
Implication• Governments should accept any project
with positive expected value (amounts to being risk neutral)
• Can really governments « pool » risks thatway?
• Think of climate change for instance (correlated risks etc.)
• Related remark: the argument holds for financial risks (but may not hold for risks to life and health for instance)

Risk-aversion vs. Risk
• Pratt’s theorem: keep the risk the same andcompare different individuals (different utility functions)
• Help define the meaning of « more risk-averse » (Arrow-Pratt coefficient)
• From now, let’s keep the individual thesame, but change the level of risk
• Will help define the meaning of « more risk »

« More Risk » - An ExampleWhich one of the two lotteries do you prefer?X1 = (25%,300; 25%, 100; 25%, 0; 25%, -200)X2 = (50%, 200; 50%,-100),
Show that any risk-averse EU maximizerprefers X2 to X1

« More Risk » - DifferentApproaches
• Plot the density functions: A less-desirablelottery can be obtained by moving « weight » outside the support (preserving the mean)
• Adding noise: A less-desirable lottery isobtained by adding (contingent) pure risks
• Plot the cumulative functions: A less-desirable lottery has more « weight » on theleft

Stochastic Dominance
Definition: Let F1 and F2 denote two cumulative distributions of X1 and X2 over support [a,b]. X2 dominates X1 in the sense of the second orderstochastic dominance (denoted X2 SSD X1) iff
Definition (more common): A SSD that preservesthe mean (D(b)=0) is called a « decrease in risk »
[ ]2 1D( ) ( ) ( ) 0 for all t
at F s F s ds t= − ≤∫
(Notice that: (Xi) ( ) )b
ia
E b F s ds= −∫

Decrease in RiskTheorem (Rothschild and Stiglitz, JET, 1970-71)The three following conditions are equivalent:
i) X2 is a « decrease in risk » of X1 (definition)ii) Eu(X2) ≥ Eu(X1) for all u concaveiii) X1 is obtained by adding (contingent) pure
risks to X2

Proof(See RS 1970, Ingersoll 1987, p 137)
Sketch of the proof:ii) equivalent to iii) : use Jensen’s inequalityii) equivalent to i) : start with ii) and make two
successive integrations by parts

And the Variance?• Is a decrease in risk equivalent to less
variance?
• A decrease in risk does imply less variance. Take u(.) quadratic in Eu(X2) ≥ Eu(X1)
• But less variance does not imply a decreasein risk. Example: Take A=(50%, 0.4;50%, 2.2) and B=(1/9, 0.25; 7/9, 1; 1/9, 4). ThenEA=EB and A has a lower variance, but for instance ElogA<0=ElogB. Neither A or B stochastically dominates the other.

Diversification - Exercises
• Exercise 8. Should two commanders-in-chief of theArmy take the same or a different plane?
(Assume the value of a commander-in-chief for the Army is L, that the Army isrisk-averse and that any plane may crash with probability p)
• Exercise 9**: Let Z1 and Z2 be two i.i.d. randomvariables distributed as Z. Show that X=d0.5(Z1+Z2) is a decrease in risk compared to Z. Extend to N random variables.

First-Order Stochastic DominanceTheorem: The three following conditions are
equivalent:
i) X2 FSD X1 (definition)ii) Eu(X2) ≥ Eu(X1) for all u increasingiii) F1(t) ≥ F2(t) for all t
Exercise 11: Proof(hint: similar to the proof of the Rothschild andStiglitz’s theorem? Just one integration by part)
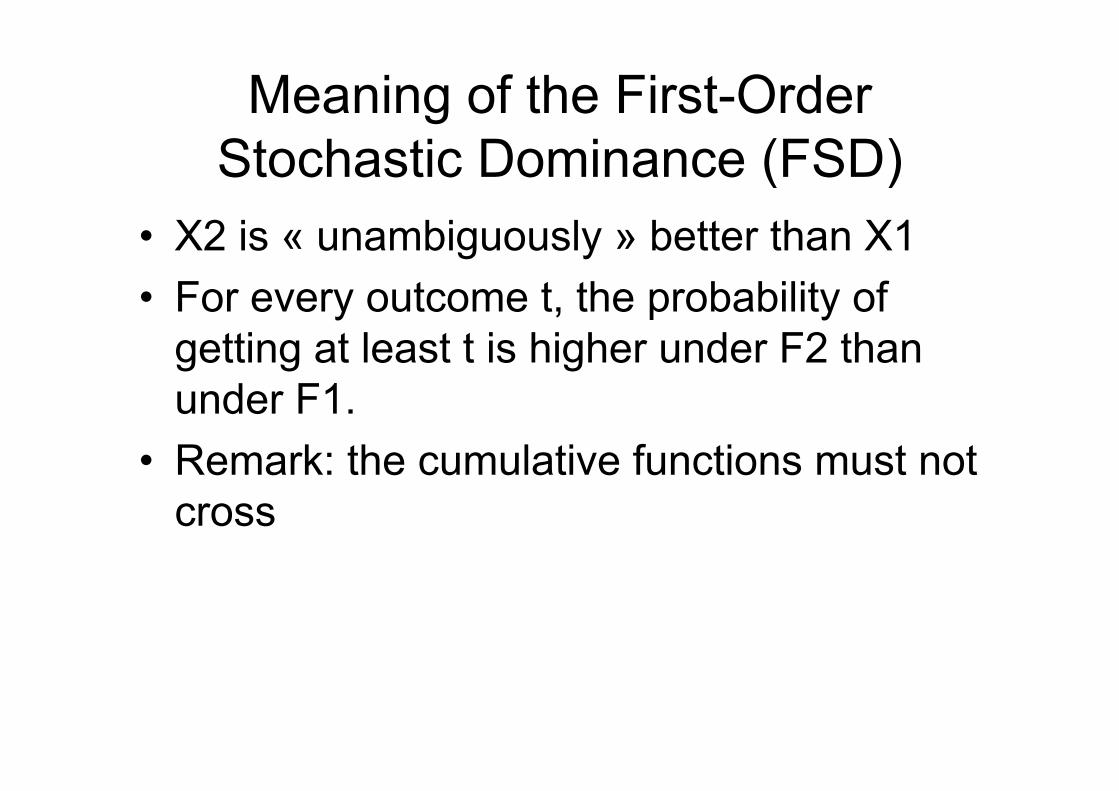
Meaning of the First-OrderStochastic Dominance (FSD)
• X2 is « unambiguously » better than X1 • For every outcome t, the probability of
getting at least t is higher under F2 thanunder F1.
• Remark: the cumulative functions must notcross

More on FSD/SSD
• Mas-Colell et al., 1995 – pages 194-99• Gollier, 2001 – pages 39-48• Hirshleifer and Riley, 1994 – pages 105-
119• Ingersoll, 1987 – pages 136-38

Main Limits of FSD/SSD
• Incomplete orderings (just a subset ofrandom variables can be ordered)
• Not able to characterize the level of « riskiness » of a single random variable
• Needs an index of risk, that would parallelthe Arrow-Pratt’s index of risk aversion
• A good index should both increase withmore dispersion (SSD), and a lowerlocation (FSD)

Some Possible Indexes• Variance – but does not depend on location • Entropy (∑kpkLog2pk) – only depends on
probabilities, does not depend on outcomes: absurd!
• (Inverse of the) Sharpe ratio (mean/standard deviation) – violates FSD
• Value at risk at x% (greatest possible lossignoring losses with proba less than x%) –arbitrary paramater x, ignores the gain side ofthe lottery, violates FSD

Index of Riskiness**
• Aumann and Serano (2007, workingpaper)
• Definition: The index of riskiness R(Z) ofa lottery Z is defined by:Eexp(-Z/R(Z))=1
• R(Z) is the reciprocal of the risk aversion index of a CARA agent who is indifferentbetween accepting the lottery or not

Some Properties of the Index**• Derived from axioms (Aumann and Serano, 2007)• The riskiness of the lottery depends on the lottery
only, and not (e.g.) on the wealth of utility functionof the decision-maker
• Increases with more dispersion (SSD), and a lowerlocation (FSD)
• R(nZ)=nR(Z) for all positive numbers n• If two lotteries have the same index of riskiness,
any compound lottery has this index as well, andthe sum of the lotteries also
• If Z has a normal distribution, thenR(Z)=0.5Var(Z)/EZ
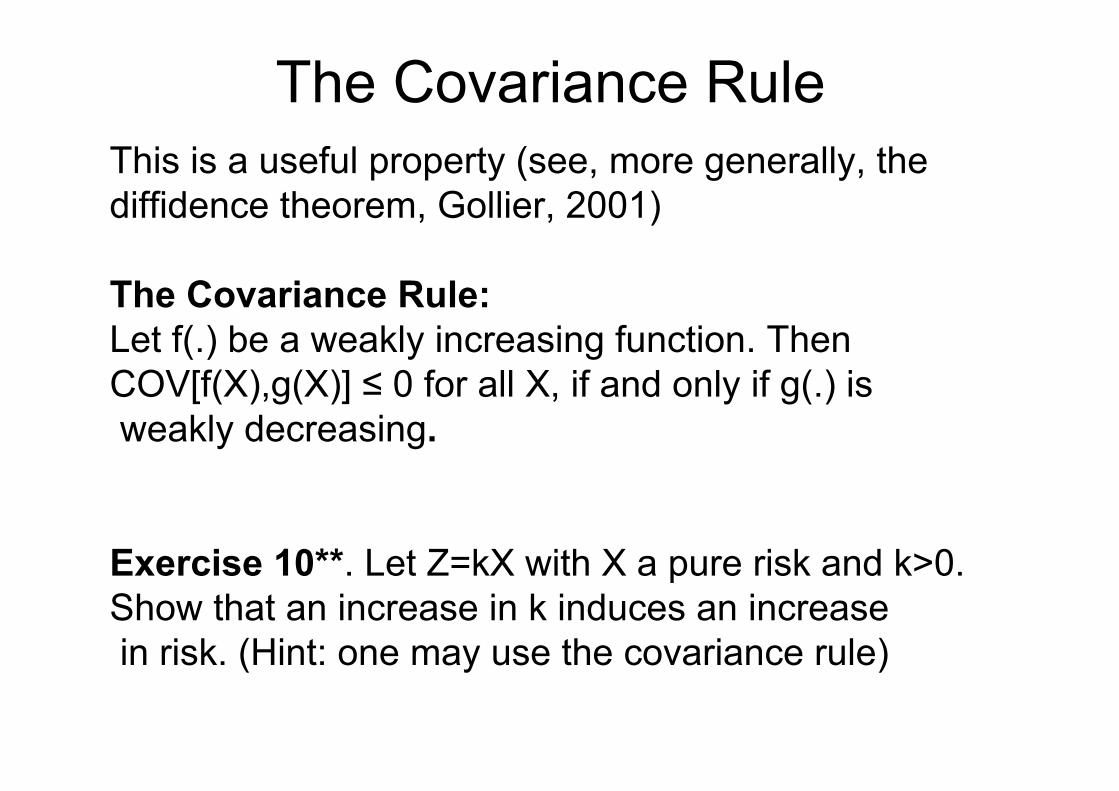
The Covariance RuleThis is a useful property (see, more generally, thediffidence theorem, Gollier, 2001)
The Covariance Rule:Let f(.) be a weakly increasing function. ThenCOV[f(X),g(X)] ≤ 0 for all X, if and only if g(.) isweakly decreasing.
Exercise 10**. Let Z=kX with X a pure risk and k>0. Show that an increase in k induces an increasein risk. (Hint: one may use the covariance rule)

Aversion to Downside Risk**Definition: An agent is averse to a downside
risk if and only if he always prefers that a pure risk is contingent to a good outcomerather than contingent to a bad outcome
Theorem (Menezes et al., 1980, AER): An EU individual is averse to a downside risk if andonly if his vNM utility u(.) is such that themarginal utility u’(.) is convex

Aversion to Downside Risk**Sketch of the proof
Let X a pure risk and a random initial wealth Wdistributed as (1/N,w1;1/N, w2;…; 1/N, wN)
Define Vi=EXu(wi+X)/N + EWu(W) – u(wi)/Nthat is, the EU if the individual faces a pure riskcontingent on wi
Write N(Vi-Vj) and integrate

3. The Standard Portfolio Model
Outline- The model and its basic properties- Impact of risk aversion- The equity premium puzzle- Insurance- Uncertain Pollution

Introductory Remark
The standard portfolio model is the paradigmaticmodel for analyzing risk-taking decisions
Idea: Examine the portion of the risk the decision-maker want to bear
Technically: The risk is multiplicative
This model is at the root of capital asset pricingmodels (CAPM), but variant versions includeinvestment, insurance or pollution emissions models(as we will see)

The Standard Portfolio Model
An agent maximises a strictly increasing, concave and thrice differentiable vNM utility function u. Initial wealth is w0
There exist only two assets: a riskless assetwith rate of return r, and a risky asset withrandom rate of return R
The agent can invest an amount a (with a≤w0) in the risky asset, and (w0-a) in the risklessasset

The Standard Portfolio Model
Eu((w0-a)(1+r)+a(1+R)) = Eu(w0(1+r)+a(R-r)),
that will be denoted Eu(w+aZ) where Z=R-r isthe « net » return of the risky asset
Objective: examine the optimal risk-takingdecision: a*
FOC: EZu’(w+a*Z)=0 SOC: EZ2u’’(w+aZ)<0 under strict concavity of u
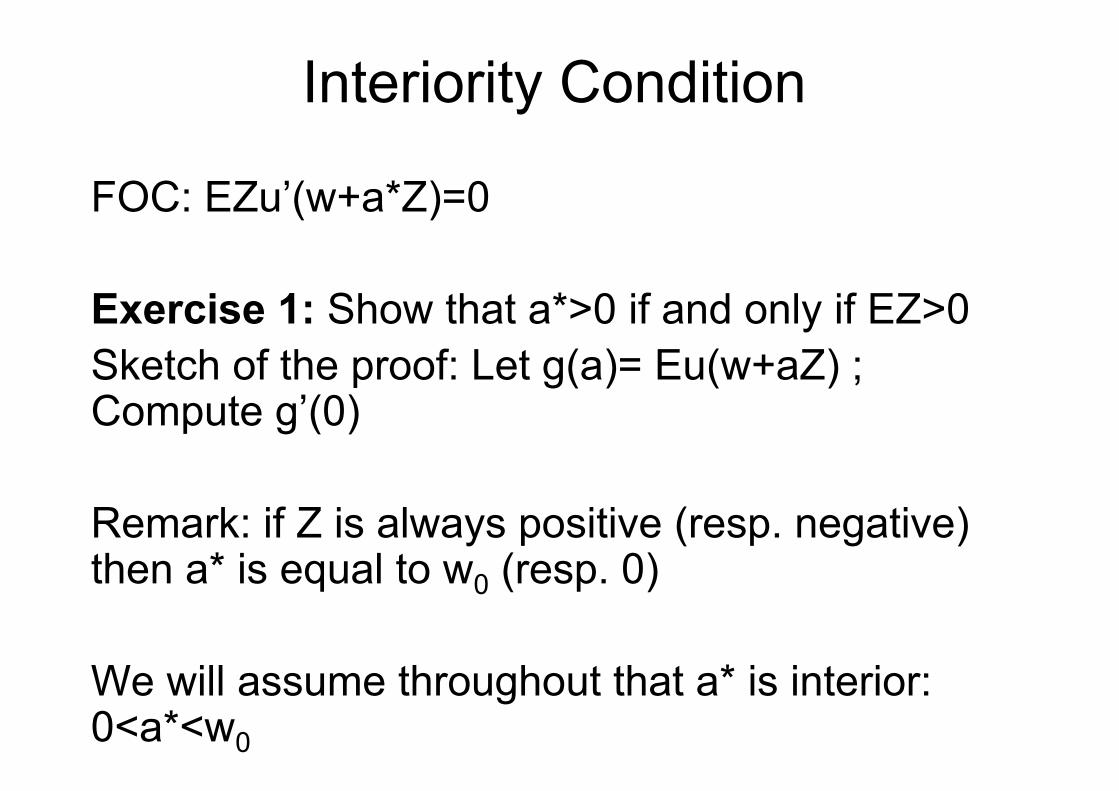
Interiority Condition
FOC: EZu’(w+a*Z)=0
Exercise 1: Show that a*>0 if and only if EZ>0Sketch of the proof: Let g(a)= Eu(w+aZ) ; Compute g’(0)
Remark: if Z is always positive (resp. negative) then a* is equal to w0 (resp. 0)
We will assume throughout that a* is interior: 0<a*<w0

Small Risk ‘Heuristics’
Let Z ‘small’ compared to w so that:Eu(w+aZ)#u(w)+a(EZ)u’(w)+0.5a2(EZ2)u’’(w)
Maximizing over a the last expression leads toa*=(EZ/EZ2)(-u’(w)/u’’(w))
Increase in EZ, decrease in Var(Z), increase in risk tolerance -u’(w)/u’’(w): intuitive effects
Exercise 2: Show that the above approximation is correct for u quadratic

Risk-aversion: Exercises
Exercise 3: Show that an increase in risk-aversion always leads to decrease a*
Exercise 4: Show that if the utility function isCRRA, a* is proportional to wealth w.
Exercise 5: Show that, under DARA, an increase in wealth w leads to increase a*

Change in Risk
• Unlike the effect of more risk aversion, the effectof more risk in the sense of RS is ambiguous
• That is, it is not true in general that an increase(resp. decrease) in risk of Z leads to decrease(resp. increase) a* for any risk-averse investor
• This is true, however, for some particular types ofdecrease in risk, for some probability distributions, and some utility functions (see, e.g., small risks, quadratic utility functions…)

Empirical Observations
• Most people do not have any risky asset in their portfolio, only about 20% do have (« stock participation puzzle »)
• Rich people invest relatively more than poorpeople in risky assets. The equity share is notconstant. See, e.g., Guiso et al. (AER, 1996)


The Equity Premium Puzzle
• Need « extremely » high risk aversion to explain the equity premium (g>40)
• Mehra and Prescott (JME, 1985) and a voluminous subsequent literature
• Explanations?

Time Diversification• Let X=(50%,$200; 50%,-$100) ; Would youaccept this bet? Would you accept N=100 betsin a row?
• Samuelson (1963, Scientia)’s Fallacy of thelaw of large numbers: if you refuse one suchbet at every wealth level, you must refuse N bets.
• Intuition?
Time Diversification (cont’d)• The variance (or the index of riskiness) increases with N
• Pratt and Zeckhauser’s (1987, Etca) ‘proper’utility functions: only requires the bet to berejected at current weath (not at every wealthlevel as in Samuelson).
• But ‘proper’ is a quite stringent condition on the utility function

Insurance
An agent faces the risk of losing L (random) if an accident occurs: Eu(w0-L)
Insurance contract: get αL if accident, pay an insurance premium P=(1+λ)αEL (where λ is an insurance loading factor, 0≤α≤1)
Eu(w0- L+ αL - (1+λ)αEL)= Eu(w0-(1+λ)EL+(1- α)((1+λ)EL-L))

Insurance
Eu(w0-(1+λ)EL+(1- α)((1+λ)EL-L))=Eu(w+aZ)where w=w0-(1+λ)EL, a= (1- α) and Z=(1+λ)EL-L
• The choice a corresponds to the risk retentionon the insurance market
• Observe that EZ= λEL

Insurance
• Theoretical Predictions:
• Using the standard portfolio model (seebefore), we get:
1) a*>0 iff EZ>0 α*<1 iff λ>0 (full insurancenot optimal)
2) DARA, a* increases with wealth w α* decreases with wealth w

Empirical Puzzles in Insurance
• Inconsistent with theory:
1) Full insurance policies are prevalent2) Insurance has often been found to be a normal good (increases with wealth)
• Explanations?

A Variant Version of the Model
Uncertain Pollution
Let:e: (monetary-equivalent) benefit of pollution emissionsd(e): damage function, d’(.)>0, d’’(.)>0Xd(e): total uncertain damage from pollution emissions, where X>0 is a random variable

Pollution Emissions
Thus the problem is : maxe Eu(w+e-Xd(e))Remark: Multiplicative Risk
FOC: E(1-Xd’(e))u’(w+e-Xd(e))=0
SOC: E(-Xd’’(e))u’(w+e-Xd(e))+E(1-Xd’(e))2u’’(w+e-Xd(e))<0
Assume interior solution
Pollution Emissions
Exercise 7: Let the problem maxeEu(w+e-Xd(e))
i) Characterize ē, the optimal emissions undercertainty (X replaced by its mean). Show that it isidentical to optimal emissions under risk neutrality
ii) Show that uncertainty (or risk-aversion) reduces emissions compared to ē

Firm’s Production
Exercise 8: Let the problem maxqEu(Pq-c(q)) with uncertain price P>0 and with c’’(q)>0
i) Characterize FOC, SOCii) Show that optimal production under certainty, and under risk-neutrality are identicaliii) Compare to arg maxqEu(Pq-c(q))iv) Show, more generally, that an increase in risk-aversion reduces production under priceuncertainty


![Lerna: Parallelizing Dependent Loops Using Speculation · 2018. 5. 16. · Parallelization using thread-level speculation (TLS) has been studied using hardware [13, 27, 33, 54] and](https://img.pdfslide.us/doc/110x75/60297293b6d78f55de414c8b/lerna-parallelizing-dependent-loops-using-speculation-2018-5-16-parallelization.jpg)