Embed Size (px)
Citation preview
HAL Id: hal-00889937https://hal.archives-ouvertes.fr/hal-00889937
Submitted on 1 Jan 2004
HAL is a multi-disciplinary open accessarchive for the deposit and dissemination of sci-entific research documents, whether they are pub-lished or not. The documents may come fromteaching and research institutions in France orabroad, or from public or private research centers.
L’archive ouverte pluridisciplinaire HAL, estdestinée au dépôt et à la diffusion de documentsscientifiques de niveau recherche, publiés ou non,émanant des établissements d’enseignement et derecherche français ou étrangers, des laboratoirespublics ou privés.
A dynamic model to analyse the bio-technical andsocio-economic interactions in dairy farming systems on
the Réunion IslandKamel Louhichi, Véronique Alary, Patrice Grimaud
To cite this version:Kamel Louhichi, Véronique Alary, Patrice Grimaud. A dynamic model to analyse the bio-technicaland socio-economic interactions in dairy farming systems on the Réunion Island. Animal Research,EDP Sciences, 2004, 53 (5), pp.363-382. �10.1051/animres:2004030�. �hal-00889937�
363Anim. Res. 53 (2004) 363–382© INRA, EDP Sciences, 2004DOI: 10.1051/animres:2004030
Original article
A dynamic model to analyse the bio-technical and socio-economic interactions in dairy farming
systems on the Réunion Island
Kamel LOUHICHIa*, Véronique ALARYb, Patrice GRIMAUDb
a Institut Agronomique Méditerranéen de Montpellier, 3191 route de Mende, BP 5056, 34093 Montpellier, France
b CIRAD-Emvt, Campus International de Baillarguet, TA 30/4, 34398 Montpellier, France
(Received 24 March 2003; accepted 16 June 2004)
Abstract – This paper presents a framework that permits an integrated analysis of a complex livestocksystem in which biophysical, technical, socio-economic and policy components intervene. The mainaims were to analyse the investment decisions and management strategy in the livestock system, andto simulate its future evolution under exogenous shocks (agricultural policies, technical opportunity).A multidisciplinary approach was used, based on a dynamic linear programming model that integratestechnical and socio-economic constraints, policy making, technology choice, opportunities andfarmer’s objectives. This approach postulates that farmers make their decisions according to knowl-edge of the relation between production factors, the amount of output obtained and the level of unitcosts of each production activity and future market prices. A technical matrix, containing a collectionof relevant technical coefficients that describe the production functions (input-output coefficients),was built on the basis of observations of local farming systems. These coefficients and the opportu-nities offered to each farm type to produce goods subject to constraints are expressed in linear equa-tions and are introduced in the model types. This modelling approach was used in the case of thedairy farming system on the Réunion Island. Applied to six dairy farm types, this approach showedthe correct representation of the observed behaviour by the model, and the extreme sensitiveness ofmost farming incomes to agricultural policies and especially to public support. These models arecurrently operational and may be used to accompany decision-makers, especially dairy cooperativeleaders, in their considerations on the management of farms.
interdisciplinary research / bio-technical and socio-economic interactions / dairy farmingsystem / Réunion Island / dynamic mathematical programming / farm type model
Résumé – Application d’un modèle dynamique à l’analyse des interactions bio-techniques etsocio-économiques dans les systèmes d’élevage laitiers à l’île de la Réunion. Ce papier proposeun cadre d’analyse des systèmes d’élevage laitiers où des composantes biophysiques, techniques,socio-économiques et politiques interviennent fortement dans le processus décisionnel. Lesprincipaux objectifs sont l’analyse des choix stratégiques et d’investissement dans ce système, et lasimulation de leurs évolutions suite à des chocs exogènes (réforme des politiques agricoles,changements techniques). Une approche multidisciplinaire associant des connaissances en sciences
* Corresponding author: [email protected]
364 K. Louhichi et al.
économiques, physiologiques, zootechniques et agronomiques, est utilisée. Cette approche est baséesur la construction de modèles de programmation linéaire dynamique qui intègrent les contraintesbio-économiques, les divers choix techniques, les variables politiques et les objectifs des producteurs.Le cas spécifique des systèmes d’élevage laitiers à l’île de la Réunion est exposé comme un terraind’application de cette approche. Appliquée à six exploitations-types, cette approche montre, d’unepart, la bonne représentation, par les modèles, des modes de comportements des producteurs et,d’autre part, l’extrême sensibilité de la plupart des exploitations à la réforme de la politique agricoleet spécialement aux systèmes d’aides et de prix. Ces modèles sont actuellement fonctionnels etpeuvent être utilisés par les décideurs, notamment ceux de la coopérative laitière, comme un outild’aide à la décision, pour les accompagner dans leurs réflexions sur la conduite future desexploitations agricoles.
recherche interdisciplinaire / interactions bio-techniques et socio-économiques / systèmed’élevage laitier / île de la Réunion / programmation mathématique dynamique / modèle del’exploitation type
1. INTRODUCTION
The Réunion Island is a small island inthe Indian Ocean. Its coastal area is domi-nated by sugarcane production, whereas thehillside central zone is used for cattle farm-ing and some crops, such as geraniums. Thedairy sector on the Réunion Island has expe-rienced a rapid growth during the nineteen-sixties, due to institutional and organisa-tional factors (cooperative implementationin 1962, dairy processing unit in 1972), thepolitical involvement with the regional hill-side development plan, and the social inter-est to develop milk supply and processing.
Currently, the cooperative includes approx-imately 150 dairy farms, which provide20 million litres of milk. Since the nineteen-nineties, the cooperative has been con-fronted with two main questions: (i) How toincrease milk production in a densely pop-ulated territory? (ii) What is the optimalfarm size and livestock management toincrease rural income while preserving nat-ural resources? While considerable progresshas been made in terms of animal perform-ance and sanitary conditions, institutionaland societal changes raise new questionssuch as: how can productivity be increased,ensuring the viability and future competi-tiveness of farms, while respecting the envi-ronment, under probably some agriculturalpolicy reforms and modifications in theprice structure?
The main purpose of this paper was todevelop a bio-economical model1 that rep-resents the complex interrelations betweenthe bio-technical and socio-economical com-ponents that characterise different dairyproduction systems in the Réunion Island.Our objective was first to identify and toexplain the determinants of these dairyfarming systems, and secondly, to antici-pate the evolution of these determinantsunder agricultural policy reforms and tech-nical changes. A modelling approach wasused that integrates technical and socio-eco-nomical constraints, policy making, technol-ogy and coefficient choice, opportunities andfarmer’s objectives.
2. MATERIALS AND METHODS
2.1. Choice of the modelling approach: Linear Mathematical Programming
Dairy farming, as well as other agricul-tural activities, is facing important changescoming from different sources that influ-ence farmers’ decisions, such as public pol-icy change or agro-climate variations. Incontrast to farming systems based only onannual crops or short cycle animal systems,
1 The bio-economic term used in this study doesnot mean linking of biophysical and economicalmodels [12], but rather an economical model thatintegrates bio-technical functions and constraints.
A bio-economic model to analyse the interactions in dairy farming systems 365
the functioning of dairy farming depends oncomplex interactions between past (e.g.,improvement of fodder systems, restockingdecisions) and present decisions whoseeffects are extended into the future. Antic-ipating these changes and evaluating themis critical and it is crucial to improve thedecision-making processes both at the farmand sector level and to consider the conse-quences of environmental and policy meas-urements. Nevertheless, anticipation andexploration require an integrated approachof the farming system, and involves collab-oration between distinct disciplines includ-ing economy, agronomy and animal science.The classical one-dimensional approachessuch as economic cost benefit or economet-ric analysis are less effective, due to themultiplicity and to the non-monetarisationof many parameters affecting decisions indairy farming systems.
In economic or agricultural economic sci-ences, several approaches have been devel-oped to analyse interactions in farmingsystems. Most of these are based on theknowledge of the production functions andon the representation of the available set oftechniques in a model. Production functionsrepresent the different possible combina-tions of production factors that can be usedto produce output. The interactions betweeninputs and outputs make their determinationdifficult in farming systems. In our study,we chose a linear mathematical program-ming (LMP) approach. LMP consists insolving problems of maximisation (or min-imisation) of a linear mathematical function(the objective function), subordinated to acertain number of constraints, which are alsolinear [4, 10]. The advantages of this approachare (i) its perfect correspondence with micr-oeconomic theory based on the principleconstrained optimisation; (ii) its simplicityand its ability for representing complex farm-ing systems, in contrast with econometricmodels which rest on the building of a pro-duction function. The LMP limitations are(i) its inability to reproduce exactly realityand to represent the strategy of the group incase of the Farm Type Methodology [13],
and (ii) the non-flexibility of its structure.Face to exogenous shocks, two assumptionscan occur: no change at all, or a very largechange in the farm’s production behaviourand strategy [13, 16, 17, 22]. To circumventsome of these limitations, two extensionsof linear programming have been devel-oped. The first extension is based on the useof “Positive Mathematical Programming”(PMP) and “Symmetric Positive Equilib-rium Problems” (SPEP), developed respec-tively by Howitt [18] and Paris and Howitt[23], in the aim to reproduce reality by the“dual” approach. A non-correspondencebetween model results and the current situ-ation means that both technical constraintsand cost (or yield) specification were nottaken into account, and so they had to beincluded in the objective function via a non-linear cost (or production) function [3, 6].The limits of these methods are the follow-ing: (i) the mixing of land, technical, agro-nomical, economical, and financial constraintsin the cost functions is very complicated and(ii) the choice of the functional form and theconstruction of this cost function, withlikely a quadratic specification, recall thesame problems as econometric modelling.
The second extension is based on theaddition of risk and uncertainty to the linearprogramming model [8]. This particularlyconcerns the risk for weather variability likethe yields per hectare and uncertainty for theeconomical environment such as good prices,and/or direct payments [9]. Several riskmethods within the LMP have been pro-posed including MOTAD, Target MOTAD,Esperance-Variance, and Safety first [1, 9,19]. This approach has been applied to dif-ferent livestock systems under various agro-ecological conditions and at different anal-ysis levels (i.e., farm, region, country) [2bis,5, 9, 11, 20].
In our study, we chose the second exten-sion in the aim to reproduce the farmer’sobserved behaviour (positive assumption)instead of advising them on the best way touse their resources (normative assumption).The quality of the technical, agronomical,
366 K. Louhichi et al.
and economic studies developed by animalscientists and grassland experts on theRéunion Island provides a wide range oftechnical coefficients and improves the cal-ibration of these models [2, 7, 14, 15, 26].The risk introduction in the model allowedcalibrating the model for each farm typeaccording to farmer risk aversion.
2.2. Model specification: assumption and structure
The model is based on dynamic linearmathematical programming, which incor-porates the risk and uncertainty in three mainparameters: yields, prices and direct pay-ments. The dynamic specification assumesa multiannual and recursive model, theresults of a year depending on those of theprevious year. Modelling the interrelationsbetween the different components of a farmsystem (i.e., livestock and cropping sys-tems, labour competition, management andsocio-economical strategy) is a novel aspect.
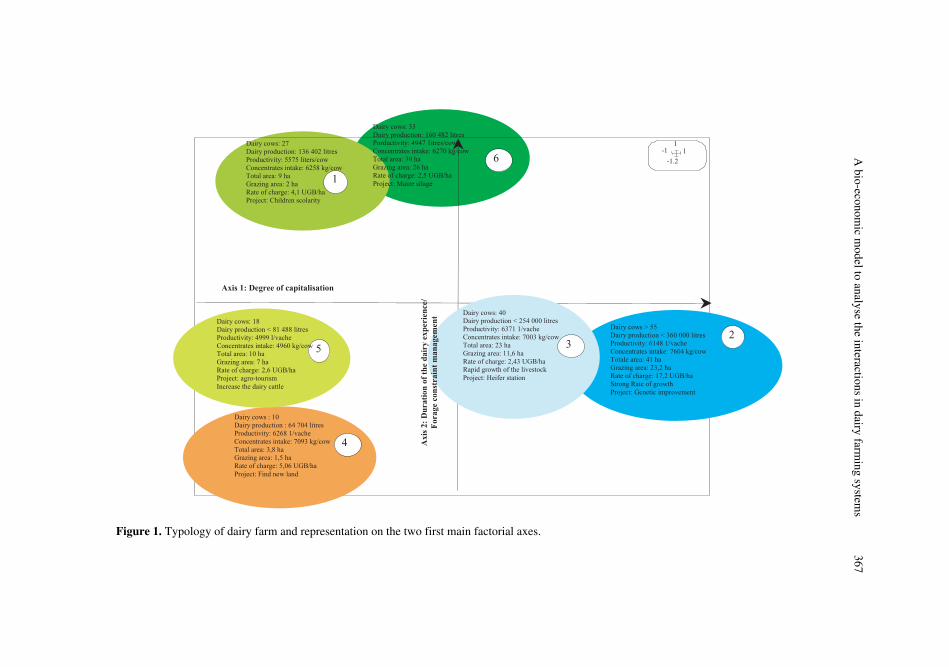
Applying this method requires to clas-sify the farms in homogeneous groups inorder to cover the diversity of dairy farmingsystems, and to build a model for each groupthus representing the diversity of the areastudied and to detect their adaptation behav-iour to external conditions. The main crite-ria chosen to classify the population werestructural (livestock, land, equipment), func-tional (feeding system, livestock manage-ment) and socio-economic (as the charac-teristics of the head of the farm, the familyimplication in the farm, the economic andfinancial ratios, the off farm activities). Aprevious analysis [2] revealed an importantstructuring of the dairy producers’ popula-tion. It resulted in a differentiation of dairyfarms into six farm types, according to aclassification along two axes (Fig. 1): thefirst axis distinguished the degree and therhythm of capitalisation (e.g., farm size)whereas the second axis made a differenti-ation according to the management of lim-iting resource.
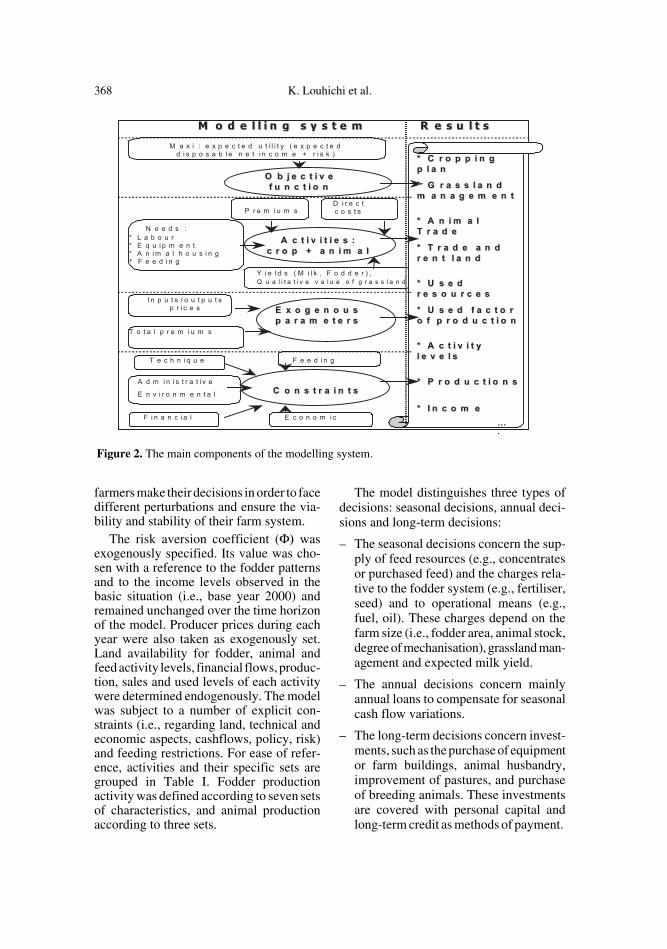
The main components of the model typeare detailed in Figure 2:
(i) the objectives of the farmer that willdefine the objective function;
(ii) the technical coefficient matrix includ-ing, for each activity, the relation betweenproduction factors (inputs) used andgoods obtained (outputs);
(iii) the financial, technical, economical,agronomical constraints;
(iv) the interrelations between the bio-tech-nical and socio-economical systems.
2.2.1. General structure of the model
The general structure of the model can beformally represented as:
Maximise: Utility = .
Subject to: AXye ≤ Bye; Bye = bXye-1;Xye ≥ 0.
Where “Utility” is the objective functionthat has to be maximised, Cye the vector ofexpected income from production activitiesin the year (ye), Xye the vector of activities’level, Φ risk aversion coefficient accordingto the Target MOTAD method, λye the sumof negative deviations related to the incomethreshold (fixed for each farm type), T theplanning horizon, τ the discount rate, A thematrix of technical coefficients, and Byethe vector of right-hand-side values [21].
The objective function supposes thatthe farmers make their decisions in orderto maximise an expected utility in whichexpected disposable net income (CyeXye)and risk (λye) are explanatory variables.The optimisation of this function was fixedin a sequence of five years (2000–2004),which represent the planning horizon forthe decision-making process, and which issimilar to the expected life span of dairycows. This function supposed that yield andprice can fluctuate in a random way, andthat farmers decide their farm managementin order to avoid a catastrophic situation.Risk-taking is formulated under Tauer’shypothesis [25] that fixes a threshold of via-bility and takes into account different atti-tudes concerning risk-taking. Therefore,
CyeXye φλt–
1 τ+( )ye-------------------------------
ye t0=
T∑
A bio-econom
ic model to analyse the interactions in dairy farm
ing systems
367
Figure 1. Typology of dairy farm and representation on the two first main factorial axes.
368 K. Louhichi et al.
farmers make their decisions in order to facedifferent perturbations and ensure the via-bility and stability of their farm system.
The risk aversion coefficient (Φ) wasexogenously specified. Its value was cho-sen with a reference to the fodder patternsand to the income levels observed in thebasic situation (i.e., base year 2000) andremained unchanged over the time horizonof the model. Producer prices during eachyear were also taken as exogenously set.Land availability for fodder, animal andfeed activity levels, financial flows, produc-tion, sales and used levels of each activitywere determined endogenously. The modelwas subject to a number of explicit con-straints (i.e., regarding land, technical andeconomic aspects, cashflows, policy, risk)and feeding restrictions. For ease of refer-ence, activities and their specific sets aregrouped in Table I. Fodder productionactivity was defined according to seven setsof characteristics, and animal productionaccording to three sets.
The model distinguishes three types ofdecisions: seasonal decisions, annual deci-sions and long-term decisions:
– The seasonal decisions concern the sup-ply of feed resources (e.g., concentratesor purchased feed) and the charges rela-tive to the fodder system (e.g., fertiliser,seed) and to operational means (e.g.,fuel, oil). These charges depend on thefarm size (i.e., fodder area, animal stock,degree of mechanisation), grassland man-agement and expected milk yield.
– The annual decisions concern mainlyannual loans to compensate for seasonalcash flow variations.
– The long-term decisions concern invest-ments, such as the purchase of equipmentor farm buildings, animal husbandry,improvement of pastures, and purchaseof breeding animals. These investmentsare covered with personal capital andlong-term credit as methods of payment.
Figure 2. The main components of the modelling system.
A bio-economic model to analyse the interactions in dairy farming systems 369
2.2.2. Writing the model equations2
To be efficient, the model must take intoaccount the particularities of dairy farmmanagement on the Réunion Island, andmust consider land management, animalperformance, and herd demography. Thesebiotechnical criteria have to be closelyrelated to socio-economic constraints or tothe decision process. This articulation focuseson the difficulty to analyse separately eachdifferent aspect of the whole farming sys-tem, and the interaction between biotechni-cal and socio-economic components mustbe included in the model. Therefore, themultiperiod model allows joining and ana-lysing the articulation of farmers’ decisionsat short, medium, and long term.
2.2.2.1. Land management and forage characteristics
The nature of the pastures on the islandvaries with altitude and agro-climatic con-
ditions [7, 14]. Temperate forages, such asray grass (Lolium perenne), grow at an alti-tude of more than 1000 m; although tropicalgrasses, such as chloris (Chloris gayana)and fodder sugarcane (Pennisetum pur-pureum), are dominant on the littoral. Onlyone tropical species, the kikuyu grass (Pen-nisetum clandestinum), covers a wide rangeof altitudes (from 800 to 1500 m asl). Accord-ing to available mechanisation, fodder spe-cies, and location of the pastures, ten pasturemanagement systems have been identified;forages can be either grazed or cut accord-ing to the farmers’ decisions and the type ofland improvement. The total land devotedto animal feeding also includes fallow landor rangeland.
Fodder quality during a season dependson the maturation of individual plant spe-cies, harvesting system and grassland loca-tion. Farmers practice between 1 and 3 cuts(up to 5 cuts for chloris), and maturation isestimated from the number of cuts duringthe season. Seasonal average data on foragequality (dry matter, energy and protein val-ues) were obtained for pasture monitoring[14]. The range of these values was esti-mated with grassland experts and research-ers in regard to the geographical situation ofthe grassland on the island.
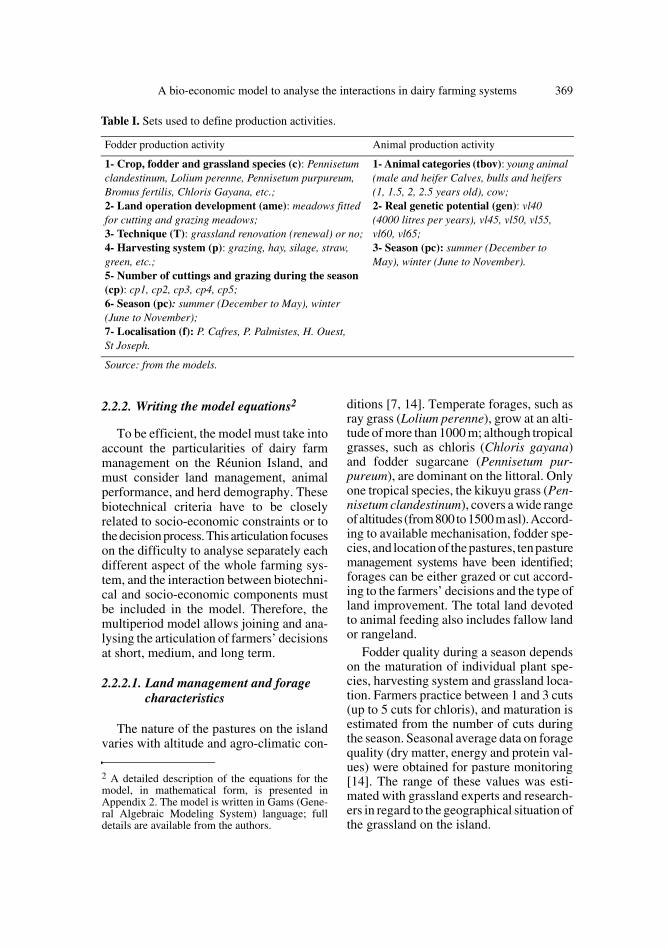
Table I. Sets used to define production activities.
Fodder production activity Animal production activity
1- Crop, fodder and grassland species (c): Pennisetum clandestinum, Lolium perenne, Pennisetum purpureum, Bromus fertilis, Chloris Gayana, etc.;2- Land operation development (ame): meadows fitted for cutting and grazing meadows;3- Technique (T): grassland renovation (renewal) or no;4- Harvesting system (p): grazing, hay, silage, straw, green, etc.;5- Number of cuttings and grazing during the season (cp): cp1, cp2, cp3, cp4, cp5;6- Season (pc): summer (December to May), winter (June to November);7- Localisation (f): P. Cafres, P. Palmistes, H. Ouest, St Joseph.
1- Animal categories (tbov): young animal (male and heifer Calves, bulls and heifers (1, 1.5, 2, 2.5 years old), cow; 2- Real genetic potential (gen): vl40 (4000 litres per years), vl45, vl50, vl55, vl60, vl65;3- Season (pc): summer (December to May), winter (June to November).
Source: from the models.
2 A detailed description of the equations for themodel, in mathematical form, is presented inAppendix 2. The model is written in Gams (Gene-ral Algebraic Modeling System) language; fulldetails are available from the authors.
370 K. Louhichi et al.
For each type of farm, the initial landendowment was specified. According to thepasture access, to the slope gradient andgravel density, the land was either describedas “easy” (and could be renewed every sea-son) or “difficult” (preventing mechanicalharvesting). Grassland management (i.e.,fertiliser, seeding practices, harvesting mode)depends on the number of forage cuttings orgrazing, the cost of inputs and mechanisa-tion, and the expected feedstock.
2.2.2.2. Animal feeding
The consumption of on-farm resourcesplus the purchased feed and commercialconcentrates must cover the nutritionalrequirements of the herd. The qualitativevalue of the production depends on deci-sions concerning the harvesting system,fodder species, stage of maturation duringthe season and land improvement at thebeginning of the season. Animal feeding onthe island must take into consideration theuse of sugarcane and its by-products (i.e.,sugarcane cabbage, sugarcane straw andbagasse).
Herd nutritional requirements for main-tenance were calculated from the averagedaily need per animal (defined by age andsex) and per day, plus 10% due to the harshconditions [15]. Nutritional requirementsfor milk production depend on the geneticpotential of the animals and milk produc-tivity expectations. Six types of dairy cattlewere assumed according to the averagedairy production per year (from 4000 to6500 litres per year per cow). Initially, eachfarmer was characterised by one level ofdairy production that reflected the breedimprovement and his feeding system. Thisdairy potential is determined thanks to thereproductive monitoring. During the hori-zon of planning, each farm type can decideto improve his dairy potential by investingin new dairy animals with a higher dairypotential. The nutritional requirementschange for each dairy animal characterisedby its dairy potential. In determining thenutritional supply and requirements, it wasassumed that: (i) sugarcane cabbage cannot
exceed 8% of dry matter intake; (ii) totalsugarcane by-product consumption at theregional level cannot exceed the productionon the mechanised sugarcane area in theisland; (iii) commercial concentrate intakecannot exceed 70% of dry matter diet;(iv) total crude cellulose of the diet mustexceed 18% of dry matter intake of the totaldiet; (v) molasses intake cannot exceed 1 kgper day per animal. Seasonal milk produc-tion was calculated according to the sea-sonal average milk yield of the herd, whichdepends on feeding practices and geneticimprovement.
2.2.2.3. Herd demography
Herd demography depends on fertilityparameters but also on the farmers’ deci-sions concerning animal stocking or destock-ing. It was assumed that heifers become pro-ductive at 24 months and the average regionalrate of fertility is about 0.83% [26]. Theculling rate reflects the farmer’s strategy interms of renewal and performance, and wasdetermined according to field observations[26].
2.2.2.4. Interaction between bio technical and socio-economic components
Feeding and livestock managementinvolves short-term decisions (e.g. dairyproductivity target and concentrate supple-mentation) as well as long-term decisions(e.g. equipment, buildings).
The farm cash depends on the expendi-ture for feed resources, charges relative tothe fodder system, and on operational means(e.g., fuel, oil). All of these are proportionalto the size of the farm and depend on thetechnical choices and the expected milkproduction. To cover current charges, farm-ers could use their own funds or ask for ashort-term loan. The only constraint in themodel was that the short-term credits couldnot exceed 20% of the seasonal sale of ani-mal and crop products (plus received publicsubsidies).
A bio-economic model to analyse the interactions in dairy farming systems 371
Investment decisions included farm build-ings, farm equipment, land transactions andpurchase of breeding stock. These invest-ments depended on the farmers’ projectsand subsidies (premium or support) expec-tations, which are directly related to the ani-mal population.
2.2.3. Calibration and validation of the model
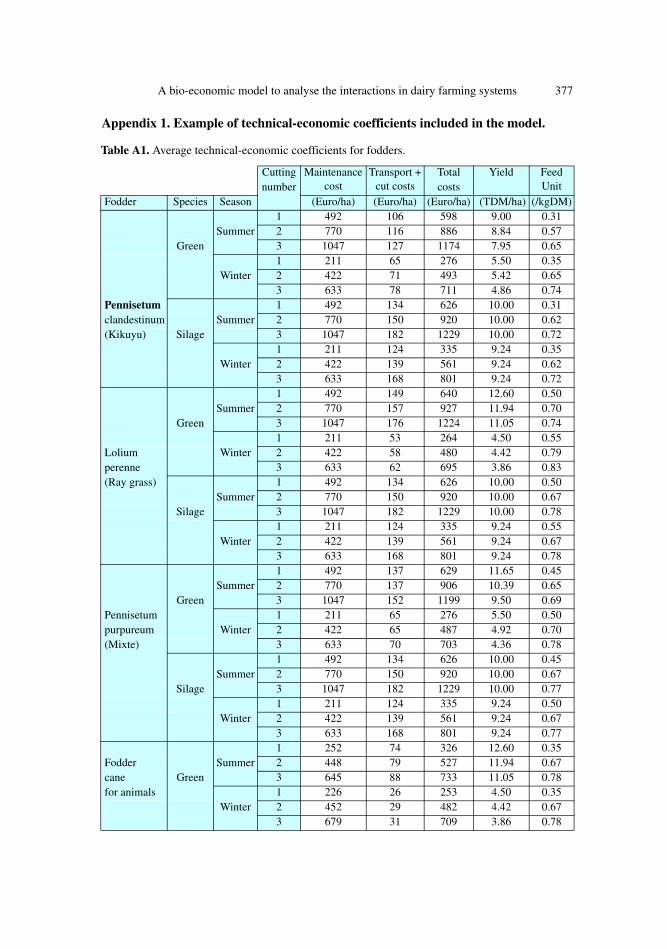
According to Hazell and Norton [16],calibration in modelling is based on thedetermination of real parameter settingsspecific to each farm type, and validationassumes that the model reflects the baseyear situation (i.e., to check that the modelreproduces the real activities and bio-eco-nomic conditions observed). The risk aver-sion coefficient (Φ) allows to differentiatebetween decisions in certain and in uncer-tain environments, and intervenes in thevalidation [24]. In our study, the parametersselected for calibration were defined fromthe observations of real practices and expertknowledge of the CIRAD-Pôle Élevage (cf.Appendix 1). Key variables for the valida-tion were identified with dairy cooperativeexperts and farmers to understand the gapsbetween the reality and the model and toadjust the coefficients. The year 2000 wasselected as a base year for this study.
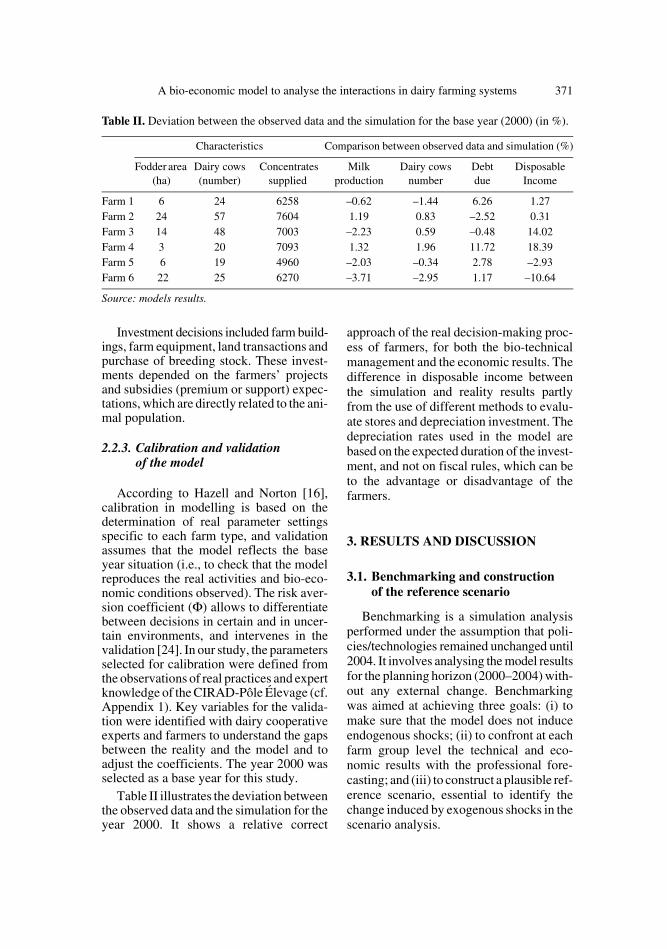
Table II illustrates the deviation betweenthe observed data and the simulation for theyear 2000. It shows a relative correct
approach of the real decision-making proc-ess of farmers, for both the bio-technicalmanagement and the economic results. Thedifference in disposable income betweenthe simulation and reality results partlyfrom the use of different methods to evalu-ate stores and depreciation investment. Thedepreciation rates used in the model arebased on the expected duration of the invest-ment, and not on fiscal rules, which can beto the advantage or disadvantage of thefarmers.
3. RESULTS AND DISCUSSION
3.1. Benchmarking and construction of the reference scenario
Benchmarking is a simulation analysisperformed under the assumption that poli-cies/technologies remained unchanged until2004. It involves analysing the model resultsfor the planning horizon (2000–2004) with-out any external change. Benchmarkingwas aimed at achieving three goals: (i) tomake sure that the model does not induceendogenous shocks; (ii) to confront at eachfarm group level the technical and eco-nomic results with the professional fore-casting; and (iii) to construct a plausible ref-erence scenario, essential to identify thechange induced by exogenous shocks in thescenario analysis.
Table II. Deviation between the observed data and the simulation for the base year (2000) (in %).
Characteristics Comparison between observed data and simulation (%)
Fodder area (ha)
Dairy cows(number)
Concentrates supplied
Milk production
Dairy cows number
Debtdue
Disposable Income
Farm 1 6 24 6258 –0.62 –1.44 6.26 1.27Farm 2 24 57 7604 1.19 0.83 –2.52 0.31Farm 3 14 48 7003 –2.23 0.59 –0.48 14.02Farm 4 3 20 7093 1.32 1.96 11.72 18.39Farm 5 6 19 4960 –2.03 –0.34 2.78 –2.93Farm 6 22 25 6270 –3.71 –2.95 1.17 –10.64
Source: models results.
372 K. Louhichi et al.
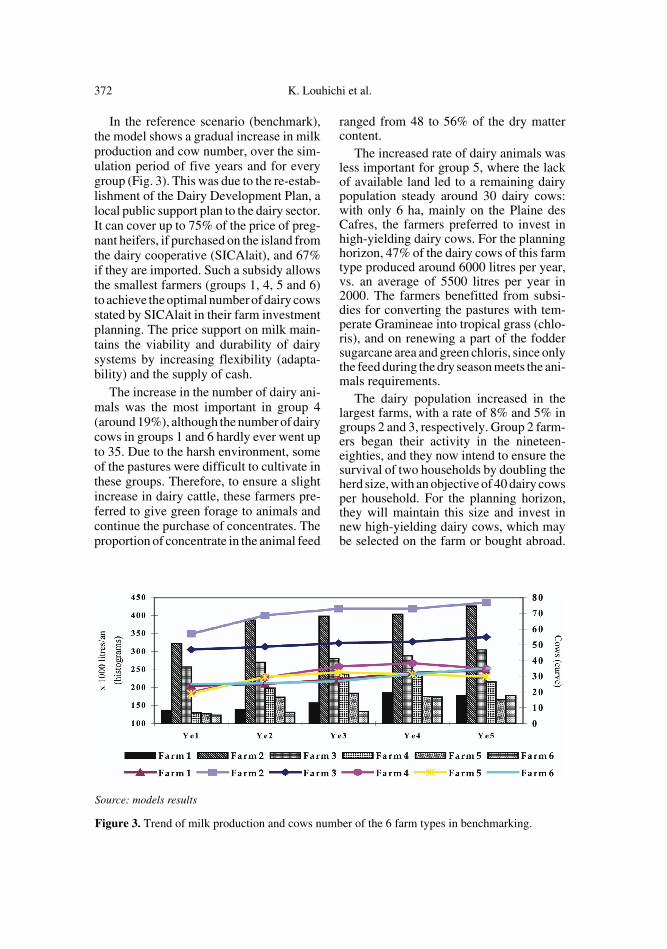
In the reference scenario (benchmark),the model shows a gradual increase in milkproduction and cow number, over the sim-ulation period of five years and for everygroup (Fig. 3). This was due to the re-estab-lishment of the Dairy Development Plan, alocal public support plan to the dairy sector.It can cover up to 75% of the price of preg-nant heifers, if purchased on the island fromthe dairy cooperative (SICAlait), and 67%if they are imported. Such a subsidy allowsthe smallest farmers (groups 1, 4, 5 and 6)to achieve the optimal number of dairy cowsstated by SICAlait in their farm investmentplanning. The price support on milk main-tains the viability and durability of dairysystems by increasing flexibility (adapta-bility) and the supply of cash.
The increase in the number of dairy ani-mals was the most important in group 4(around 19%), although the number of dairycows in groups 1 and 6 hardly ever went upto 35. Due to the harsh environment, someof the pastures were difficult to cultivate inthese groups. Therefore, to ensure a slightincrease in dairy cattle, these farmers pre-ferred to give green forage to animals andcontinue the purchase of concentrates. Theproportion of concentrate in the animal feed
ranged from 48 to 56% of the dry mattercontent.
The increased rate of dairy animals wasless important for group 5, where the lackof available land led to a remaining dairypopulation steady around 30 dairy cows:with only 6 ha, mainly on the Plaine desCafres, the farmers preferred to invest inhigh-yielding dairy cows. For the planninghorizon, 47% of the dairy cows of this farmtype produced around 6000 litres per year,vs. an average of 5500 litres per year in2000. The farmers benefitted from subsi-dies for converting the pastures with tem-perate Gramineae into tropical grass (chlo-ris), and on renewing a part of the foddersugarcane area and green chloris, since onlythe feed during the dry season meets the ani-mals requirements.
The dairy population increased in thelargest farms, with a rate of 8% and 5% ingroups 2 and 3, respectively. Group 2 farm-ers began their activity in the nineteen-eighties, and they now intend to ensure thesurvival of two households by doubling theherd size, with an objective of 40 dairy cowsper household. For the planning horizon,they will maintain this size and invest innew high-yielding dairy cows, which maybe selected on the farm or bought abroad.
Source: models results
Figure 3. Trend of milk production and cows number of the 6 farm types in benchmarking.
A bio-economic model to analyse the interactions in dairy farming systems 373
In contrast, group 3 was comprised of youngfarmers who benefitted from incentives tobuild up their dairy cattle herds. The rapidincrease in animal numbers entails long-term debts due to the important investmentsin buildings, machines, etc. Two phases ofanimal feed adjustment were noted for thisgroup: (i) the increase in concentrates andthe renewal of kikuyu pastures into temper-ate pastures during the first two years, and(ii) the increase of the silage part in the feedration from the third year onward.
These results indicate that some farmershave to change pasture management toensure that the nutritional requirements ofthe animals are met. Such an adaptation isnot linear, and requires progressive phasesof pasture renewal with adjustments basedon concentrate level in the diet. They alsoallowed recalling the behaviour and objec-tives observed for each farm type: it is notedas an example that apart from groups 1 and3, all groups wished to convert part of theirdairy herd into high-yielding dairy cows.Group 3 preferred to maintain and to stabi-lise its dairy productivity, and group 1 wasvery sensitive to maintaining its financialstability.
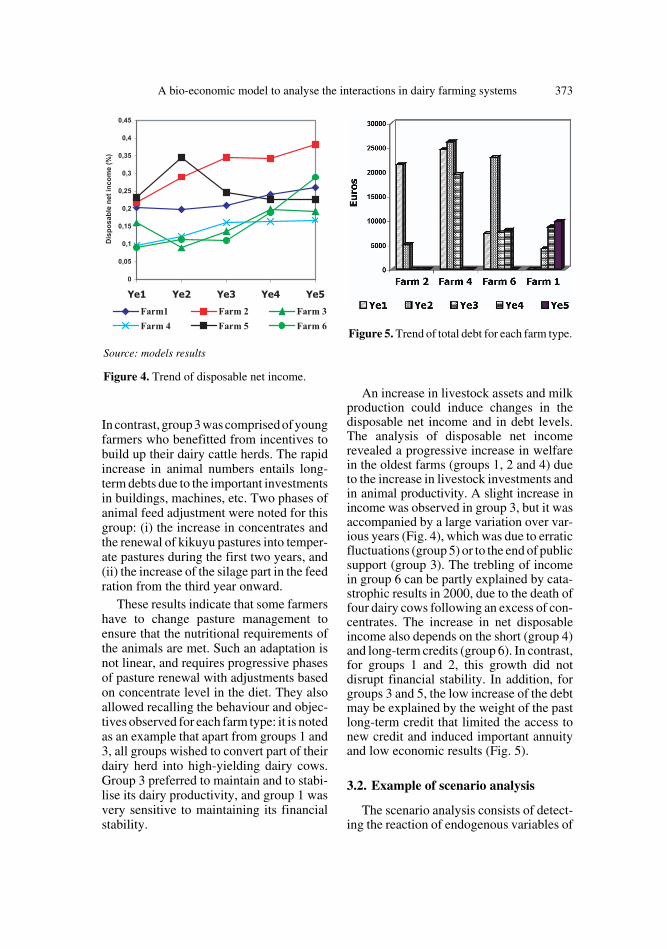
An increase in livestock assets and milkproduction could induce changes in thedisposable net income and in debt levels.The analysis of disposable net incomerevealed a progressive increase in welfarein the oldest farms (groups 1, 2 and 4) dueto the increase in livestock investments andin animal productivity. A slight increase inincome was observed in group 3, but it wasaccompanied by a large variation over var-ious years (Fig. 4), which was due to erraticfluctuations (group 5) or to the end of publicsupport (group 3). The trebling of incomein group 6 can be partly explained by cata-strophic results in 2000, due to the death offour dairy cows following an excess of con-centrates. The increase in net disposableincome also depends on the short (group 4)and long-term credits (group 6). In contrast,for groups 1 and 2, this growth did notdisrupt financial stability. In addition, forgroups 3 and 5, the low increase of the debtmay be explained by the weight of the pastlong-term credit that limited the access tonew credit and induced important annuityand low economic results (Fig. 5).
3.2. Example of scenario analysis
The scenario analysis consists of detect-ing the reaction of endogenous variables of
Source: models results
Figure 4. Trend of disposable net income.
Figure 5. Trend of total debt for each farm type.
374 K. Louhichi et al.
the model to the various changes in exoge-nous parameters, such as prices, policyinstruments, technologies. The aim of thisanalysis was to study the impact of differentassumptions, relating to these parameters,on the model outcome and behaviour. Theresults of each scenario analysis will becompared to those of the reference scenario,in order to isolate the economic effects ofthe exogenous change introduced in the sce-nario.
In our study, the two goals of the scenarioanalysis were to show the type of simulationthat can be done with the model, and to ana-lyse the extreme sensitivity of most farmingincomes to agricultural policies, with a par-ticular focus on local government support.According to the reference scenario results(benchmarking), the difference betweenfarms in structural and economic terms, aswell as in the financial and technical strat-egies, would lead to diverse reactions anddifferent adaptative behaviours under exog-enous shocks (agricultural policy, introduc-tion of innovation). The adaptation capacityof each group, especially to harsh condi-tions, seems to be very specific, althoughthe simulation was done on the basis of atotal specialisation in the dairy activity in all
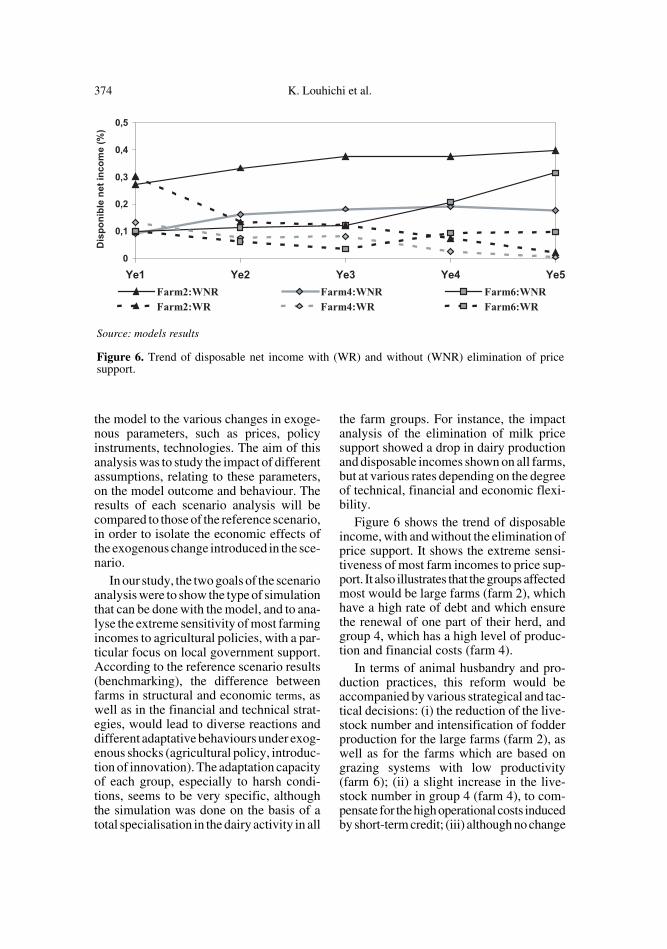
the farm groups. For instance, the impactanalysis of the elimination of milk pricesupport showed a drop in dairy productionand disposable incomes shown on all farms,but at various rates depending on the degreeof technical, financial and economic flexi-bility.
Figure 6 shows the trend of disposableincome, with and without the elimination ofprice support. It shows the extreme sensi-tiveness of most farm incomes to price sup-port. It also illustrates that the groups affectedmost would be large farms (farm 2), whichhave a high rate of debt and which ensurethe renewal of one part of their herd, andgroup 4, which has a high level of produc-tion and financial costs (farm 4).
In terms of animal husbandry and pro-duction practices, this reform would beaccompanied by various strategical and tac-tical decisions: (i) the reduction of the live-stock number and intensification of fodderproduction for the large farms (farm 2), aswell as for the farms which are based ongrazing systems with low productivity(farm 6); (ii) a slight increase in the live-stock number in group 4 (farm 4), to com-pensate for the high operational costs inducedby short-term credit; (iii) although no change
Source: models results
Figure 6. Trend of disposable net income with (WR) and without (WNR) elimination of pricesupport.
A bio-economic model to analyse the interactions in dairy farming systems 375
(the same trend) could occur in groups 1 and5, due to financial and economic stability.
Although these results show significanttendencies for the different dairy farmingsystems, they must be interpreted with cau-tion according to the assumptions retainedand to the choices made by the models.
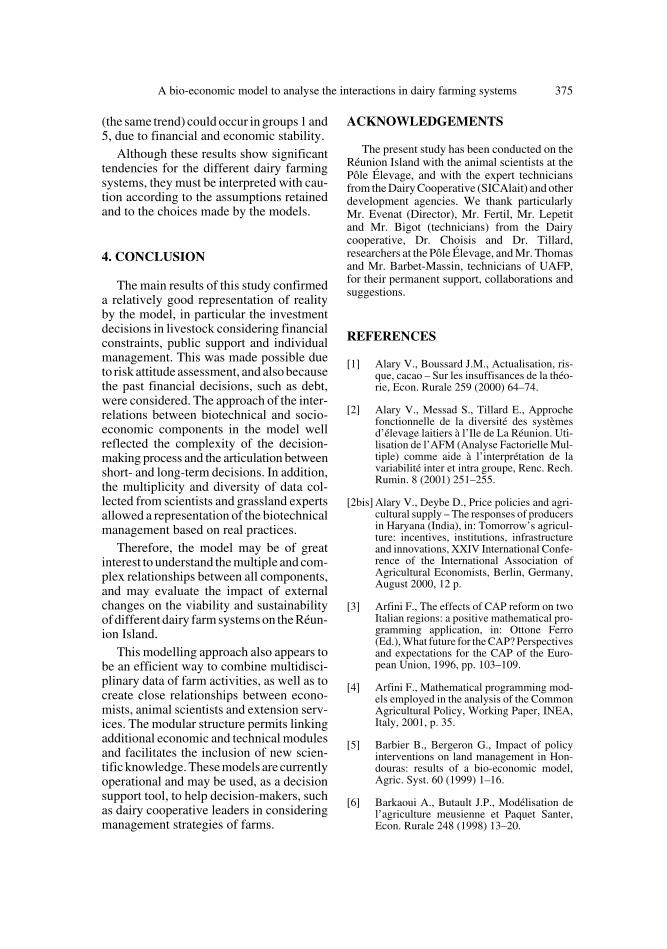
4. CONCLUSION
The main results of this study confirmeda relatively good representation of realityby the model, in particular the investmentdecisions in livestock considering financialconstraints, public support and individualmanagement. This was made possible dueto risk attitude assessment, and also becausethe past financial decisions, such as debt,were considered. The approach of the inter-relations between biotechnical and socio-economic components in the model wellreflected the complexity of the decision-making process and the articulation betweenshort- and long-term decisions. In addition,the multiplicity and diversity of data col-lected from scientists and grassland expertsallowed a representation of the biotechnicalmanagement based on real practices.
Therefore, the model may be of greatinterest to understand the multiple and com-plex relationships between all components,and may evaluate the impact of externalchanges on the viability and sustainabilityof different dairy farm systems on the Réun-ion Island.
This modelling approach also appears tobe an efficient way to combine multidisci-plinary data of farm activities, as well as tocreate close relationships between econo-mists, animal scientists and extension serv-ices. The modular structure permits linkingadditional economic and technical modulesand facilitates the inclusion of new scien-tific knowledge. These models are currentlyoperational and may be used, as a decisionsupport tool, to help decision-makers, suchas dairy cooperative leaders in consideringmanagement strategies of farms.
ACKNOWLEDGEMENTS
The present study has been conducted on theRéunion Island with the animal scientists at thePôle Élevage, and with the expert techniciansfrom the Dairy Cooperative (SICAlait) and otherdevelopment agencies. We thank particularlyMr. Evenat (Director), Mr. Fertil, Mr. Lepetitand Mr. Bigot (technicians) from the Dairycooperative, Dr. Choisis and Dr. Tillard,researchers at the Pôle Élevage, and Mr. Thomasand Mr. Barbet-Massin, technicians of UAFP,for their permanent support, collaborations andsuggestions.
REFERENCES
[1] Alary V., Boussard J.M., Actualisation, ris-que, cacao – Sur les insuffisances de la théo-rie, Econ. Rurale 259 (2000) 64–74.
[2] Alary V., Messad S., Tillard E., Approchefonctionnelle de la diversité des systèmesd’élevage laitiers à l’Ile de La Réunion. Uti-lisation de l’AFM (Analyse Factorielle Mul-tiple) comme aide à l’interprétation de lavariabilité inter et intra groupe, Renc. Rech.Rumin. 8 (2001) 251–255.
[2bis] Alary V., Deybe D., Price policies and agri-cultural supply – The responses of producersin Haryana (India), in: Tomorrow’s agricul-ture: incentives, institutions, infrastructureand innovations, XXIV International Confe-rence of the International Association ofAgricultural Economists, Berlin, Germany,August 2000, 12 p.
[3] Arfini F., The effects of CAP reform on twoItalian regions: a positive mathematical pro-gramming application, in: Ottone Ferro(Ed.), What future for the CAP? Perspectivesand expectations for the CAP of the Euro-pean Union, 1996, pp. 103–109.
[4] Arfini F., Mathematical programming mod-els employed in the analysis of the CommonAgricultural Policy, Working Paper, INEA,Italy, 2001, p. 35.
[5] Barbier B., Bergeron G., Impact of policyinterventions on land management in Hon-douras: results of a bio-economic model,Agric. Syst. 60 (1999) 1–16.
[6] Barkaoui A., Butault J.P., Modélisation del’agriculture meusienne et Paquet Santer,Econ. Rurale 248 (1998) 13–20.
376 K. Louhichi et al.
[7] Blanfort V., Thomas P., Fontaine O., RivièreE., La gestion agroécologique des prairies,in: Mandret G. (Ed.), L’élevage bovin à LaRéunion – Synthèse de quinze ans de recher-che, CIRAD/INRA/CAH/Région Réunion,Coll. Repères, 2000, pp. 129–160.
[8] Boussard J.M., Économie de l’agriculture,Economica, Paris, 1988, 320 p.
[9] Boussemart J.Ph., Jacquet F., Flichman G.,Lefer H.B., Prédire les effets de la réformede la PAC sur deux régions agricoles françai-ses : application d’un modèle bio-économi-que, Rev. Can. Econ. Rurale 44 (1996) 121–138.
[10] De Benedictis M., Cosentino V., Economiadell’azienda agraria, I1 Mulino, Bologna,1979.
[11] Deybe D., Can Agricultural Sector Models bea Tool for Policy Analysis? An Applicationfor the case of Burkina Faso, Agric. Syst. 58(1998) 367–380.
[12] Flichman G., Bio-economic models integrat-ing agronomic, environmental and economicissues with agricultural use of water, Opt.Méditerr. 31(1997) 327–336.
[13] Gohin A., Chantreuil F., La programmationmathématique positive dans les modèlesd’exploitation agricole, Cah. Écon. Sociol.Rurales 52 (1999) 60–79.
[14] Grimaud P., Thomas P., Diversité des rationsà base de graminées et gestion des prairies enélevage bovin sur l’île de la Réunion, Four-rages 169 (2002) 65–78.
[15] Hassoun P., Paillat J.M., Mandret G.,Brunschwig P., Bigot A., Latchimy J.Y., Lesrations en élevage laitier, in: Mandret G.(Ed.), L’élevage bovin à La Réunion – Syn-thèse de quinze ans de recherche, CIRAD/INRA/CAH/Région Réunion, Coll. Repères,2000, pp. 225–248.
[16] Hazell P., Norton R.D., Mathematical Pro-gramming for economic analysis in agricul-ture, MacMillan, London, 1986, 400 p.
[17] Heckelei T., Positive mathematical program-ming: Review of the standard approach,CAPRI Working paper, University of Bonn,1997.
[18] Howitt R.E., Positive mathematical program-ming, Am. J. Agric. Econ. 77 (1995) 329–342.
[19] Jacquet F., Le risque dans le modèle d’exploi-tation agricole, Montpellier, CIHEAM-IAMM,2000, p. 12.
[20] Louhichi K., Essai de modélisation bio-éco-nomique de la relation agriculture-environ-nement : le cas de l’érosion en Tunisie, Thèsede doctorat en sciences économiques, Uni-versité de Montpellier I, 2001, 250 p.
[21] Louhichi K., Fertil G., Alary V., Choisis J.P.,Lepetit J., Apport de la modélisation écono-mique à l’analyse prospective et l’aide aupilotage des systèmes d’élevage laitier à LaRéunion, Renc. Rech. Rumin. 9 (2002) 57–60.
[22] McCarl B.A., Cropping activities in agricul-tural sector models: a methodological pro-posal, Am. J. Agric. Econ. 64 (1982) 768–771.
[23] Paris Q., Howitt R.E., An anlyse of III-posedproduction problems using maximing entropy,Am. J. Agric. Econ. 80 (1998) 124–138.
[24] Roumasset J., Boussard J.M., Singh I., Risk,uncertainty and agricultural development,Agricultural Development Council, New-York, USA, SEARCA (Ed.), 1979, 454 p.
[25] Tauer L.W., Target MOTAD, Am. J. Agric.Econ. 65 (1983) 606–610.
[26] Tillard E., Lanot F., Bigot C.-E., NabenezaS., Pelot J., Les performances de reproduc-tion en élevage laitier, in: Mandret G. (Ed.),L’élevage bovin à La Réunion – Synthèse dequinze ans de recherche, CIRAD/INRA/CAH/Région Réunion, Coll. Repères, 2000,pp. 257–292.
A bio-economic model to analyse the interactions in dairy farming systems 377
Appendix 1. Example of technical-economic coefficients included in the model.
Table A1. Average technical-economic coefficients for fodders.
Cutting Maintenance cost
Transport + cut costs
Total Yield Feed Unitnumber costs
Fodder Species Season (Euro/ha) (Euro/ha) (Euro/ha) (TDM/ha) (/kgDM)1 492 106 598 9.00 0.31
Summer 2 770 116 886 8.84 0.57Green 3 1047 127 1174 7.95 0.65
1 211 65 276 5.50 0.35Winter 2 422 71 493 5.42 0.65
3 633 78 711 4.86 0.74Pennisetum 1 492 134 626 10.00 0.31clandestinum Summer 2 770 150 920 10.00 0.62(Kikuyu) Silage 3 1047 182 1229 10.00 0.72
1 211 124 335 9.24 0.35Winter 2 422 139 561 9.24 0.62
3 633 168 801 9.24 0.721 492 149 640 12.60 0.50
Summer 2 770 157 927 11.94 0.70Green 3 1047 176 1224 11.05 0.74
1 211 53 264 4.50 0.55Lolium Winter 2 422 58 480 4.42 0.79perenne 3 633 62 695 3.86 0.83(Ray grass) 1 492 134 626 10.00 0.50
Summer 2 770 150 920 10.00 0.67Silage 3 1047 182 1229 10.00 0.78
1 211 124 335 9.24 0.55Winter 2 422 139 561 9.24 0.67
3 633 168 801 9.24 0.781 492 137 629 11.65 0.45
Summer 2 770 137 906 10.39 0.65Green 3 1047 152 1199 9.50 0.69
Pennisetum 1 211 65 276 5.50 0.50purpureum Winter 2 422 65 487 4.92 0.70(Mixte) 3 633 70 703 4.36 0.78
1 492 134 626 10.00 0.45Summer 2 770 150 920 10.00 0.67
Silage 3 1047 182 1229 10.00 0.771 211 124 335 9.24 0.50
Winter 2 422 139 561 9.24 0.673 633 168 801 9.24 0.771 252 74 326 12.60 0.35
Fodder Summer 2 448 79 527 11.94 0.67cane Green 3 645 88 733 11.05 0.78for animals 1 226 26 253 4.50 0.35
Winter 2 452 29 482 4.42 0.673 679 31 709 3.86 0.78
378 K. Louhichi et al.
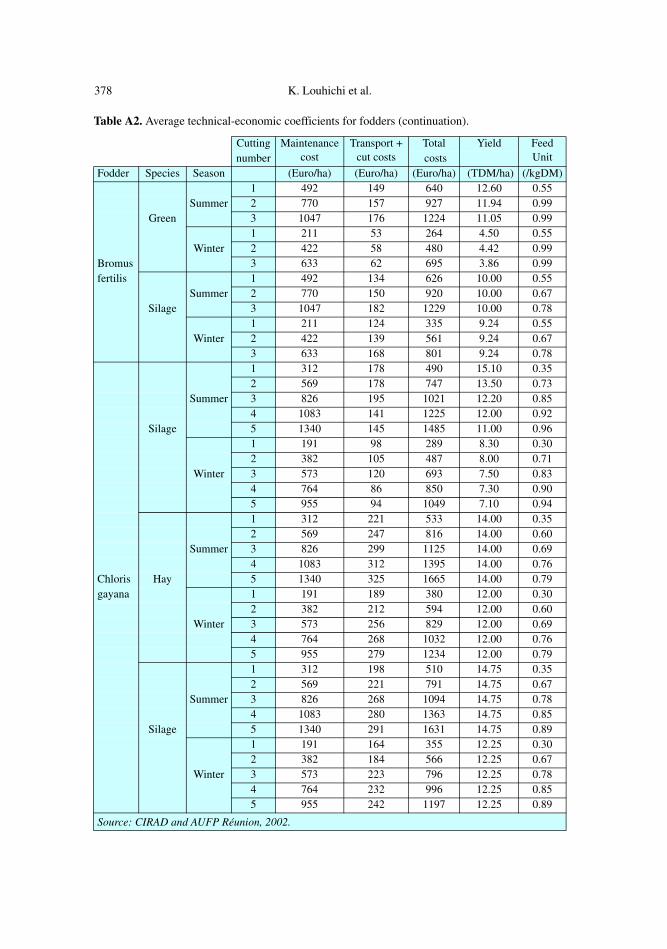
Table A2. Average technical-economic coefficients for fodders (continuation).
Cutting Maintenance cost
Transport + cut costs
Total Yield Feed Unitnumber costs
Fodder Species Season (Euro/ha) (Euro/ha) (Euro/ha) (TDM/ha) (/kgDM)1 492 149 640 12.60 0.55
Summer 2 770 157 927 11.94 0.99Green 3 1047 176 1224 11.05 0.99
1 211 53 264 4.50 0.55Winter 2 422 58 480 4.42 0.99
Bromus 3 633 62 695 3.86 0.99fertilis 1 492 134 626 10.00 0.55
Summer 2 770 150 920 10.00 0.67Silage 3 1047 182 1229 10.00 0.78
1 211 124 335 9.24 0.55Winter 2 422 139 561 9.24 0.67
3 633 168 801 9.24 0.781 312 178 490 15.10 0.352 569 178 747 13.50 0.73
Summer 3 826 195 1021 12.20 0.854 1083 141 1225 12.00 0.92
Silage 5 1340 145 1485 11.00 0.961 191 98 289 8.30 0.302 382 105 487 8.00 0.71
Winter 3 573 120 693 7.50 0.834 764 86 850 7.30 0.905 955 94 1049 7.10 0.941 312 221 533 14.00 0.352 569 247 816 14.00 0.60
Summer 3 826 299 1125 14.00 0.694 1083 312 1395 14.00 0.76
Chloris Hay 5 1340 325 1665 14.00 0.79gayana 1 191 189 380 12.00 0.30
2 382 212 594 12.00 0.60Winter 3 573 256 829 12.00 0.69
4 764 268 1032 12.00 0.765 955 279 1234 12.00 0.791 312 198 510 14.75 0.352 569 221 791 14.75 0.67
Summer 3 826 268 1094 14.75 0.784 1083 280 1363 14.75 0.85
Silage 5 1340 291 1631 14.75 0.891 191 164 355 12.25 0.302 382 184 566 12.25 0.67
Winter 3 573 223 796 12.25 0.784 764 232 996 12.25 0.855 955 242 1197 12.25 0.89
Source: CIRAD and AUFP Réunion, 2002.
A bio-economic model to analyse the interactions in dairy farming systems 379
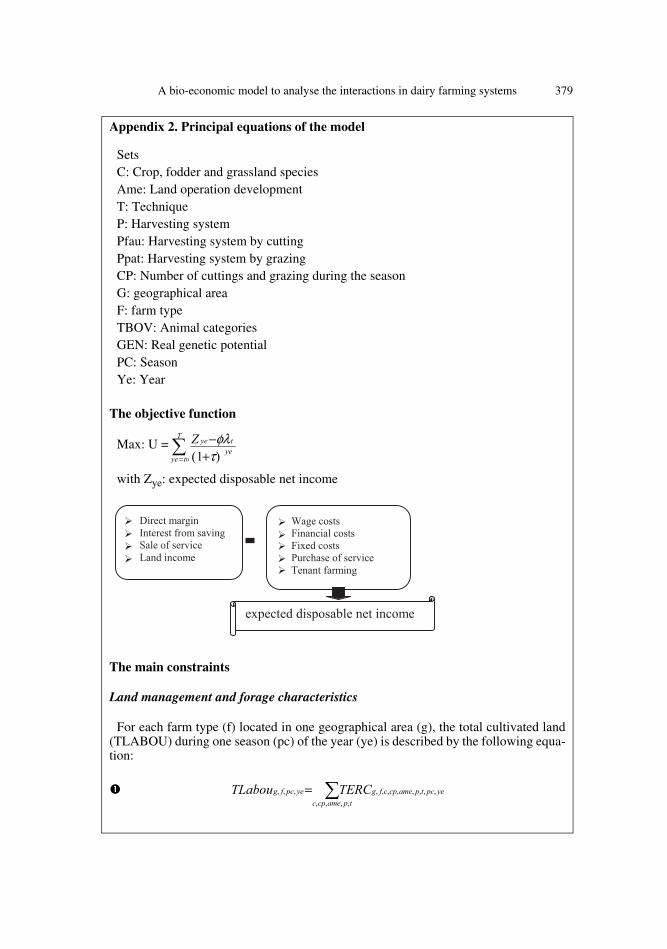
Appendix 2. Principal equations of the model
SetsC: Crop, fodder and grassland species Ame: Land operation development T: Technique P: Harvesting system Pfau: Harvesting system by cuttingPpat: Harvesting system by grazingCP: Number of cuttings and grazing during the season G: geographical areaF: farm typeTBOV: Animal categories GEN: Real genetic potential PC: SeasonYe: Year
The objective function
Max: U =
with Zye: expected disposable net income
The main constraints
Land management and forage characteristics
For each farm type (f) located in one geographical area (g), the total cultivated land(TLABOU) during one season (pc) of the year (ye) is described by the following equa-tion:
∑= +
−T
tyeyetyeZ
0 )1( τφλ
∑=tpamecpc
yepctpamecpcfgyepcfg TERCTLabou,,,,
,,,,,,,,,,,
380 K. Louhichi et al.
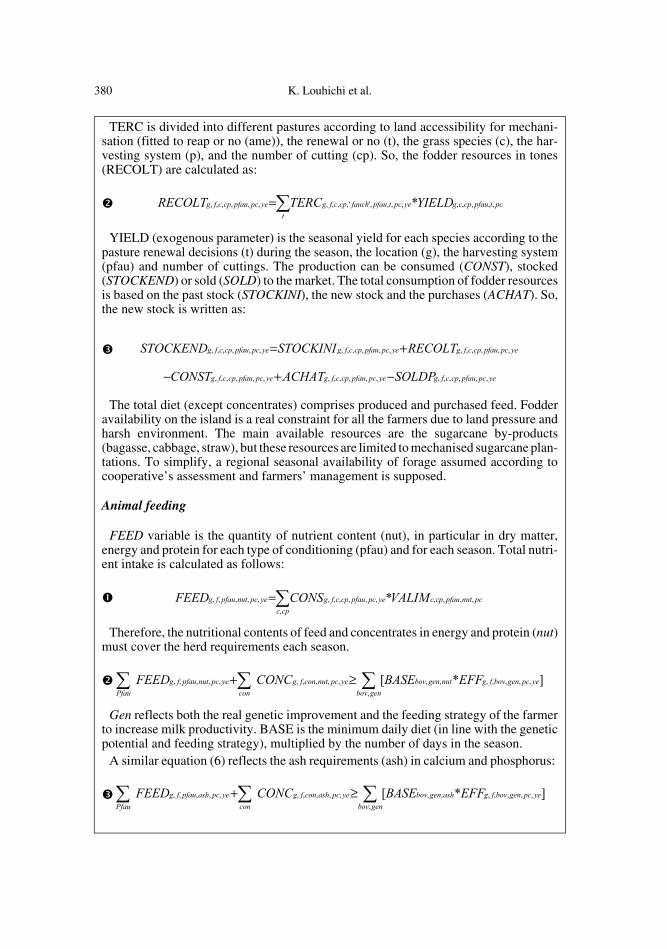
TERC is divided into different pastures according to land accessibility for mechani-sation (fitted to reap or no (ame)), the renewal or no (t), the grass species (c), the har-vesting system (p), and the number of cutting (cp). So, the fodder resources in tones(RECOLT) are calculated as:
YIELD (exogenous parameter) is the seasonal yield for each species according to thepasture renewal decisions (t) during the season, the location (g), the harvesting system(pfau) and number of cuttings. The production can be consumed (CONST), stocked(STOCKEND) or sold (SOLD) to the market. The total consumption of fodder resourcesis based on the past stock (STOCKINI), the new stock and the purchases (ACHAT). So,the new stock is written as:
The total diet (except concentrates) comprises produced and purchased feed. Fodderavailability on the island is a real constraint for all the farmers due to land pressure andharsh environment. The main available resources are the sugarcane by-products(bagasse, cabbage, straw), but these resources are limited to mechanised sugarcane plan-tations. To simplify, a regional seasonal availability of forage assumed according tocooperative’s assessment and farmers’ management is supposed.
Animal feeding
FEED variable is the quantity of nutrient content (nut), in particular in dry matter,energy and protein for each type of conditioning (pfau) and for each season. Total nutri-ent intake is calculated as follows:
Therefore, the nutritional contents of feed and concentrates in energy and protein (nut)must cover the herd requirements each season.
Gen reflects both the real genetic improvement and the feeding strategy of the farmerto increase milk productivity. BASE is the minimum daily diet (in line with the geneticpotential and feeding strategy), multiplied by the number of days in the season.
A similar equation (6) reflects the ash requirements (ash) in calcium and phosphorus:
∑=t
pctpfaucpcgyepctpfaufauchcpcfgyepcpfaucpcfg YIELDTERCRECOLT ,,,,,,,,,'',,,,,,,,,, *
yepcpfaucpcfgyepcpfaucpcfgyepcpfaucpcfg RECOLTSTOCKINISTOCKEND ,,,,,,,,,,,,,,,,,, +=
yepcpfaucpcfgyepcpfaucpcfgyepcpfaucpcfg SOLDPACHATCONST ,,,,,,,,,,,,,,,,,, −+−
pcnutpfaucpccpc
yepcpfaucpcfgyepcnutpfaufg VALIMCONSFEED ,,,,,
,,,,,,,,,,, *∑=
]*[ ,,,,,,,,
,,,,,,,,,, yepcgenbovfgnutgenbovgenbov
yepcnutconfgcon
yepcnutpfaufgPfau
EFFBASECONCFEED ∑∑∑ ≥+
]*[ ,,,,,,,,
,,,,,,,,,, yepcgenbovfgashgenbovgenbov
yepcashconfgcon
yepcashpfaufgPfau
EFFBASECONCFEED ∑∑∑ ≥+
A bio-economic model to analyse the interactions in dairy farming systems 381
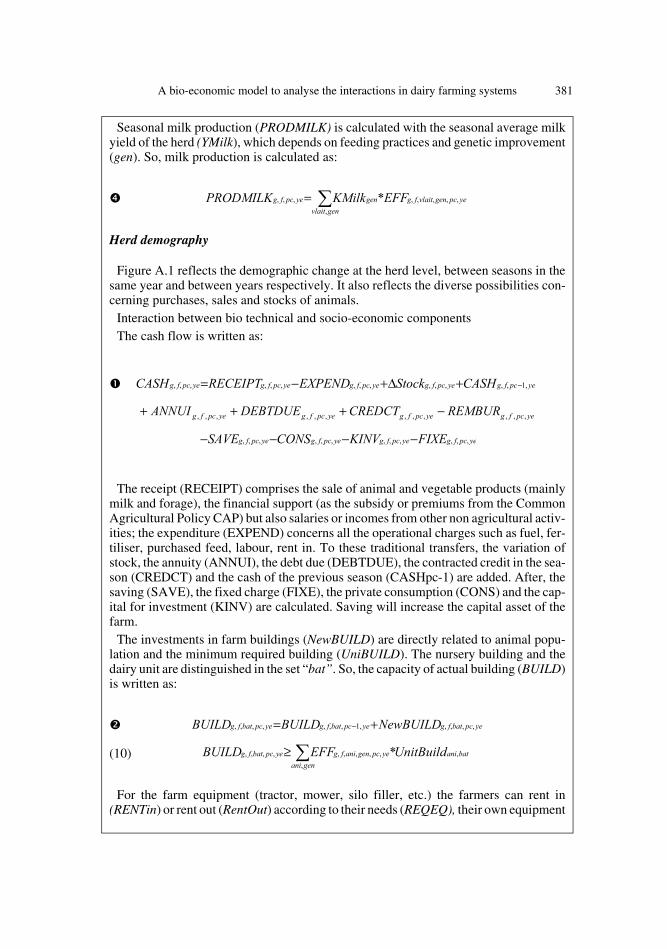
Seasonal milk production (PRODMILK) is calculated with the seasonal average milkyield of the herd (YMilk), which depends on feeding practices and genetic improvement(gen). So, milk production is calculated as:
Herd demography
Figure A.1 reflects the demographic change at the herd level, between seasons in thesame year and between years respectively. It also reflects the diverse possibilities con-cerning purchases, sales and stocks of animals.
Interaction between bio technical and socio-economic componentsThe cash flow is written as:
The receipt (RECEIPT) comprises the sale of animal and vegetable products (mainlymilk and forage), the financial support (as the subsidy or premiums from the CommonAgricultural Policy CAP) but also salaries or incomes from other non agricultural activ-ities; the expenditure (EXPEND) concerns all the operational charges such as fuel, fer-tiliser, purchased feed, labour, rent in. To these traditional transfers, the variation ofstock, the annuity (ANNUI), the debt due (DEBTDUE), the contracted credit in the sea-son (CREDCT) and the cash of the previous season (CASHpc-1) are added. After, thesaving (SAVE), the fixed charge (FIXE), the private consumption (CONS) and the cap-ital for investment (KINV) are calculated. Saving will increase the capital asset of thefarm.
The investments in farm buildings (NewBUILD) are directly related to animal popu-lation and the minimum required building (UniBUILD). The nursery building and thedairy unit are distinguished in the set “bat”. So, the capacity of actual building (BUILD)is written as:
(10)
For the farm equipment (tractor, mower, silo filler, etc.) the farmers can rent in(RENTin) or rent out (RentOut) according to their needs (REQEQ), their own equipment
∑=genvlait
yepcgenvlaitfggenyepcfg EFFKMilkPRODMILK,
,,,,,,,, *
yepcfgyepcfgyepcfgyepcfgyepcfg CASHStockEXPENDRECEIPTCASH ,1,,,,,,,,,,,,,, −+∆+−=
yepcfgyepcfgyepcfgyepcfg REMBURCREDCTDEBTDUEANNUI ,,,,,,,,,,,, −+++
yepcfgyepcfgyepcfgyepcfg FIXEKINVCONSSAVE ,,,,,,,,,,,, −−−−
yepcbatfgyepcbatfgyepcbatfg NewBUILDBUILDBUILD ,,,,,1,,,,,,, += −
∑≥genani
bataniyepcgenanifgyepcbatfg UnitBuildEFFBUILD,
,,,,,,,,,, *
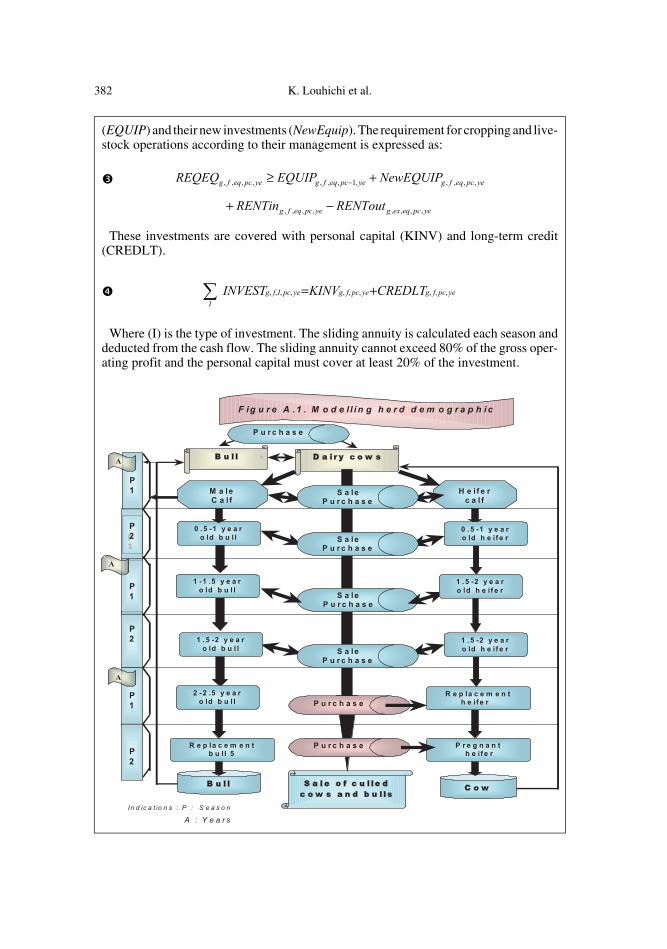
382 K. Louhichi et al.
(EQUIP) and their new investments (NewEquip). The requirement for cropping and live-stock operations according to their management is expressed as:
These investments are covered with personal capital (KINV) and long-term credit(CREDLT).
Where (I) is the type of investment. The sliding annuity is calculated each season anddeducted from the cash flow. The sliding annuity cannot exceed 80% of the gross oper-ating profit and the personal capital must cover at least 20% of the investment.
yepceqfgyepceqfgyepceqfg NewEQUIPEQUIPREQEQ ,,,,,1,,,,,,, +≥ −
yepceqexgyepceqfg RENToutRENTin ,,,,,,,, −+
yepcfgyepcfgyepcIfgI
CREDLTKINVINVEST ,,,,,,,,,, +=∑