Embed Size (px)
Citation preview
A DOUBLE-LOOP LEARNING APPROACHTO CONSTRUCT UNDERSTANDINGOF ACCUMULATION PRINCIPLES
A THESIS SUBMITTED FOR THE DEGREE OFDOCTOR OF PHILOSOPHY OF
THE AUSTRALIAN NATIONAL UNIVERSITY
© CHRISTOPHER ANTHONY BROWNE 2015ALL RIGHTS RESERVED

i

I declare that the work in this thesis is entirely my own and that to thebest of my knowledge it does not contain any materials previously published orwritten by another person except where otherwise indicated.
Chris BrowneDecember 2015
i

ii

For Lucy,
and the impending generation of Tinker-bells
who will show the Lost Boys how
iii

iv
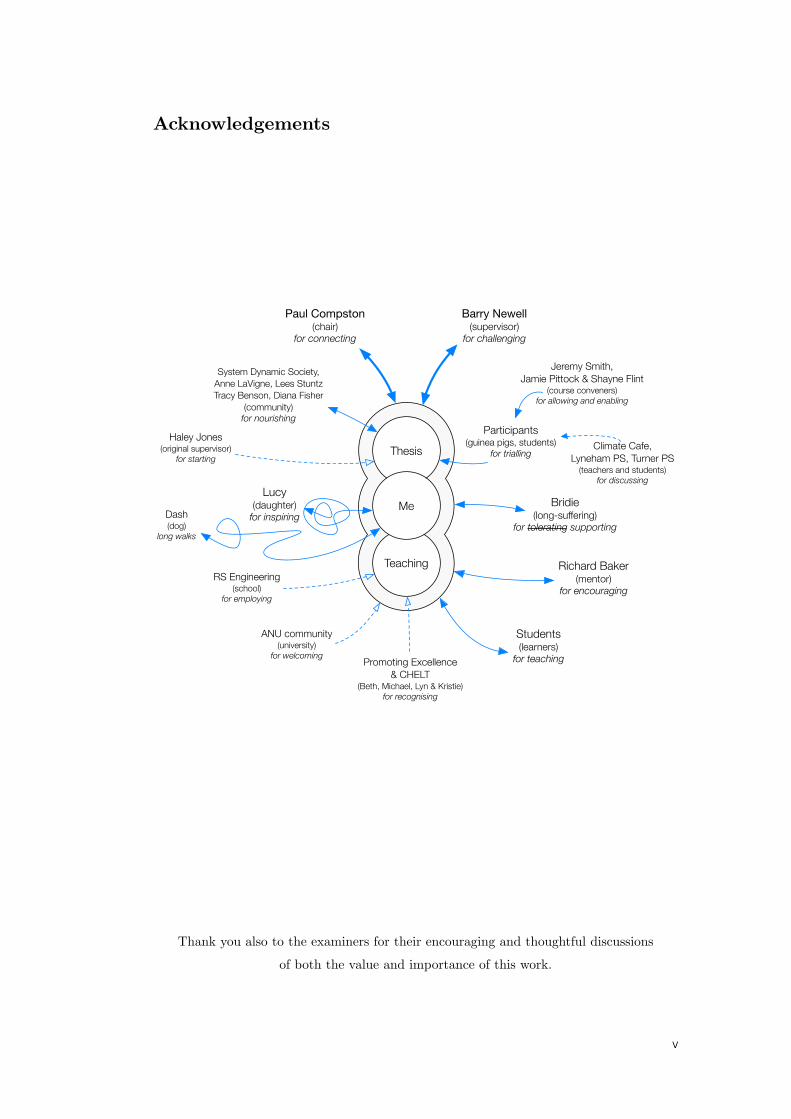
Acknowledgements
Climate Cafe,Lyneham PS, Turner PS
(teachers and students)for discussing
ThesisThesisThesis
Thesis
Teaching
Me
Barry Newell(supervisor)
for challenging
Paul Compston(chair)
for connecting
Participants(guinea pigs, students)
for trialling
Haley Jones(original supervisor)
for starting
System Dynamic Society,Anne LaVigne, Lees StuntzTracy Benson, Diana Fisher
(community)for nourishing
Lucy(daughter)
for inspiring
Bridie(long-suffering)
for tolerating supporting
Students(learners)
for teaching
RS Engineering(school)
for employing
Promoting Excellence& CHELT
(Beth, Michael, Lyn & Kristie)for recognising
Richard Baker(mentor)
for encouraging
ANU community(university)
for welcoming
Jeremy Smith, Jamie Pittock & Shayne Flint
(course conveners)for allowing and enabling
Dash(dog)
long walks
Thank you also to the examiners for their encouraging and thoughtful discussionsof both the value and importance of this work.
v

vi
Abstract
In this thesis, I present a concrete learning activity to assist engineering andSTEM students with no formal systems-thinking training develop improvedmental models of accumulation principles. This thesis takes up Sterman’s 2008challenge to create new methods to develop intuitive systems-thinking capabilitiesso that people can discover, for themselves, the dynamics of accumulation andimpact of policies.
At the core of this research is a model for double-loop learning through construc-tionist inquiry. The scenario for the activity is the effect of anthropogenic carbonemissions on the atmospheric carbon concentration. A hands-on activity wasdeveloped called Tubs & Pumps (T&P) as a physical analogue of the carboncycle. However, the activity could be adapted to a range of dynamic problems.
Students manipulate the T&P system guided by a series of prompts, whichencourage focused and informed group discussion about the given problem. Arange of treatment conditions were used to investigate the effect of prompts andassessment layout in the experiment. The results show that using targetedprompts can drastically improve the likelihood of students demonstrating a soundunderstanding of accumulation principles.
This finding has implications for how knowledge is constructed in engineeringclassrooms, and is a valuable approach for educators wanting their students todevelop a deep understanding about dynamic systems.
vii

viii
Table of contents
Acknowledgements v................................................................................................Abstract vii.............................................................................................................Table of contents ix.................................................................................................
List of figures xii.................................................................................................List of tables xiii.................................................................................................List of boxes xiv..................................................................................................
Glossary xv..............................................................................................................
1. Introduction 1......................................................................................................1.1. Context of the study 1.................................................................................1.2. Problem statement 3....................................................................................1.3. Aim and scope of the thesis 4......................................................................1.4. Research questions 5....................................................................................1.5. Significance and contribution 5....................................................................1.6. Structure of the thesis 6...............................................................................
Part I. Background 9...............................................................................................2. Stock-and-flow thinking and the carbon cycle 11................................................
2.1. Dynamics of the carbon cycle 11..................................................................2.1.1. The carbon cycle in stocks and flows 12...............................................2.1.2. Anthropogenic carbon emissions over time 17......................................
2.2. Stock-flow (SF) failure 20............................................................................2.2.1. SF failure and the carbon cycle 25.......................................................
3. Constructing shared knowledge 29......................................................................3.1. A Systems Thinking perspective on constructing knowledge 32..................
3.1.1. ST methods to recognise bounded rationality 33.................................3.1.2. ST methods to facilitate experiential learning 39.................................3.1.3. ST methods to create dynamical connections 43..................................3.1.4. Application of ST perspectives to the T&P activity 46........................
3.2. A Cognitive Science perspective on constructing knowledge 46...................3.2.1. CS methods to recognise bounded rationality 47.................................3.2.2. CS methods to facilitate experiential learning 49.................................3.2.3. CS methods to create dynamical connections 50..................................3.2.4. A CS basis for interdisciplinary group work 55....................................3.2.5. Application of CS perspectives to the T&P activity 56........................
3.3. A Learning & Teaching perspective on constructing knowledge 57.............3.3.1. L&T methods to escape bounded rationality 57..................................3.3.2. L&T methods to facilitate experiential learning 63..............................3.3.3. L&T methods to create dynamical connections 67...............................3.3.4. Application of L&T perspectives to the T&P activity 71....................3.3.5. Constructing knowledge in engineering education 72...........................
3.4. Towards a double-loop learning activity 73..................................................
ix
Part II. Research Approach 75................................................................................4. Workshop methodology 77..................................................................................
4.1. The T&P system 78.....................................................................................4.1.1. Variations in the T&P system between experiments 79.......................4.1.2. Dynamic hypothesis 81.........................................................................4.1.3. The T&P conceptual metaphor 85.......................................................
4.2. Workshop instructions 87.............................................................................4.2.1. Video introduction 88...........................................................................4.2.2. Group formation 89..............................................................................4.2.3. Activity instructions 91........................................................................
4.3. Assessment tasks 93.....................................................................................4.3.1. Written instructions 94.........................................................................4.3.2. Graphical task 95.................................................................................4.3.3. Causal logic and group agreement 97...................................................4.3.4. Data interpretation and coding 99.......................................................
4.4. Treatment conditions 111.............................................................................4.4.1. Checklist experiment 112......................................................................4.4.2. Simulation experiment 113...................................................................4.4.3. Dialogue experiment 114......................................................................
5. Workshop results 117...........................................................................................5.1. Summary results 117....................................................................................
5.1.1. Summary results by treatment condition 117.......................................5.1.2. Summary results by course 118............................................................5.1.3. Summary results by assessment sheet 119............................................5.1.4. Summary results by profile data 119....................................................
5.2. Results by experiment 121...........................................................................5.2.1. Scaffold experiment 121........................................................................5.2.2. Simulation experiment 123...................................................................5.2.3. Dialogue experiment 125......................................................................
5.3. Results by task 128......................................................................................5.3.1. Graphical responses 128.......................................................................5.3.2. Written descriptions 129.......................................................................5.3.3. Graphical and written descriptions 130................................................5.3.4. Causal logic 131....................................................................................5.3.5. Group effects 133..................................................................................5.3.6. Text analysis 136..................................................................................
Part III. Synthesis 139.............................................................................................6. Analysis and Discussion 141................................................................................
6.1. Analysis of research questions 141...............................................................6.1.1. Scaffolded refinement 141.....................................................................6.1.2. Physical simulation 143........................................................................6.1.3. Focussed dialogue 146...........................................................................
6.2. SF failure or graphical confusion? 148.........................................................6.3. Hands-on learning is not the same as constructionism 152..........................
x

6.4. Double-loop learning as a powerful idea 155................................................7. Conclusion 157....................................................................................................
7.1. Lessons for educators 157.............................................................................7.2. Further research 165....................................................................................
8. AppendicesAppendix A Workshop instructions
A.1 Checklist workshop instructions A2.............................................................A.2 Dialogue experiment workbook A3..............................................................A.3 Simulation experiment workbook A5...........................................................A.4 Trial Workshop 2 Instructions A9................................................................A.5 Trial Workshop 3 Instructions A11..............................................................
Appendix B Assessment tasks used in the workshopsB.1 Emissions & Removals (ER) assessment sheet A14......................................B.2 Anthropogenic Emissions (AE) assessment sheet A15.................................B.3 Anthropogenic Additions (AA) assessment sheet A16.................................B.4 Profile questionnaire A17.............................................................................
Appendix C Video transcriptsC.1 Checklist experiment video transcript A18..................................................C.2 Workbook experiment video transcript A20.................................................
Appendix D Reflections on trial workshops D.1 Test confusion A22.......................................................................................D.2 Group discussions and pretests A25.............................................................D.3 Assembling the system A28.........................................................................D.4 Using a learning activity A30.......................................................................D.5 Linear dynamics A35...................................................................................
9. Bibliography A45.................................................................................................Abbreviations A54..............................................................................................
xi
List of figures1.1: Learning loops describing how decisions are made based on observations
of the real world 4...........................................................................................................2.1: Box diagram of Earth’s carbon cycle 13........................................................................2.2: Stock and flow diagram of the global carbon cycle and heat balance 15.......................2.3: Infographic describing the carbon bathtub 16...............................................................2.4: Anthropogenic carbon emissions and atmospheric carbon levels
(c1750-2010) 18...............................................................................................................2.5: Typical stock-and-flow assessment task 26....................................................................3.1: Influence diagram of bounded rationality 31.................................................................3.2: Influence diagram of the double-loop learning model 31...............................................3.3: Annotated influence diagram of background theory for aspects of the double-loop
learning model, as seen from the ST, CS and L&T perspectives 32...............................3.4: A generic bathtub visualising the components of the bathtub metaphor 34.................3.5: Causal-loop diagram of the bathtub metaphor dynamics 38.........................................3.6: Stock-and-flow representation of filling a bathtub 38....................................................3.7: Influence diagram and behaviour over time graph of the limits to growth
archetype 41....................................................................................................................3.8: Different representations of stock and flow components 53...........................................3.9: Diagram demonstrating how Cuisenaire rods can be used to explore arithmetic
operations 64...................................................................................................................3.10: Drawing an equilateral triangle using Turtle and Euclidean geometry 66...................3.11: Continuous improvement loops 70...............................................................................3.12: Annotated influence diagram of a double-loop learning model for the
T&P activity. 74.............................................................................................................4.1: Photo of participants manipulating the T&P system 79...............................................4.2: Photo of T&P system on the printed absorbent mat 80...............................................4.3: Printed absorbent mats used for the T&P activity with different terminology 81........4.4: Stock-and-flow representation of the T&P system 82....................................................4.5: Diagram of the T&P system 83.....................................................................................4.6: Expected behaviour over time graphs for physical simulation 84..................................4.7: Stills from the introductory video in the simulation experiment 89.............................4.8: Group formation methods 90........................................................................................4.9: Tasks 1 and 2 in the Workbook experiments 92............................................................4.10: Graphical tasks used in the experiments 95................................................................4.11: Additional tasks on the AA assessment sheet 97.........................................................4.12: Future scenarios represented by the causal logic questions 98.....................................4.13: Survey response showing gender question 100.............................................................4.14: Survey response showing field(s) of study with multiple answers. 101........................4.15: Survey response showing preferred language with multiple answers 102.....................4.16: Rubric used to categorise graphical responses, with dotted lines showing
typical responses 104.......................................................................................................4.17: Pictorial representation of the T&P analogue 113.......................................................4.18: Workbook modification for the GD treatment 116......................................................6.1: Generic structure of the dissipation process 149...........................................................7.1: Annotated influence diagram of double-loop learning 158.............................................
D.1 Example of the test used in Trial Workshop 1 A23.......................................................D.2 Instructions for Task 1 from Trial Workshop 2 A29......................................................D.3 Example of the first two tasks in the Trial Workshop 3 workbook A32........................D.4 The linear dynamics task A36.......................................................................................
xii

List of tables2.1: Overview of key previous SF failure studies 22.............................................................3.1: Model-boundary chart of the bathtub metaphor 35......................................................3.2: Conceptual mapping of the bathtub metaphor 52.........................................................4.1: Overview of experiments with respect to aspects of the double-loop
learning model 78............................................................................................................4.2: Model-boundary chart for design of the T&P system 82..............................................4.3: Conceptual mapping of the T&P metaphor 85.............................................................4.4: Areas of potential confusion in the conceptual mapping 86..........................................4.5: Generic structure of workshops 88................................................................................4.6: Sequence of workbook instructions by experiment 92...................................................4.7: Components of assessment tasks 93..............................................................................4.8: Written instructions for each assessment task 94..........................................................4.9: Selected word frequencies in written responses by assessment sheet 96........................4.10: Reporting categories for profile questions 100.............................................................4.11: Perceived mapping of coding schemata 107.................................................................4.12: Graphical-Written response categories 110..................................................................4.13: Summary of workshops and participants in undergraduate courses 111......................4.14: Summary of group sizes for treatment conditions within workshop sessions 112........5.1: Summary results for each treatment condition 117.......................................................5.2: Summary results for courses 118...................................................................................5.3: Summary results for assessment sheet 119....................................................................5.4: Summary of profile data across the workshops 120.......................................................5.5: Summary results by profile category 120.......................................................................5.6: Scaffold experiment treatment conditions 122...............................................................5.7: Scaffold experiment treatment conditions by profile data 122.......................................5.8: Scaffold experiment results by treatment category 123.................................................5.9: Simulation experiment treatment conditions 124..........................................................5.10: Simulation experiment treatment conditions by profile data 124................................5.11: Simulation experiment results by treatment category 125...........................................5.12: Dialogue experiment treatment conditions 126............................................................5.13: Dialogue experiment treatment conditions by profile data 126...................................5.14: Dialogue experiment results by treatment category 127..............................................5.15: Graphical response category for each treatment condition 128...................................5.16: Written description matches for each treatment condition 129...................................5.17: Graphical-Written response categories by treatment condition 130............................5.18: Summary of Graphical-Written responses by treatment condition 131.......................5.19: Correct causal logic responses by treatment condition 132.........................................5.20: Causal logic scores by treatment condition and understanding level 132....................5.21: Agreement rates by treatment condition 133...............................................................5.22: Group graphical response category for GD treatment conditions 134.........................5.23: Groups with all correct or all incorrect graphical responses 135.................................5.24: Sound AP by simulation role and treatment condition 135.........................................5.25: Frequently used words in the written descriptions by experiment and
graph category 136..........................................................................................................5.26: Frequently used words not used in assessment sheet by experiment 137.....................
xiii

6.1: Scaffold experiment results by treatment condition 142................................................6.2: Simulation experiment results by treatment condition 144...........................................6.3: Linear dynamics results by graphical response 145.......................................................6.4: Dialogue experiment results by treatment category 146................................................6.5: Dialogue experiment results for Sound AP by graph type 147......................................6.6: Incorrect responses for graphical and written tasks by treatment condition 151..........
D.1 Summary of all workshop timings and courses A21......................................................D.2 Problems observed in the Trial workshop 1 responses A24...........................................D.3 Frequency and changes of responses in the Experimentation workshop A26.................D.4 Rubric for categorising graphical responses in the linear dynamics task A38...............D.5 Linear pretest and carbon cycle graph A41...................................................................D.6 Summary of profile data across all workshops A42.......................................................D.7 Linear dynamics results by graphical response A42......................................................
List of boxes2.1: Components of a typical bathtub test 23......................................................................4.1: A response demonstrating an algebraic solution. 96......................................................4.2: Survey response showing a positive response to knowing the outcome
with an incorrect graph 103............................................................................................4.3: Typical graphical responses for each of the five graphical response categories 105.......4.4: Comparison of graphical responses categories with respect to Sterman
& Booth Sweeney’s coding schema 106...........................................................................4.5: Coding of graphical and written descriptions. 109........................................................4.6: Information presented on the scenario cards 114...........................................................6.1: Different graphical responses with similar written description 150...............................
D.1 A correct response demonstrating an unintended solution. A25...................................D.2 A correct response with consistent causal logic A25.....................................................D.3 A participant’s improving graphical and written descriptions over the three testsA27D.4 A participant’s entrenched understanding A28.............................................................D.5 Question text for the three linear treatment conditions A37.........................................D.6 Examples of graphical responses in the linear dynamics task A39................................D.7 Three different linear dynamics graphs with similar descriptions A40..........................
xiv

Glossary
Key terminology
accumulation principles valid stock-and-flow behaviour
activity a set of protocols for interaction with the T&P system
carbon cycle the biogeochemical cycle describing the exchange of carbonbetween stocks in the Earth system
CS cognitive science, field of knowledge
double-loop learning a model for learning based on the continuous refinement ofmental models based on observations in the real world
experiment a set of protocols to describe design of workshops used for datacollection
flow processes that change a stock
L&T learning & teaching, field of knowledge
mental model cause-and-effect logic used in one’s decision-making
physical simulation a process of simulation using a physical system; in this instance,the T&P system
response the answers provided in the assessment sheet
SF failure stock-flow failure, a violation of accumulation principles
ST systems thinking, field of knowledge
STEM science, technology, engineering and mathematics
stock an entity that accumulates or depletes over time
stock-flow (SF) failure a perception of stock-and-flow relationships that violate conser-vation of mass principles
system dynamics a methodology for describing complex physical and socialsystems
T&P tubs and pumps, the activity at the core of this thesis
T&P system a physical, manipulable model used for simulation
WG confusion written-graphical confusion, where the graphical and writtenresponses do not match
workshop a session where students engaged with the activity
xv

Terminology for workshop activities
Note: Additional terminology for the workshop methodology is in Part II.
Experiments
Checklist the early experiments based on checklist instructions
Simulation later experiment to test different simulation activities
Dialogue later experiment to test focussed dialogue prompts
Experimental categories
PC physical simulation activity with checklist instructions
PW physical simulation activity with workbook instructions
MW mental simulation activity with workbook instructions
Assessment sheets
ER Emissions & Removals
AE Anthropogenic Emissions
AA Anthropogenic Additions
Treatment categories
Treatment categories are referred to using the acronym ‘experimental category–assess-ment sheet’, for example, PW-AA. Additional categories include:
PW-GD as PW with group diagram treatment condition
PW-SC as PW with scenario card treatment condition
PW-GDSC as PW-GD and PW-SC combined
Graphical-written categories
Summary groups that categorise results for both the graphical and written tasks
Sound AP sound accumulation principles (AP); graphs that show a decrease,with a matching written description
WG confusion written-graphical (WG) confusion; where the graph does not matchthe written description, such as a graph that increases with adescription that calls for a decrease
SF failure stock-flow (SF) failure; where the graph has a matching description,but violates accumulation principles, such as a belief that increasingthe flow rate into a stock will result in a decrease of that stockΒ
xvi
1 Introduction
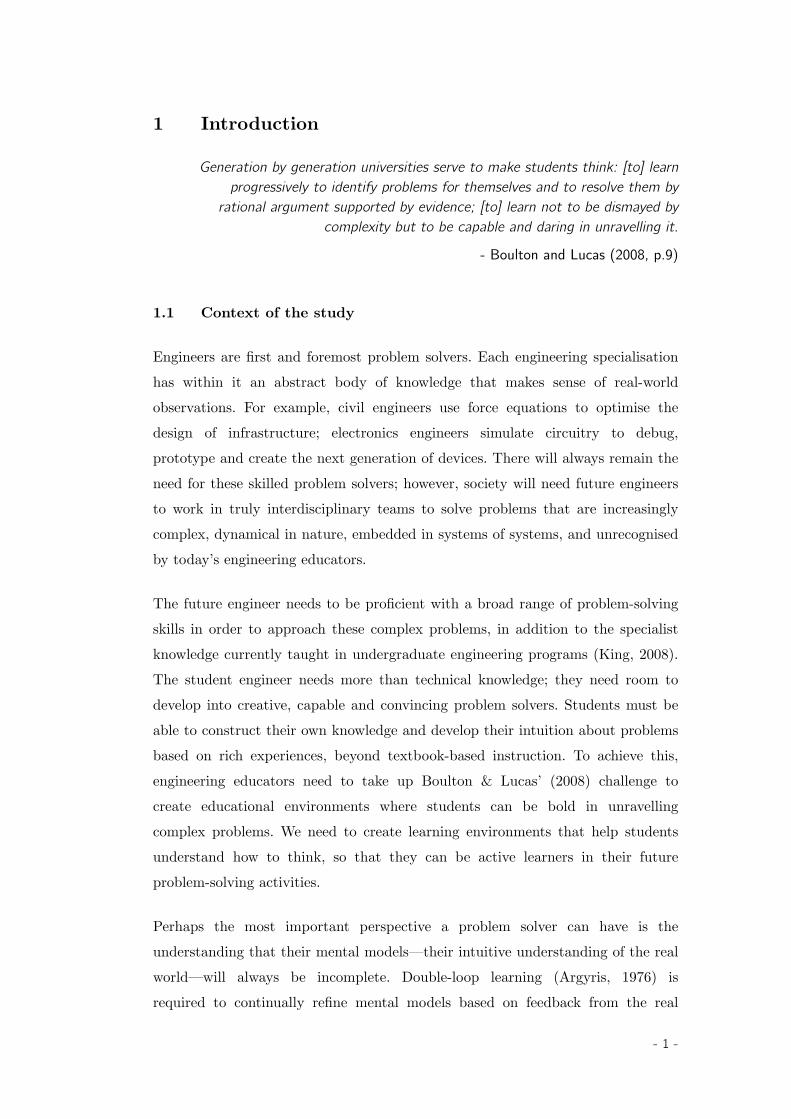
Generation by generation universities serve to make students think: [to] learnprogressively to identify problems for themselves and to resolve them by
rational argument supported by evidence; [to] learn not to be dismayed bycomplexity but to be capable and daring in unravelling it.
- Boulton and Lucas (2008, p.9)
1.1 Context of the study
Engineers are first and foremost problem solvers. Each engineering specialisationhas within it an abstract body of knowledge that makes sense of real-worldobservations. For example, civil engineers use force equations to optimise thedesign of infrastructure; electronics engineers simulate circuitry to debug,prototype and create the next generation of devices. There will always remain theneed for these skilled problem solvers; however, society will need future engineersto work in truly interdisciplinary teams to solve problems that are increasinglycomplex, dynamical in nature, embedded in systems of systems, and unrecognisedby today’s engineering educators.
The future engineer needs to be proficient with a broad range of problem-solvingskills in order to approach these complex problems, in addition to the specialistknowledge currently taught in undergraduate engineering programs (King, 2008).The student engineer needs more than technical knowledge; they need room todevelop into creative, capable and convincing problem solvers. Students must beable to construct their own knowledge and develop their intuition about problemsbased on rich experiences, beyond textbook-based instruction. To achieve this,engineering educators need to take up Boulton & Lucas’ (2008) challenge tocreate educational environments where students can be bold in unravellingcomplex problems. We need to create learning environments that help studentsunderstand how to think, so that they can be active learners in their futureproblem-solving activities.
Perhaps the most important perspective a problem solver can have is theunderstanding that their mental models—their intuitive understanding of the realworld—will always be incomplete. Double-loop learning (Argyris, 1976) isrequired to continually refine mental models based on feedback from the real
- 1 -
world. Second-generation cognitive scientists have shown that humanunderstanding of the world is based on experience, and is largely metaphorical.Modern metaphor theory (Lakoff & Johnson, 2003) can provide strong guidanceto those attempting to develop effective teams of problem solvers by building onlearners’ experiences with the real world.
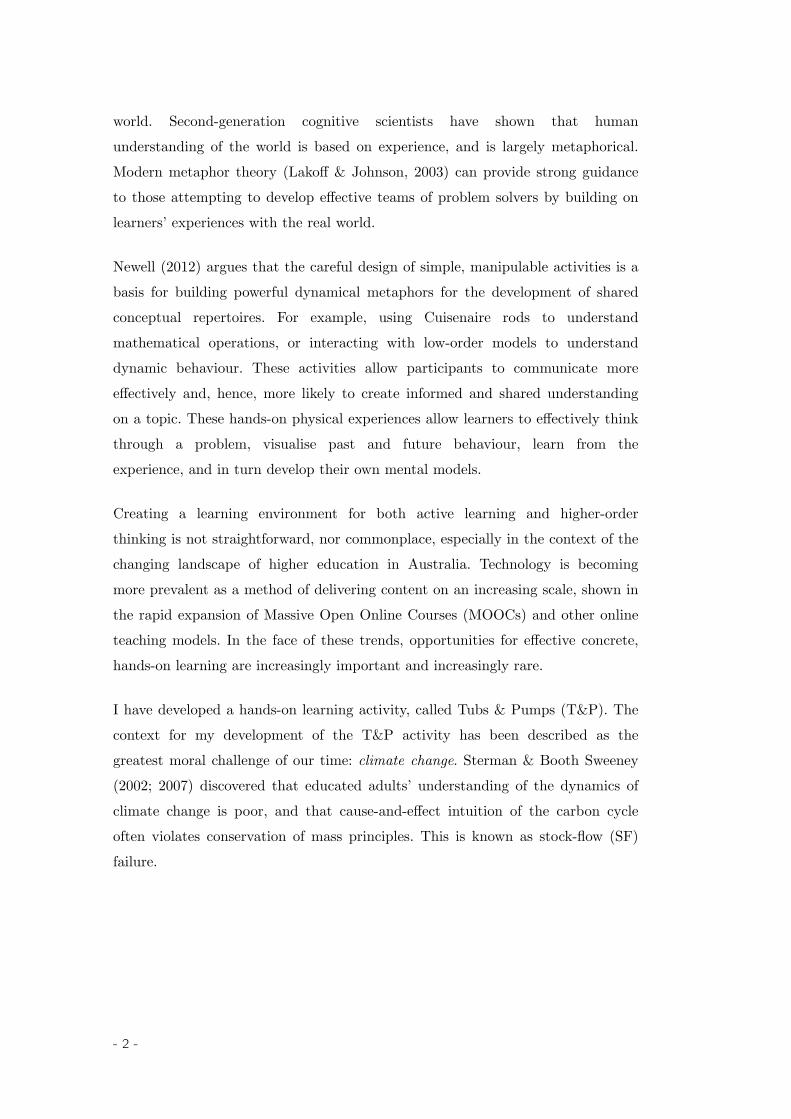
Newell (2012) argues that the careful design of simple, manipulable activities is abasis for building powerful dynamical metaphors for the development of sharedconceptual repertoires. For example, using Cuisenaire rods to understandmathematical operations, or interacting with low-order models to understanddynamic behaviour. These activities allow participants to communicate moreeffectively and, hence, more likely to create informed and shared understandingon a topic. These hands-on physical experiences allow learners to effectively thinkthrough a problem, visualise past and future behaviour, learn from theexperience, and in turn develop their own mental models.
Creating a learning environment for both active learning and higher-orderthinking is not straightforward, nor commonplace, especially in the context of thechanging landscape of higher education in Australia. Technology is becomingmore prevalent as a method of delivering content on an increasing scale, shown inthe rapid expansion of Massive Open Online Courses (MOOCs) and other onlineteaching models. In the face of these trends, opportunities for effective concrete,hands-on learning are increasingly important and increasingly rare.
I have developed a hands-on learning activity, called Tubs & Pumps (T&P). Thecontext for my development of the T&P activity has been described as thegreatest moral challenge of our time: climate change. Sterman & Booth Sweeney(2002; 2007) discovered that educated adults’ understanding of the dynamics ofclimate change is poor, and that cause-and-effect intuition of the carbon cycleoften violates conservation of mass principles. This is known as stock-flow (SF)failure.
- 2 -
People of good faith can debate the costs and benefits ofpolicies to mitigate climate change, but policy should not bebased on mental models that violate the most fundamentalphysical principles. The results suggest the scientificcommunity should devote greater resources to developingpublic understanding of these principles to provide a soundbasis for assessment of climate policy proposals.
- Sterman & Booth Sweeney (2007 p.236)
Further, education in science, engineering or mathematics does not appear toimprove these test results (Sterman 2008). There is a need to re-think theprevailing passive and disconnected approach to STEM (science, technology,engineering and maths) education—from kindergarten through to graduateeducation—in the face of increasingly complex problems, such as climate change.
This thesis is a record of an attempt to improve undergraduate STEM students’understanding of stocks and flows in the carbon cycle, although the principlesand approach has application at all levels of education. Intuition is measuredthrough the participant’s causal insight into the future behaviour of the carbonsystem. I do this through adopting a double-loop learning approach, wherestudents can think, visualise, and improve their understanding through a physicalsimulation experience from which the learner can draw his or her ownconclusions.
1.2 Problem statement
As the Earth’s climate changes, today’s student engineers will be working in anincreasingly complex and uncertain world. Sterman & Booth Sweeney (2002;2007) argue that the public’s poor understanding of climate change mechanismsis in part due to a poor understanding of stock-and-flow dynamics. This assertionholds even for participants who have STEM backgrounds. Sterman (2010) callsfor research into more effective methods to teach dynamics to improve people’sintuitive systems-thinking abilities. This thesis addresses this problem directly.
- 3 -
1.3 Aim and scope of the thesis
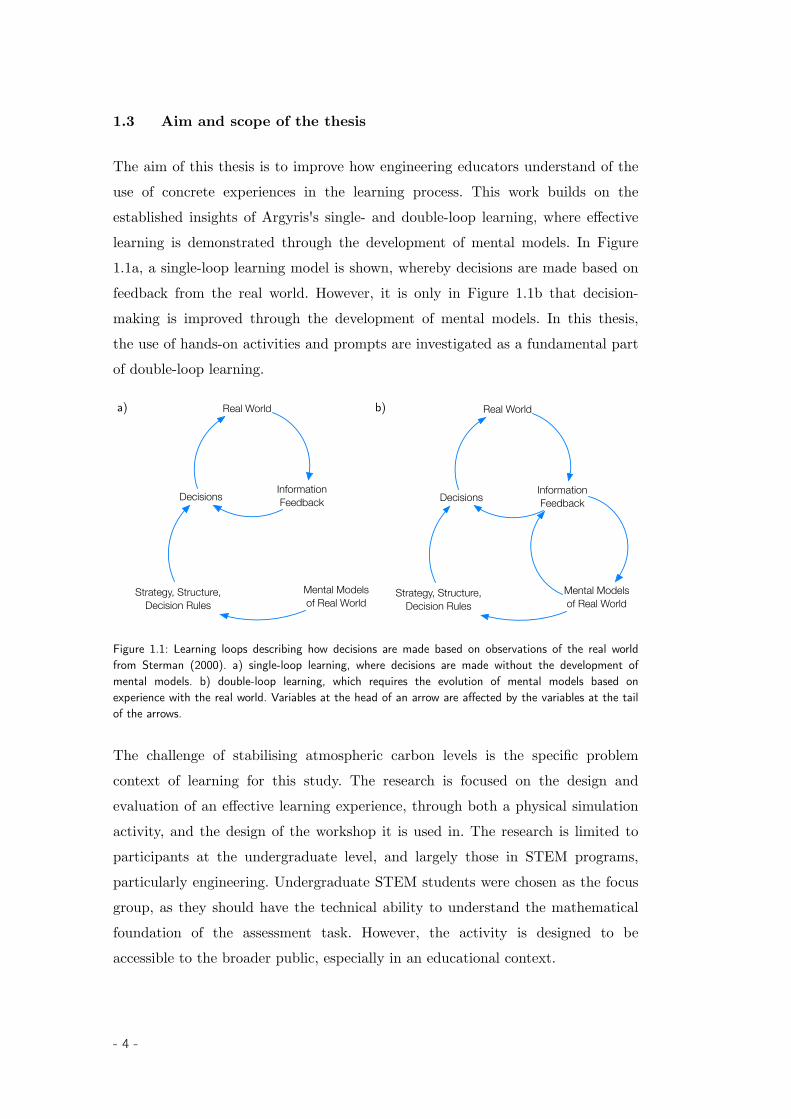
The aim of this thesis is to improve how engineering educators understand of theuse of concrete experiences in the learning process. This work builds on theestablished insights of Argyris's single- and double-loop learning, where effectivelearning is demonstrated through the development of mental models. In Figure1.1a, a single-loop learning model is shown, whereby decisions are made based onfeedback from the real world. However, it is only in Figure 1.1b that decision-making is improved through the development of mental models. In this thesis,the use of hands-on activities and prompts are investigated as a fundamental partof double-loop learning.
a) Real World
InformationFeedbackDecisions
Mental Modelsof Real World
Strategy, Structure,Decision Rules
b) Real World
InformationFeedbackDecisions
Mental Modelsof Real World
Strategy, Structure,Decision Rules
Figure 1.1: Learning loops describing how decisions are made based on observations of the real worldfrom Sterman (2000). a) single-loop learning, where decisions are made without the development ofmental models. b) double-loop learning, which requires the evolution of mental models based onexperience with the real world. Variables at the head of an arrow are affected by the variables at the tailof the arrows.
The challenge of stabilising atmospheric carbon levels is the specific problemcontext of learning for this study. The research is focused on the design andevaluation of an effective learning experience, through both a physical simulationactivity, and the design of the workshop it is used in. The research is limited toparticipants at the undergraduate level, and largely those in STEM programs,particularly engineering. Undergraduate STEM students were chosen as the focusgroup, as they should have the technical ability to understand the mathematicalfoundation of the assessment task. However, the activity is designed to beaccessible to the broader public, especially in an educational context.
- 4 -
1.4 Research questions
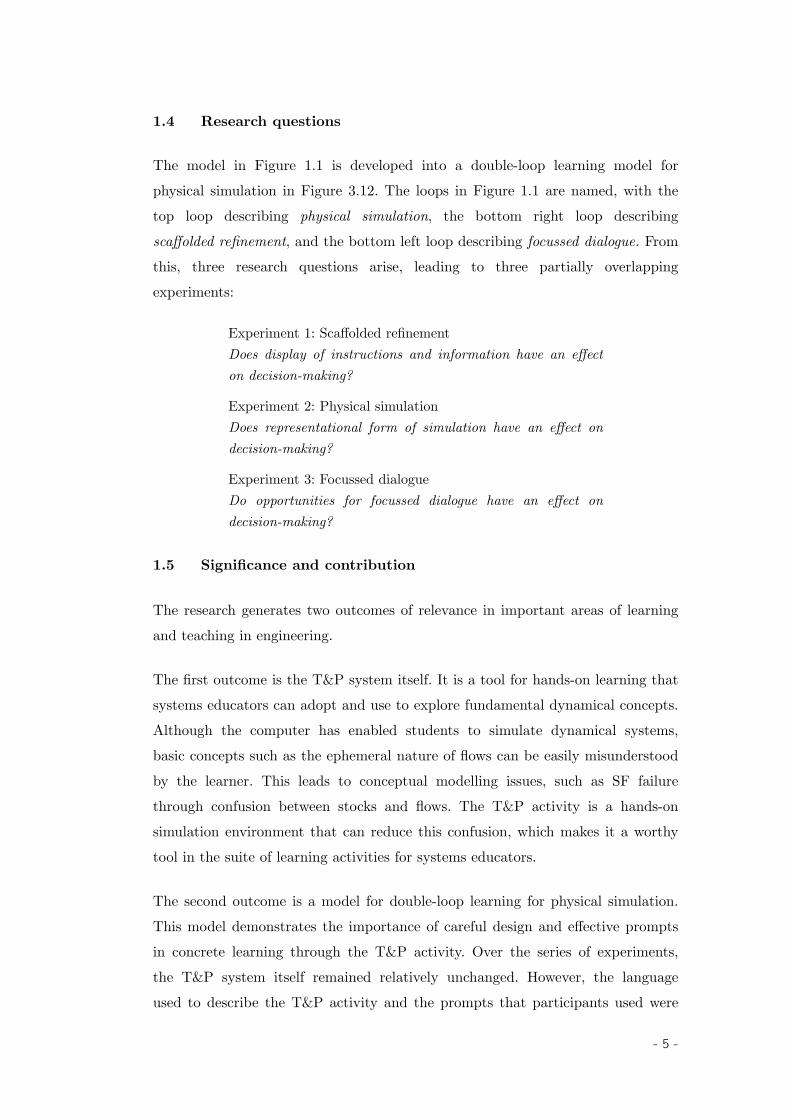
The model in Figure 1.1 is developed into a double-loop learning model forphysical simulation in Figure 3.12. The loops in Figure 1.1 are named, with thetop loop describing physical simulation, the bottom right loop describingscaffolded refinement, and the bottom left loop describing focussed dialogue. Fromthis, three research questions arise, leading to three partially overlappingexperiments:
Experiment 1: Scaffolded refinementDoes display of instructions and information have an effecton decision-making?
Experiment 2: Physical simulationDoes representational form of simulation have an effect ondecision-making?
Experiment 3: Focussed dialogueDo opportunities for focussed dialogue have an effect ondecision-making?
1.5 Significance and contribution
The research generates two outcomes of relevance in important areas of learningand teaching in engineering.
The first outcome is the T&P system itself. It is a tool for hands-on learning thatsystems educators can adopt and use to explore fundamental dynamical concepts.Although the computer has enabled students to simulate dynamical systems,basic concepts such as the ephemeral nature of flows can be easily misunderstoodby the learner. This leads to conceptual modelling issues, such as SF failurethrough confusion between stocks and flows. The T&P activity is a hands-onsimulation environment that can reduce this confusion, which makes it a worthytool in the suite of learning activities for systems educators.
The second outcome is a model for double-loop learning for physical simulation.This model demonstrates the importance of careful design and effective promptsin concrete learning through the T&P activity. Over the series of experiments,the T&P system itself remained relatively unchanged. However, the languageused to describe the T&P activity and the prompts that participants used were
- 5 -
changed. These subtle changes made a significant difference to the way thatstudents completed the exercise, with correct responses ranging from 11% to 76%depending on the prompts used. With the use of effective instructions, I havebeen able to complement the T&P activity with a pedagogical approach that usesprompts and social learning to improve the effectiveness of the activity.
The approach for scaffolding of new concepts for the learner through a concreteactivity is relevant to engineering educators as they continue to challengestudents to become problem-solvers today and into the future.
1.6 Structure of the thesis
This thesis consists of seven chapters, organised into three parts.
Part I. BackgroundPart II. Research ApproachPart III. Synthesis
Part I. Background (Chapters 2 and 3). I introduce the study, and situate it
within the relevant literature. In Chapter 2, I outline a stock-and-flow represen-tation of the carbon cycle. Then I discuss the confusion observed in stock-and-flow thinking, in particular the SF failure around the anthropogenic disruption tothe carbon cycle.
In Chapter 3, I discuss three overlapping perspectives for constructing knowledge:systems thinking, cognitive science and learning & teaching. These theoreticalframeworks provide the background for the design of the T&P activity, andemphasise the importance of active learning environments and situating learningin the physical world. These concepts are of critical importance to studentengineers, especially as they attempt to navigate complex and open-endedproblems.
In Part II. Research Approach (Chapters 4 and 5), I describe the research
methodology. In Chapter 4, I present the T&P system as a simplified model ofthe carbon cycle. I describe the experimental methodology through the design of
- 6 -

the T&P activity, the treatment conditions, assessment tasks, and the coding ofresponses. In Chapter 5, I present summary results, and detailed results for eachexperiment and for each task by treatment condition.
In Part III. Synthesis (Chapters 6 and 7), I take the lessons from the current
study and apply them to engineering education. In Chapter 6, the results of theworkshops are analysed, discussed and expanded in relation to opportunities forenhancing undergraduate engineering education approaches. In Chapter 7, Idiscuss the conclusions and areas of further work arising from this study.
- 7 -

- 8 -
PART I BACKGROUND
Preface
Approaches for constructing shared knowledge of dynamical systems is the focusof Part I. The emphasis on shared knowledge is due to the fact that the problemsfuture engineers will confront are likely to be more complex than an individualcan solve alone.
Simulation models are a useful for engineers to expose their thinking about aproblem before making changes to complex real-world systems. In this thesis, Iinvestigate the use of a physical simulation activity to improve students’ thinkingabout the real-world carbon cycle, an important component of the dynamicEarth system.
Human activity is changing the Earth system to the extent that we have entereda new geological epoch: the Anthropocene (Crutzen, 2002). It is becoming widelyrecognised, and acknowledges a new geological period where human activitieshave a significant global impact on the Earth's ecosystems:
Human influence on the climate system is clear, and recentanthropogenic emissions of greenhouse gases are the highestin history. Recent climate changes have had widespreadimpacts on human and natural systems.
- Stocker et al (2013, p. 15)
The scientific evidence on the anthropogenic disruption to the carbon cycle isclear. However, research shows that the dynamics of the carbon cycle are widelymisunderstood, particularly the interaction between the rate of anthropogeniccarbon emissions and the resultant stock of carbon in the atmosphere. Even well-educated adults often confuse stocks and flows (Sterman & Booth Sweeney, 2002;2007).
- 9 -

In this thesis, I investigate whether the use of a physical simulation activity (theT&P activity) can provide a basis for adults to better understand the cause-and-effect logic in the carbon cycle. The goal of the activity is to allow participants tocorrectly infer the required future trajectory of anthropogenic carbon emissions inorder to stabilise the atmospheric carbon stock.
Part I is organised across two main themes:
Chapter 2: A discussion of the carbon cycle: the real-world context of the
T&P activity. This includes a stock-and-flow representation of the carbon cy-
cle (§2.1) and the previous work that recognised stock-flow (SF) failure (§2.2),
specifically SF failure around the carbon cycle.
Chapter 3: The rationale behind the T&P activity: the physical simulation ac-
tivity used to help participants improve their understanding of the carbon cy-
cle. This includes the background for constructing shared knowledge from
three perspectives: systems thinking (§3.1), cognitive science (§3.2), and
learning & teaching (§3.3).
- 10 -
2 Stock-and-flow thinking and the carbon cycle
To suggest that we’re tackling climate change by building new mines and newpower stations is simply absurd. I mean, it’s like someone who’s drunk at the end ofthe night at a party saying, “Look, I’ve switched to low-alcohol beer now. It’s OK”.
- Richard Denniss (ABC RN Breakfast, 2015)
A fundamental problem for system dynamics educators is helping students todistinguish between stocks and flows. Recently, many studies have highlightedstock-flow (SF) failure in students’ mental models of accumulation, in both linearand non-linear systems (Booth Sweeney & Sterman, 2000; Sterman & BoothSweeney 2002; 2007; Cronin & Gonzalez, 2007; Cronin et al, 2009; Brockhaus etal, 2013; Sedlmeier et al, 2014; Kapmeier, 2004; Kapmeier et al, 2015). Thisconfusion occurs when there is an inconsistency between the perceived behaviourof stocks (an entity that accumulates or depletes over time) when the flows (therate at which that entity changes) are given in a described system.
Of particular concern is SF failure in relation to the anthropogenic additions tothe atmospheric carbon concentration. At the 2007 National Climate ChangeSummit, then Opposition leader Kevin Rudd proclaimed “Climate change is thegreat moral challenge of our generation” (Kelly, 2007). However, studies haveshown that public understanding of the dynamics of climate change is pooramongst even well-educated adults (Sterman & Booth Sweeney 2002; 2007).
In this chapter, I describe the dynamics of the carbon cycle in stocks and flows. Ithen describe the current arguments in the area of SF failure and testing ofaccumulation principles. Then I introduce the previous work investigatingspecifically SF failure in relation to the carbon cycle. This leads to Chapter 3,where I describe the background theory for T&P activity.
2.1 Dynamics of the carbon cycle
The carbon cycle is one part of the complex and changing Earth system.Rockström et al (2009) argue that the Earth system has been pushed into ahigher-risk area with respect to a number of planetary boundaries, includinglevels of biodiversity loss, the nitrogen cycle and climate change. The 2015
- 11 -

update of their work (Steffen et al, 2015) add the phosphorous cycle andchanging land-use as higher-risk systems. These systems at higher-risk increasethe uncertainty of the functioning and resilience of the Earth system.
The effects of this change on the Earth system are many. In the Fifth AssessmentReport of the Intergovernmental Panel on Climate Change (IPCC), the changesthat are expected to occur towards the late 21st century are described as:
Virtually certain- warmer and/or fewer cold days and nights over most land areas- warmer and/or more frequent hot days and nights over most land areas
Very likely- warm spells/heat waves. Frequency/duration increases over most land areas- heavy precipitation events. Increase in the frequency/intensity/amount- increased incidence and/or magnitude of extreme high sea levelLikely- increases in intensity and/or duration of drought
- Stocker et al (2013)
There are a number of indicators that are used to measure the state of theclimate system at various locations around the globe. These include land andocean temperatures, precipitation rates, land-mass snow cover, extent of Arcticice, ocean heat content, sea level change, the operation of the carbon cycle andother biogeochemical cycles. In this thesis, the carbon cycle is the only system ofinterest, specifically the anthropogenic disruption to the carbon cycle due toburning fossil fuels.
2.1.1 The carbon cycle in stocks and flows
In system dynamics terminology, a ‘stock’ is a state variable, such as the amountof money in a bank account, the number of people in a department store, thenumber of trees in a forest, the value of an inventory, the amount of energyproduced by a solar panel, or the reputation of a politician. The level of the stockis controlled by the ‘flows’ which add to or remove from it. For example, the
- 12 -

amount of money in a bank account is controlled by the flow of deposits andwithdrawals; the number of people in a department store at any one time isdetermined by the number of people entering and leaving the store.
The major stocks and flows, as identified and quantified in the IPCC’s FourthAssessment Report, are shown in Figure 2.1. The diagram shows the naturalcarbon stocks and flows and the anthropogenic perturbation of these stocks andflows. The quantities shown are as estimated in the mid-1990s.
Figure 2.1: Box diagram of Earth’s carbon cycle (Barker et al, 2007 Figure 7.3). Stocks (reservoirs) areshown as rectangular blocks; flows (fluxes) are indicated by arrows. Black numbers and arrows representthe natural cycle prior to anthropogenic influence. Red arrows and numbers indicate the anthropogenicperturbation.
Figure 2.1, although a simplification, shows the major flows of carbon around thesystem. The unit used to describe the stocks is gigatons of carbon (GtC) and theunit for flows is gigatons of carbon per year (GtC/year). The atmospheric CO2
concentration is often reported using the unit parts per million by volume(ppmv). Ppmv of CO2 can be converted to GtC using the ratio 1ppm(atmospheric CO2) : 2.13 (GtC).
- 13 -

The diagram shows a system that is largely in balance, with additions to andremovals from each stock largely cancelling out. There are, however, smallimbalances. Consider the flows directly connected to the atmospheric stock asseen in Figure 2.1. The natural cycle is in balance, with a circulation of approxi-mately 190.2 GtC/year. The anthropogenic disturbance upsets this balance, witha net amount of 3.2 GtC/year added to the atmosphere, mainly due to the 6.4GtC/year added through the burning of fossil fuels.
Further, the rate of flows is changing, with the increased rate of burning fossilfuels. Feedback behaviour will also change the relationships in the carbon cycle;for example, as the global surface temperature increases, the temperature of theocean increases, and its capacity to absorb carbon reduces.
In stock-and-flow notation, stocks are represented by rectangular boxes. Aninflow is represented by an arrow pointing into a stock, and an outflow isrepresented by an arrow pointing out of a stock. The flows are represented byvalves (taps), and clouds represent sources or sinks that are outside the system ofinterest. Variables are connected via influence links (arrows), which determine thenature of the relationships between the variables. Mathematical equations sitbehind this graphical representation, and determine the relationships between thevariables in a stock-and-flow diagram, allowing the model to be simulated overtime.
Sterman (2000, p. 246 after Fiddaman 1997; Sterman & Booth Sweeney 2002, p.213) presents a stock-and-flow model of the carbon cycle and its influence on theglobal heat balance. This model is shown in Figure 2.2, depicting the majorstocks of carbon, the flows between these stocks and their relationship toatmospheric heat balance.
- 14 -
Flux Atmosphereto Ocean
Net CarbonFluxto Deep Ocean
Flux Atmosphereto Biomass
Flux Humus toAtmosphere
Flux Humusto Biomass
Flux Oceanto Atmosphere
Deep OceanTemperature
+
+
−
NetRadiativeForcing
−
+
+
B
B
B
+
Heat Stored inDeep Ocean
+
Insolation
Heat Stored inAtmosphere
& Upper Ocean
Carbon inMixed Layer
Carbon inBiomass
Carbon inHumus
Flux Biomassto Atmosphere
Flux Biomassto Humus
Carbon inDeep Ocean
Carbon in Atmosphere
TemperatureDifference
FossilCarbon
Fossil FuelConsumption
Atmosphere& Upper Ocean
Temperature
HeatExchangebetween
Surface andDeep Ocean
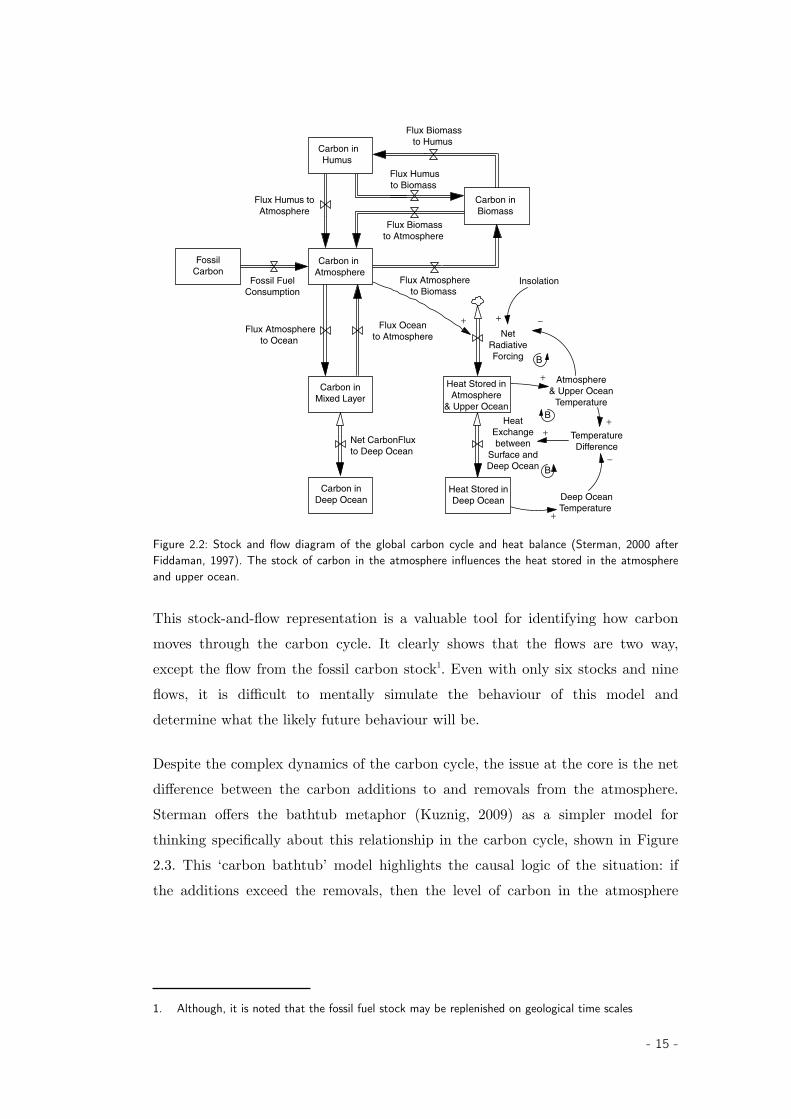
Figure 2.2: Stock and flow diagram of the global carbon cycle and heat balance (Sterman, 2000 afterFiddaman, 1997). The stock of carbon in the atmosphere influences the heat stored in the atmosphereand upper ocean.
This stock-and-flow representation is a valuable tool for identifying how carbonmoves through the carbon cycle. It clearly shows that the flows are two way,except the flow from the fossil carbon stock1. Even with only six stocks and nineflows, it is difficult to mentally simulate the behaviour of this model anddetermine what the likely future behaviour will be.
Despite the complex dynamics of the carbon cycle, the issue at the core is the netdifference between the carbon additions to and removals from the atmosphere.Sterman offers the bathtub metaphor (Kuznig, 2009) as a simpler model forthinking specifically about this relationship in the carbon cycle, shown in Figure2.3. This ‘carbon bathtub’ model highlights the causal logic of the situation: ifthe additions exceed the removals, then the level of carbon in the atmosphere
1. Although, it is noted that the fossil fuel stock may be replenished on geological time scales
- 15 -
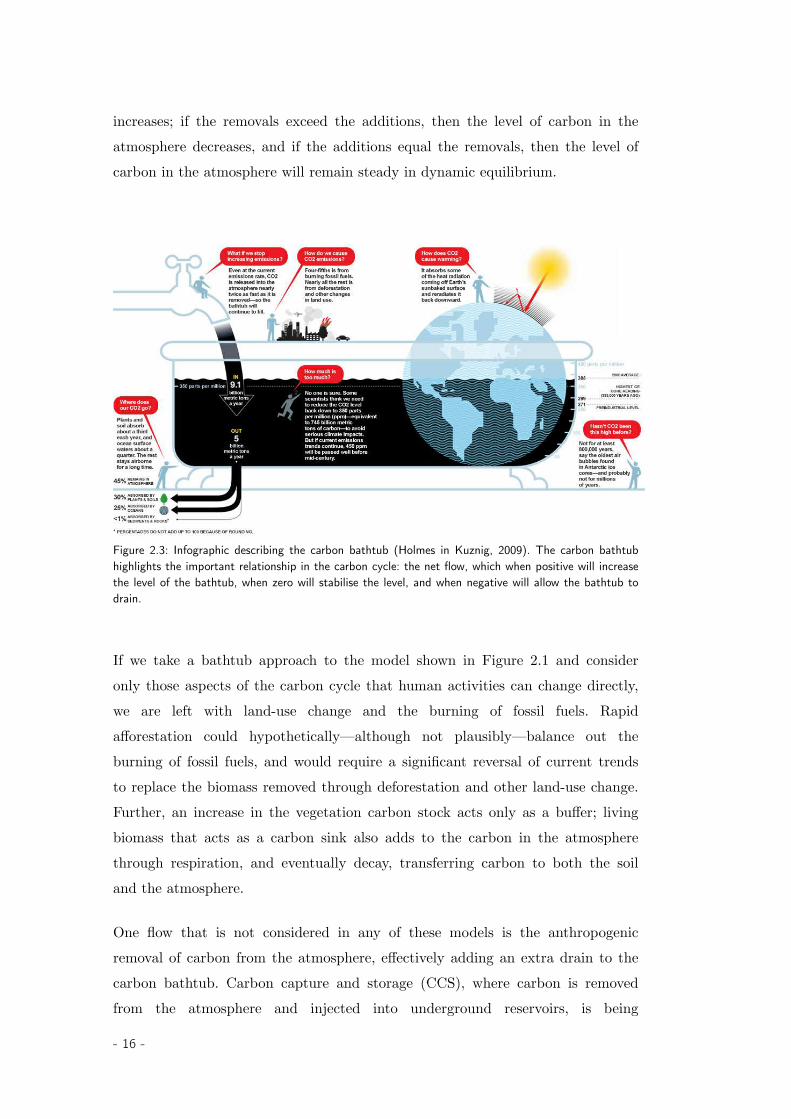
increases; if the removals exceed the additions, then the level of carbon in theatmosphere decreases, and if the additions equal the removals, then the level ofcarbon in the atmosphere will remain steady in dynamic equilibrium.
Figure 2.3: Infographic describing the carbon bathtub (Holmes in Kuznig, 2009). The carbon bathtubhighlights the important relationship in the carbon cycle: the net flow, which when positive will increasethe level of the bathtub, when zero will stabilise the level, and when negative will allow the bathtub todrain.
If we take a bathtub approach to the model shown in Figure 2.1 and consideronly those aspects of the carbon cycle that human activities can change directly,we are left with land-use change and the burning of fossil fuels. Rapidafforestation could hypothetically—although not plausibly—balance out theburning of fossil fuels, and would require a significant reversal of current trendsto replace the biomass removed through deforestation and other land-use change.Further, an increase in the vegetation carbon stock acts only as a buffer; livingbiomass that acts as a carbon sink also adds to the carbon in the atmospherethrough respiration, and eventually decay, transferring carbon to both the soiland the atmosphere.
One flow that is not considered in any of these models is the anthropogenicremoval of carbon from the atmosphere, effectively adding an extra drain to thecarbon bathtub. Carbon capture and storage (CCS), where carbon is removedfrom the atmosphere and injected into underground reservoirs, is being
- 16 -

considered by some as a high-tech solution to restoring the carbon balance. TheIPCC (2005) discuss the plausibility of geological and oceanic storage methods.Conceivably, if carbon could be captured at the point of emission, or even suckedout of the atmosphere, then balance could be restored. However:
All models indicate that CCS systems are unlikely to bedeployed on a large scale in the absence of an explicit policythat substantially limits greenhouse gas emissions to theatmosphere.
- IPCC (2005 p.43)
Further, there are many gaps in knowledge about how CCS will affect the Earthsystem, especially in the example of deep ocean carbon storage. With suchuncertainty, it would be dangerous to consider this as a solution to reducing thestock of carbon in the atmosphere. Further, doing so could lead to reducedattention to strategies for mitigation.
Carbon-bathtub thinking then leaves only one viable option to stop theatmospheric carbon concentration from increasing: reduce the burning of fossilfuels immediately to zero. A key insight from this observation is that this actionwill only stop the stock of atmospheric carbon from increasing, and will notreduce it on the required time scale.
This is the educational challenge: participants in the T&P activity should be ableto use the system as a physical analogue to think through this problem by experi-encing the interaction over time of stocks and flows. This should help them torealise that the atmospheric carbon stock will continue to rise unless the anthro-pogenic carbon emissions decrease to zero.
2.1.2 Anthropogenic carbon emissions over time
In the simplified carbon bathtub, the natural cycle is largely in dynamicequilibrium. The anthropogenic disruption to the carbon cycle through burningfossil fuels is the primary difference. However, the rate of annual anthropogeniccarbon emissions has been growing since the industrial revolution and rapidlysince the end of the Second World War.
- 17 -
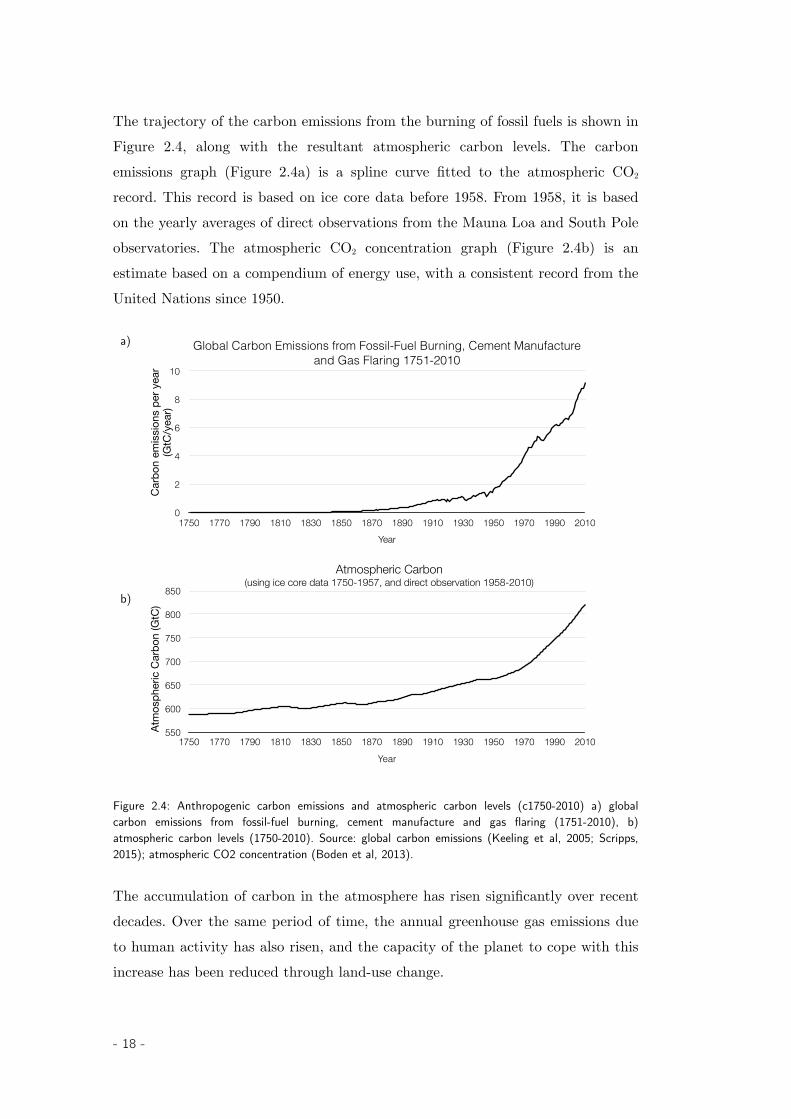
The trajectory of the carbon emissions from the burning of fossil fuels is shown inFigure 2.4, along with the resultant atmospheric carbon levels. The carbonemissions graph (Figure 2.4a) is a spline curve fitted to the atmospheric CO2
record. This record is based on ice core data before 1958. From 1958, it is basedon the yearly averages of direct observations from the Mauna Loa and South Poleobservatories. The atmospheric CO2 concentration graph (Figure 2.4b) is anestimate based on a compendium of energy use, with a consistent record from theUnited Nations since 1950.
a)
550
600
650
700
750
800
850
Year
1750 1770 1790 1810 1830 1850 1870 1890 1910 1930 1950 1970 1990 2010
0
2
4
6
8
10
Year1750 1770 1790 1810 1830 1850 1870 1890 1910 1930 1950 1970 1990 2010
Global Carbon Emissions from Fossil-Fuel Burning, Cement Manufacture and Gas Flaring 1751-2010
Atmospheric Carbon (using ice core data 1750-1957, and direct observation 1958-2010)
Carb
on e
miss
ions
per
yea
r(G
tC/y
ear)
Atm
osph
eric
Car
bon
(GtC
)b)
Figure 2.4: Anthropogenic carbon emissions and atmospheric carbon levels (c1750-2010) a) globalcarbon emissions from fossil-fuel burning, cement manufacture and gas flaring (1751-2010), b)atmospheric carbon levels (1750-2010). Source: global carbon emissions (Keeling et al, 2005; Scripps,2015); atmospheric CO2 concentration (Boden et al, 2013).
The accumulation of carbon in the atmosphere has risen significantly over recentdecades. Over the same period of time, the annual greenhouse gas emissions dueto human activity has also risen, and the capacity of the planet to cope with thisincrease has been reduced through land-use change.
- 18 -
What will happen to the future atmospheric carbon concentration is of majorconcern to scientists and policy-makers alike. The argument about planetaryboundaries put forward in Rockström et al (2009) is primarily that the goalshould be to keep all Earth’s systems in balance. When any of the boundaries areexceeded, it puts at risk the other components of the system. Given the currentcircumstances, a 2°C temperature rise is considered to be both the upper limit ofthis safe operating space, but also a best-case scenario. In 2009, the CopenhagenAccord recognised the extent of the problem2:
We underline that climate change is one of the greatestchallenges of our time. We emphasise our strong politicalwill to urgently combat climate change in accordance withthe principle of common but differentiated responsibilitiesand respective capabilities. To achieve the ultimate objectiveof the Convention to stabilize greenhouse gas concentrationin the atmosphere at a level that would prevent dangerousanthropogenic interference with the climate system, we shall,recognizing the scientific view that the increase in globaltemperature should be below 2 degrees Celsius, on the basisof equity and in the context of sustainable development,enhance our long-term cooperative action to combat climatechange. We recognize the critical impacts of climate changeand the potential impacts of response measures on countriesparticularly vulnerable to its adverse effects and stress theneed to establish a comprehensive adaptation programmeincluding international support.
- UNFCCC (2009, p.1)
Despite this apparent political consensus, action has been lacklustre. Politicalarguments aside, a best-case benchmark for all negotiations is bringing anthro-pogenic emissions back to 1990 levels by (or after) 2020. In 1990, approximately6.1 gigatons of carbon were released into the atmosphere (Keeling et al, 2005),which is still a significant annual addition to the atmosphere.
2. This sentiment is extended in the outcomes of CoP21 in Paris, in which climate change isrecognised as an “urgent and potentially irreversible threat to human societies and the planet”, thaturgent “deep reductions in global emissions will be required”, that the social and political circumstancesshould consider obligations to human rights and equity across a range of issues, and that there is an“urgent need to address the significant gap between the aggregate effect of Parties’ mitigation pledges interms of global annual emissions of greenhouse gases by 2020 and aggregate emission pathways”.(UNFCC, 2015 p.1-2)
- 19 -

Cumulative emissions of CO2 largely determine global meansurface warming by the late 21st century and beyond. Mostaspects of climate change will persist for many centurieseven if emissions of CO2 are stopped. This represents asubstantial multi-century climate change commitmentcreated by past, present and future emissions of CO2.
- Stocker et al (2013 p.27)
The problem is, as described, the greatest moral challenge of our generation.
2.2 Stock-flow (SF) failure
In this section, I outline the recent work in the area of SF failure, beforedescribing SF failure in relation to the carbon cycle.
Previous work around SF failure focusses on testing understanding of systemsthrough either identifying features of the system, such as the point in time that astock is at its minimum or maximum level, or by visually integrating the flows toshow the behaviour over time of the stock. Studies examining SF failure to datehave largely shown that participants have a poor intuitive understanding of thedynamics in stock-and-flow systems. Notable findings are that:
• highly educated adults have a poor understanding of simple stock-and-flowproblems, and results often violate the law of conservation of mass (BoothSweeney & Sterman, 2000; Sterman & Booth Sweeney, 2002; 2007; Cronin &Gonzalez, 2007), such as the belief that an increase in the rate of flows wouldlead to a stabilisation of the accumulation (see the correlation heuristic inFigure 2.5).
• varying testing formats shows little demonstrated improvement ofunderstanding; for example, using graphs, multiple choice or writtendescriptions (Sterman & Booth Sweeney, 2002; 2007; Cronin & Gonzalez, 2007;Cronin et al, 2009) or describing flows as succession of discrete stocks(Brockhaus et al, 2013; Sedlmeier et al, 2014)
- 20 -
• varying cover stories of similar dynamic systems shows little improvement ofunderstanding; for example, using everyday examples such as water in abathtub, money in a bank account, or people in department store (Kapmeier,2004, Cronin & Gonzalez, 2007; Cronin et al, 2009; Kapmeier et al, 2015)
In the previous work listed above, a small amount of priming is typically given,and participants use their experience of the real world to inform a decision duringan assessment exercise. Typically, the exercise itself does not prompt theparticipant to question, orientate or improve their mental model of the problemprior to assessment.
There are, however, some promising observations in testing SF failure. Cronin etal (2009) note that outcome feedback helps students to achieve the correctanswer, but that improvement is gradual. Formal system dynamics instructionimproves understanding of stock-and-flow systems; however, a minority ofstudents after graduate-level training in system dynamics still appear to beconfused by stocks and flows (Sterman 2010).
A brief summary of this previous work is shown in Table 2.1. Here, test typedescribes the context of the study for reference. A common approach in thesestudies is to provide a range of assessment tasks which involve “calculus withoutmathematics” through graphical integration and differentiation (as described inSterman, 2000 §7.1). Success rates, typically defined as the proportion of studentsproviding a correct response, show the range (low to high) of correct results fortreatment conditions in the given task.
Table 2.1 should not be seen as a leaderboard, as there is no common or standardapproach between the studies, even between studies with similar authorship. Thisis, perhaps, because the goals and approach of each activity are different, and thethreshold for the reporting of correct responses varies. Further, the assessmenttasks vary in difficulty, and were targeted at different groups of students. Table2.1 does, however, provide an indication of the previous work and challenges inthis area.
- 21 -
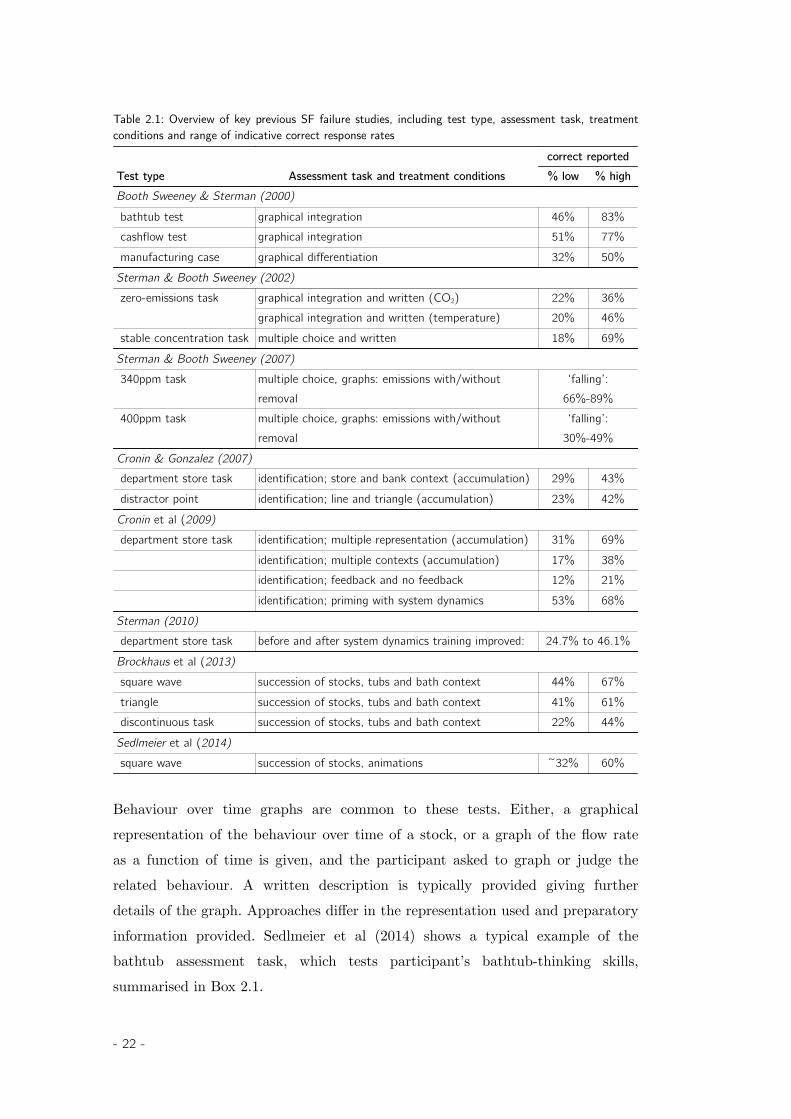
Table 2.1: Overview of key previous SF failure studies, including test type, assessment task, treatmentconditions and range of indicative correct response rates
Test type Assessment task and treatment conditionscorrect reported% low % high
Booth Sweeney & Sterman (2000) bathtub test graphical integration 46% 83% cashflow test graphical integration 51% 77% manufacturing case graphical differentiation 32% 50%Sterman & Booth Sweeney (2002) zero-emissions task graphical integration and written (CO2) 22% 36%
graphical integration and written (temperature) 20% 46% stable concentration task multiple choice and written 18% 69%Sterman & Booth Sweeney (2007) 340ppm task multiple choice, graphs: emissions with/without
removal‘falling’:
66%-89% 400ppm task multiple choice, graphs: emissions with/without
removal‘falling’:
30%-49%Cronin & Gonzalez (2007) department store task identification; store and bank context (accumulation) 29% 43% distractor point identification; line and triangle (accumulation) 23% 42%Cronin et al (2009) department store task identification; multiple representation (accumulation) 31% 69%
identification; multiple contexts (accumulation) 17% 38%identification; feedback and no feedback 12% 21%identification; priming with system dynamics 53% 68%
Sterman (2010) department store task before and after system dynamics training improved: 24.7% to 46.1%Brockhaus et al (2013) square wave succession of stocks, tubs and bath context 44% 67% triangle succession of stocks, tubs and bath context 41% 61% discontinuous task succession of stocks, tubs and bath context 22% 44%Sedlmeier et al (2014) square wave succession of stocks, animations ~32% 60%
Behaviour over time graphs are common to these tests. Either, a graphicalrepresentation of the behaviour over time of a stock, or a graph of the flow rateas a function of time is given, and the participant asked to graph or judge therelated behaviour. A written description is typically provided giving furtherdetails of the graph. Approaches differ in the representation used and preparatoryinformation provided. Sedlmeier et al (2014) shows a typical example of thebathtub assessment task, which tests participant’s bathtub-thinking skills,summarised in Box 2.1.
- 22 -
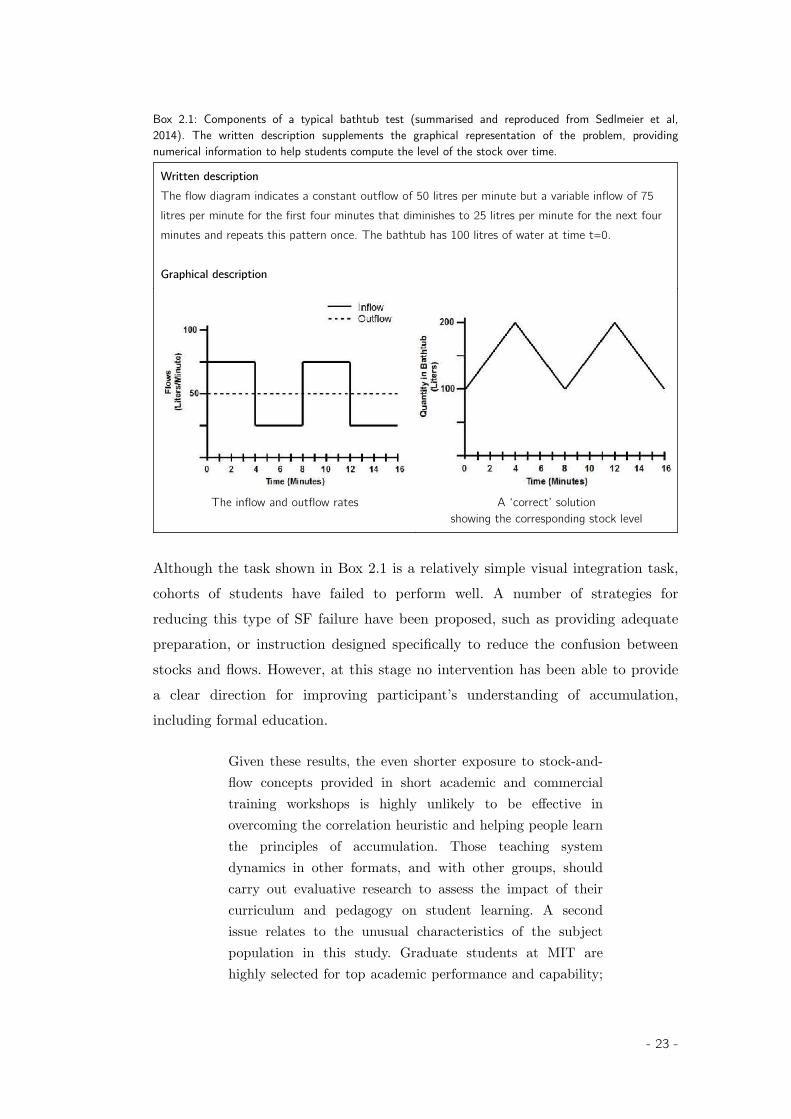
Box 2.1: Components of a typical bathtub test (summarised and reproduced from Sedlmeier et al,2014). The written description supplements the graphical representation of the problem, providingnumerical information to help students compute the level of the stock over time.
Written descriptionThe flow diagram indicates a constant outflow of 50 litres per minute but a variable inflow of 75 litres per minute for the first four minutes that diminishes to 25 litres per minute for the next four minutes and repeats this pattern once. The bathtub has 100 litres of water at time t=0.
Graphical description
The inflow and outflow rates A ‘correct’ solutionshowing the corresponding stock level
Although the task shown in Box 2.1 is a relatively simple visual integration task,cohorts of students have failed to perform well. A number of strategies forreducing this type of SF failure have been proposed, such as providing adequatepreparation, or instruction designed specifically to reduce the confusion betweenstocks and flows. However, at this stage no intervention has been able to providea clear direction for improving participant’s understanding of accumulation,including formal education.
Given these results, the even shorter exposure to stock-and-flow concepts provided in short academic and commercialtraining workshops is highly unlikely to be effective inovercoming the correlation heuristic and helping people learnthe principles of accumulation. Those teaching systemdynamics in other formats, and with other groups, shouldcarry out evaluative research to assess the impact of theircurriculum and pedagogy on student learning. A secondissue relates to the unusual characteristics of the subjectpopulation in this study. Graduate students at MIT arehighly selected for top academic performance and capability;
- 23 -

they have far more training in STEM and other quantitativedisciplines (economics, business) than the average person.Still their understanding of stocks and flows prior toexposure to the course is extremely poor. Further researchinto the failure of the educational system to provide suchbasic concepts, and effective methods to teach these conceptsin the K-12 grades, is sorely needed.
- Sterman (2010, p. 331)
There is a passionate movement for teaching systems thinking from an early agein the American education system (K-12). Forrester (2009) tells us that “anychild who can fill a water glass or take toys from a playmate knows” aboutaccumulation. Draper’s experience of teaching high-school physics, includingtopics such as thermodynamics, using stocks leads him to think:
Systems thinking, like any thinking paradigm, should beinvisible—a natural way that people think about the world.In Barry Richmond’s words, it should be “the water we swimin.” Just as most of us don’t really deliberately choose to useinductive reasoning for a specific problem and deductivereasoning for a different problem (we just figure stuff out),people do not have to consciously know that they are usingsystems thinking for any particular problem. Instead, weshould always be thinking in terms of feedback and circularcausality. This principle also has to be applied to theteaching and to the learning of systems thinking and systemdynamics. People do not have to know they are learningabout the science of systems thinking or system dynamics.They just need to be taught, from the beginning, that theworld around is in made of dynamic, interconnected systemsand that there are tools we can use to understand thesedynamic relationships.
- Draper (2010, p. 53)
Some innovative teachers have described their efforts to teach stocks and flows inearly primary school. For example, Benson (2010) describes primary schoolstudents drawing stock-and-flow models using stocks such as amount of soup in apot, the number of passengers on a trolley car, the courage a protagonistdevelops in a story, and the number of people visiting a zoo. LaVigne et al (2015)describe the construction of shared metaphors using behaviour over time graphs
- 24 -
amongst preschool children. For example, a storyline that oscillates between goodand bad is a ‘crown’ story. Students transfer this metaphor to their everydayexperience: “I’m having a ‘crown’ day.”
Previous work from the system dynamics community has shown that the carboncycle is a topic where innovative teaching methods are needed to address SFfailure.
2.2.1 SF failure and the carbon cycle
Developing an intuitive understanding about the dynamics of accumulation ofcarbon in the atmosphere is the specific problem that the T&P activity examines.Sterman & Booth Sweeney’s work (2002; 2007) shows that there is confusionbetween the rate of flows of carbon into the atmosphere and the correspondingchanges in the level of the stock of carbon in the atmosphere. This confusion cancontribute to poor policy decisions, such as the belief that a reduction of the rateof carbon emissions will also lead to a correlated reduction of the atmosphericcarbon concentration.
Sterman & Booth Sweeney’s work considered many scenarios around thedynamics of the climate system, including the accumulation of CO2 in theatmosphere and the global temperature changes resulting from increasedradiative forcing. The CO2 tasks involved questioning participants about therequired action to stabilise the atmospheric carbon concentration at differentlevels with and without consideration of removal of carbon from the atmosphere.
Sterman & Booth Sweeney (2007) used a stable concentration task at 340ppmand 400ppm with three conditions: multiple choice (MC), an emissions graph(EG), and an emissions and removal graph (ER). The graph shown in Figure 2.5is modelled on their 400ppm EG task. The task asks the participant to sketch thetrajectory of future anthropogenic carbon emissions (the bottom graph) given aprojected atmospheric carbon concentration (the top graph).
- 25 -
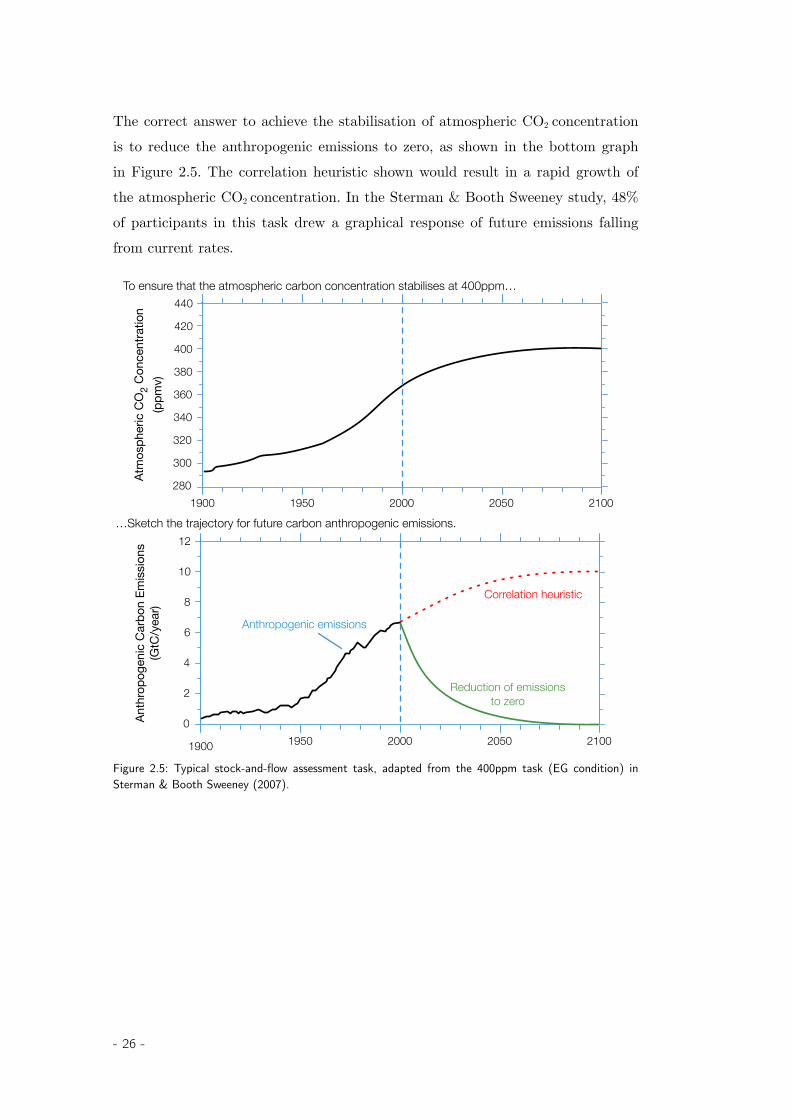
The correct answer to achieve the stabilisation of atmospheric CO2 concentrationis to reduce the anthropogenic emissions to zero, as shown in the bottom graphin Figure 2.5. The correlation heuristic shown would result in a rapid growth ofthe atmospheric CO2 concentration. In the Sterman & Booth Sweeney study, 48%of participants in this task drew a graphical response of future emissions fallingfrom current rates.
440
420
400
380
360
340
320
300
2801900 1950 2000 2050 2100
Atm
osph
eric
CO
2 Co
ncen
tratio
n(p
pmv)
12
10
8
6
4
2
0
1900 1950 2000 2050 2100
Anthropogenic emissions
Anth
ropo
geni
c Ca
rbon
Em
issio
ns(G
tC/y
ear)
…Sketch the trajectory for future carbon anthropogenic emissions.
To ensure that the atmospheric carbon concentration stabilises at 400ppm…
Reduction of emissionsto zero
Correlation heuristic
Figure 2.5: Typical stock-and-flow assessment task, adapted from the 400ppm task (EG condition) inSterman & Booth Sweeney (2007).
- 26 -

Further, Sterman & Booth Sweeney observed the correlation heuristic in the340ppm task, where the atmospheric CO2 concentration falls rapidly from 2000levels to 340ppm. 79% of participants drew a trajectory that had carbonemissions falling in a similar shape. However, to achieve a reduction in theatmospheric CO2 concentration, the carbon emissions would have to fall belowzero. This example demonstrates the prevalence of SF failure in the area. Resultsfor their ER condition, where a removals trajectory was also considered, showedfurther confusion, leading to their concern about SF failure in relation to thecarbon cycle.
Rather than varying the scenarios as in the previous work, the T&P activity willfocus on the single 400ppm EG task shown in Figure 2.5, and instead I will varythe educational approaches to investigate whether participants can reach thecorrect solution through double-loop learning.
- 27 -

- 28 -
3 Constructing shared knowledge
The perceived threat from exposing our thinking starts early in lifeand, for most of us, is steadily reinforced in school—remember the trauma
of being called on and not having the “right answer”—and later in work.
- Peter Senge (2006)
As Sterman & Booth-Sweeney (2002; 2007) note, adopting a wait-and-seeapproach about climate change is likely when the dynamics of the carbon cycleare not well understood. In this chapter, I provide the background rationale forusing the T&P activity to address Sterman’s (2010) call for effective methods toteach stock-and-flow concepts.
There are three overlapping perspectives through which the background ispresented. The first is the systems thinking (ST) perspective, specifically withimproving the ST capabilities of the educated public. Second, approaches incognitive science (CS) explain how our understanding of the world is influencedby conceptual metaphors and how knowledge is framed through our embodiedmind. And third, approaches in learning and teaching (L&T) provide inspirationfor a new way of framing ST learning. ST is, at its simplest, an approach forinterpreting the world, just as the theoretical foundations of the design sciences,physical sciences and the social sciences are.
Although theoretical underpinnings of the three differ significantly, there is anintersection of ideas when it comes to understanding how knowledge isconstructed through experience with the real world.
Take, for example, these observations from the different fields:
Systems Thinking observationsAny child who can fill a water glass or take toys from aplaymate knows what accumulation means. (Forrester, 2009)
If you have had much experience with a bathtub, youunderstand the dynamics of stocks and flows. (Meadows,2008)
- 29 -
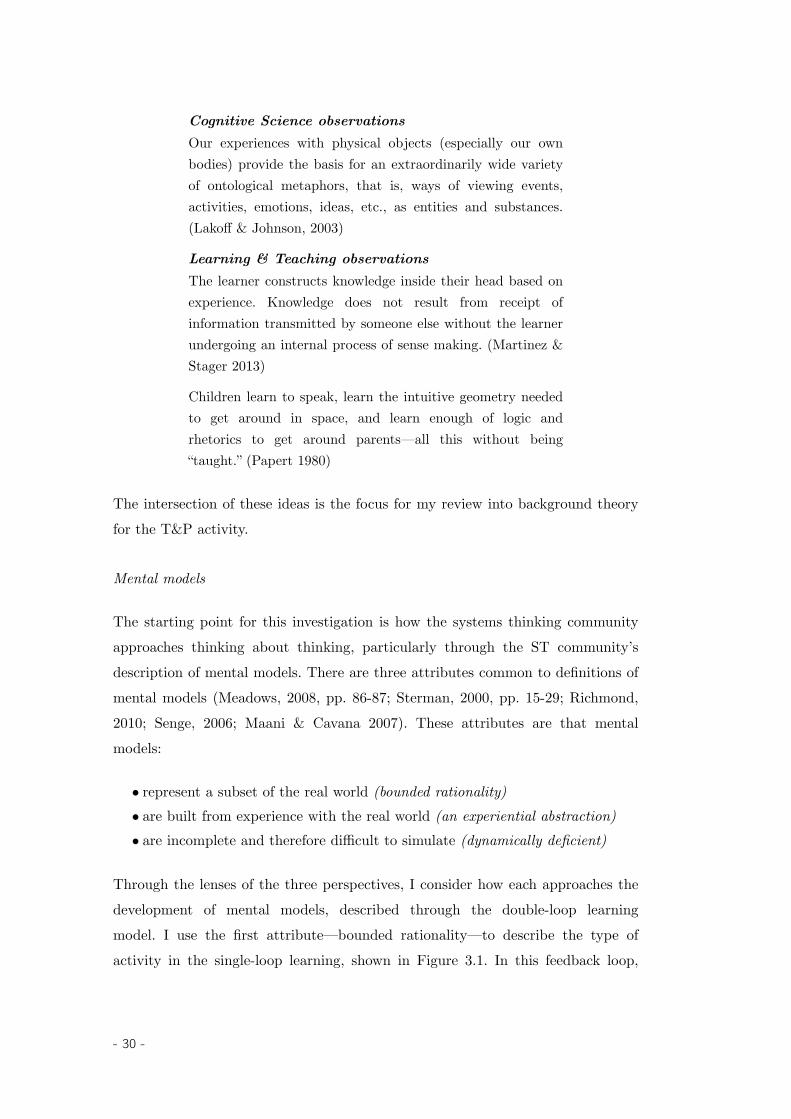
Cognitive Science observationsOur experiences with physical objects (especially our ownbodies) provide the basis for an extraordinarily wide varietyof ontological metaphors, that is, ways of viewing events,activities, emotions, ideas, etc., as entities and substances.(Lakoff & Johnson, 2003)
Learning & Teaching observationsThe learner constructs knowledge inside their head based onexperience. Knowledge does not result from receipt ofinformation transmitted by someone else without the learnerundergoing an internal process of sense making. (Martinez &Stager 2013)
Children learn to speak, learn the intuitive geometry neededto get around in space, and learn enough of logic andrhetorics to get around parents—all this without being“taught.” (Papert 1980)
The intersection of these ideas is the focus for my review into background theoryfor the T&P activity.
Mental models
The starting point for this investigation is how the systems thinking communityapproaches thinking about thinking, particularly through the ST community’sdescription of mental models. There are three attributes common to definitions ofmental models (Meadows, 2008, pp. 86-87; Sterman, 2000, pp. 15-29; Richmond,2010; Senge, 2006; Maani & Cavana 2007). These attributes are that mentalmodels:
• represent a subset of the real world (bounded rationality)• are built from experience with the real world (an experiential abstraction)• are incomplete and therefore difficult to simulate (dynamically deficient)
Through the lenses of the three perspectives, I consider how each approaches thedevelopment of mental models, described through the double-loop learningmodel. I use the first attribute—bounded rationality—to describe the type ofactivity in the single-loop learning, shown in Figure 3.1. In this feedback loop,
- 30 -
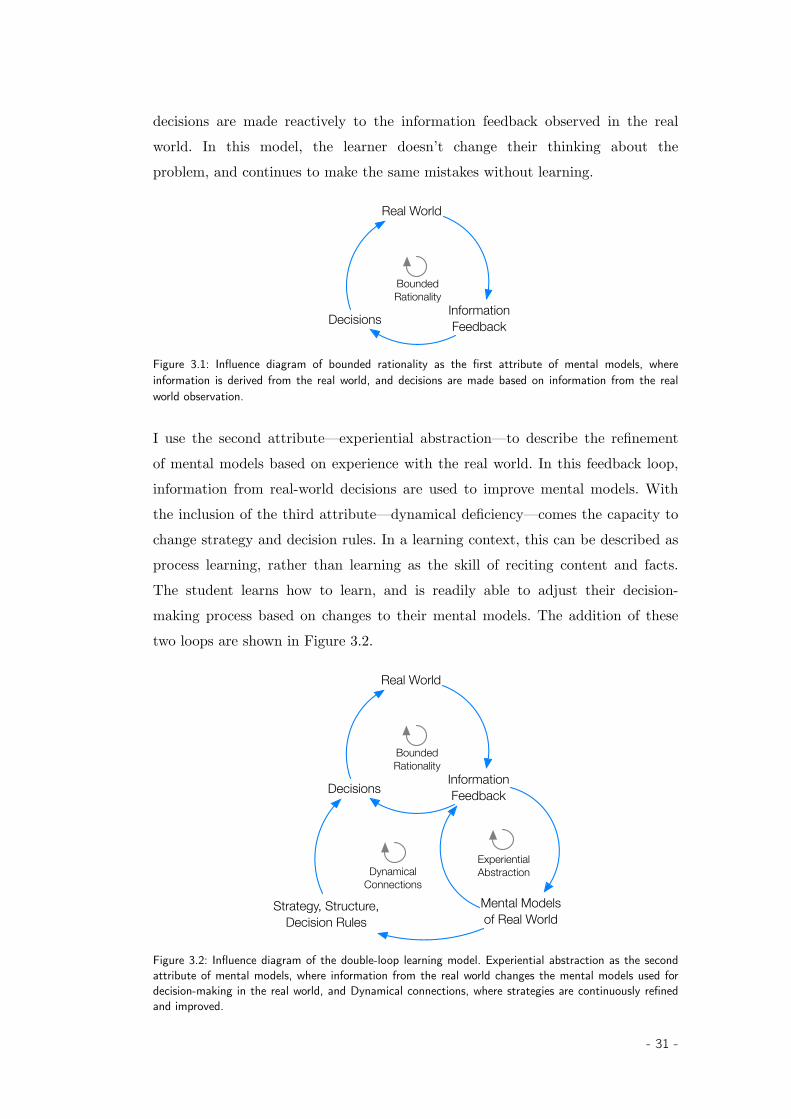
decisions are made reactively to the information feedback observed in the realworld. In this model, the learner doesn’t change their thinking about theproblem, and continues to make the same mistakes without learning.
Real World
InformationFeedbackDecisions
Bounded Rationality
Figure 3.1: Influence diagram of bounded rationality as the first attribute of mental models, whereinformation is derived from the real world, and decisions are made based on information from the realworld observation.
I use the second attribute—experiential abstraction—to describe the refinementof mental models based on experience with the real world. In this feedback loop,information from real-world decisions are used to improve mental models. Withthe inclusion of the third attribute—dynamical deficiency—comes the capacity tochange strategy and decision rules. In a learning context, this can be described asprocess learning, rather than learning as the skill of reciting content and facts.The student learns how to learn, and is readily able to adjust their decision-making process based on changes to their mental models. The addition of thesetwo loops are shown in Figure 3.2.
Real World
InformationFeedbackDecisions
Mental Modelsof Real World
Bounded Rationality
DynamicalConnections
Strategy, Structure,Decision Rules
ExperientialAbstraction
Figure 3.2: Influence diagram of the double-loop learning model. Experiential abstraction as the secondattribute of mental models, where information from the real world changes the mental models used fordecision-making in the real world, and Dynamical connections, where strategies are continuously refinedand improved.
- 31 -
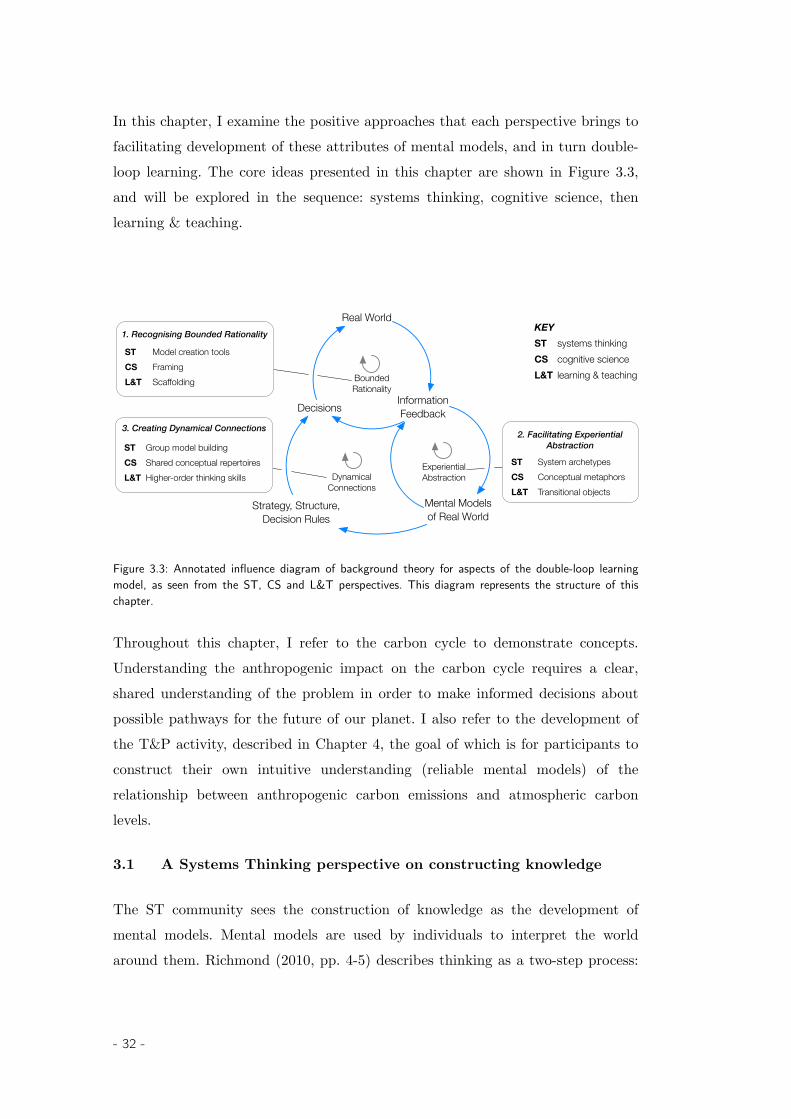
In this chapter, I examine the positive approaches that each perspective brings tofacilitating development of these attributes of mental models, and in turn double-loop learning. The core ideas presented in this chapter are shown in Figure 3.3,and will be explored in the sequence: systems thinking, cognitive science, thenlearning & teaching.
Real World
InformationFeedbackDecisions
Mental Modelsof Real World
Bounded Rationality
DynamicalConnections
Strategy, Structure,Decision Rules
ExperientialAbstraction
2. Facilitating Experiential Abstraction
ST Model creation toolsCS FramingL&T Scaffolding
1. Recognising Bounded Rationality
ST System archetypesCS Conceptual metaphorsL&T Transitional objects
3. Creating Dynamical Connections
ST Group model building CS Shared conceptual repertoiresL&T Higher-order thinking skills
KEYST systems thinking CS cognitive scienceL&T learning & teaching
Figure 3.3: Annotated influence diagram of background theory for aspects of the double-loop learningmodel, as seen from the ST, CS and L&T perspectives. This diagram represents the structure of thischapter.
Throughout this chapter, I refer to the carbon cycle to demonstrate concepts.Understanding the anthropogenic impact on the carbon cycle requires a clear,shared understanding of the problem in order to make informed decisions aboutpossible pathways for the future of our planet. I also refer to the development ofthe T&P activity, described in Chapter 4, the goal of which is for participants toconstruct their own intuitive understanding (reliable mental models) of therelationship between anthropogenic carbon emissions and atmospheric carbonlevels.
3.1 A Systems Thinking perspective on constructing knowledge
The ST community sees the construction of knowledge as the development ofmental models. Mental models are used by individuals to interpret the worldaround them. Richmond (2010, pp. 4-5) describes thinking as a two-step process:
- 32 -
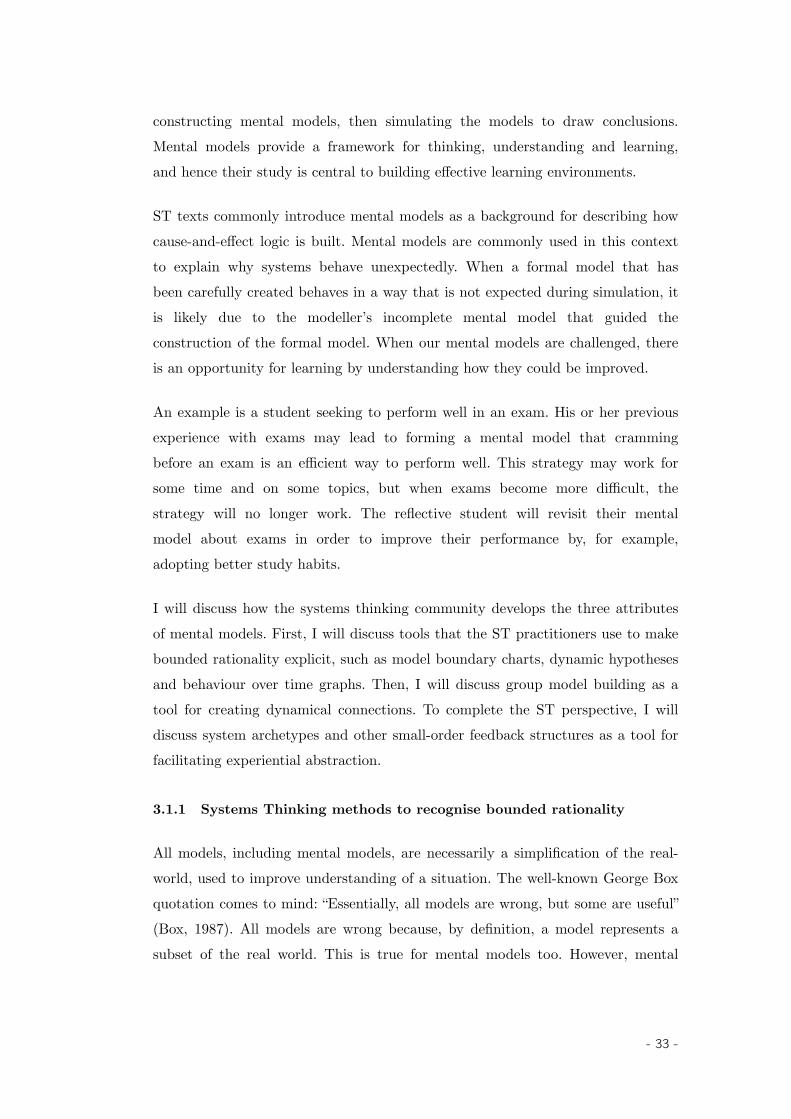
constructing mental models, then simulating the models to draw conclusions.Mental models provide a framework for thinking, understanding and learning,and hence their study is central to building effective learning environments.
ST texts commonly introduce mental models as a background for describing howcause-and-effect logic is built. Mental models are commonly used in this contextto explain why systems behave unexpectedly. When a formal model that hasbeen carefully created behaves in a way that is not expected during simulation, itis likely due to the modeller’s incomplete mental model that guided theconstruction of the formal model. When our mental models are challenged, thereis an opportunity for learning by understanding how they could be improved.
An example is a student seeking to perform well in an exam. His or her previousexperience with exams may lead to forming a mental model that crammingbefore an exam is an efficient way to perform well. This strategy may work forsome time and on some topics, but when exams become more difficult, thestrategy will no longer work. The reflective student will revisit their mentalmodel about exams in order to improve their performance by, for example,adopting better study habits.
I will discuss how the systems thinking community develops the three attributesof mental models. First, I will discuss tools that the ST practitioners use to makebounded rationality explicit, such as model boundary charts, dynamic hypothesesand behaviour over time graphs. Then, I will discuss group model building as atool for creating dynamical connections. To complete the ST perspective, I willdiscuss system archetypes and other small-order feedback structures as a tool forfacilitating experiential abstraction.
3.1.1 Systems Thinking methods to recognise bounded rationality
All models, including mental models, are necessarily a simplification of the real-world, used to improve understanding of a situation. The well-known George Boxquotation comes to mind: “Essentially, all models are wrong, but some are useful”(Box, 1987). All models are wrong because, by definition, a model represents asubset of the real world. This is true for mental models too. However, mental
- 33 -
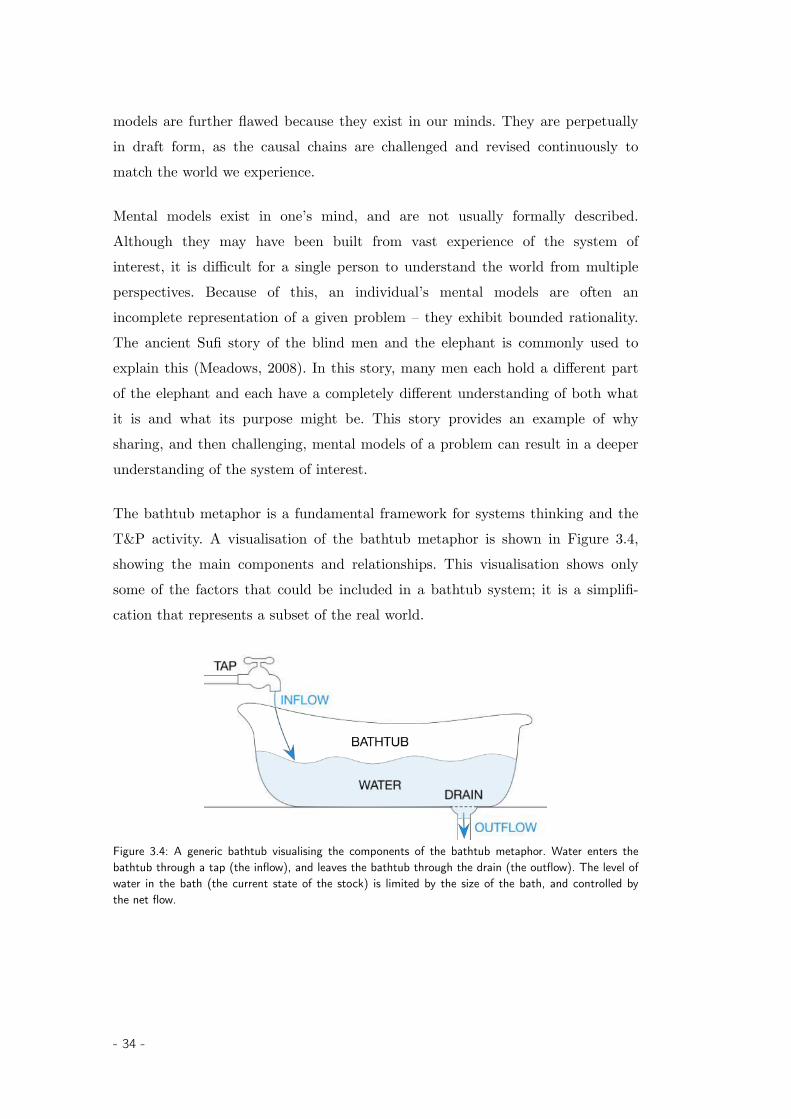
models are further flawed because they exist in our minds. They are perpetuallyin draft form, as the causal chains are challenged and revised continuously tomatch the world we experience.
Mental models exist in one’s mind, and are not usually formally described.Although they may have been built from vast experience of the system ofinterest, it is difficult for a single person to understand the world from multipleperspectives. Because of this, an individual’s mental models are often anincomplete representation of a given problem – they exhibit bounded rationality.The ancient Sufi story of the blind men and the elephant is commonly used toexplain this (Meadows, 2008). In this story, many men each hold a different partof the elephant and each have a completely different understanding of both whatit is and what its purpose might be. This story provides an example of whysharing, and then challenging, mental models of a problem can result in a deeperunderstanding of the system of interest.
The bathtub metaphor is a fundamental framework for systems thinking and theT&P activity. A visualisation of the bathtub metaphor is shown in Figure 3.4,showing the main components and relationships. This visualisation shows onlysome of the factors that could be included in a bathtub system; it is a simplifi-cation that represents a subset of the real world.
Figure 3.4: A generic bathtub visualising the components of the bathtub metaphor. Water enters thebathtub through a tap (the inflow), and leaves the bathtub through the drain (the outflow). The level ofwater in the bath (the current state of the stock) is limited by the size of the bath, and controlled bythe net flow.
- 34 -
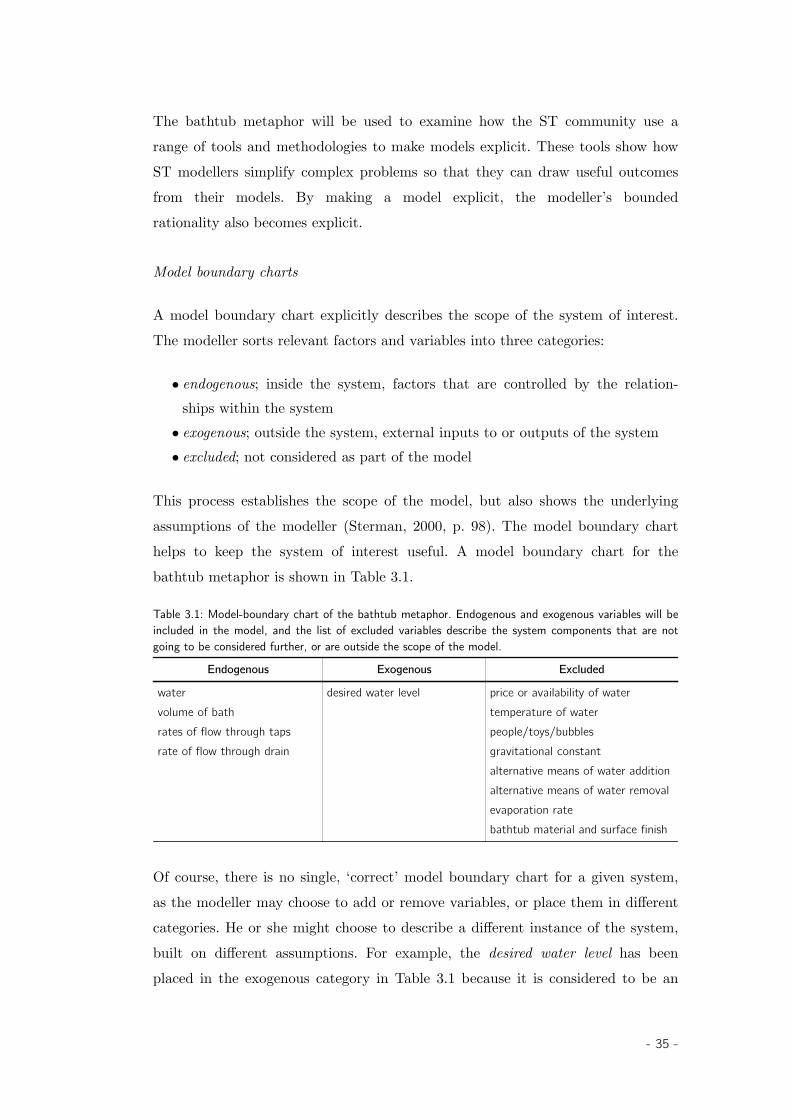
The bathtub metaphor will be used to examine how the ST community use arange of tools and methodologies to make models explicit. These tools show howST modellers simplify complex problems so that they can draw useful outcomesfrom their models. By making a model explicit, the modeller’s boundedrationality also becomes explicit.
Model boundary charts
A model boundary chart explicitly describes the scope of the system of interest.The modeller sorts relevant factors and variables into three categories:
• endogenous; inside the system, factors that are controlled by the relation-ships within the system
• exogenous; outside the system, external inputs to or outputs of the system• excluded; not considered as part of the model
This process establishes the scope of the model, but also shows the underlyingassumptions of the modeller (Sterman, 2000, p. 98). The model boundary charthelps to keep the system of interest useful. A model boundary chart for thebathtub metaphor is shown in Table 3.1.
Table 3.1: Model-boundary chart of the bathtub metaphor. Endogenous and exogenous variables will beincluded in the model, and the list of excluded variables describe the system components that are notgoing to be considered further, or are outside the scope of the model.
Endogenous Exogenous Excluded
water volume of bathrates of flow through tapsrate of flow through drain
desired water level price or availability of watertemperature of waterpeople/toys/bubblesgravitational constantalternative means of water additionalternative means of water removalevaporation ratebathtub material and surface finish
Of course, there is no single, ‘correct’ model boundary chart for a given system,as the modeller may choose to add or remove variables, or place them in differentcategories. He or she might choose to describe a different instance of the system,built on different assumptions. For example, the desired water level has beenplaced in the exogenous category in Table 3.1 because it is considered to be an
- 35 -
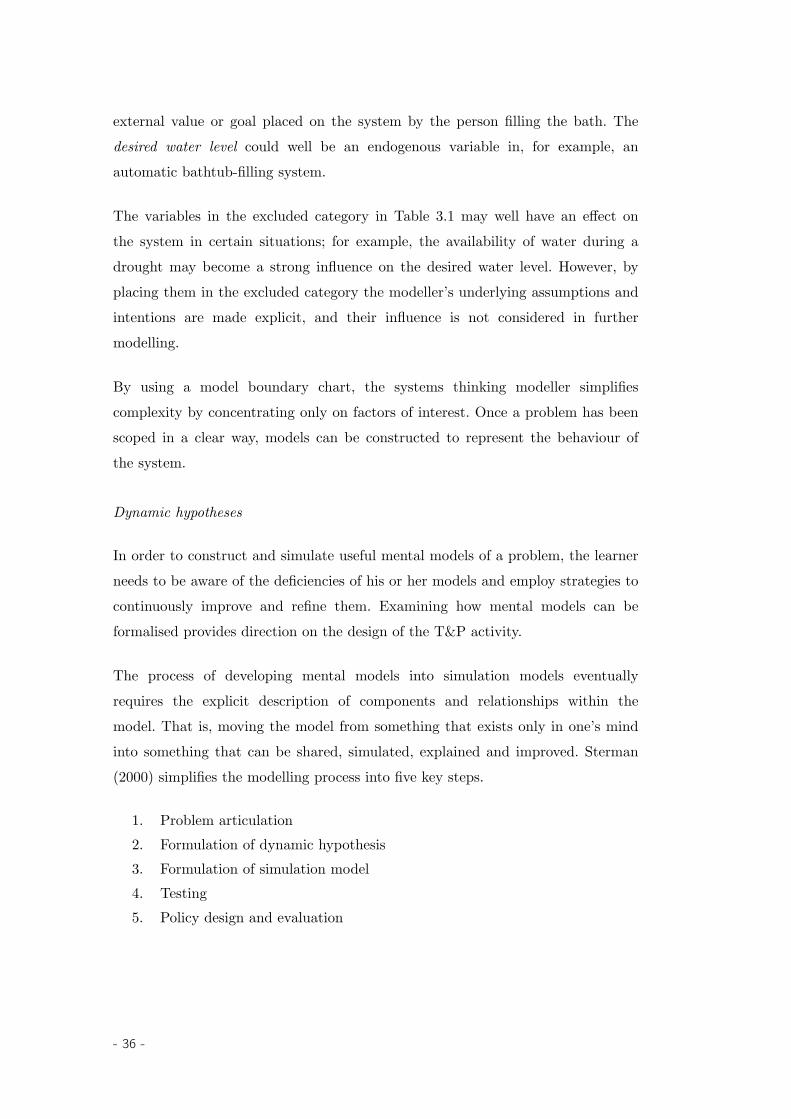
external value or goal placed on the system by the person filling the bath. Thedesired water level could well be an endogenous variable in, for example, anautomatic bathtub-filling system.
The variables in the excluded category in Table 3.1 may well have an effect onthe system in certain situations; for example, the availability of water during adrought may become a strong influence on the desired water level. However, byplacing them in the excluded category the modeller’s underlying assumptions andintentions are made explicit, and their influence is not considered in furthermodelling.
By using a model boundary chart, the systems thinking modeller simplifiescomplexity by concentrating only on factors of interest. Once a problem has beenscoped in a clear way, models can be constructed to represent the behaviour ofthe system.
Dynamic hypotheses
In order to construct and simulate useful mental models of a problem, the learnerneeds to be aware of the deficiencies of his or her models and employ strategies tocontinuously improve and refine them. Examining how mental models can beformalised provides direction on the design of the T&P activity.
The process of developing mental models into simulation models eventuallyrequires the explicit description of components and relationships within themodel. That is, moving the model from something that exists only in one’s mindinto something that can be shared, simulated, explained and improved. Sterman(2000) simplifies the modelling process into five key steps.
1. Problem articulation2. Formulation of dynamic hypothesis3. Formulation of simulation model4. Testing5. Policy design and evaluation
- 36 -

The formation of the dynamic hypothesis (described in Richardson & Pugh,1981) is an important step in making a mental model explicit. The use of toolssuch as causal-loop diagrams and stock-and-flow maps helps to formulate suchhypotheses (Sterman, 2000). Ford (1999) points out that being specific about theproblem at this stage is critical to the success of the modelling process.
Causal-loop diagrams describe the nature of the relationship between thevariables that the modeller selects. This allows the modeller to explore the logicof the feedback structures. In a causal-loop diagram, a series of variables arestated with series of causal links. These describe the relationship between thevariables, shown using arrows. The variable at the tail of the arrow affects thevariable at the head of the arrow.
The relationship between the affecting variable and the affected variable can bedescribed as either positive or negative link polarity, shown with either a plus orminus symbol at the head of the arrow. A positive link polarity indicates that thecausal effect pushes the variable in the same direction: an increasing variable atthe tail of the link will increase the variable at the head of the link, and adecreasing variable at the tail of the link will decrease the variable at the head ofthe link. A negative link polarity indicates that the causal effect pushes thevariable in the opposite direction: an increasing variable at the tail of the linkwill decrease the trajectory of the variable at the head of the link, and adecreasing variable at the tail of the link will increase the trajectory of thevariable at the head of the link.
The polarities in a causal-loop diagram assist in describing the structure of thesystem. The polarities also determine whether the loop has a reinforcing orbalancing behaviour. The logic here is similar to multiplication of positive andnegative numbers. If all the link polarities are positive, or if there are evennumbers of negative links, the behaviour of the closed loop will be reinforcing. Ifthere are odd numbers of negative links, the behaviour of the closed loop will bebalancing.
As an example, the endogenous and exogenous variables used in Table 3.1 areshown in the causal-loop diagram presented in Figure 3.5. The observed waterlevel is controlled by the net inflow rate, which is an adjustment in or out ofwater according to the gap between the actual and desired water level. The
- 37 -
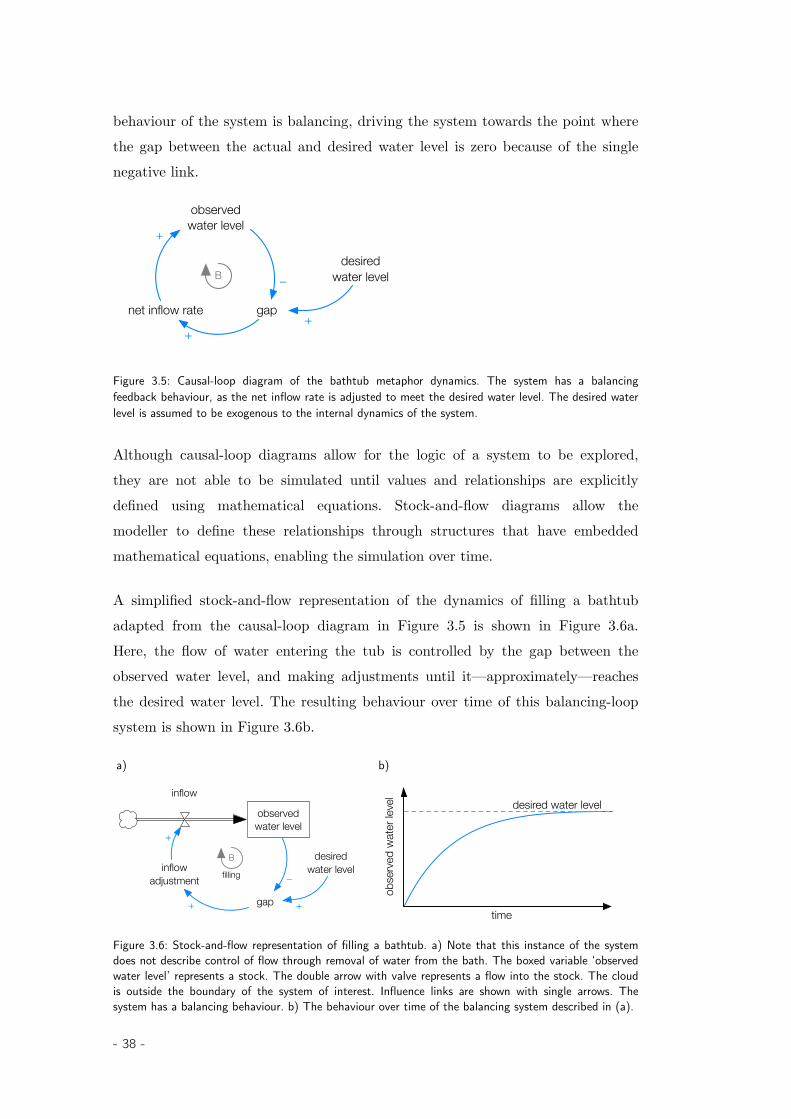
behaviour of the system is balancing, driving the system towards the point wherethe gap between the actual and desired water level is zero because of the singlenegative link.
gap
observedwater level
net inflow rate
Bdesired
water level
+
–
++
Figure 3.5: Causal-loop diagram of the bathtub metaphor dynamics. The system has a balancingfeedback behaviour, as the net inflow rate is adjusted to meet the desired water level. The desired waterlevel is assumed to be exogenous to the internal dynamics of the system.
Although causal-loop diagrams allow for the logic of a system to be explored,they are not able to be simulated until values and relationships are explicitlydefined using mathematical equations. Stock-and-flow diagrams allow themodeller to define these relationships through structures that have embeddedmathematical equations, enabling the simulation over time.
A simplified stock-and-flow representation of the dynamics of filling a bathtubadapted from the causal-loop diagram in Figure 3.5 is shown in Figure 3.6a.Here, the flow of water entering the tub is controlled by the gap between theobserved water level, and making adjustments until it—approximately—reachesthe desired water level. The resulting behaviour over time of this balancing-loopsystem is shown in Figure 3.6b.
a) b)
gap
inflow adjustment
B desiredwater level
+
–
+ +
observedwater level
filling
inflow
time
desired water level
obse
rved
wat
er le
vel
Figure 3.6: Stock-and-flow representation of filling a bathtub. a) Note that this instance of the systemdoes not describe control of flow through removal of water from the bath. The boxed variable ‘observedwater level’ represents a stock. The double arrow with valve represents a flow into the stock. The cloudis outside the boundary of the system of interest. Influence links are shown with single arrows. Thesystem has a balancing behaviour. b) The behaviour over time of the balancing system described in (a).
- 38 -
After a system has been described through stock-and-flow notation, an ST practi-tioner will describe the system in equations that govern its behaviour. With theseequations, the model is made formal and ready for simulation. This is how an STpractitioner makes the bounded rationality of his or her mental models explicit.
3.1.2 Systems thinking methods to facilitate experiential learning
It follows that if mental models are built from experience, then mental modelscan be changed through experiences, and that it should be possible to design alearning experience to do so. In this section, I present how systems thinkingpractitioners use small, useful models and the system archetypes to abstracteveryday experiences into generalised ST models.
Small, useful models
This brings us to the second part of the George Box quotation: some models areuseful. To include all the components and relationships of a situation can detractfrom understanding the key relationships within a system of interest. When allthe factors of a problem are considered, such as those in the Excluded category inTable 3.1, the model becomes too complex to be useful.
An extreme example of this is the Afghanistan Stability / COIN3 dynamicsinfluence diagram (PA Consulting, 2009). This was largely ridiculed in the press,which reported that General Stanley McChrystal declared, “When we understandthat slide, we'll have won the war” (Rogers, 2010). The ‘spaghetti diagram’ modelwas far too complex for decision-makers to understand, and was no longer useful,save for clearly demonstrating that the problem of counterinsurgency is complex.
Simple models can still be dynamically complex. They can become controversialbecause they are counterintuitive to fixed, static mental models. Two classicstudies demonstrate this. Forrester’s urban dynamics model contained only ninemajor stocks (see Forrester, 1969) and allowed him to see many insights thatlater proved to be true. Forrester’s model showed that the introduction of low-cost housing in urban areas meant that large numbers of people were moving intoareas where few jobs were available. Rather than alleviating poverty, this
3. COIN is an abbreviation of counterinsurgency
- 39 -

intervention created it and entrenched it in the community. This view was atodds with the otherwise politically popular intervention, but has repeated itselfwhere low-cost housing has been introduced.
The World model of Limits to Growth (Meadows et al, 1972) considered stockssuch as non-renewable resources; service, industrial and agricultural capital; landuse; population, and; pollution. The model suggests that there is a limit andbalance to these stocks. It was controversial at the time and is controversial still,in a global economy where growth and abundance are considered normal andworthwhile goals. Even so, its ‘normal’ run continues to exhibit accuracy to thisday (Turner, 2008). The usefulness of models comes down to both the art andscience of effective modelling, as well as the ability to communicate the outcomes.
System archetypes
Using smaller, more manageable models can be extremely useful in thinkingabout systems of interest. The system archetypes are small, generic structuresthat demonstrate dynamically complex but recognisable behaviour.
The most commonly used system archetypes (as described in Meadows, 2008;Senge, 2006; Maani & Cavana, 2007; Braun, 2002) are:
• balancing loops with delays• limits to growth; limits to success• policy resistance; fixes that fail• the tragedy of the commons• eroding goals; drifting goals; drift to low performance• escalation• success to the successful; competitive exclusion• shifting the burden; addiction
- 40 -
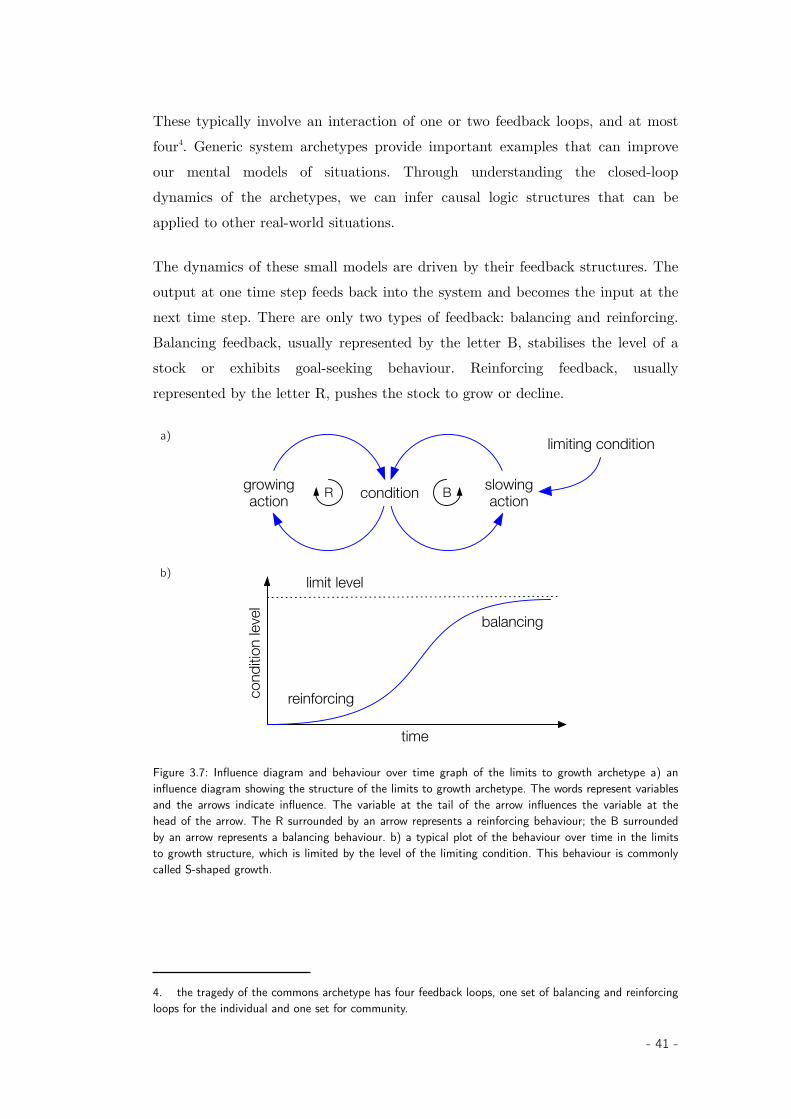
These typically involve an interaction of one or two feedback loops, and at mostfour4. Generic system archetypes provide important examples that can improveour mental models of situations. Through understanding the closed-loopdynamics of the archetypes, we can infer causal logic structures that can beapplied to other real-world situations.
The dynamics of these small models are driven by their feedback structures. Theoutput at one time step feeds back into the system and becomes the input at thenext time step. There are only two types of feedback: balancing and reinforcing.Balancing feedback, usually represented by the letter B, stabilises the level of astock or exhibits goal-seeking behaviour. Reinforcing feedback, usuallyrepresented by the letter R, pushes the stock to grow or decline.
a)
growingaction condition slowing
action
limiting condition
R B
b)limit level
time
cond
ition
level
reinforcing
balancing
Figure 3.7: Influence diagram and behaviour over time graph of the limits to growth archetype a) aninfluence diagram showing the structure of the limits to growth archetype. The words represent variablesand the arrows indicate influence. The variable at the tail of the arrow influences the variable at thehead of the arrow. The R surrounded by an arrow represents a reinforcing behaviour; the B surroundedby an arrow represents a balancing behaviour. b) a typical plot of the behaviour over time in the limitsto growth structure, which is limited by the level of the limiting condition. This behaviour is commonlycalled S-shaped growth.
4. the tragedy of the commons archetype has four feedback loops, one set of balancing and reinforcingloops for the individual and one set for community.
- 41 -
These feedback structures can be seen clearly in the system archetypes. Take thetreatment of the limits to growth archetype in Senge (2006). Limits to growthdescribes a situation where rapid growth is followed by stagnation. Thereinforcing behaviour that promoted the growth eventually slows down due to alimiting factor. An influence diagram and behaviour over time graph of the limitsto growth archetype is shown in Figure 3.7.
Senge offers a number of examples: affirmative employment strategies; learning anew skill such as tennis; the growth of start-up businesses or social movements; acity that grows rapidly and in doing so increases housing prices; an animalpopulation that grows too fast, which leads to overgrazing and starvation.Meadows (2008) provides more examples: a new product will eventually saturatea market; a chain reaction in a nuclear power plant or bomb will run out of fuel;a virus will run out of susceptible people to infect; the economy may beconstrained by physical capital, monetary capital, labor, markets, management,resources or pollution. Rogers (2003) describes many other examples, such as thediffusion of innovations (ideas or products), and the growth of a sunflower.
Recognising an archetype in a real-world situation allows us to draw connectionsabout future behaviour and recognise opportunities to alter that behaviour. Thebehaviour in the limits to growth archetype indicates that growth will eventuallyslow down and stop. In a situation where growth is required, Senge recommendsfocussing on removing or weakening the limitation. In the tennis example, thismight include more coaching to identify and lift the limiting condition; in theproduct example, this could include opening the product to more customersthrough a price drop, or developing another product to ensure the company’sgrowth does not also plateau.
From the ST perspective, the system archetypes are useful because they are smallyet can provide the modeller with causal insights into real-world situations.
- 42 -
3.1.3 Systems thinking methods to create dynamical connections
System dynamics modelling assumes that the behaviour of a system is caused byits internal feedback structure (Meadows & Robinson, 2007; Richardson, 2011);the endogenous behaviour of the feedback model. However, mental models arenot formal models and are typically incomplete, which makes them difficult tosimulate. Maxwell et al (1994) suggest that decision-makers are often notequipped with mental models that display closed-loop cause-and-effect structures,and become better decision-makers when they are given dynamical insightsdescribed as ‘causal chunks’. These are inferential models that provide a basis fordecision making. That is, when X happens, Y is likely to happen.
This observation is critical in the design of the T&P activity. The goal of theactivity is not necessarily to enable participants to be experts in modelling, oreven to become aware of their own mental models. Rather, the goal may well beto equip participants with better causal chunks to improve or formalise theirintuitive understanding; their ability to use their experience to make betterdecisions based on available data.
When mental models become explicit and closed-loop, they can be simulated: aprocess that can create dynamical insights that may later be remembered only ascausal chunks. Further, understanding and informing mental models frommultiple perspectives around a problem is important to assemble a completepicture of the problem at hand. Insights from group model building in systemdynamics can help us to understand the process of building shared models andcollective insights.
Group model building
In group model building, participants and relevant stakeholders play an activepart in the modelling process (Anderson et al, 2007), rather than that being aprocess undertaken only by modellers. Involving stakeholders in the modellingprocess ultimately improves the quality of the model, and the insights andrecommendations from the model are more likely to be implemented (Vennix,1996). Hovmand (2014) furthers this argument, suggesting that models built withhigh participation are likely to have more public acceptance as a basis forcommunity-based system dynamics (CBSD):
- 43 -
Models that are developed in [the] same place around publicissues often have a common referent of experiences withinthe same community, so even when participants have notbeen involved in the modeling process, there can be aconnection to a model developed by others from theircommunity. Recognizing and drawing on the potential ofcommunities to learn and build capacity over time throughmultiple system dynamics and group model building projectsis a central idea in CBSD
- Hovmand (2014 p.18)
Andersen and Richardson (1997) outline a series of scripts for running groupmodel building activities. These are not formal scripts, but rather routineprompts that have been built up through experience. These scripts coverstrategies for defining the problem, conceptualising model structure, elicitingfeedback structure, equation writing and parameterisation, and policydevelopment. Hovmand (2014 p.27) outlines activities within the group modelbuilding with participants phase of CBSD: introducing system dynamics, variableelicitation, defining the reference mode, structure elicitation, model formulationand testing, policy analysis, and transfer of ownership. Warren (2014) describesan agile model for group model building: problem definition; identify stock-drivers; capture stock-accumulation, and; identify interdependence. All contributeto working models and actionable findings. Newell & Proust (2012) describe acollaborative conceptual modelling (CCM) process that includes a series ofprompts: What is the challenge? What is the story? Can I see how you think?What drives system behaviour? Where are the leverage points? Can we have neweyes?
Each of these group model building examples describes a process for takingindividuals’ mental models and turning them into explicit, shared models todescribe a situation of interest. Of relevance to the learning activity here is notnecessarily the specific activities described in group modelling practice, butrather the common attribute between them: that they require the use of effectiveand well-timed prompts to get the most out of the participants. These promptsare designed to extend the group’s thinking, and look at the problem fromalternative perspectives. “Good prompts do not burden a learner, but set themfree” (Martinez & Stager, 2013). This is a valuable insight for the development ofa learning activity.
- 44 -
Good group model building also relies on a repertoire of activities to help thegroup form a shared understanding. A Think-Pair-Share (see Lyman, 1987)activity gets individuals to think through their ideas and make them explicit,before partnering with someone to share and combine their ideas. In a convergentactivity, such as a problem set, the pair component is an opportunity to checkindividual solutions and work through any differences before sharing with thebroader group. In a divergent activity, such as building a discussion paper, thepair component provides an opportunity to argue, justify and perhaps see newperspectives.
Group collaboration can also be encouraged using the jigsaw approach (firstdescribed by Aronson, 1978). In this technique, individuals leave their homegroup to become an expert on a given topic, by working in a short-lived groupwith ‘experts’ from other groups. They return to their home group with therelevant insights for their area of expertise, making individuals more accountablefor their learning and at the same time broadening their home group’sperspectives on a problem. Another method used to broaden perspectives withina group is six-hat thinking (De Bono, 2000). This gets the group to move throughdifferent points of view (wear different hats):
• the white hat to identify information known or needed• the red hat to explore hunches and intuition• the black hat to play devil’s advocate• the yellow hat to approach the situation optimistically• the green hat to explore creativity• the blue hat to facilitate the thinking process
In a facilitated process, this approach provides reference points for the group tothink through problems and provides a different way for individuals to seebeyond their own perspectives and opinions.
- 45 -
3.1.4 Application of Systems Thinking perspectives to the T&P activity
In this summary, I conclude the ST perspective by demonstrating how the STmethods described here relate to the T&P activity, which is described in detail inChapter 4.
Model boundary chart and dynamic hypothesis
A model boundary chart was used to explicitly define the variables included inthe simulation model in the T&P activity. The model boundary chart is shown in§4.1, alongside the dynamic hypothesis for the variables, relationships andexpected dynamical behaviour.
Small, useful models and system archetypes
The T&P activity is an extension of a small, useful model with behaviour similarto the bathtub metaphor. Efforts were made to ensure that the carbon cycle(explained in Chapter 2) was described through the smallest number of variablesand relationships, whilst still making the T&P activity useful and relevant.
Group model building
The components of the T&P activity require a small amount of construction andprompted interaction, which is in line with the observations that groups includedin the modelling process take ownership of the model. The idea of targetedprompts that guide the group model building process were the basis for theinstructional prompts for the activity, described in §4.2.
3.2 A Cognitive Science perspective on constructing knowledge
Second-generation cognitive science provides additional and complementaryperspectives for thinking about the development of the key attributes of mentalmodels. In this section, I will explore four key ideas. First, I discuss the boundedrationality of communication in the exchange of ideas, and how ideas are framed.Second, I relate our physical experience with real-world objects to the use ofconceptual metaphors, which allow us to understand one thing in terms ofanother. Third, I discuss how dynamical connections are created through shared
- 46 -
conceptual repertoires. Fourth, I discuss I2S, an interdisciplinary framework thatbuilds on many aspects of a cognitive science approach to constructingknowledge. To conclude the cognitive science perspective, I summarise theapproaches from CS in relation to the T&P activity.
3.2.1 Cognitive Science methods to recognise bounded rationality
Communication involves interaction for the exchange of ideas and knowledge. Atits simplest, it is the process of sending and receiving signals with a previouslyagreed set of conventional ‘meanings’. When the intended messages are codedusing a finite set of discrete signals, such as those of mathematics, communicationis unambiguous, providing that both the sender and receiver both are fluent inmathematics. Weaver (Shannon & Weaver, 1949, p. 4) describes problems incommunication occurring at three levels:
LEVEL A. How accurately can the symbols of communi-cation be transmitted? (The technical problem.)
LEVEL B. How precisely do the transmitted symbolsconvey the desired meaning? (The semantic problem.)
LEVEL C. How effectively does the received meaningaffect conduct in the desired way? (The effectivenessproblem.)
Reddy (1979) notes that an a priori shared context, such as fluency inmathematical concepts, between the transmitter and receiver is required to allowfor the coding and decoding of signals. However, communication becomes signifi-cantly more difficult in human communication, where both the coding anddecoding can be ambiguous. For example, the speaker will transmit a series ofsignals (words), and the listener will receive these signals and construct amessage. This message may or may not match the speaker’s intention. An apriori shared context in human communication requires iterations around acommunication loop to ensure that the conceptual repertoire is shared (Newell,2012).
- 47 -
Framing
The field of cognitive linguistics offers some insights into how language can beused to frame human interactions in particular ways. With respect to the T&Pactivity, if the language used to describe the task is framed in a particular way, itmay change the behaviour of the participants.
Lakoff (2004) discusses how values can be framed in the language that we use.For example, tax relief immediately places a positive frame around a policy ofreducing taxes. Although essential government-run services require adequatefunding generated through taxes, the word relief frames the activity of cuttingtaxes as a virtuous activity, and places anyone who is against cutting taxes in thewrong.
Lakoff describes how this frame, created by the conservative side of US politics,then pervades the media and public psyche and in turn makes it difficult for theprogressive side to attack.
This is what framing is about. Framing is about gettinglanguage that fits your worldview. It is not just language.The ideas are primary—and the language carries those ideas,evokes those ideas.
- Lakoff (2004)
Careful attention to the language used to frame a problem or viewpoint can makeit easier, or harder, to gain support for ideas. This is important consideration forthe design of the T&P activity, where it is used to help participants understandthe dynamics of stocks and flows in the often politicised topic of climate change.For example, participants may come to the T&P activity with a set of values,which frames their thinking about the problem of climate change. The environ-mentalist and the economist may frame the problem in different ways, usingdifferent language, and will have a set of solutions that are consistent with theirworldview. Careful consideration is required to frame the activity in a neutralway so that unintended biases do not surface and dominate the responses.
- 48 -
3.2.2 Cognitive Science methods to facilitate experiential learning
Our mental models are built from experience with the real world. In a learningenvironment, with multiple people with multiple backgrounds, it is important topay careful attention to the creation of a shared understanding between partic-ipants. If this is not done adequately, then participants will unnecessarily havedifferent interpretations and understanding of the purpose of the lesson.
Conceptual metaphors
Lakoff & Johnson (2003) argue that human thought occurs through underlyingmetaphorical constructs.
Human conceptual systems are metaphorical in nature andinvolve an imaginative understanding of one kind of thing interms of another.
- Lakoff and Johnson (2003, p. 194)
Here, metaphor is taken to mean conceptual metaphor, referring to the underlyingconcepts in language that our inferences about the world are based on. Anidentical structure underlies the use of metaphor used in poetry and rhetoric;these poetic uses only make sense to us because of our pre-existing repertoire ofmetaphorical constructs (Lakoff & Turner, 1989).
A relevant example of how communication occurs through underlyingmetaphorical constructs is the container metaphor. The container metaphor,describes the construct where objects (things, people, ideas, words, et cetera) areplaced into and taken out of a container, and is fundamental to human cognition.The container metaphor provides the basis for Reddy’s conduit metaphor, whichis used to describe the structure of communication:
The speaker puts ideas (objects) into words (containers) andsends them (along a conduit) to a hearer who takes theidea/objects out of the word/containers.
- Lakoff & Johnson (2003, p. 10)
Newell (2012) builds on Reddy’s ideas in describing an elemental communicationloop. Effective communication between two people (a transmitter and receiver)occurs through an iterative loop, where the transmitter and receiver compare the
- 49 -
sent and constructed messages. The signal is required to be translated throughboth the transmission process and the conceptual repertoires of the two people. Ifthe conceptual repertoires of the individuals are not identical, then communi-cation is ineffective.
A conceptual metaphor has an underlying organisation of categories andrelationships, called a schema. Consider the container metaphor further. Phrasessuch as I am in trouble or I got out of trouble make sense because of the containerschema logic, based on our physical experience with containers. Objects can besituated in a spatial relationship to the container, and containers can fill anddrain. The trouble is behind me or trouble is building. The container can be usedto represent many abstract concepts. She helped me get out of trouble, and we fellin love. The container is universal to human cognition because of our physicalexperience with, and our shared a priori understanding of, containers.
In a conceptual metaphor, concepts from one context (the source domain)
can be mapped into another context (the target domain). The mapping betweenthe source and target domains is partial, and the use of vocabularies between thesource and target domains can highlight or obscure concepts and in turn changethe way that concepts are understood (Lakoff & Johnson, 2003). The mappingbetween domains can enable people to think through cause-and-effect structuresin the source domain without requiring expert knowledge in the target domain.
This, together with Newell’s elemental communication loop, reveals an importantobservation for building a shared understanding in a group learning environment:communication using conceptual metaphors can be effective without the need forprior instruction, providing that the conceptual metaphors are part of a sharedconceptual repertoire.
3.2.3 Cognitive Science methods to create dynamical connections
Conceptual metaphors with their underlying logic can be used intuitively. Lakoff& Johnson (1999) explain this as a function of the embodied mind. For example,the container schema logic is transferable between many contexts and ourunderstanding of the schema is embodied and intuitive because of our spatialexperiences with containers.
- 50 -
Attempts to improve communication require careful selection of conceptualmetaphors. However, problems can occur even when communication involvessimple concepts. For example, orientational metaphors have a schema thatorganise whole systems of understanding, such as more is up and less is down.This leads to phrases such as She is at the top of her game and He has hit an all-time low.
The orientational relationship is not universal. More is up is often linked with therationale that up is good and down is bad. There are situations where the orienta-tional relationship is reversed. For example, in a business or economics domain,growth is accepted and commonplace (good), whereas in an environmentaldomain, economic growth is viewed with caution (bad). Examples can be drawnfrom some of the most complex problems facing society today, and can be seen innewspaper headlines daily:
Obesity soars to 'alarming' levels in developing countries- Mark Tran in the Guardian Online, 3 January 2014
Sea level rise quickens more than thought in threat toworld's coasts- The Sydney Morning Herald, 15 January 2015, via Reuters
Rising income inequality harms growth, OECD says- Paul Hannon in the Wall Street Journal, 12 August 2014
These counter-relationships challenge our metaphorical understanding ofproblems: here up is not good. These headlines require nuanced sharedconceptual repertoires to understand. The orientational metaphor—up is good—behind the third example headline frames inequality as a problem for growth.
- 51 -
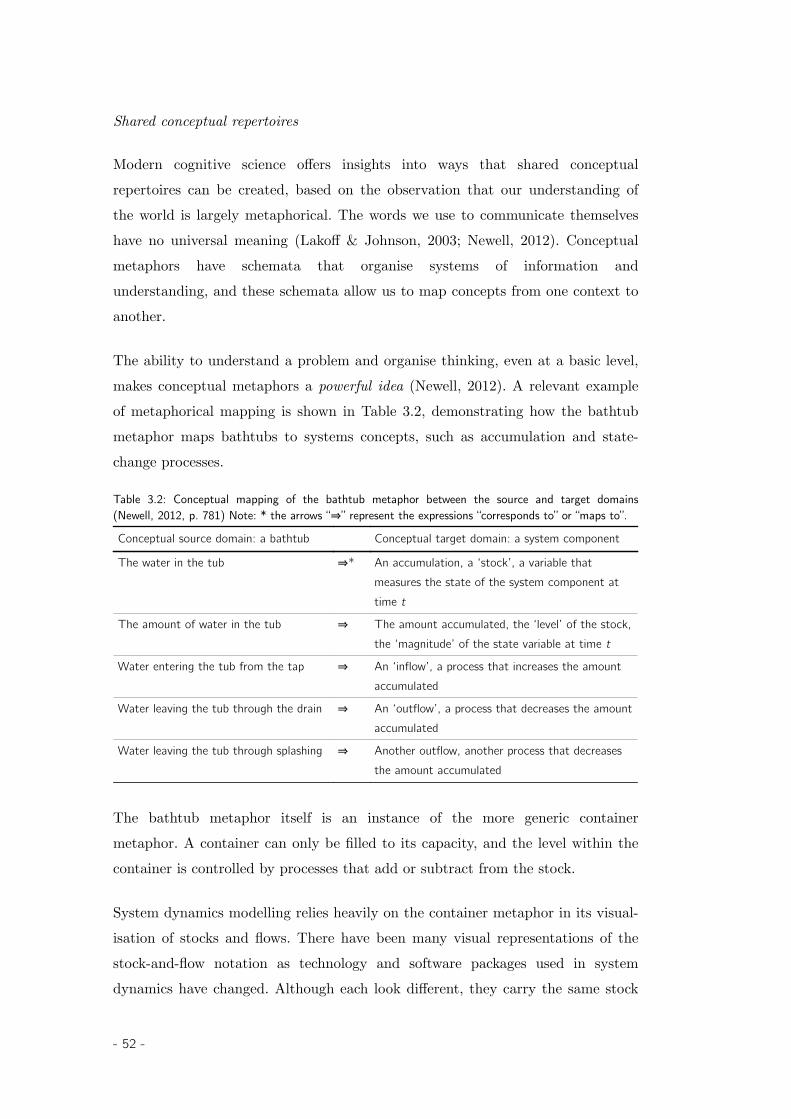
Shared conceptual repertoires
Modern cognitive science offers insights into ways that shared conceptualrepertoires can be created, based on the observation that our understanding ofthe world is largely metaphorical. The words we use to communicate themselveshave no universal meaning (Lakoff & Johnson, 2003; Newell, 2012). Conceptualmetaphors have schemata that organise systems of information andunderstanding, and these schemata allow us to map concepts from one context toanother.
The ability to understand a problem and organise thinking, even at a basic level,makes conceptual metaphors a powerful idea (Newell, 2012). A relevant exampleof metaphorical mapping is shown in Table 3.2, demonstrating how the bathtubmetaphor maps bathtubs to systems concepts, such as accumulation and state-change processes.
Table 3.2: Conceptual mapping of the bathtub metaphor between the source and target domains(Newell, 2012, p. 781) Note: * the arrows “⇒” represent the expressions “corresponds to” or “maps to”.
Conceptual source domain: a bathtub Conceptual target domain: a system component
The water in the tub ⇒* An accumulation, a ‘stock’, a variable that measures the state of the system component at time t
The amount of water in the tub ⇒ The amount accumulated, the ‘level’ of the stock,the ‘magnitude’ of the state variable at time t
Water entering the tub from the tap ⇒ An ‘inflow’, a process that increases the amount accumulated
Water leaving the tub through the drain ⇒ An ‘outflow’, a process that decreases the amountaccumulated
Water leaving the tub through splashing ⇒ Another outflow, another process that decreases the amount accumulated
The bathtub metaphor itself is an instance of the more generic containermetaphor. A container can only be filled to its capacity, and the level within thecontainer is controlled by processes that add or subtract from the stock.
System dynamics modelling relies heavily on the container metaphor in its visual-isation of stocks and flows. There have been many visual representations of thestock-and-flow notation as technology and software packages used in systemdynamics have changed. Although each look different, they carry the same stock
- 52 -
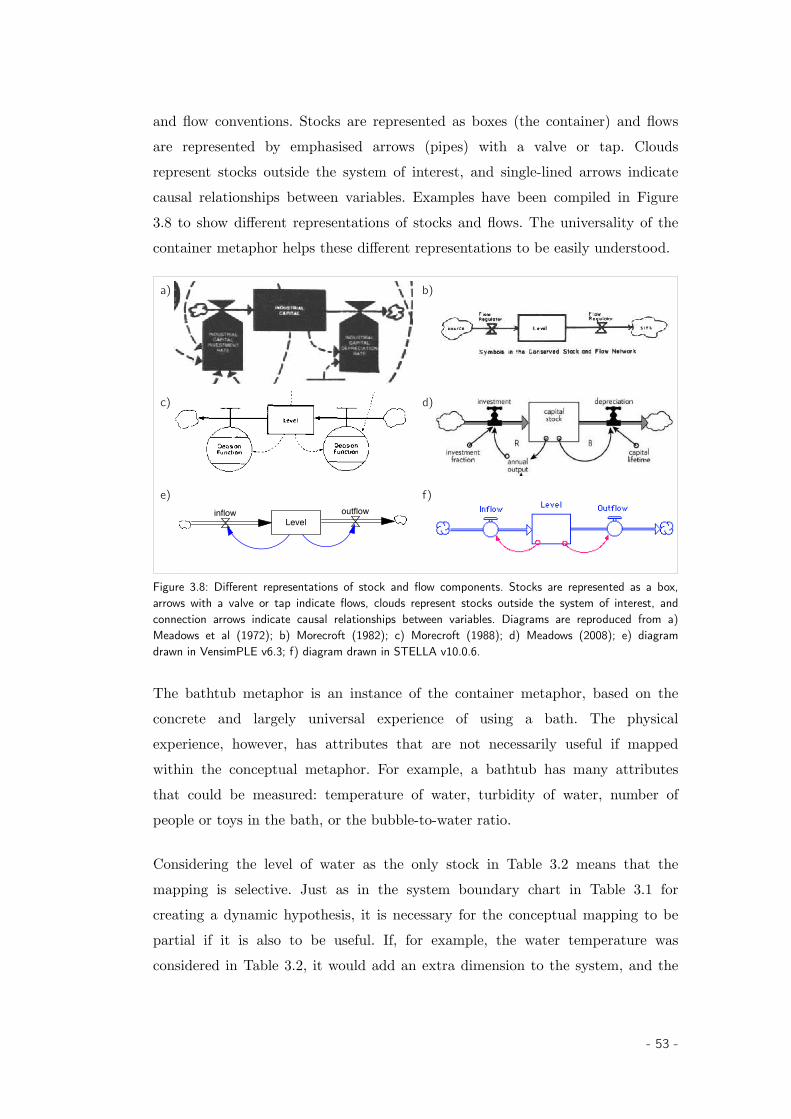
and flow conventions. Stocks are represented as boxes (the container) and flowsare represented by emphasised arrows (pipes) with a valve or tap. Cloudsrepresent stocks outside the system of interest, and single-lined arrows indicatecausal relationships between variables. Examples have been compiled in Figure3.8 to show different representations of stocks and flows. The universality of thecontainer metaphor helps these different representations to be easily understood.
a) b)
c)
~_ . " / / _v
d)
e)
Leveloutflowinflow
f)
Figure 3.8: Different representations of stock and flow components. Stocks are represented as a box,arrows with a valve or tap indicate flows, clouds represent stocks outside the system of interest, andconnection arrows indicate causal relationships between variables. Diagrams are reproduced from a)Meadows et al (1972); b) Morecroft (1982); c) Morecroft (1988); d) Meadows (2008); e) diagramdrawn in VensimPLE v6.3; f) diagram drawn in STELLA v10.0.6.
The bathtub metaphor is an instance of the container metaphor, based on theconcrete and largely universal experience of using a bath. The physicalexperience, however, has attributes that are not necessarily useful if mappedwithin the conceptual metaphor. For example, a bathtub has many attributesthat could be measured: temperature of water, turbidity of water, number ofpeople or toys in the bath, or the bubble-to-water ratio.
Considering the level of water as the only stock in Table 3.2 means that themapping is selective. Just as in the system boundary chart in Table 3.1 forcreating a dynamic hypothesis, it is necessary for the conceptual mapping to bepartial if it is also to be useful. If, for example, the water temperature wasconsidered in Table 3.2, it would add an extra dimension to the system, and the
- 53 -
conceptual metaphor may be less applicable to general systems concepts. Itcould, however, be more applicable to other concepts, such as an analogue forunderstanding entropy.
Some systems thinkers, however, would continue to argue that the mapping inTable 3.2 is incomplete and requires improvement. A standard addition todescriptions of the bathtub metaphor (see Sedlmeier et al, 2014) is to replace thetap and drain with pumps to remove the non-linearities involved in the removalof water through the drain as a function of the height of the water. While thisrevision might provide a clearer mapping with the systems concepts in the targetdomain, it can detract from the metaphor as it moves the source domain awayfrom the familiar, concrete experience of using a bath.
Others use alternatives to the bathtub to allow for more flexible mapping tospecific source domains. Newell (Dyball & Newell, 2014) describes the water tankmetaphor, an extension of the bathtub metaphor, to help understand ecologicalsystems. Rusty water tanks are iconic to Australian rural life. The orientationallogic of the water tank is different to the bathtub. An overflowing water tank canrepresent good times—a desirable state—whereas an overflowing bath is a sign ofchaos or danger; an undesirable state. The emphasis on the flows are different. Inthe water tank metaphor, the water in the tank is precious, and the outflows arecarefully observed due to the uncertainty of when the next rainfall would be. Thedifferences are subtle, but important in creating consistent conceptual metaphors.
Physical experience can also put artificial bounds on the effectiveness of theconceptual metaphor. In the physical experience of using a bath, it is unusual tobe continuously both filling and draining. In a typical use case, the bath wouldbe empty, filled, in use, and then drained. Because of the behavioural activitiesthat go alongside physically using a bath, the bathtub metaphor may obscurecertain ways of thinking in the target domain. For example, the water level of thebath usually sits safely within user-defined bounds, and so its value in helpingone to think through unusual problems may be limited. Implicit in the use of thebathtub metaphor is also an assumption that there is a universal bathtubexperience: many cultures don’t use baths, or use baths differently.
- 54 -
The acknowledgement that understanding is constructed through our embodiedexperience with the physical world has many implications for the way thatlearning environments should be created to build shared conceptual repertoiresfor successful educational outcomes. Experiential learning situates knowledge inthe embodied mind, and provide frameworks for learners to think aboutproblems.
3.2.4 A Cognitive Science basis for interdisciplinary group work
An example of how the ideas from cognitive science are being used generally toimprove a shared understanding between disciplines can be seen with the recentestablishment of the integration and implementation sciences (I2S). The goal ofthis field is to identify how to conduct collaborative research across disciplinaryboundaries to solve complex, real-world problems. Although this is not amovement from within the field of cognitive science, it does draw heavily on ideasfrom both the ST and CS perspectives, and as a result is worth discussing inrelation to building and sharing better mental models.
Bammer (2013) describes three domains as the basis for this approach:
1. Synthesising disciplinary and stakeholder knowledge2. Understanding and managing diverse unknowns3. Providing integrated research support for policy and practice change
Within these domains, Bammer describes six key, interrelated categories ofconcepts and methods are explored:
1. Taking a systems view2. Scoping3. Boundary setting4. Framing5. Dealing with values6. Harnessing and managing differences
Bammer states the importance of paying careful attention to framing collabo-rative research, “so that the research team can accurately convey what it issetting out to do.” (Bammer, 2013, p. 40). Bammer also outlines the importance
- 55 -
of understanding blind spots that exist because of our values, arguing that adisproportionate amount of time can be spent exploring certain perspectivesbecause of our values.
Understanding that framing and values can create blind spots in a groupdynamic is important, but Smithson (Bammer & Smithson, 2009, p. 21) arguesthat blind spots are actually a form of social contract. In fact, blind spots aroundunknowns within a group are required for learning, creativity, social relations andcultural practices. An example that Smithson provides is trust. When two peopletrust each other, they create a blind spot in their relationship through the quasi-contractual arrangement. This allows the pair to be productive without the needto continuously question the trust relationship. That is, until that trust isbreached.
The field of I2S is still in its developing stages, but promises to be a rich area ofpractical application of the concepts from cognitive science discussed in thissection.
3.2.5 Application of Cognitive Science perspectives to the T&P activity
In this summary, I describe how cognitive science perspectives and approachesdescribed here relate to the carbon cycle, described in Chapter 2, and to theT&P activity, described in Chapter 4.
Communication and Framing
As mentioned, careful attention is required around the language that is used todescribed the T&P activity. The topic of climate change is often politicised, andefforts have been made in the activity to present the carbon cycle in neutrallanguage. In the design of the experiment, two discrete sets of language were usedin the descriptions of the components of the T&P activity. In the first set, theterms ‘emissions’ and ‘absorptions’ were used to describe the flows in the carboncycle. During the workshop facilitations, it became clear that some participantsdid not have the same a priori understanding of these concepts. In the second setof experiments, the terms ‘additions’ and ‘removals’ were interchanged into theT&P activity. This is described in more detail in §4.2.
- 56 -
Conceptual metaphors and Shared conceptual repertoires
The T&P activity represents a physical analogue of the carbon cycle. It is itself aconceptual metaphor; that is, it is a tool for understanding one thing (the carboncycle) in terms of another (the T&P system). The interaction with the physicalanalogue as a group establishes a shared conceptual repertoire for discussion andcommunication of ideas. Participants can use the T&P system as a basis fordiscussion about the carbon cycle, such as an increase in the speed of the pumpsto represent an increase in the rate of emissions. Participants can also discuss thedynamics of the carbon cycle in terms of the T&P activity, such as a reduction ofemissions being represented by slowing the speed of a pump. The mapping of theconceptual metaphor is discussed further in §4.3.
3.3 A Learning & Teaching perspective on constructing knowledge
The L&T perspective is the final perspective I explore in relation to double-looplearning. Learning is more than the simple process of knowledge transfer frominstructor to student. Effective learning occurs when mental models aredeveloped, adjusted and enhanced by the learner. This process is innately experi-ential, embodied and continuous.
In this section, I will explore three key ideas. First, I discuss scaffolding andsocial learning as a way of escaping bounded rationality. Second, I relate experi-ential abstraction to concrete learning, and the role of transitional objects as atool for relating the physical world to systems of knowledge. Third, I exploreactive learning as a tool for developing higher-order thinking skills. To concludethe chapter, I relate the concepts from the L&T perspective to the T&P activity.
3.3.1 Learning & Teaching methods to escape bounded rationality
One way to investigate the nature of learning is to look at the structure of theformal learning system: the education system. The education system is broad andcomplex, with many different goals, perspectives and approaches. The educationsystem has a reputation for passive approaches, where the process of learning isoften a process of storing and retrieving information, rather than construction ofknowledge.
- 57 -
I think it’s an exaggeration, but there’s a lot of truth insaying that when you go to school, the trauma is that youmust stop learning and you must now accept being taught.
- Seymour Papert in discussion with Paulo Freire(Afternoon Journal c1980)
Meadows (2008) notes that the over-arching purpose of a university is to discoverand preserve knowledge and to pass it on to future generations, but sub-purposescan pervert that goal. For example, if the goal of a student is to get a goodgrade, this does not necessarily require her or him to learn, provided they canachieve a good grade by other means. If, instead, the goal of the student was todiscover knowledge, she or he could indeed learn quite a lot, but fail the course.
Education thus becomes an act of depositing, in which thestudents are the depositories and the teacher is thedepositor. Instead of communicating, the teacher issuescommuniques and makes deposits which the studentspatiently receive, memorize, and repeat. This is the‘banking’ concept of education, in which the scope of actionallowed to the students extends only as far as receiving,filing, and storing the deposits. They do, it is true, have theopportunity to become collectors or cataloguers of the thingsthey store. But in the last analysis, it is men themselves whoare filed away through the lack of creativity, transformation,and knowledge in this (at best) misguided system. For apartfrom inquiry, apart from the praxis, men cannot be trulyhuman. Knowledge emerges only through invention andreinvention, through the restless, impatient, continuing,hopeful inquiry men pursue in the world, with the world,and with each other.
– Friere (2005, p. 72)
A learner can escape bounded rationality through creativity. Creativity is centralto problem solving, and a necessary skill for problem solvers of the future.Creativity in education is a topic often discussed in various fora, and examplesfrom popular culture are common. Sir Ken Robinson’s (2006) TED talk titled‘How schools kill creativity’ describes how creativity is as important as literacy,how schools push students out of creative subjects, and how intelligence is and
- 58 -

should be recognised as diverse and dynamic. “We have to rethink thefundamental principles on which we are educating our children.” This talk is alsothe most-watched TED talk, with over 31 million views (May 2013; TED n.d.).
American folk singer Harry Chapin describes the story of a young boy enteringthe American education system, who progressively has his creativity squashed inthe teacher’s pursuit of uniformity and standardised teaching practices.
The little boy went first day of school He got some crayons and started to drawHe put colors all over the paperFor colors was what he saw
And the teacher said, “What you doin' young man?”“I'm paintin' flowers,” he saidShe said, “It's not the time for art, young man“And, anyway, flowers are green and red
“There's a time for everything, young man“And a way it should be done“You've got to show concern for everyone else“For you're not the only one.”
And she said, “Flowers are red, young man”“Green leaves are green“There's no need to see flowers any other way“Than the way they always have been seen.”
But the little boy said, “There are so many colors in therainbow,“So many colors in the morning sun“So many colors in the flower “And I see every one.”
- ‘Flowers are Red’, Harry Chapin (1978)
This theme is common in the educational literature too. Despite China’s extraor-dinary and consistent results in standardised testing, especially the computa-tional abilities of students from its education system, the nation is facing a direcreativity shortage. Zhao (2014) argues that a focus on creativity is essential toChina’s future economic growth. Martinez & Stager (2013) are direct in
- 59 -
describing what educators need to do to promote creativity in the classroom:“students learn creativity by being creative.” By being creative, they are activeparticipants in the knowledge-construction process.
Piaget proposes that an education should involve the full development of anactive and independent mind:
The traditional school offers the student a considerable bodyof knowledge and gives him the opportunity to apply it tovarious problems or exercises. It “furnishes” the mind andsubjects it to various “intellectual gymnastics” which areentrusted with strengthening and developing it. In caseswhere this type of learning is forgotten ... there remains atleast some satisfaction in having exercised the intelligence ...having once known [it] becomes the important objective. Astudent who achieves a certain knowledge through freeinvestigation and spontaneous effort will later be able toretain it; he will have acquired a methodology that can servehim for the rest of his life, which will stimulate his curiositywithout the risk of exhausting it.
– Piaget (1973, pp. 92-93)
Piaget’s active learning approach emphasises the construction of knowledge in thelearner’s mind, rather than the learning and application of the content itself.Hattie (2013) rates Piagetian programs in early education far more effectiverelating to achievement than traditional methods employed in engineering, suchas direct instruction, and even more progressive methods, such as problem-basedlearning and mastery learning.
Scaffolding
Mental models represent a subset of the real world. In order to move beyond thebounded rationality of mental models, active learning approaches are required tofoster deep learning and understanding about the topic at hand. Learning is asocial, collaborative process between peers and with the facilitator.
- 60 -
The traditional school recognizes only the social exchangethat is connected with a teacher, who is a kind of absoluteruler in control of moral and intellectual truth over eachindividual student. Collaboration among the students andeven direct communication among them are thus excludedfrom classwork and homework (because of the examinationatmosphere and ‘grades’ to be met). The active school, onthe other hand, presupposes working in common, alternatingbetween individual work and work in groups, since collectiveliving has been shown to be essential to the full developmentof the personality in all its facets - even the moreintellectual.
– Piaget (1973, p. 108)
Vygotsky (1978; 1986) recognised learning and reasoning as a product of both apractical and social activity. The relationship between the learner’s context andthe learner’s interaction within that context is fundamental to Vygotsky’ssociocultural philosophy. An important part of this is the interaction betweenlearners at different stages of development. More advanced learners can assist lessadvanced learners through situating learning just outside of their immediatecapability, a location he described as the Zone of Proximal Development. Themore advanced learner provides a scaffold and environment for effectivelyassisting a less-advanced learner.
This, of course, can occur on an individual or group level. Effective scaffolding ina group environment does not necessarily result in all members thinking the samething: indeed, this would be disastrous for creativity. Rather, the sharing ofscaffolded mental models can be used as an opportunity for individuals to expandtheir own understanding and assimilate relevant information into new mentalmodels.
In a university setting, reframing the student body as a community of learners,and lecturers as facilitators, can have an enormous effect on how knowledge isconstructed and mental models are shared. Here, I speak briefly from my shortexperience as a university lecturer, where I have done exactly this. My approachhas been recognised with an Office of Learning & Teaching Australian Award forUniversity Teaching in 2014.
- 61 -

In my systems engineering classroom, learning is distributed. In any given week, Ifacilitate a theory topic with a subset of students using a case study. Thesestudents collaborate in groups of 4-5 through a concrete learning activity. Thisactivity has been designed by an undergraduate research student, whom I haveworked with to design the activity and conduct research on its effectiveness (seeBrowne & Rajan 2015 for an example). The students become facilitators, and runtheir version of the lesson with their peers. The tutors in my class act as mentors.There is no exam, removing the poor learning behaviour that that mode ofassessment encourages. Instead, students peer review each other’s workthroughout the semester and work towards a research portfolio on a topic that isrelevant to them.
At this time my observations of the effectiveness of this approach are largelyanecdotal; however, they are powerful. I often feel like I, as lecturer, could beremoved from the whole process. I had one instance where a tutor had forgottento attend a tutorial. Instead of the class sitting idle or perhaps leaving, thestudents agreed that they would send me a message, and forge ahead. When Iarrived towards the end of class, the students offered me a video recording of thetutorial from a smartphone, and individual feedback sheets so that I could assessthe facilitation. The students had become powerful advocates for their ownlearning. The power of a distributed learning approach turned what could havebeen an awful mistake into a fantastic learning experience.
This sits in stark contrast to tea room conversations with colleagues. Recently, asenior colleague talked at me about how he could not understand why his lectureattendance was so low, as he hadn’t changed his approach to teaching the coursein the many years that he had taught it. He also offered up his own critique ofmy approach: that students don’t like it because they have to think.
I share this experience because it offers an example of why it is important to seehow we create learning environments within our own bounded rationality. Mycolleague is stuck in the bounded rationality of his own mental models of whatlearning should look like, and at the same time my students were activelychallenging and sharing their mental models by engaging in peer-facilitatedconcrete activities.
- 62 -
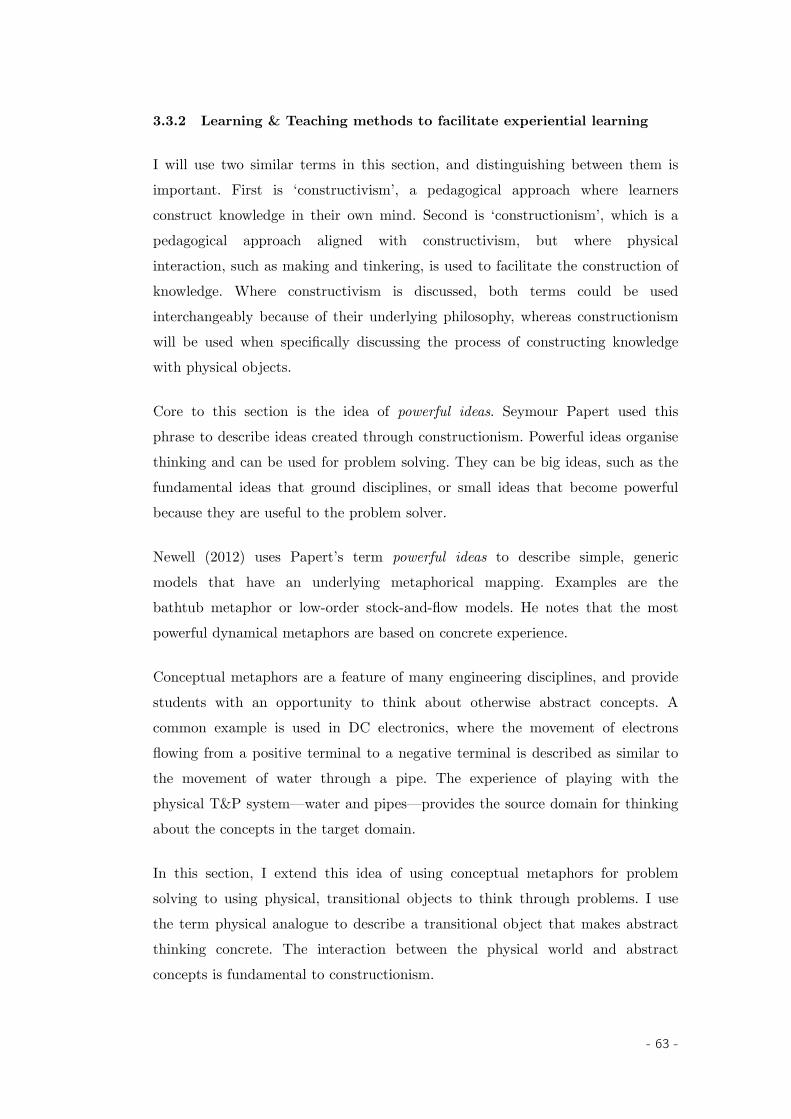
3.3.2 Learning & Teaching methods to facilitate experiential learning
I will use two similar terms in this section, and distinguishing between them isimportant. First is ‘constructivism’, a pedagogical approach where learnersconstruct knowledge in their own mind. Second is ‘constructionism’, which is apedagogical approach aligned with constructivism, but where physicalinteraction, such as making and tinkering, is used to facilitate the construction ofknowledge. Where constructivism is discussed, both terms could be usedinterchangeably because of their underlying philosophy, whereas constructionismwill be used when specifically discussing the process of constructing knowledgewith physical objects.
Core to this section is the idea of powerful ideas. Seymour Papert used thisphrase to describe ideas created through constructionism. Powerful ideas organisethinking and can be used for problem solving. They can be big ideas, such as thefundamental ideas that ground disciplines, or small ideas that become powerfulbecause they are useful to the problem solver.
Newell (2012) uses Papert’s term powerful ideas to describe simple, genericmodels that have an underlying metaphorical mapping. Examples are thebathtub metaphor or low-order stock-and-flow models. He notes that the mostpowerful dynamical metaphors are based on concrete experience.
Conceptual metaphors are a feature of many engineering disciplines, and providestudents with an opportunity to think about otherwise abstract concepts. Acommon example is used in DC electronics, where the movement of electronsflowing from a positive terminal to a negative terminal is described as similar tothe movement of water through a pipe. The experience of playing with thephysical T&P system—water and pipes—provides the source domain for thinkingabout the concepts in the target domain.
In this section, I extend this idea of using conceptual metaphors for problemsolving to using physical, transitional objects to think through problems. I usethe term physical analogue to describe a transitional object that makes abstractthinking concrete. The interaction between the physical world and abstractconcepts is fundamental to constructionism.
- 63 -
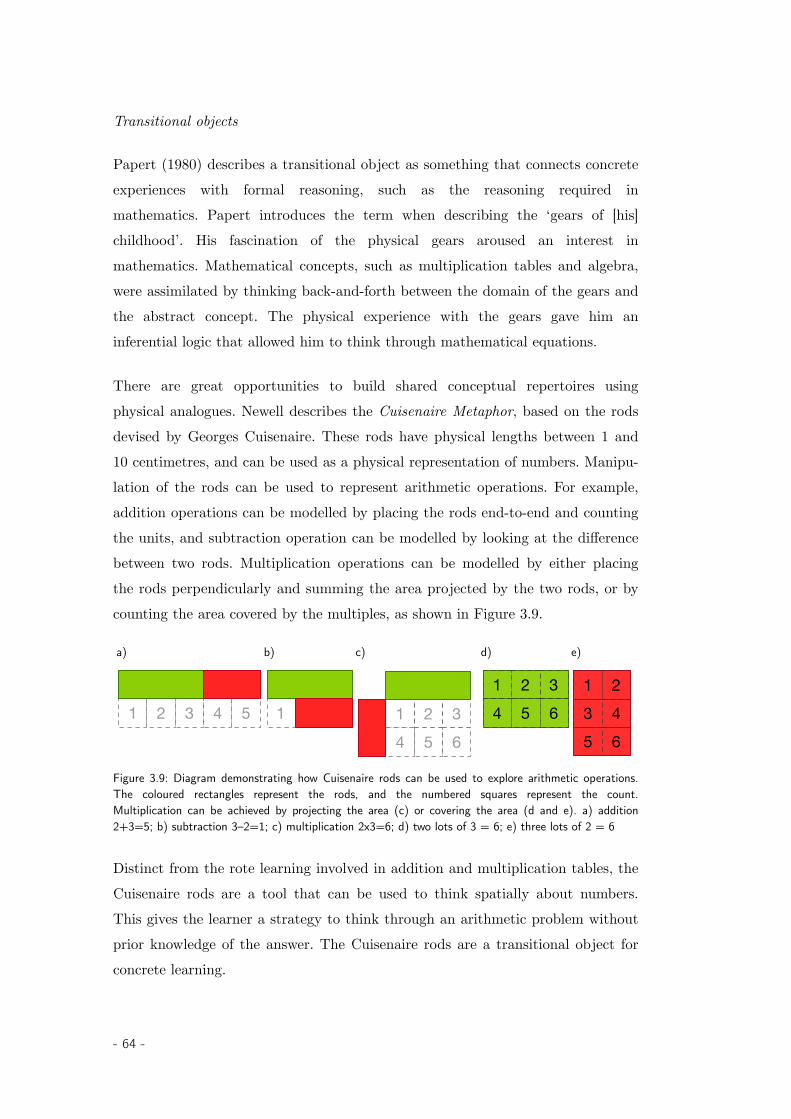
Transitional objects
Papert (1980) describes a transitional object as something that connects concreteexperiences with formal reasoning, such as the reasoning required inmathematics. Papert introduces the term when describing the ‘gears of [his]childhood’. His fascination of the physical gears aroused an interest inmathematics. Mathematical concepts, such as multiplication tables and algebra,were assimilated by thinking back-and-forth between the domain of the gears andthe abstract concept. The physical experience with the gears gave him aninferential logic that allowed him to think through mathematical equations.
There are great opportunities to build shared conceptual repertoires usingphysical analogues. Newell describes the Cuisenaire Metaphor, based on the rodsdevised by Georges Cuisenaire. These rods have physical lengths between 1 and10 centimetres, and can be used as a physical representation of numbers. Manipu-lation of the rods can be used to represent arithmetic operations. For example,addition operations can be modelled by placing the rods end-to-end and countingthe units, and subtraction operation can be modelled by looking at the differencebetween two rods. Multiplication operations can be modelled by either placingthe rods perpendicularly and summing the area projected by the two rods, or bycounting the area covered by the multiples, as shown in Figure 3.9.
a) b) c) d) e)
1 2 3 4 5 1 1 2 34 5 6
1 2 34 5 6
1 2
53 4
6
Figure 3.9: Diagram demonstrating how Cuisenaire rods can be used to explore arithmetic operations.The coloured rectangles represent the rods, and the numbered squares represent the count.Multiplication can be achieved by projecting the area (c) or covering the area (d and e). a) addition2+3=5; b) subtraction 3–2=1; c) multiplication 2x3=6; d) two lots of 3 = 6; e) three lots of 2 = 6
Distinct from the rote learning involved in addition and multiplication tables, theCuisenaire rods are a tool that can be used to think spatially about numbers.This gives the learner a strategy to think through an arithmetic problem withoutprior knowledge of the answer. The Cuisenaire rods are a transitional object forconcrete learning.
- 64 -
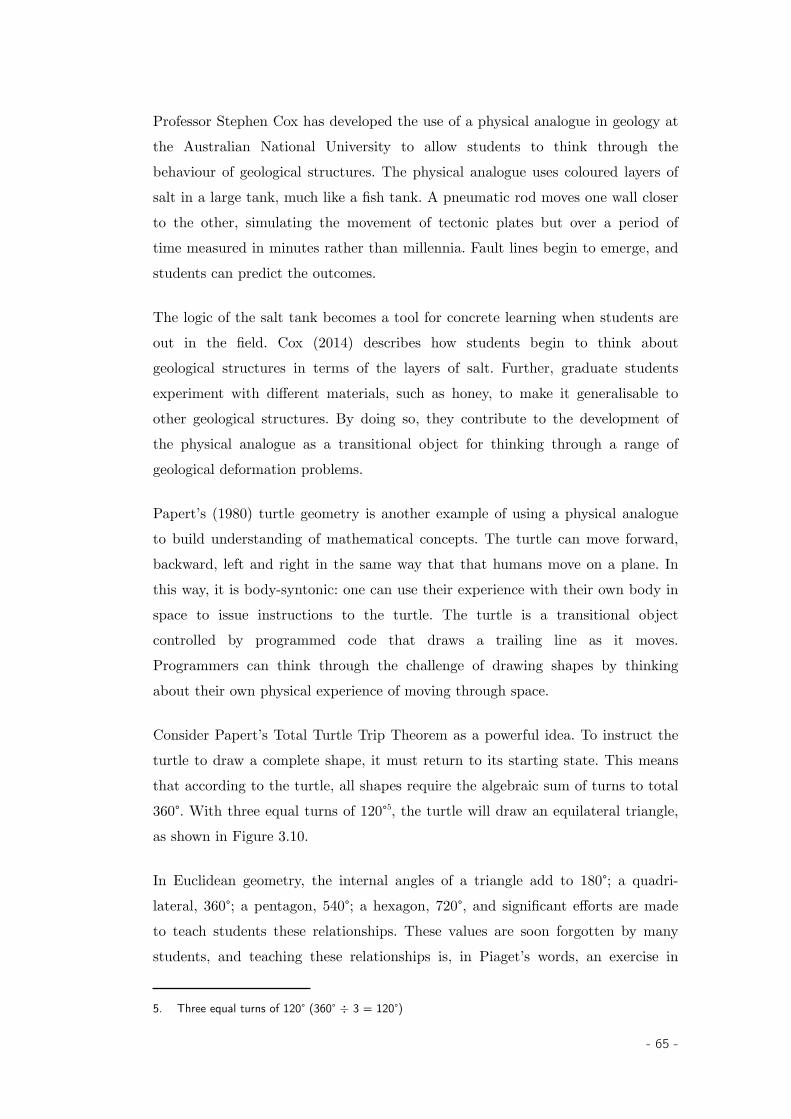
Professor Stephen Cox has developed the use of a physical analogue in geology atthe Australian National University to allow students to think through thebehaviour of geological structures. The physical analogue uses coloured layers ofsalt in a large tank, much like a fish tank. A pneumatic rod moves one wall closerto the other, simulating the movement of tectonic plates but over a period oftime measured in minutes rather than millennia. Fault lines begin to emerge, andstudents can predict the outcomes.
The logic of the salt tank becomes a tool for concrete learning when students areout in the field. Cox (2014) describes how students begin to think aboutgeological structures in terms of the layers of salt. Further, graduate studentsexperiment with different materials, such as honey, to make it generalisable toother geological structures. By doing so, they contribute to the development ofthe physical analogue as a transitional object for thinking through a range ofgeological deformation problems.
Papert’s (1980) turtle geometry is another example of using a physical analogueto build understanding of mathematical concepts. The turtle can move forward,backward, left and right in the same way that that humans move on a plane. Inthis way, it is body-syntonic: one can use their experience with their own body inspace to issue instructions to the turtle. The turtle is a transitional objectcontrolled by programmed code that draws a trailing line as it moves.Programmers can think through the challenge of drawing shapes by thinkingabout their own physical experience of moving through space.
Consider Papert’s Total Turtle Trip Theorem as a powerful idea. To instruct theturtle to draw a complete shape, it must return to its starting state. This meansthat according to the turtle, all shapes require the algebraic sum of turns to total360°. With three equal turns of 120°5, the turtle will draw an equilateral triangle,as shown in Figure 3.10.
In Euclidean geometry, the internal angles of a triangle add to 180°; a quadri-lateral, 360°; a pentagon, 540°; a hexagon, 720°, and significant efforts are madeto teach students these relationships. These values are soon forgotten by manystudents, and teaching these relationships is, in Piaget’s words, an exercise in
5. Three equal turns of 120° (360° ÷ 3 = 120°)
- 65 -
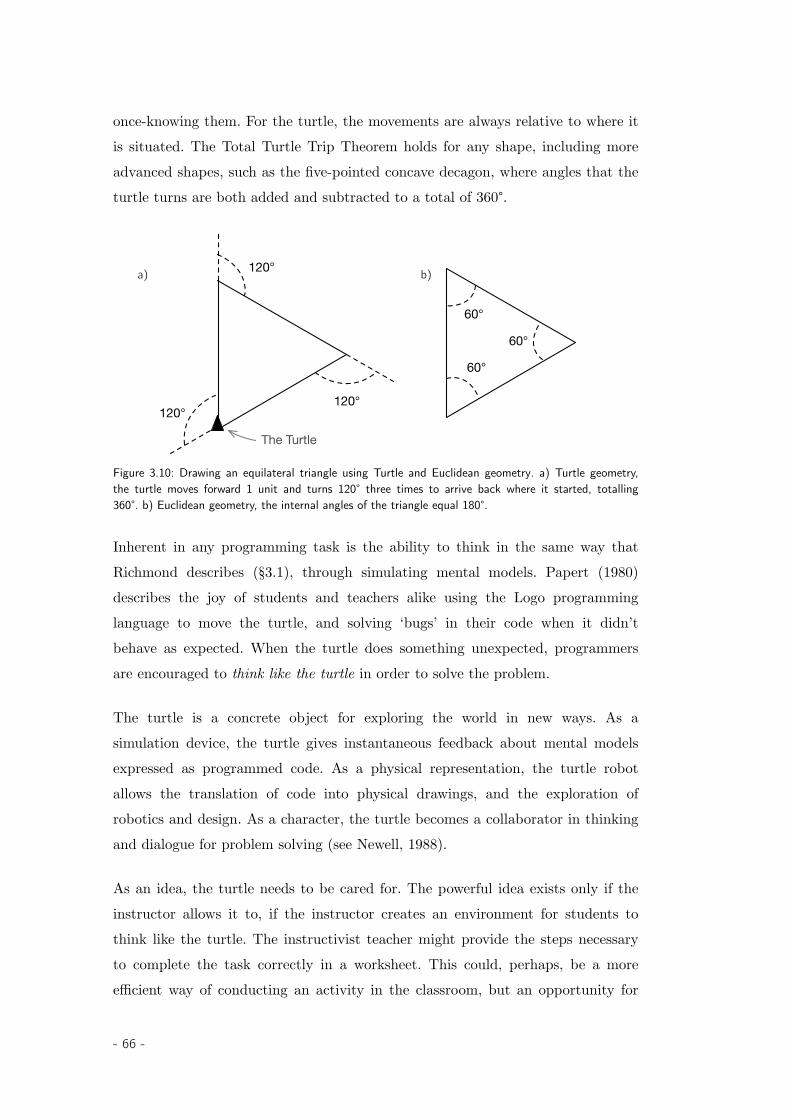
once-knowing them. For the turtle, the movements are always relative to where itis situated. The Total Turtle Trip Theorem holds for any shape, including moreadvanced shapes, such as the five-pointed concave decagon, where angles that theturtle turns are both added and subtracted to a total of 360°.
a)
120°
120°
120°
The Turtle
b)
60°
60°
60°
Figure 3.10: Drawing an equilateral triangle using Turtle and Euclidean geometry. a) Turtle geometry,the turtle moves forward 1 unit and turns 120° three times to arrive back where it started, totalling360°. b) Euclidean geometry, the internal angles of the triangle equal 180°.
Inherent in any programming task is the ability to think in the same way thatRichmond describes (§3.1), through simulating mental models. Papert (1980)describes the joy of students and teachers alike using the Logo programminglanguage to move the turtle, and solving ‘bugs’ in their code when it didn’tbehave as expected. When the turtle does something unexpected, programmersare encouraged to think like the turtle in order to solve the problem.
The turtle is a concrete object for exploring the world in new ways. As asimulation device, the turtle gives instantaneous feedback about mental modelsexpressed as programmed code. As a physical representation, the turtle robotallows the translation of code into physical drawings, and the exploration ofrobotics and design. As a character, the turtle becomes a collaborator in thinkingand dialogue for problem solving (see Newell, 1988).
As an idea, the turtle needs to be cared for. The powerful idea exists only if theinstructor allows it to, if the instructor creates an environment for students tothink like the turtle. The instructivist teacher might provide the steps necessaryto complete the task correctly in a worksheet. This could, perhaps, be a moreefficient way of conducting an activity in the classroom, but an opportunity for
- 66 -
learning and inquiry has been missed. The constructivist would pose a questionthat extends the student at each stage; for example, How could you draw acircle? How could you use your knowledge of drawing a circle to draw a flower?Now, how could you draw a field of flowers?
Like the other examples in this section, the concrete experience with the turtlegives the learner a framework to think about problems intuitively and creatively,without the need for memorising vast amounts of information. These analoguesare tools for the concrete learning that can help learners develop an intuitiveunderstanding of dynamical problems. This intuition is important to develop inour future engineers, who will need strategies to work through undefinedproblems without clear solutions.
3.3.3 Learning & Teaching methods to create dynamical connections
A constructionist approach places the learner in an active environment wheremental models are developed as part of the synthesis of knowledge andinteraction with the real world to build understanding. This places the learneractively in a position to exercise higher-order thinking skills.
Higher-order thinking skills
Developing higher-order thinking skills is important in a university setting. Manyeducational philosophers have described thinking skills along a continuum oflower-order to higher-order. Bloom’s taxonomy (Bloom, 1956) is the mostfrequently used arrangement of thinking skills, with activities such asremembering, imitating and recognising sitting at the lower end and activitiessuch as synthesis, construction and evolution of knowledge sitting at the upperend.
The role of the educational institution and the development of higher-orderthinking skills is described differently by other philosophers. Piaget (1973)describes this process as invention. Dewey (1938) describes this progressiveeducation as arousal of an active quest for information for the production of newideas. Biggs (Biggs & Collis, 1982) describes these qualities in the evaluation ofunderstanding as generalising to a new domain. Kolb (1984) describes this as theconstruction of new knowledge. Papert (1980) describes this as assimilation and
- 67 -

construction of knowledge by the learner. Constructivist and experientialapproaches encourage imaginative thought and the transfer knowledge betweencontexts by building understanding through experience.
With these concepts in mind, the dominant activities in university educationstand out as ineffective in addressing challenges around effective communication,as discussed in §3.2. Take the university lecture hall, for example. Given Newell’siterative loop required for effective communication, it would be unrealistic toimagine that students left a lecture having completely constructed adequateunderstanding of the lecturer’s intended meaning. Over four decades ago6, DonaldBligh questioned the effectiveness of lectures:
1. The lecture is as effective as any other method fortransmitting information, but not more effective.
2. Most lectures are not as effective as discussion methodsto promote thought.
3. Changing student attitudes should not normally be themajor objective of a lecture.
4. Lectures are ineffective to teach behavioural skills.- Blight (2000, p. 4)
Efforts have been made to address the technical problems of communication, suchas by making lecture notes and recordings available. This may be reinforcedthrough other class activities, such as tutorials or the summative comments givenon marked assignments or tests, but the delays in this back-and-forth process andthe inherent power relationship between lecturer and student make lectures asuboptimal activity for communication and learning.
Technology may provide solutions to these basic communication problems. Thereis recent evidence that the use of ‘clickers’, a tool that allows students to providereal-time responses to multiple-choice questions, in large lectures can promoteactive learning and help provide some feedback to both students and theinstructor (MacArthur & Jones, 2008; Lantz, 2010; Buskes et al, 2010); however,there are also acknowledgments that lectures are “a relic of the passive teachingparadigm of the past” (Buskes et al, 2010). Others have created much morestudent-centred environments by providing opportunities to leverage learning as a
6. in his 1971 book
- 68 -
social process. Movements, such as problem-based learning and the flippedclassroom, put students in charge of their learning by making them active in thelearning process, through active problem solving and student-centred activities.Peer-to-peer teaching further encourages students to engage in the learningprocess, such as the student-planned and delivered tutorials (Baker 1996; Smith& Browne, 2013). These learning environments allow students to become activestakeholders in the quality of their learning.
Active learning loops
There is a strong link between the way that ST practitioners view developingmental models as a continuous process based on experience, the way that manyL&T practitioners describe learning, and the continuous improvement approachesseen in systems and process engineering. Kolb (1984) describes the process ofexperiential learning as a cycle of continuous activity of processing andperception. The learner moves through four stages in an iterative loop:
• concrete experience: physical experience of something in the real world• reflective observation: creating meaning out of the concrete experience• abstract conceptualisation: distilling out the key, transferable ideas• active experimentation: modification of decisions based on what has been
learnt
Kolb’s model is common to design and engineering practice, which can provide auseful parallel. Deming (2000) proposed similar cycles for process and qualityimprovement. His approach is often called plan-do-study-act7:
• plan: a process is selected• do: a process is implemented• study: the outcomes are observed and behaviour is understood• act: modification of decisions based on what has been learnt
7. Plan-do-study-act. The original sequence was plan-do-check-act, but this was later changed byDeming to better describe his original intent: the analytical behaviour of studying rather than theprocess behaviour of checking
- 69 -
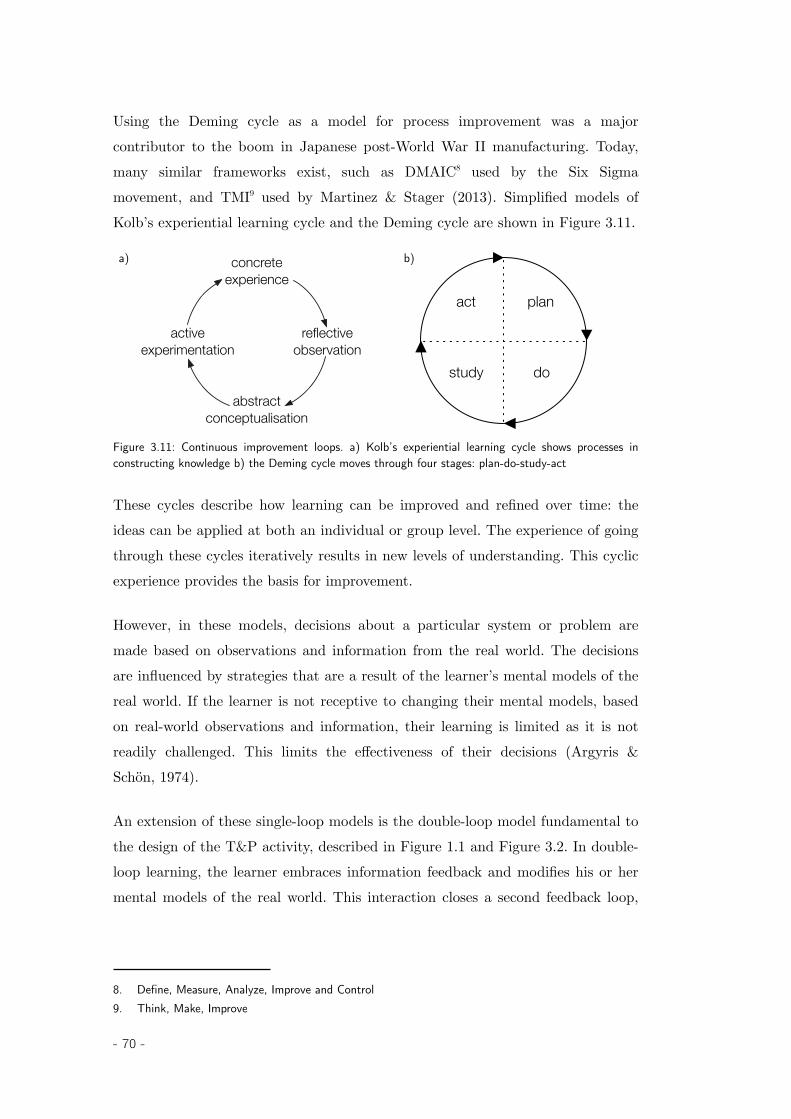
Using the Deming cycle as a model for process improvement was a majorcontributor to the boom in Japanese post-World War II manufacturing. Today,many similar frameworks exist, such as DMAIC8 used by the Six Sigmamovement, and TMI9 used by Martinez & Stager (2013). Simplified models ofKolb’s experiential learning cycle and the Deming cycle are shown in Figure 3.11.
a) concreteexperience
abstractconceptualisation
activeexperimentation
reflectiveobservation
b)
act plan
dostudy
Figure 3.11: Continuous improvement loops. a) Kolb’s experiential learning cycle shows processes inconstructing knowledge b) the Deming cycle moves through four stages: plan-do-study-act
These cycles describe how learning can be improved and refined over time: theideas can be applied at both an individual or group level. The experience of goingthrough these cycles iteratively results in new levels of understanding. This cyclicexperience provides the basis for improvement.
However, in these models, decisions about a particular system or problem aremade based on observations and information from the real world. The decisionsare influenced by strategies that are a result of the learner’s mental models of thereal world. If the learner is not receptive to changing their mental models, basedon real-world observations and information, their learning is limited as it is notreadily challenged. This limits the effectiveness of their decisions (Argyris &Schön, 1974).
An extension of these single-loop models is the double-loop model fundamental tothe design of the T&P activity, described in Figure 1.1 and Figure 3.2. In double-loop learning, the learner embraces information feedback and modifies his or hermental models of the real world. This interaction closes a second feedback loop,
8. Define, Measure, Analyze, Improve and Control9. Think, Make, Improve
- 70 -
and makes the learner more effective. Argyris (1976) identifies two factors thatinhibit learning: the ability to measure the effectiveness of decisions (the firstloop), and; the receptivity to corrective feedback (the second loop).
This observation places learning and the accumulation of knowledge in adynamical context, where decisions are made, action is taken, outcomes areobserved, mental models are revised and new decisions made based on the revisedmental models. The key difference between single- and double-loop learning isthat mental models are explored, challenged and improved continuously in thelatter. This offers insights into the design of the T&P activity. First, that theactivity should provide an experience that promotes an opportunity to engage initerations of learning cycles, and, second, that there is an opportunity tochallenge the mental models that participants bring to the activity.
3.3.4 Application of Learning & Teaching perspectives to the T&P activity
In this section, I summarise the L&T perspective by providing a pre-emptiveoutline of how the L&T perspectives and approaches described here relate to theT&P activity, which is described in detail in Chapter 4.
Creativity and Scaffolding
In the T&P activity, the instructions have been carefully constructed to graduallyincrease in difficulty. Early tasks orientate participants to the physicalfunctioning of the system, and then tasks build in cognitive difficulty. The tasksin the T&P activity are described in §4.2. Answers to prompts are open-ended,and playing with the physical system is encouraged, allowing for scaffolded,creative thinking.
Transitional objects and concrete learning
As discussed in §2.3.5, the T&P system represents a physical analogue of thecarbon cycle. The pumping of water between tubs using hand-held pumps is aphysical experience of stocks and flows. Similar to Papert’s Turtle, participants
- 71 -
can use the T&P system to think through the problems they are given throughthe activity, and use the T&P system to physically simulate alternative strategiesaround the problems.
Higher-order thinking skills and active learning loops
The goal of the T&P activity is for the participant to be able to transfer theirknowledge from the activity to the real-world, thus engaging in higher-orderthinking. In the design of the T&P activity, careful selection of prompts wereused to encourage multiple cycles around learning loops, and indeed double-looplearning. The prompts are described in §4.2. Treatment conditions were designedaround the use of different prompts, including the use of scenario cards, groupdiagrams and pictorial representations.
3.3.5 Constructing knowledge in engineering education
Here I briefly summarise the L&T perspectives in relation to universityengineering education. Creating environments where student engineers candevelop their mental models in meaningful ways requires understanding what weconsider to be the goal of a university engineering education.
The technology that engineers engage with and use to solve problems changesover time. Consider the speed at which telecommunications have developed overrecent decades. New generations of communication infrastructure are continuallybeing researched, developed, provisioned, and replaced. However, little haschanged in many aspects of engineering pedagogy over recent history, despite themassive leaps forward in technology.
The process of learning is more important than the content we teach studentengineers. Trevelyan (2010) notes that major parts of engineering practice are therules-of-thumb that engineers use as part of their vernacular. This draws parallelswith the earlier observation from Maxwell et al (1994) that decision-makers carry‘causal chunks’ around in their minds. These rules-of-thumb come from a range ofexperiences. Trevelyan (2014) further argues that important skills required inprofessional practice, such as life-long learning, are not learnt at university. Thisis a key challenge for engineering educators.
- 72 -
In reality, engineering professional practice is team-based. Senge (2006) describesthree core learning capabilities for a team: fostering aspiration, developingreflective conversation, and understanding complexity. Fostering aspiration can bebuilt through personal mastery (technical skills development) and having ashared group vision. Reflective conversation calls for the sharing of mentalmodels and dialogue. Systems thinking is a useful tool for understandingcomplexity.
Engineering faculties have an important role to play in preparing our students forthe transition from young adults to graduate engineers. A university educationshould equip students with the working knowledge and technical vocabulary toenter the workforce, but more importantly equip students with the disciplinarytools they can use to grapple with complexities regardless of their final vocation.However, it is still the case that:
Too much pedagogy is concerned solely with the transferof information. Even an education directed towardsimmediate vocational ends is less than it could be, andgraduates are left with less potential than they mighthave, if it fails to engage the student in grappling withuncertainty, with deep underlying issues and with context.
- Boulton & Lucas (2008)
A university engineering department should be a place where a student’s mentalmodels are continuously challenged, and where double-loop learning is integratedand continuous in order to prepare graduates for the challenges of addressingcomplex real-world problems.
3.4 Towards a double-loop learning activity
The purpose of this chapter was to establish considerations for the pedagogicalapproach behind the T&P activity. To summarise this chapter, the model inFigure 3.2 is revisited and instantiated into a learning environment for the T&Pactivity in Figure 3.12. The three loops: physical simulation, scaffolded refinementand focussed dialogue represent a synthesis of the concepts and ideas described inthis chapter.
- 73 -
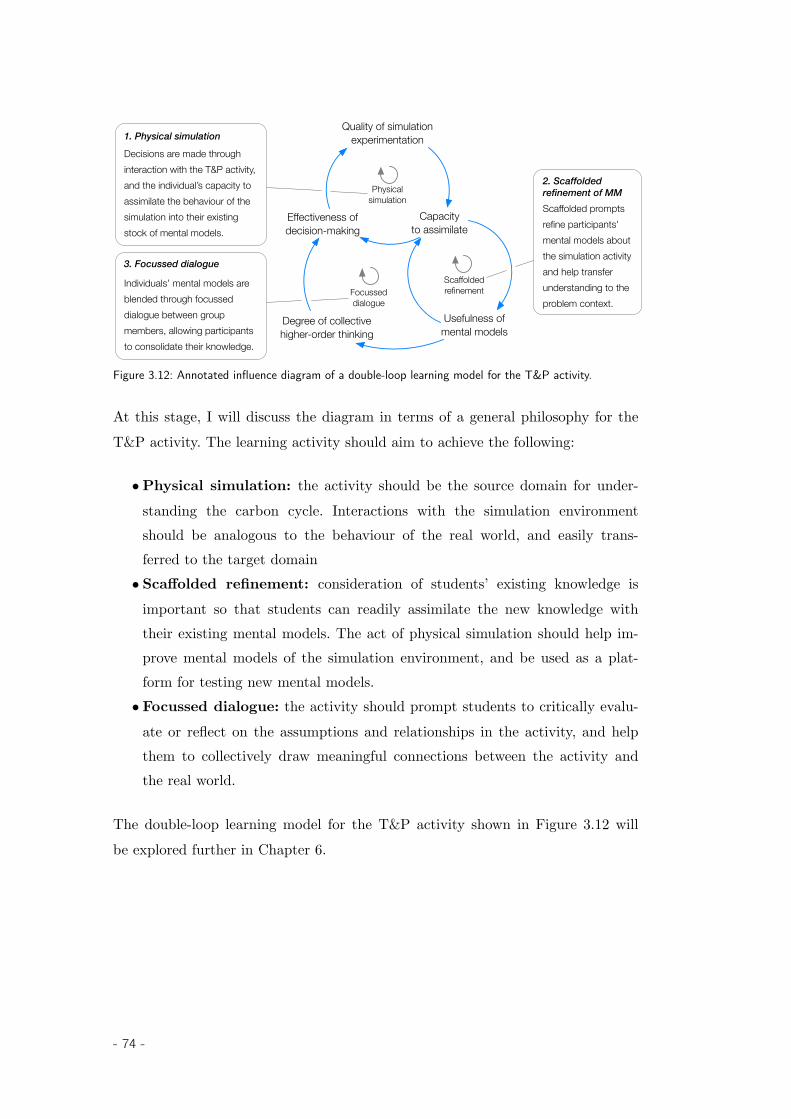
1. Physical simulation
Scaffolded prompts refine participants’ mental models about the simulation activity and help transfer understanding to the problem context.
2. Scaffolded refinement of MM
Decisions are made through interaction with the T&P activity, and the individual’s capacity to assimilate the behaviour of the simulation into their existing stock of mental models.
3. Focussed dialogue
Individuals’ mental models are blended through focussed dialogue between group members, allowing participants to consolidate their knowledge.
Quality of simulationexperimentation
Capacityto assimilate
Usefulness ofmental models
Physicalsimulation
Focusseddialogue
Degree of collectivehigher-order thinking
Scaffolded refinement
Effectiveness of decision-making
Figure 3.12: Annotated influence diagram of a double-loop learning model for the T&P activity.
At this stage, I will discuss the diagram in terms of a general philosophy for theT&P activity. The learning activity should aim to achieve the following:
• Physical simulation: the activity should be the source domain for under-standing the carbon cycle. Interactions with the simulation environmentshould be analogous to the behaviour of the real world, and easily trans-ferred to the target domain
• Scaffolded refinement: consideration of students’ existing knowledge isimportant so that students can readily assimilate the new knowledge withtheir existing mental models. The act of physical simulation should help im-prove mental models of the simulation environment, and be used as a plat-form for testing new mental models.
• Focussed dialogue: the activity should prompt students to critically evalu-ate or reflect on the assumptions and relationships in the activity, and helpthem to collectively draw meaningful connections between the activity andthe real world.
The double-loop learning model for the T&P activity shown in Figure 3.12 willbe explored further in Chapter 6.
- 74 -

PART II RESEARCH APPROACH
Preface
In Part II, the workshop methodology and results are presented, representing themajority of the original research in this thesis.
Before I discuss the methodology, I will briefly outline the specific terminology Iuse in this chapter to describe the research activities. An overview of theseactivities are shown in Table 4.1.
• Experiments refer to discrete sets of similar workshops, targeted at answering
a research question. Three experiments were conducted, referred to as theChecklist, Simulation and Dialogue experiments. The Simulation and Dialogueexperiments used a Workbook as instructions, and are collectively referred to asthe Workbook experiments.
• Treatment conditions refer to deliberate differences within experiments. The
Checklist experiment had treatment conditions with respect to the assessmenttask; the Simulation experiment had treatment conditions with respect tophysical and mental simulation, and; the Dialogue experiment had treatmentconditions with respect to different instructions that prompted dialogue withingroups.
• Assessment refers to the tasks in assessment sheets used to examine decision-
making in the activity. There are three distinct assessment sheets that weredeveloped: Emissions & Removals (ER), Anthropogenic Emissions (AE), and;Anthropogenic Additions (AA).
• Instructions refer to the instructions used by the participants to guide the
T&P activity. There are two distinct instruction types: checklist and workbook.These terms are also used to describe the two categories of experiments referred
- 75 -

to in the experiments section. The term ‘workshop instructions’ is used todescribe the additional instructions in a workshop, such as the introductoryvideo.
• Tasks refer to individual instructions in the workshop; for example, “Ask the
Natural Emissions to pump to a level of half the capacity of the atmosphericstock, then stop”.
• Groups refer to a grouping of 3-6 students that manipulated one T&P system
as a team. There were typically 3-5 groups in one workshop session.
• Workshops refer to the experience that a participant had completing the task.
In all instances, a workshop could be described as a hands-on tutorial.
In Chapter 4, I present the workshop methodology, including a description of theT&P system, workshop instructions, treatment conditions and assessment tasks.This leads to Chapter 5, where I present the results from the assessment tasks bytreatment condition, course cohorts, assessment sheets and profile data.
- 76 -
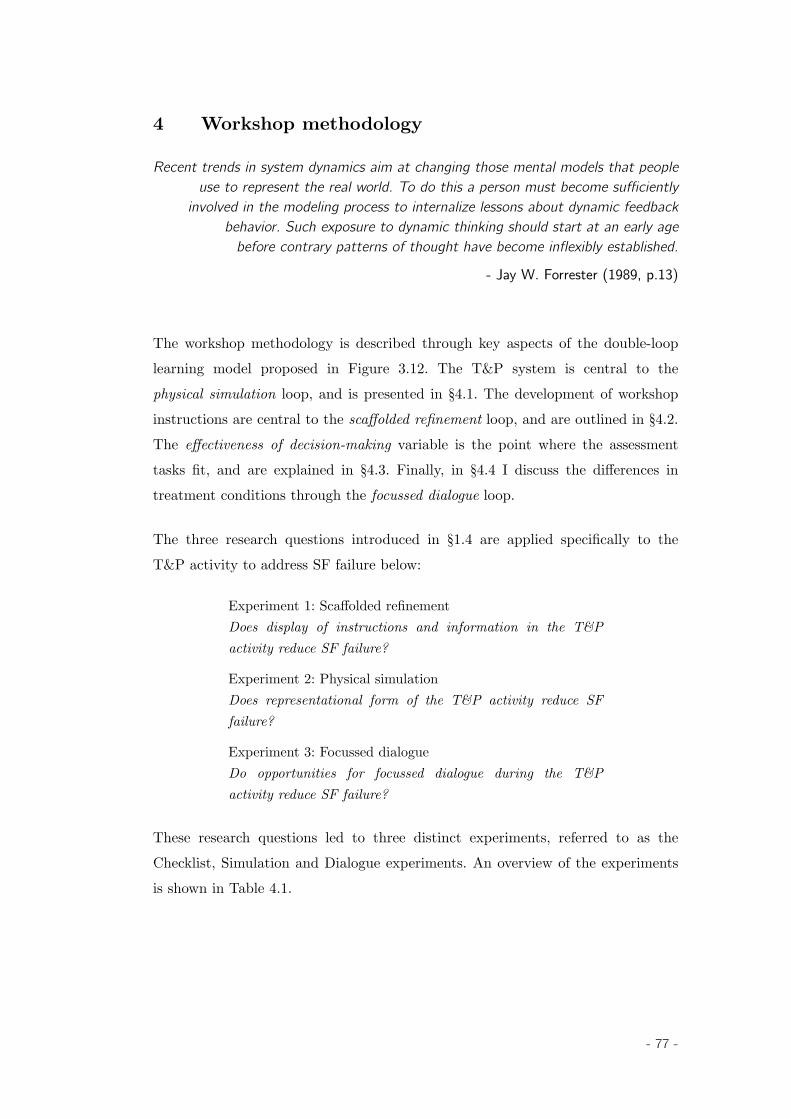
4 Workshop methodology
Recent trends in system dynamics aim at changing those mental models that peopleuse to represent the real world. To do this a person must become sufficiently
involved in the modeling process to internalize lessons about dynamic feedbackbehavior. Such exposure to dynamic thinking should start at an early age
before contrary patterns of thought have become inflexibly established.
- Jay W. Forrester (1989, p.13)
The workshop methodology is described through key aspects of the double-looplearning model proposed in Figure 3.12. The T&P system is central to thephysical simulation loop, and is presented in §4.1. The development of workshopinstructions are central to the scaffolded refinement loop, and are outlined in §4.2.The effectiveness of decision-making variable is the point where the assessmenttasks fit, and are explained in §4.3. Finally, in §4.4 I discuss the differences intreatment conditions through the focussed dialogue loop.
The three research questions introduced in §1.4 are applied specifically to theT&P activity to address SF failure below:
Experiment 1: Scaffolded refinementDoes display of instructions and information in the T&Pactivity reduce SF failure?
Experiment 2: Physical simulationDoes representational form of the T&P activity reduce SFfailure?
Experiment 3: Focussed dialogueDo opportunities for focussed dialogue during the T&Pactivity reduce SF failure?
These research questions led to three distinct experiments, referred to as theChecklist, Simulation and Dialogue experiments. An overview of the experimentsis shown in Table 4.1.
- 77 -
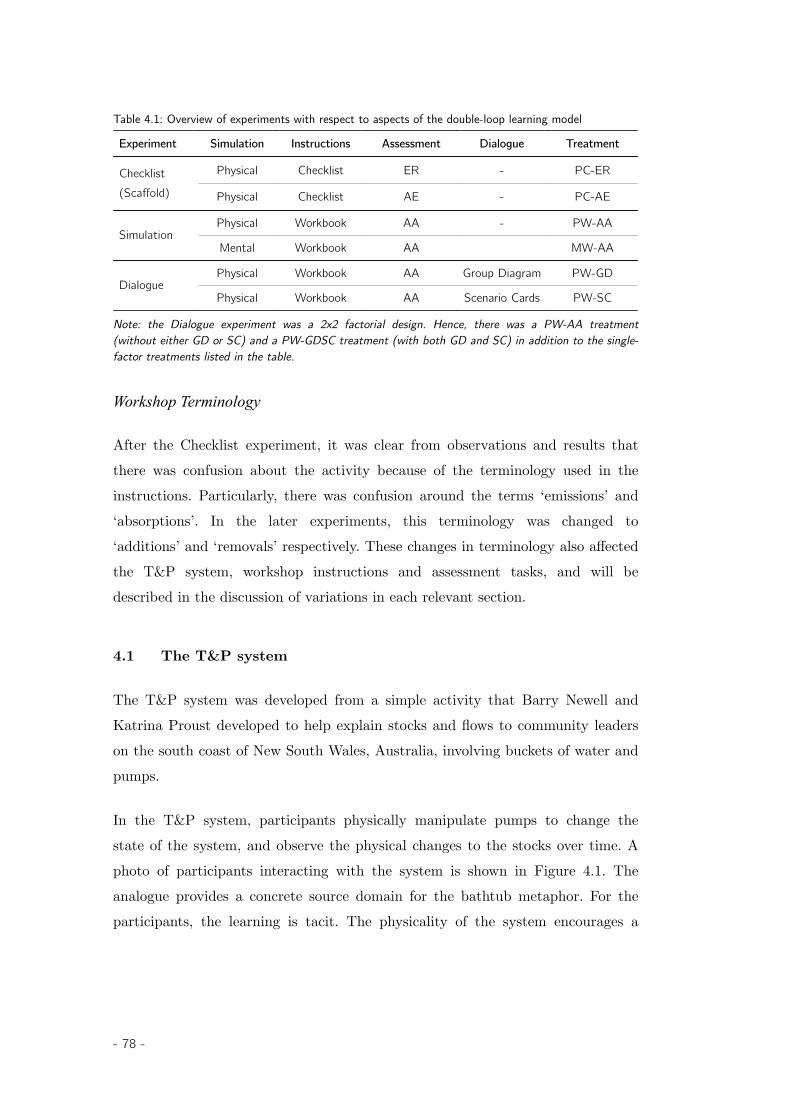
Table 4.1: Overview of experiments with respect to aspects of the double-loop learning model
Experiment Simulation Instructions Assessment Dialogue Treatment
Checklist(Scaffold)
Physical Checklist ER - PC-ER
Physical Checklist AE - PC-AE
SimulationPhysical Workbook AA - PW-AA
Mental Workbook AA MW-AA
DialoguePhysical Workbook AA Group Diagram PW-GD
Physical Workbook AA Scenario Cards PW-SC
Note: the Dialogue experiment was a 2x2 factorial design. Hence, there was a PW-AA treatment(without either GD or SC) and a PW-GDSC treatment (with both GD and SC) in addition to the single-factor treatments listed in the table.
Workshop Terminology
After the Checklist experiment, it was clear from observations and results thatthere was confusion about the activity because of the terminology used in theinstructions. Particularly, there was confusion around the terms ‘emissions’ and‘absorptions’. In the later experiments, this terminology was changed to‘additions’ and ‘removals’ respectively. These changes in terminology also affectedthe T&P system, workshop instructions and assessment tasks, and will bedescribed in the discussion of variations in each relevant section.
4.1 The T&P system
The T&P system was developed from a simple activity that Barry Newell andKatrina Proust developed to help explain stocks and flows to community leaderson the south coast of New South Wales, Australia, involving buckets of water andpumps.
In the T&P system, participants physically manipulate pumps to change thestate of the system, and observe the physical changes to the stocks over time. Aphoto of participants interacting with the system is shown in Figure 4.1. Theanalogue provides a concrete source domain for the bathtub metaphor. For theparticipants, the learning is tacit. The physicality of the system encourages a
- 78 -
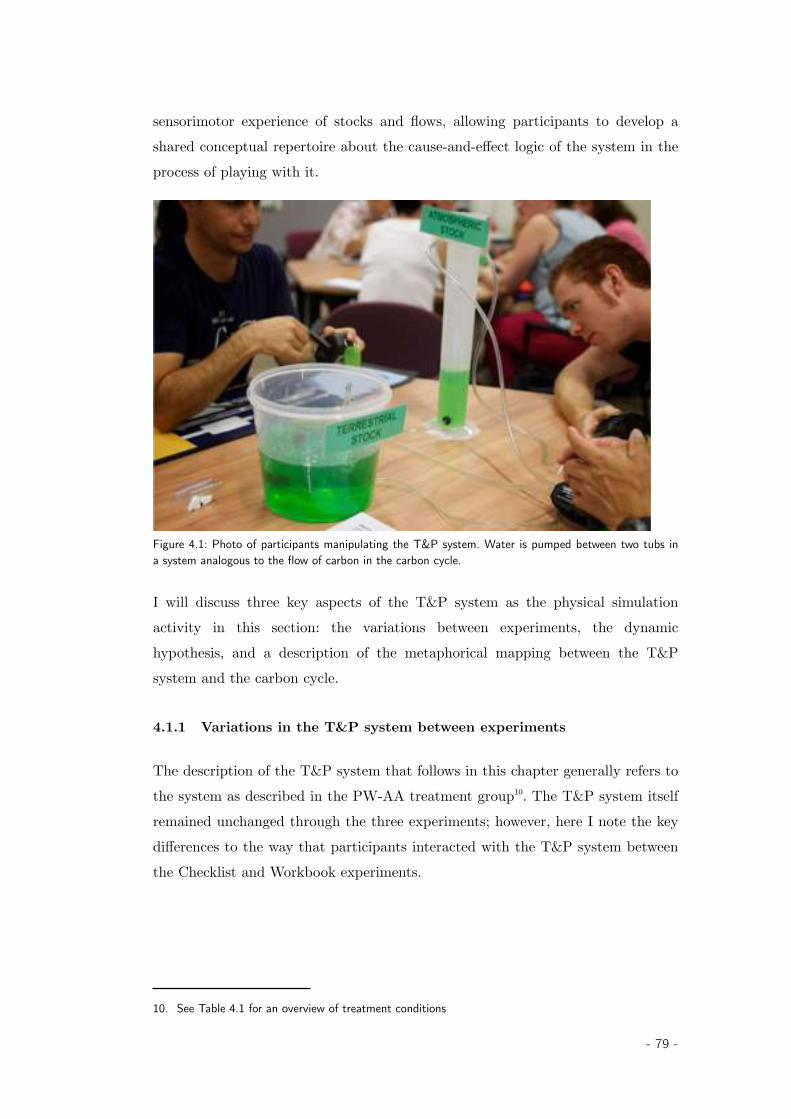
sensorimotor experience of stocks and flows, allowing participants to develop ashared conceptual repertoire about the cause-and-effect logic of the system in theprocess of playing with it.
Figure 4.1: Photo of participants manipulating the T&P system. Water is pumped between two tubs ina system analogous to the flow of carbon in the carbon cycle.
I will discuss three key aspects of the T&P system as the physical simulationactivity in this section: the variations between experiments, the dynamichypothesis, and a description of the metaphorical mapping between the T&Psystem and the carbon cycle.
4.1.1 Variations in the T&P system between experiments
The description of the T&P system that follows in this chapter generally refers tothe system as described in the PW-AA treatment group10. The T&P system itselfremained unchanged through the three experiments; however, here I note the keydifferences to the way that participants interacted with the T&P system betweenthe Checklist and Workbook experiments.
10. See Table 4.1 for an overview of treatment conditions
- 79 -
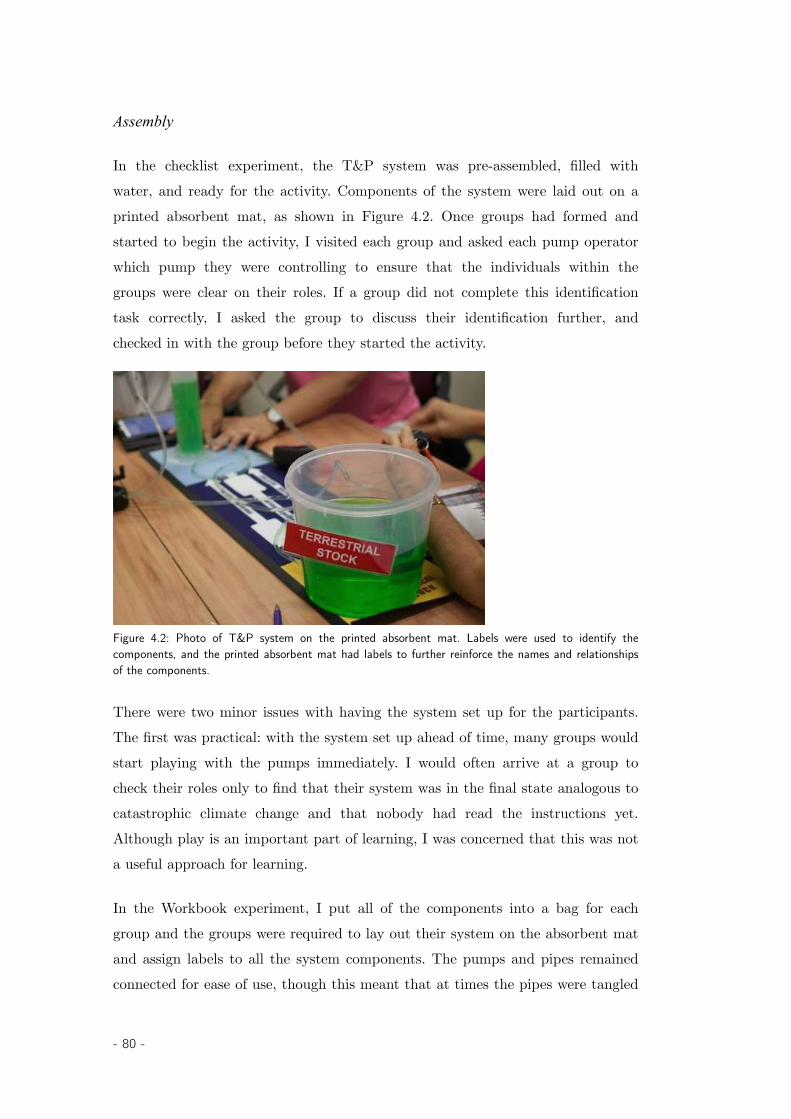
Assembly
In the checklist experiment, the T&P system was pre-assembled, filled withwater, and ready for the activity. Components of the system were laid out on aprinted absorbent mat, as shown in Figure 4.2. Once groups had formed andstarted to begin the activity, I visited each group and asked each pump operatorwhich pump they were controlling to ensure that the individuals within thegroups were clear on their roles. If a group did not complete this identificationtask correctly, I asked the group to discuss their identification further, andchecked in with the group before they started the activity.
Figure 4.2: Photo of T&P system on the printed absorbent mat. Labels were used to identify thecomponents, and the printed absorbent mat had labels to further reinforce the names and relationshipsof the components.
There were two minor issues with having the system set up for the participants.The first was practical: with the system set up ahead of time, many groups wouldstart playing with the pumps immediately. I would often arrive at a group tocheck their roles only to find that their system was in the final state analogous tocatastrophic climate change and that nobody had read the instructions yet.Although play is an important part of learning, I was concerned that this was nota useful approach for learning.
In the Workbook experiment, I put all of the components into a bag for eachgroup and the groups were required to lay out their system on the absorbent matand assign labels to all the system components. The pumps and pipes remainedconnected for ease of use, though this meant that at times the pipes were tangled
- 80 -
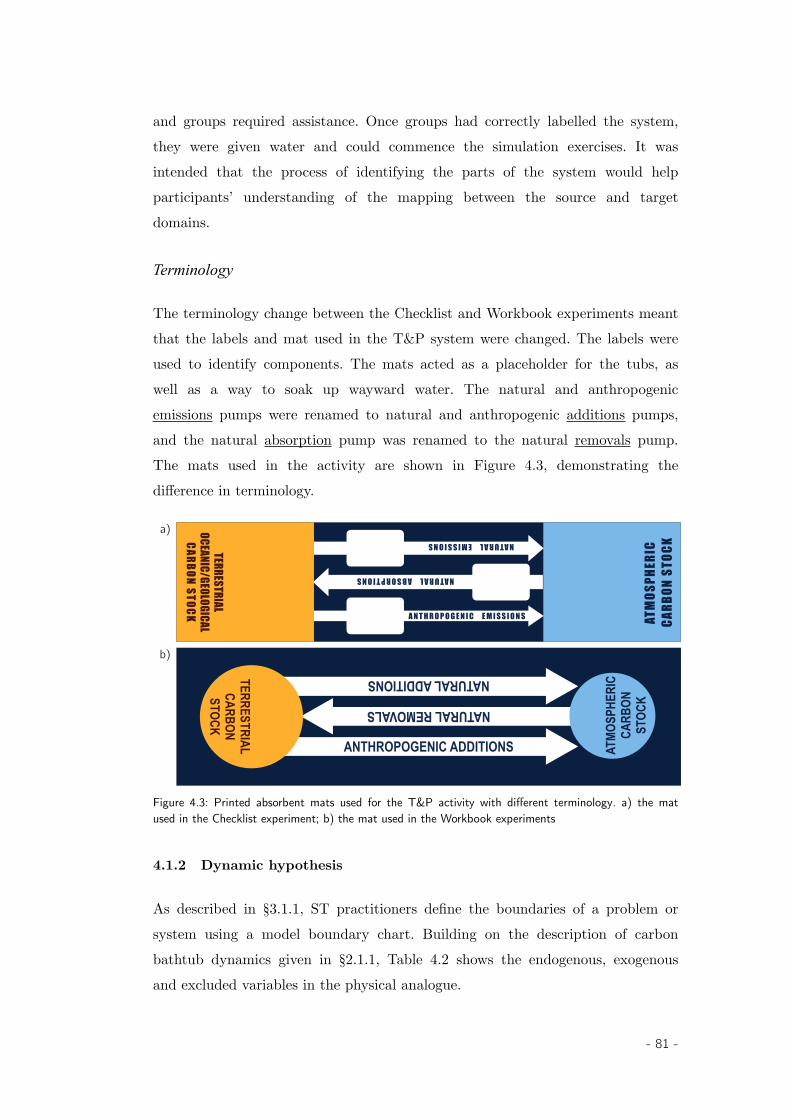
and groups required assistance. Once groups had correctly labelled the system,they were given water and could commence the simulation exercises. It wasintended that the process of identifying the parts of the system would helpparticipants’ understanding of the mapping between the source and targetdomains.
Terminology
The terminology change between the Checklist and Workbook experiments meantthat the labels and mat used in the T&P system were changed. The labels wereused to identify components. The mats acted as a placeholder for the tubs, aswell as a way to soak up wayward water. The natural and anthropogenicemissions pumps were renamed to natural and anthropogenic additions pumps,and the natural absorption pump was renamed to the natural removals pump.The mats used in the activity are shown in Figure 4.3, demonstrating thedifference in terminology.
a)
TERRESTRIALOCEANIC/GEOLOGICAL
CARBON STOCK ATM
OSPH
ERIC
CA
RBON
STO
CK
A N T H R O P O G E N I C E M I S S I O N S
NATURAL EMISSIONS
NATURAL ABSORPTIONS
b)
NATURAL REMOVALS
ANTHROPOGENIC ADDITIONS
NATURAL ADDITIONSTERRESTRIALCARBON STOCK
ATMO
SPHE
RIC
CARB
ON
STOC
K
Figure 4.3: Printed absorbent mats used for the T&P activity with different terminology. a) the matused in the Checklist experiment; b) the mat used in the Workbook experiments
4.1.2 Dynamic hypothesis
As described in §3.1.1, ST practitioners define the boundaries of a problem orsystem using a model boundary chart. Building on the description of carbonbathtub dynamics given in §2.1.1, Table 4.2 shows the endogenous, exogenousand excluded variables in the physical analogue.
- 81 -
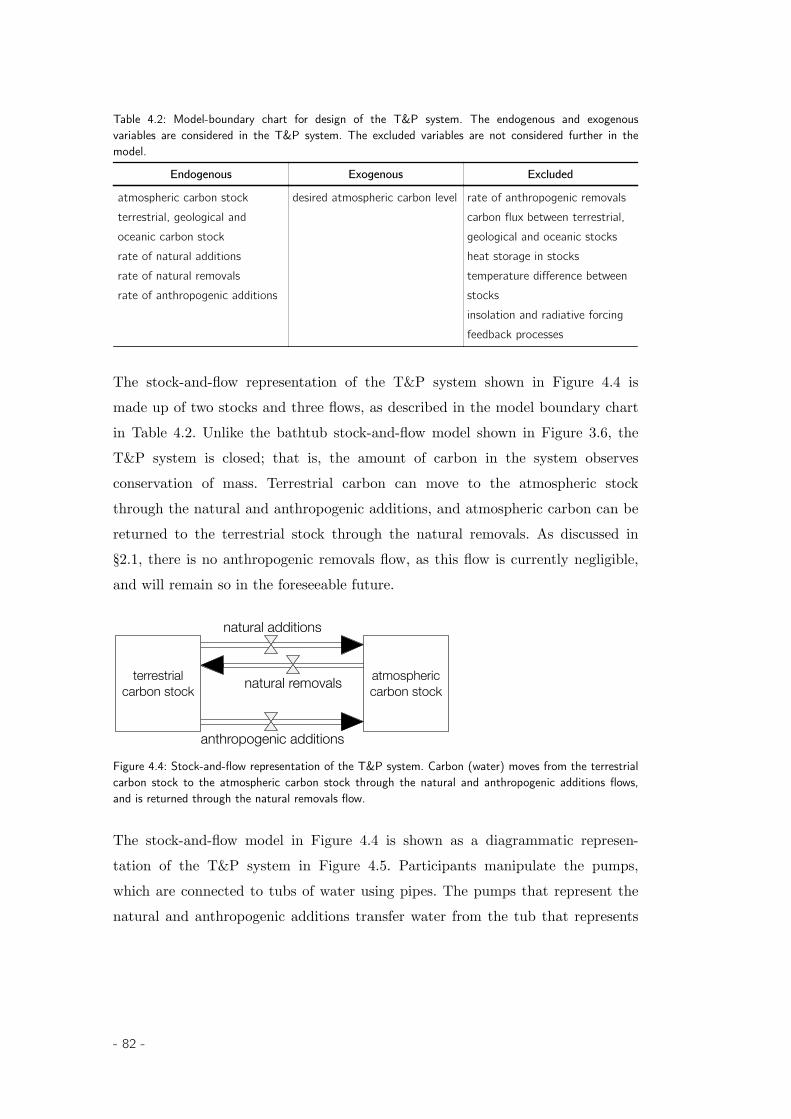
Table 4.2: Model-boundary chart for design of the T&P system. The endogenous and exogenousvariables are considered in the T&P system. The excluded variables are not considered further in themodel.
Endogenous Exogenous Excluded
atmospheric carbon stockterrestrial, geological and oceanic carbon stockrate of natural additionsrate of natural removalsrate of anthropogenic additions
desired atmospheric carbon level rate of anthropogenic removalscarbon flux between terrestrial, geological and oceanic stocksheat storage in stockstemperature difference between stocksinsolation and radiative forcingfeedback processes
The stock-and-flow representation of the T&P system shown in Figure 4.4 ismade up of two stocks and three flows, as described in the model boundary chartin Table 4.2. Unlike the bathtub stock-and-flow model shown in Figure 3.6, theT&P system is closed; that is, the amount of carbon in the system observesconservation of mass. Terrestrial carbon can move to the atmospheric stockthrough the natural and anthropogenic additions, and atmospheric carbon can bereturned to the terrestrial stock through the natural removals. As discussed in§2.1, there is no anthropogenic removals flow, as this flow is currently negligible,and will remain so in the foreseeable future.
natural additions
anthropogenic additions
natural removalsterrestrialcarbon stock
atmosphericcarbon stock
Figure 4.4: Stock-and-flow representation of the T&P system. Carbon (water) moves from the terrestrialcarbon stock to the atmospheric carbon stock through the natural and anthropogenic additions flows,and is returned through the natural removals flow.
The stock-and-flow model in Figure 4.4 is shown as a diagrammatic represen-tation of the T&P system in Figure 4.5. Participants manipulate the pumps,which are connected to tubs of water using pipes. The pumps that represent thenatural and anthropogenic additions transfer water from the tub that represents
- 82 -
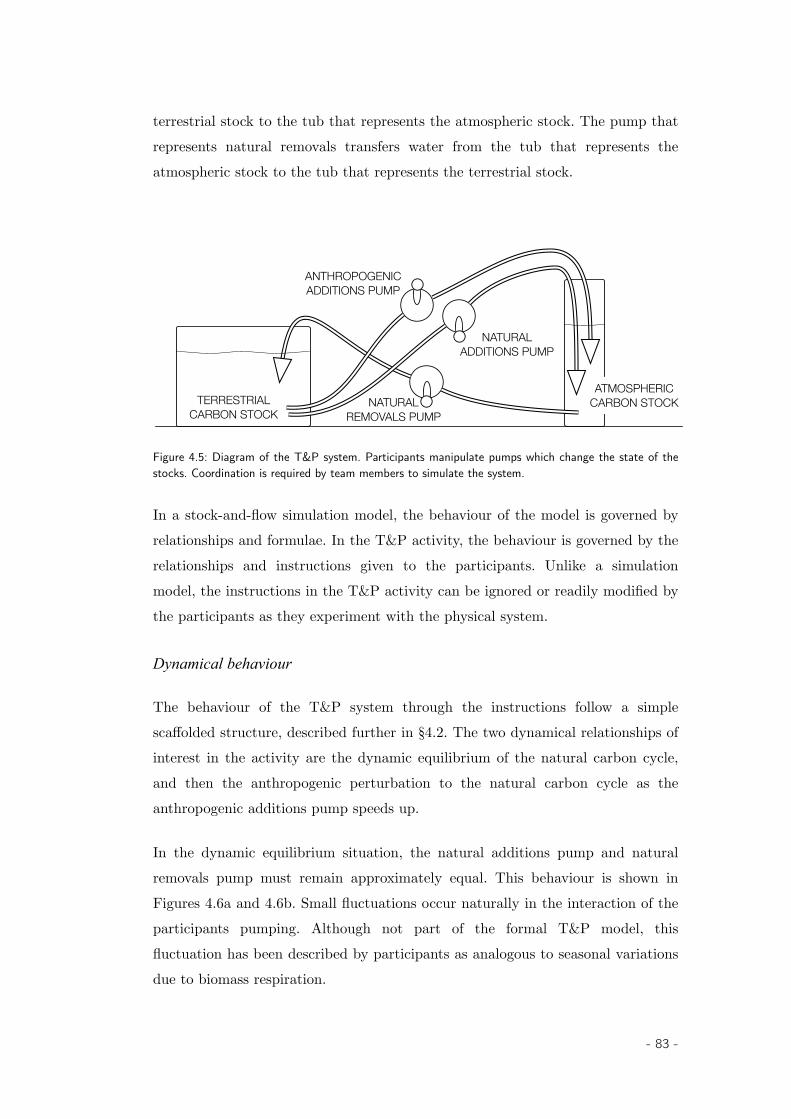
terrestrial stock to the tub that represents the atmospheric stock. The pump thatrepresents natural removals transfers water from the tub that represents theatmospheric stock to the tub that represents the terrestrial stock.
TERRESTRIALCARBON STOCK
ATMOSPHERICCARBON STOCK
ANTHROPOGENICADDITIONS PUMP
NATURALADDITIONS PUMP
NATURALREMOVALS PUMP
Figure 4.5: Diagram of the T&P system. Participants manipulate pumps which change the state of thestocks. Coordination is required by team members to simulate the system.
In a stock-and-flow simulation model, the behaviour of the model is governed byrelationships and formulae. In the T&P activity, the behaviour is governed by therelationships and instructions given to the participants. Unlike a simulationmodel, the instructions in the T&P activity can be ignored or readily modified bythe participants as they experiment with the physical system.
Dynamical behaviour
The behaviour of the T&P system through the instructions follow a simplescaffolded structure, described further in §4.2. The two dynamical relationships ofinterest in the activity are the dynamic equilibrium of the natural carbon cycle,and then the anthropogenic perturbation to the natural carbon cycle as theanthropogenic additions pump speeds up.
In the dynamic equilibrium situation, the natural additions pump and naturalremovals pump must remain approximately equal. This behaviour is shown inFigures 4.6a and 4.6b. Small fluctuations occur naturally in the interaction of theparticipants pumping. Although not part of the formal T&P model, thisfluctuation has been described by participants as analogous to seasonal variationsdue to biomass respiration.
- 83 -
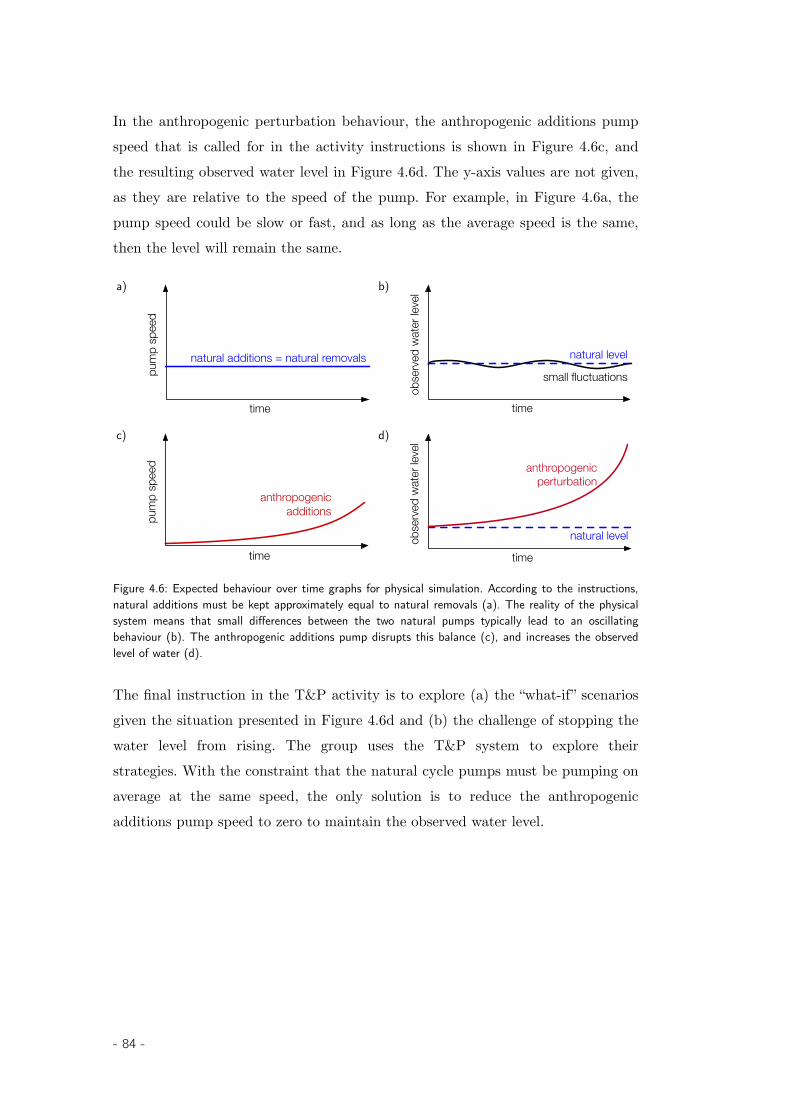
In the anthropogenic perturbation behaviour, the anthropogenic additions pumpspeed that is called for in the activity instructions is shown in Figure 4.6c, andthe resulting observed water level in Figure 4.6d. The y-axis values are not given,as they are relative to the speed of the pump. For example, in Figure 4.6a, thepump speed could be slow or fast, and as long as the average speed is the same,then the level will remain the same.
a)
pum
p sp
eed
time
natural additions = natural removals
b)
obse
rved
wat
er le
vel
time
small fluctuations
natural level
c)
anthropogenicadditions
time
pum
p sp
eed
d)
obse
rved
wat
er le
vel
time
natural level
anthropogenic perturbation
Figure 4.6: Expected behaviour over time graphs for physical simulation. According to the instructions,natural additions must be kept approximately equal to natural removals (a). The reality of the physicalsystem means that small differences between the two natural pumps typically lead to an oscillatingbehaviour (b). The anthropogenic additions pump disrupts this balance (c), and increases the observedlevel of water (d).
The final instruction in the T&P activity is to explore (a) the “what-if” scenariosgiven the situation presented in Figure 4.6d and (b) the challenge of stopping thewater level from rising. The group uses the T&P system to explore theirstrategies. With the constraint that the natural cycle pumps must be pumping onaverage at the same speed, the only solution is to reduce the anthropogenicadditions pump speed to zero to maintain the observed water level.
- 84 -

4.1.3 The T&P conceptual metaphor
The T&P system can be used as a tool for concrete learning because of themetaphorical mapping between the model and the real-world system. Participantscan manipulate the T&P system (the conceptual source domain with the water,tubs and pumps), and then make valid inferences in, and construct anunderstanding of, the target domain (the carbon cycle). The explicit mapping ofthe concepts in the conceptual source domain to the conceptual target domain isshown in Table 4.3.
Table 4.3: Conceptual mapping of the T&P metaphor. The components in the conceptual sourcedomain are mapped to the conceptual target domain, allowing participants to construct anunderstanding of one system (the carbon cycle) in terms of another (tubs and pumps).Note: * the arrows “⇒” represent the expressions “corresponds to” or “maps to”.
Conceptual source domain:tubs & pumps
Conceptual target domain:the carbon cycle
The water in each tub ⇒* The accumulation of carbon at time t
The amount of water in the atmospheric tub
⇒ The amount of carbon accumulated at time t in the atmosphere; the atmospheric carbon concentration
The amount of water in the terrestrial tub
⇒ The amount of carbon accumulated at time t in terrestrial stocks, including oceanic and geological stocks.
Water entering the tub through the ‘natural additions’ pump
⇒ The natural processes that increase the amount of carbon in the atmosphere, such as decomposition of organic matter
Water entering the tub through the ‘anthropogenic additions’ pump
⇒ The processes that increase the amount of carbon in the atmosphere due to human activity, such as the burning of fossil fuels
Water leaving the tub through the‘natural removals’ pump
⇒ The natural processes that decrease the amount of carbon in the atmosphere, such as afforestation
As described in §3.2.3, the mapping between the conceptual source and targetdomains is partial. For participants, this partial mapping may lead to inferencesthat become areas of confusion. Potential areas of confusion are described inTable 4.4. I do not necessarily believe that the issues listed in Table 4.4 areproblems to be fixed in future versions of the activity, but rather are listed forthe purpose of further describing areas of potential confusion.
- 85 -

The simplification of the carbon cycle in this representation does, however, makeit easier to see the importance of the balance between the key flows of the carboncycle, which is an important goal of the activity. The model as presented here isnot designed to be a simplified representation of the complex carbon system, butrather to demonstrate the effect of unbalanced carbon flows.
Table 4.4: Areas of potential confusion in the conceptual mapping due to both physical limitations andconceptual mapping. Efforts to reduce the effect of these limitations have been made to reduce theopportunity for confusion.
Concept Description
Physical limitations of the T&P systemSize of stocks The terrestrial carbon stock is many orders of magnitude larger than the
atmospheric stock. In the T&P system, it is only marginally largerFeedback Feedback effects and mechanisms from the conceptual source domain are not
present, such as the effect of temperature on carbon storage in the ocean. There is, however, feedback in the system, such as the change of participant behaviour due to the level of the water or the sound of the pumps as they are manipulated at different speeds
Changing rates The natural carbon cycle fluctuates due to a number of subprocesses and feedback mechanisms; the rate of anthropogenic additions continues to increase. In the T&P system, these changes are not controlled in a regulated way
Homogeneity The terrestrial carbon stock is not a homogenous entity as it is represented in the T&P system. For example, in the real world, the oceanic stock has a different relationship with the atmospheric stock than with the terrestrial stock.
Conceptual mapping limitationsColour of the water The water is intentionally coloured green to aid visualisation. Some participants
remarked that the green was chosen to represent greenhouse gasesWater leaking out of the system
On occasion, water leaves the system through leaks in the connections.
Upper limit of the atmospheric tub
The ‘overflow’ level of the atmospheric tub. When exceeded, water leaves the system.
Feedback in the system
The natural carbon cycle is influenced by the natural capacity for carbon flux; for example, the more trees available to remove carbon from the atmosphere will also result in higher levels of carbon additions in the future as the organic matter decomposes. There are no such built-in feedback mechanisms in the model.
Reversibility of pumps
Pumps in the T&P system can go in both directions without regard of the feedback processes. To mitigate this possibility, inflow pipes have been placed at the tops of stocks, and outflow pipes have been placed at the bottom of stocks to reduce the likelihood of this behaviour
Water as carbon Participants could confuse the carbon cycle with the water cycle
- 86 -
The physical limitations of the equipment used means that it is not practical forthe model to be scaled accurately. For example, a terrestrial stock that is 50times larger in volume than the atmospheric stock, or an anthropogenic pumpthat is 30 times smaller than the natural pumps, is impractical (see Figure 2.1 forrelative sizes). This is not a significant limitation, given that the main aim of theT&P activity is to help students understand the impact of unbalanced flows.Removing these elements and considerations from the simple model also meansthat less prerequisite knowledge about the relationships and behaviour of thesystem is required to understand the activity, and in turn the model.
4.2 Workshop instructions
In this section, I describe the instructions for the workshop. Activities weretypically confined to 45 minutes of a 1-hour tutorial slot. The activity wastypically completed in groups of 3-6, and the assessment task was completedindividually. Groups were largely autonomous, and the only instruction offered bythe facilitator was to advise groups to complete tasks faster or slower to matchthe progress of other groups and overall time considerations.
Once groups had completed the activity tasks, an assessment sheet was handedout and completed by participants, which was used for the results presented inChapter 5. After the assessment sheets were completed and collected, a briefpresentation was given showing typical answers followed by a general discussionof insights arising from the activity. No personally identifiable information wascollected, other than basic demographic profile data.
All the workshops followed a generic structure and schedule, with smallvariations to accommodate the mechanisms of the different treatment conditions.Due to the limitations of completing this task in a real, scheduled tutorial, theactivity had to fit into the available time. The generic structure of all the experi-mental workshops are shown in Table 4.5.
- 87 -
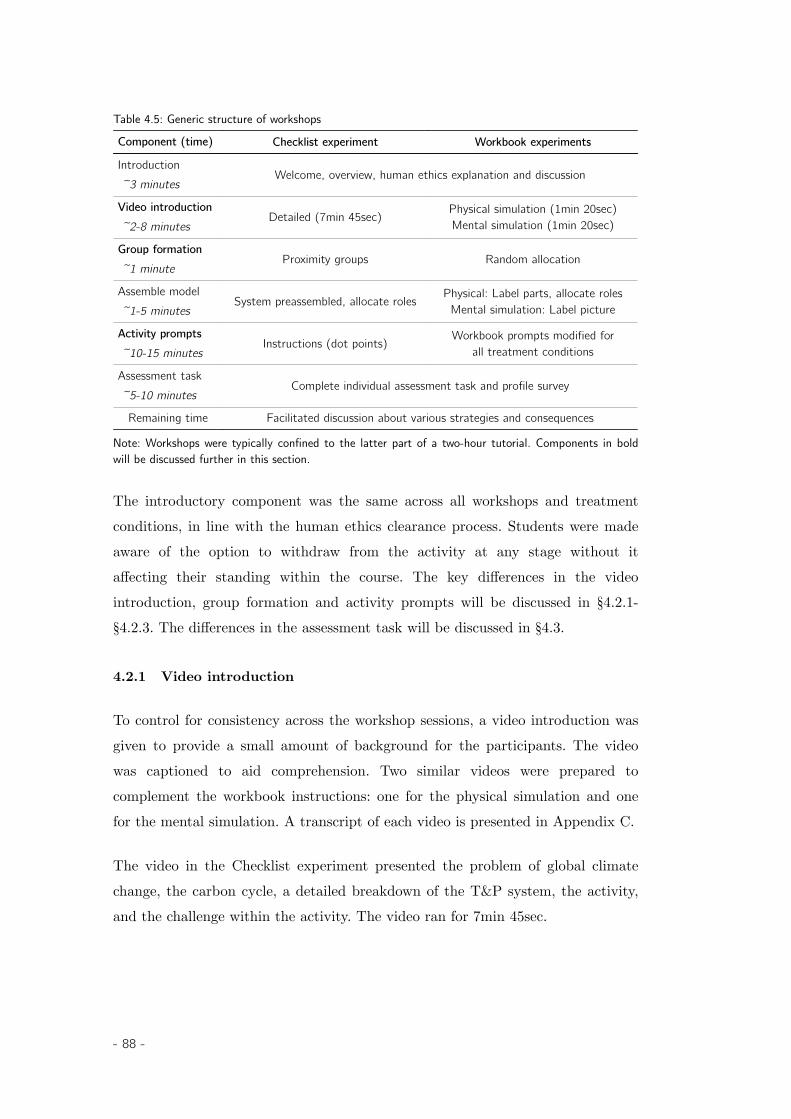
Table 4.5: Generic structure of workshops
Component (time) Checklist experiment Workbook experiments
Introduction ~3 minutes
Welcome, overview, human ethics explanation and discussion
Video introduction ~2-8 minutes
Detailed (7min 45sec) Physical simulation (1min 20sec)Mental simulation (1min 20sec)
Group formation ~1 minute
Proximity groups Random allocation
Assemble model ~1-5 minutes
System preassembled, allocate roles Physical: Label parts, allocate rolesMental simulation: Label picture
Activity prompts ~10-15 minutes
Instructions (dot points) Workbook prompts modified forall treatment conditions
Assessment task ~5-10 minutes
Complete individual assessment task and profile survey
Remaining time Facilitated discussion about various strategies and consequences
Note: Workshops were typically confined to the latter part of a two-hour tutorial. Components in boldwill be discussed further in this section.
The introductory component was the same across all workshops and treatmentconditions, in line with the human ethics clearance process. Students were madeaware of the option to withdraw from the activity at any stage without itaffecting their standing within the course. The key differences in the videointroduction, group formation and activity prompts will be discussed in §4.2.1-§4.2.3. The differences in the assessment task will be discussed in §4.3.
4.2.1 Video introduction
To control for consistency across the workshop sessions, a video introduction wasgiven to provide a small amount of background for the participants. The videowas captioned to aid comprehension. Two similar videos were prepared tocomplement the workbook instructions: one for the physical simulation and onefor the mental simulation. A transcript of each video is presented in Appendix C.
The video in the Checklist experiment presented the problem of global climatechange, the carbon cycle, a detailed breakdown of the T&P system, the activity,and the challenge within the activity. The video ran for 7min 45sec.
- 88 -
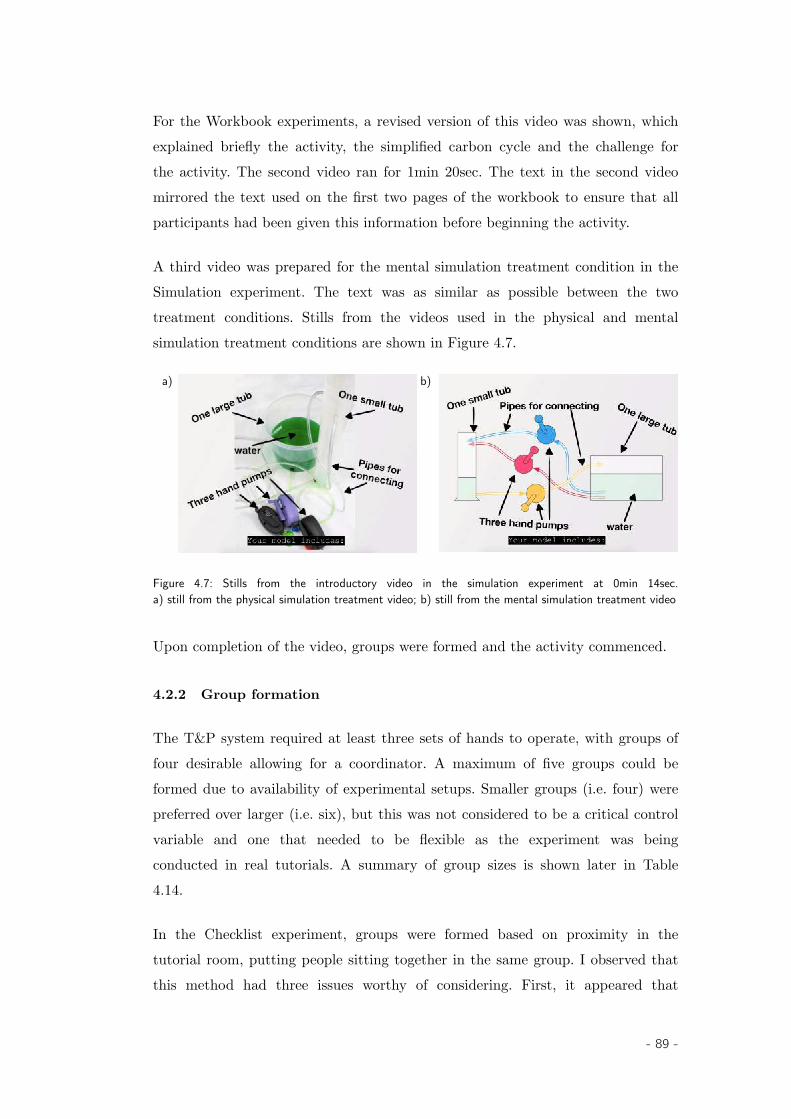
For the Workbook experiments, a revised version of this video was shown, whichexplained briefly the activity, the simplified carbon cycle and the challenge forthe activity. The second video ran for 1min 20sec. The text in the second videomirrored the text used on the first two pages of the workbook to ensure that allparticipants had been given this information before beginning the activity.
A third video was prepared for the mental simulation treatment condition in theSimulation experiment. The text was as similar as possible between the twotreatment conditions. Stills from the videos used in the physical and mentalsimulation treatment conditions are shown in Figure 4.7.
a) b)
Figure 4.7: Stills from the introductory video in the simulation experiment at 0min 14sec.a) still from the physical simulation treatment video; b) still from the mental simulation treatment video
Upon completion of the video, groups were formed and the activity commenced.
4.2.2 Group formation
The T&P system required at least three sets of hands to operate, with groups offour desirable allowing for a coordinator. A maximum of five groups could beformed due to availability of experimental setups. Smaller groups (i.e. four) werepreferred over larger (i.e. six), but this was not considered to be a critical controlvariable and one that needed to be flexible as the experiment was beingconducted in real tutorials. A summary of group sizes is shown later in Table4.14.
In the Checklist experiment, groups were formed based on proximity in thetutorial room, putting people sitting together in the same group. I observed thatthis method had three issues worthy of considering. First, it appeared that
- 89 -
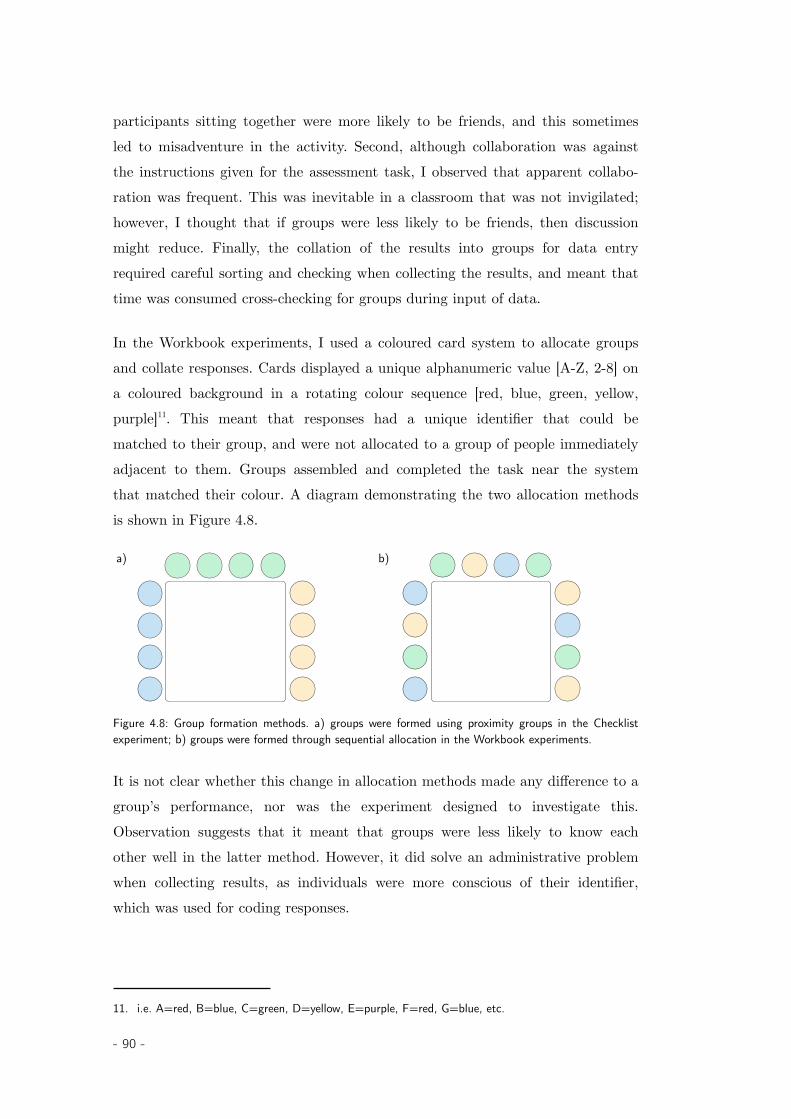
participants sitting together were more likely to be friends, and this sometimesled to misadventure in the activity. Second, although collaboration was againstthe instructions given for the assessment task, I observed that apparent collabo-ration was frequent. This was inevitable in a classroom that was not invigilated;however, I thought that if groups were less likely to be friends, then discussionmight reduce. Finally, the collation of the results into groups for data entryrequired careful sorting and checking when collecting the results, and meant thattime was consumed cross-checking for groups during input of data.
In the Workbook experiments, I used a coloured card system to allocate groupsand collate responses. Cards displayed a unique alphanumeric value [A-Z, 2-8] ona coloured background in a rotating colour sequence [red, blue, green, yellow,purple]11. This meant that responses had a unique identifier that could bematched to their group, and were not allocated to a group of people immediatelyadjacent to them. Groups assembled and completed the task near the systemthat matched their colour. A diagram demonstrating the two allocation methodsis shown in Figure 4.8.
a) b)
Figure 4.8: Group formation methods. a) groups were formed using proximity groups in the Checklistexperiment; b) groups were formed through sequential allocation in the Workbook experiments.
It is not clear whether this change in allocation methods made any difference to agroup’s performance, nor was the experiment designed to investigate this.Observation suggests that it meant that groups were less likely to know eachother well in the latter method. However, it did solve an administrative problemwhen collecting results, as individuals were more conscious of their identifier,which was used for coding responses.
11. i.e. A=red, B=blue, C=green, D=yellow, E=purple, F=red, G=blue, etc.
- 90 -

4.2.3 Activity instructions
In the Checklist experiment, the instructions were an A4 sheet with nine dot-point tasks. In the Workbook experiments, the instructions was a short workbookwith four or five tasks depending on the treatment condition. All the activityinstructions are included in Appendix A. The Checklist and Workbookexperiments also followed the terminology difference outlined in §4.1.
The change in presentation format of the instructions between experimentsallowed for different visual representations. The first two tasks are used as anexample below to demonstrate this difference. These tasks were designed toorientate the group to the function and direction of the pumps by having oneadditions pump operate, then one removals pump operate. The instructions fromChecklist experiment were:
1. Ask the Natural Emissions to pump to a level of half thecapacity of the atmospheric stock, then stop
2. Ask the Natural Absorptions to drain the atmosphericstock completely, then stop
The workbook format allowed for the use of behaviour over time graphsthroughout the activity to further visualise the distinction between stocks andflows. The equivalent tasks in the Workbook experiment are shown in Figure 4.9.
- 91 -
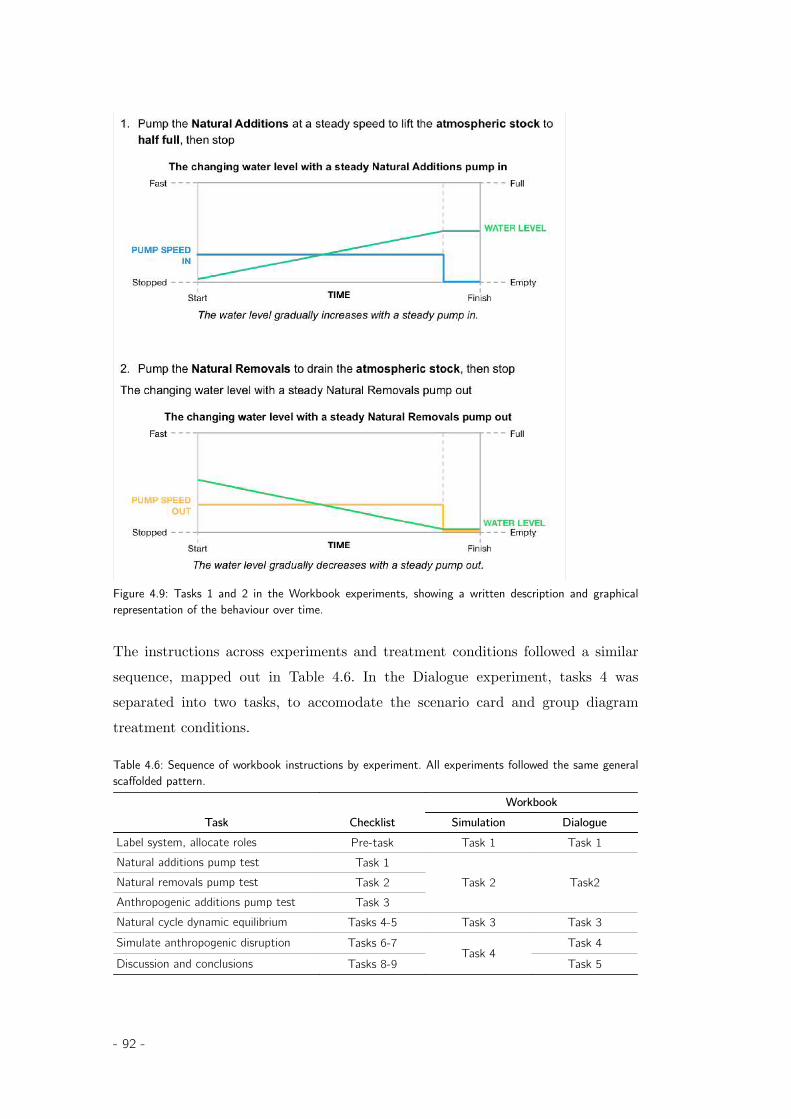
Figure 4.9: Tasks 1 and 2 in the Workbook experiments, showing a written description and graphicalrepresentation of the behaviour over time.
The instructions across experiments and treatment conditions followed a similarsequence, mapped out in Table 4.6. In the Dialogue experiment, tasks 4 wasseparated into two tasks, to accomodate the scenario card and group diagramtreatment conditions.
Table 4.6: Sequence of workbook instructions by experiment. All experiments followed the same generalscaffolded pattern.
Task ChecklistWorkbook
Simulation DialogueLabel system, allocate roles Pre-task Task 1 Task 1Natural additions pump test Task 1
Task 2 Task2Natural removals pump test Task 2Anthropogenic additions pump test Task 3Natural cycle dynamic equilibrium Tasks 4-5 Task 3 Task 3Simulate anthropogenic disruption Tasks 6-7
Task 4Task 4
Discussion and conclusions Tasks 8-9 Task 5
- 92 -
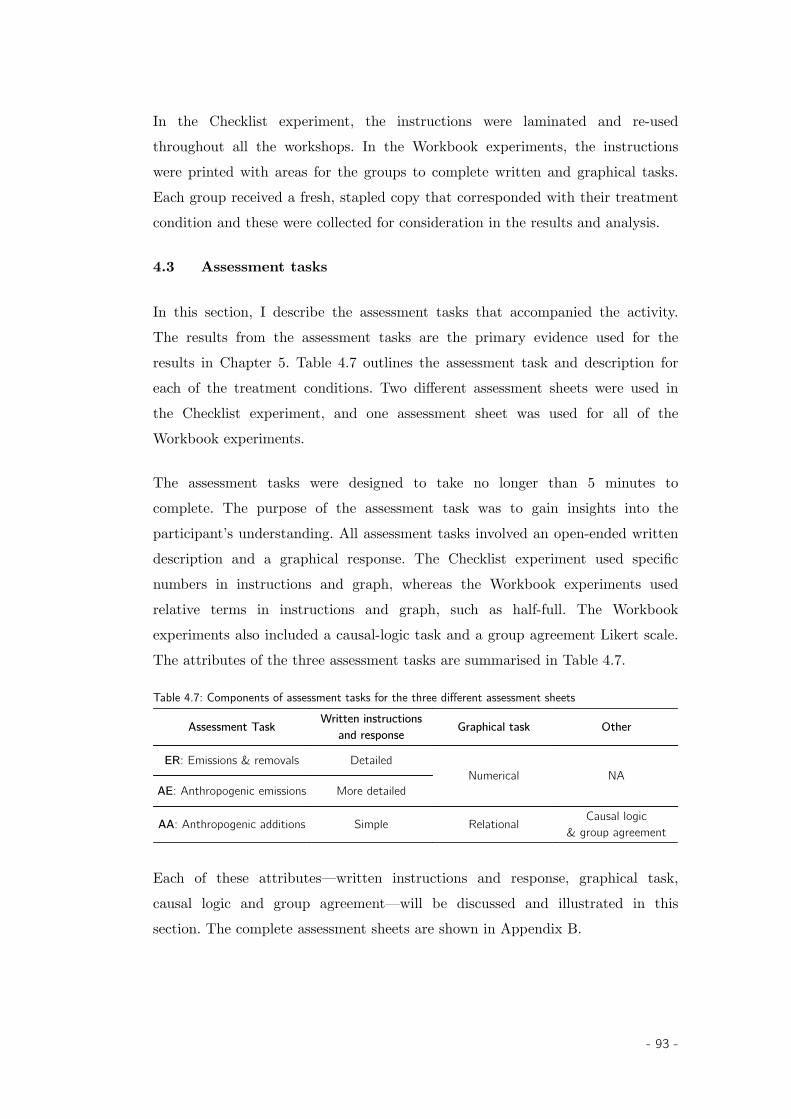
In the Checklist experiment, the instructions were laminated and re-usedthroughout all the workshops. In the Workbook experiments, the instructionswere printed with areas for the groups to complete written and graphical tasks.Each group received a fresh, stapled copy that corresponded with their treatmentcondition and these were collected for consideration in the results and analysis.
4.3 Assessment tasks
In this section, I describe the assessment tasks that accompanied the activity.The results from the assessment tasks are the primary evidence used for theresults in Chapter 5. Table 4.7 outlines the assessment task and description foreach of the treatment conditions. Two different assessment sheets were used inthe Checklist experiment, and one assessment sheet was used for all of theWorkbook experiments.
The assessment tasks were designed to take no longer than 5 minutes tocomplete. The purpose of the assessment task was to gain insights into theparticipant’s understanding. All assessment tasks involved an open-ended writtendescription and a graphical response. The Checklist experiment used specificnumbers in instructions and graph, whereas the Workbook experiments usedrelative terms in instructions and graph, such as half-full. The Workbookexperiments also included a causal-logic task and a group agreement Likert scale.The attributes of the three assessment tasks are summarised in Table 4.7.
Table 4.7: Components of assessment tasks for the three different assessment sheets
Assessment Task Written instructionsand response Graphical task Other
ER: Emissions & removals DetailedNumerical NA
AE: Anthropogenic emissions More detailed
AA: Anthropogenic additions Simple Relational Causal logic& group agreement
Each of these attributes—written instructions and response, graphical task,causal logic and group agreement—will be discussed and illustrated in thissection. The complete assessment sheets are shown in Appendix B.
- 93 -

4.3.1 Written instructions
The written instructions were used to guide the responses in the assessment task.The instructions in emissions & removals (ER) assessment were modified for theanthropogenic emissions (AE) assessment to direct responses towards a reductionin anthropogenic additions, as it was believed that the instructions werecontributing to SF failure. The instruction in the anthropogenic additions (AA)assessment were considerably shortened, along with changes to the terminologyas described at the beginning of Chapter 4. The written instructions for eachassessment task are shown in Table 4.8.
Table 4.8: Written instructions for each assessment task. Modifications were made based onobservations of written responses and changes to the terminology used in the activity.
Written instructions
Emissions and Removals (ER)Q1: In the year 2000, the atmospheric carbon concentration was approximately 370 parts per million
(ppm). What needs to happen to the Anthropogenic Emissions to ensure that the atmospheric GHG concentration stabilises at—and does not exceed—400ppm by the year 2100? [written description]
Q2: Sketch what you think the trajectory for future Anthropogenic Emissions needs to be for the situation in Q1 to occur. [graphical response]
Anthropogenic Emissions (AE)Q1: In the year 2000, the atmospheric carbon concentration was approximately 370 parts per million
(ppm). Consider a situation where the Natural Emissions and Natural Absorptions are equal. What needs to happen to the Anthropogenic Emissions to ensure that the atmospheric GHG concentration stabilises at—and does not exceed—400ppm by the year 2100? [written description]
Q2: Sketch what you think the trajectory for future Anthropogenic Emissions needs to be for the situation in Q1 to occur. [graphical response]
Anthropogenic Additions (AA)Q: Describe in your own words what the Anthropogenic Additions pump should do to ensure that
the goal level is not exceeded. [written description]
Q: Sketch what you think the future trajectory of the Anthropogenic Additions pump should be to not exceed the goal level. [graphical response]
- 94 -
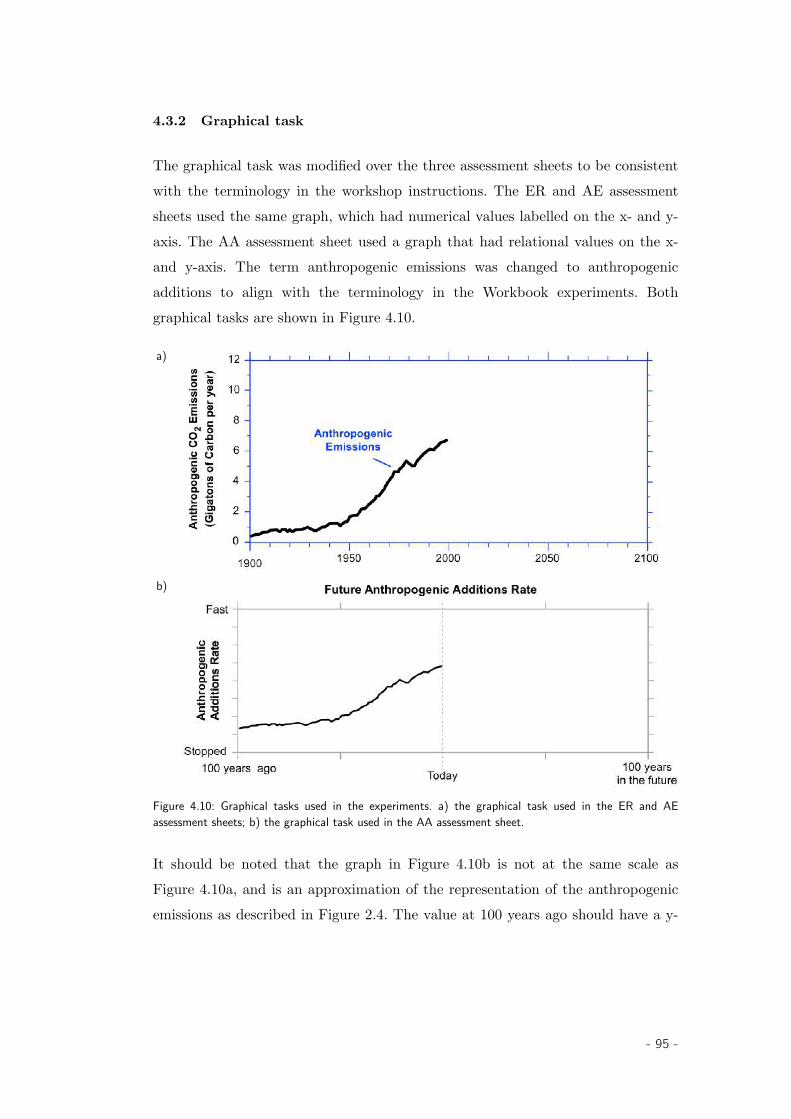
4.3.2 Graphical task
The graphical task was modified over the three assessment sheets to be consistentwith the terminology in the workshop instructions. The ER and AE assessmentsheets used the same graph, which had numerical values labelled on the x- and y-axis. The AA assessment sheet used a graph that had relational values on the x-and y-axis. The term anthropogenic emissions was changed to anthropogenicadditions to align with the terminology in the Workbook experiments. Bothgraphical tasks are shown in Figure 4.10.
a)
b)
Figure 4.10: Graphical tasks used in the experiments. a) the graphical task used in the ER and AEassessment sheets; b) the graphical task used in the AA assessment sheet.
It should be noted that the graph in Figure 4.10b is not at the same scale asFigure 4.10a, and is an approximation of the representation of the anthropogenicemissions as described in Figure 2.4. The value at 100 years ago should have a y-
- 95 -
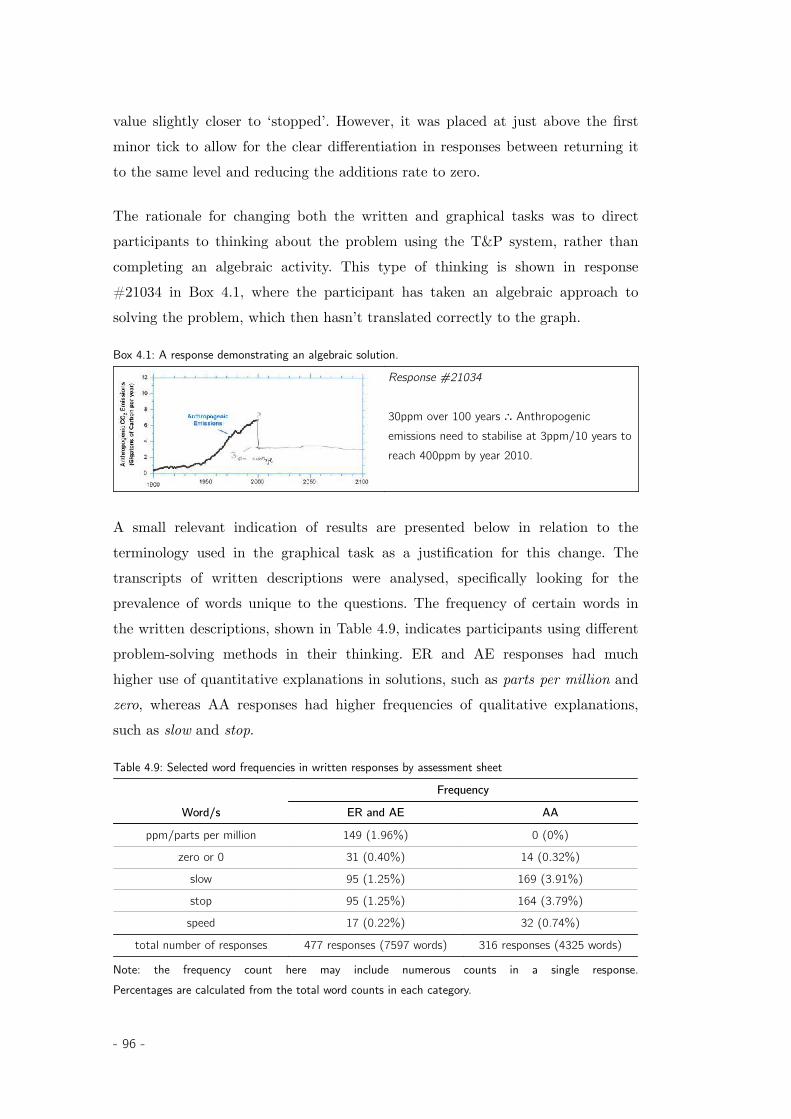
value slightly closer to ‘stopped’. However, it was placed at just above the firstminor tick to allow for the clear differentiation in responses between returning itto the same level and reducing the additions rate to zero.
The rationale for changing both the written and graphical tasks was to directparticipants to thinking about the problem using the T&P system, rather thancompleting an algebraic activity. This type of thinking is shown in response#21034 in Box 4.1, where the participant has taken an algebraic approach tosolving the problem, which then hasn’t translated correctly to the graph.
Box 4.1: A response demonstrating an algebraic solution.
Response #21034
30ppm over 100 years ∴ Anthropogenic emissions need to stabilise at 3ppm/10 years toreach 400ppm by year 2010.
A small relevant indication of results are presented below in relation to theterminology used in the graphical task as a justification for this change. Thetranscripts of written descriptions were analysed, specifically looking for theprevalence of words unique to the questions. The frequency of certain words inthe written descriptions, shown in Table 4.9, indicates participants using differentproblem-solving methods in their thinking. ER and AE responses had muchhigher use of quantitative explanations in solutions, such as parts per million andzero, whereas AA responses had higher frequencies of qualitative explanations,such as slow and stop.
Table 4.9: Selected word frequencies in written responses by assessment sheet
Word/s
Frequency
ER and AE AA
ppm/parts per million 149 (1.96%) 0 (0%)
zero or 0 31 (0.40%) 14 (0.32%)
slow 95 (1.25%) 169 (3.91%)
stop 95 (1.25%) 164 (3.79%)
speed 17 (0.22%) 32 (0.74%)
total number of responses 477 responses (7597 words) 316 responses (4325 words)
Note: the frequency count here may include numerous counts in a single response.Percentages are calculated from the total word counts in each category.
- 96 -
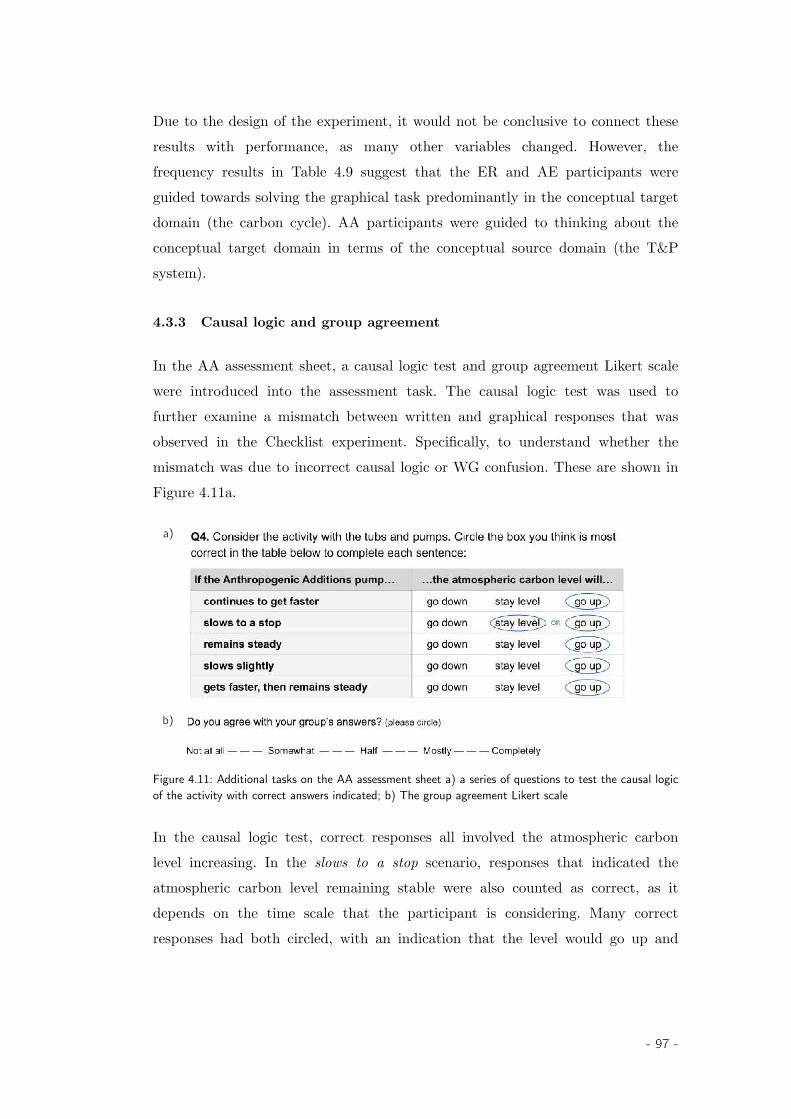
Due to the design of the experiment, it would not be conclusive to connect theseresults with performance, as many other variables changed. However, thefrequency results in Table 4.9 suggest that the ER and AE participants wereguided towards solving the graphical task predominantly in the conceptual targetdomain (the carbon cycle). AA participants were guided to thinking about theconceptual target domain in terms of the conceptual source domain (the T&Psystem).
4.3.3 Causal logic and group agreement
In the AA assessment sheet, a causal logic test and group agreement Likert scalewere introduced into the assessment task. The causal logic test was used tofurther examine a mismatch between written and graphical responses that wasobserved in the Checklist experiment. Specifically, to understand whether themismatch was due to incorrect causal logic or WG confusion. These are shown inFigure 4.11a.
a)
b)
Figure 4.11: Additional tasks on the AA assessment sheet a) a series of questions to test the causal logicof the activity with correct answers indicated; b) The group agreement Likert scale
In the causal logic test, correct responses all involved the atmospheric carbonlevel increasing. In the slows to a stop scenario, responses that indicated theatmospheric carbon level remaining stable were also counted as correct, as itdepends on the time scale that the participant is considering. Many correctresponses had both circled, with an indication that the level would go up and
- 97 -
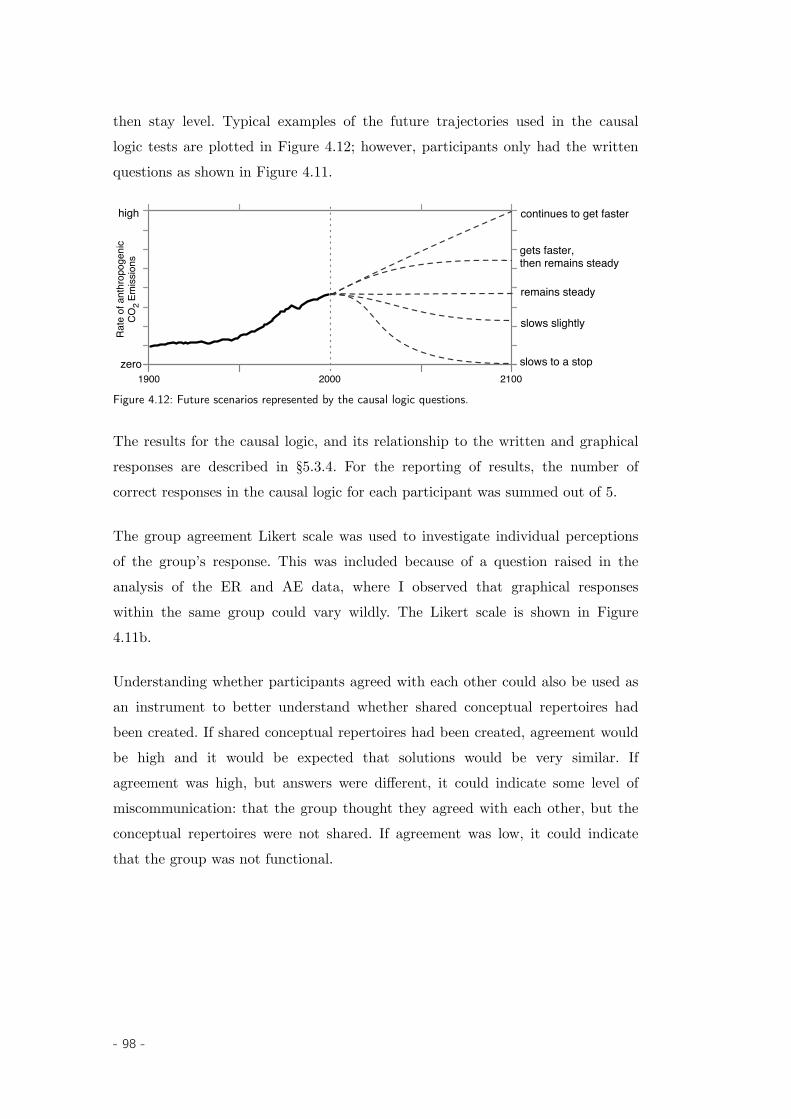
then stay level. Typical examples of the future trajectories used in the causallogic tests are plotted in Figure 4.12; however, participants only had the writtenquestions as shown in Figure 4.11.
1900 2000
Rate
of a
nthr
opog
enic
CO2
Emiss
ions
2100slows to a stop
continues to get faster
remains steady
slows slightly
gets faster, then remains steady
zero
high
Figure 4.12: Future scenarios represented by the causal logic questions.
The results for the causal logic, and its relationship to the written and graphicalresponses are described in §5.3.4. For the reporting of results, the number ofcorrect responses in the causal logic for each participant was summed out of 5.
The group agreement Likert scale was used to investigate individual perceptionsof the group’s response. This was included because of a question raised in theanalysis of the ER and AE data, where I observed that graphical responseswithin the same group could vary wildly. The Likert scale is shown in Figure4.11b.
Understanding whether participants agreed with each other could also be used asan instrument to better understand whether shared conceptual repertoires hadbeen created. If shared conceptual repertoires had been created, agreement wouldbe high and it would be expected that solutions would be very similar. Ifagreement was high, but answers were different, it could indicate some level ofmiscommunication: that the group thought they agreed with each other, but theconceptual repertoires were not shared. If agreement was low, it could indicatethat the group was not functional.
- 98 -
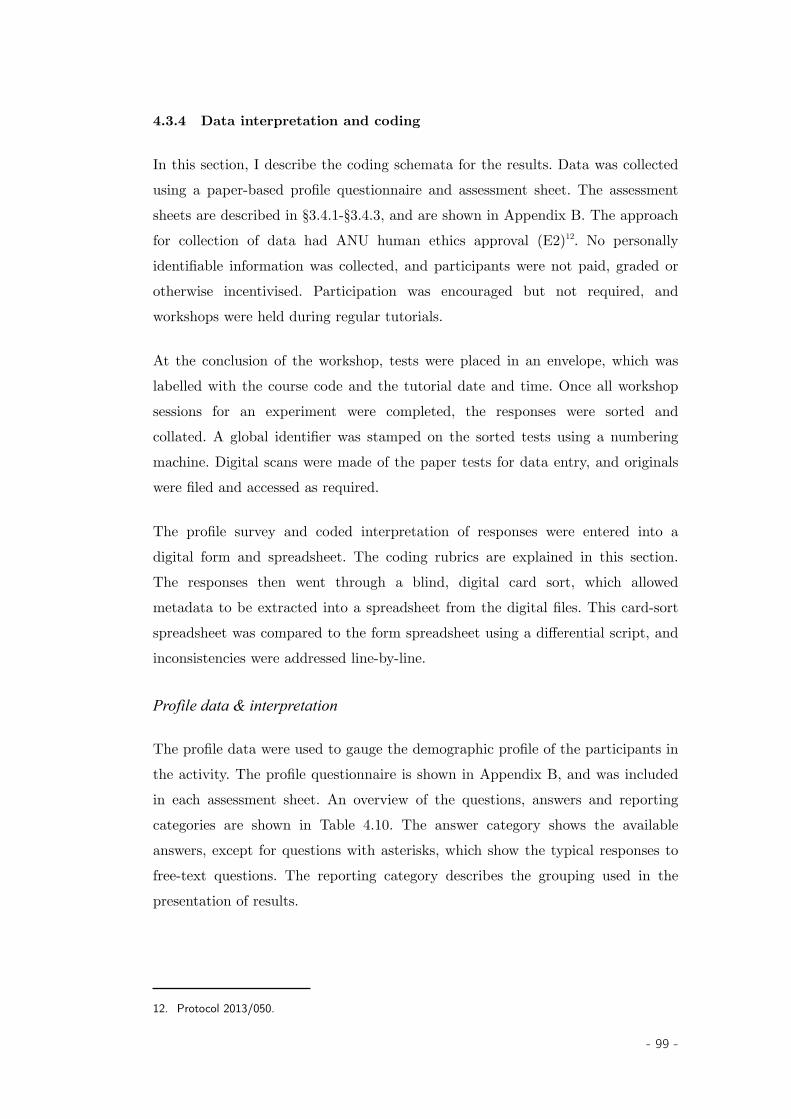
4.3.4 Data interpretation and coding
In this section, I describe the coding schemata for the results. Data was collectedusing a paper-based profile questionnaire and assessment sheet. The assessmentsheets are described in §3.4.1-§3.4.3, and are shown in Appendix B. The approachfor collection of data had ANU human ethics approval (E2)12. No personallyidentifiable information was collected, and participants were not paid, graded orotherwise incentivised. Participation was encouraged but not required, andworkshops were held during regular tutorials.
At the conclusion of the workshop, tests were placed in an envelope, which waslabelled with the course code and the tutorial date and time. Once all workshopsessions for an experiment were completed, the responses were sorted andcollated. A global identifier was stamped on the sorted tests using a numberingmachine. Digital scans were made of the paper tests for data entry, and originalswere filed and accessed as required.
The profile survey and coded interpretation of responses were entered into adigital form and spreadsheet. The coding rubrics are explained in this section.The responses then went through a blind, digital card sort, which allowedmetadata to be extracted into a spreadsheet from the digital files. This card-sortspreadsheet was compared to the form spreadsheet using a differential script, andinconsistencies were addressed line-by-line.
Profile data & interpretation
The profile data were used to gauge the demographic profile of the participants inthe activity. The profile questionnaire is shown in Appendix B, and was includedin each assessment sheet. An overview of the questions, answers and reportingcategories are shown in Table 4.10. The answer category shows the availableanswers, except for questions with asterisks, which show the typical responses tofree-text questions. The reporting category describes the grouping used in thepresentation of results.
12. Protocol 2013/050.
- 99 -
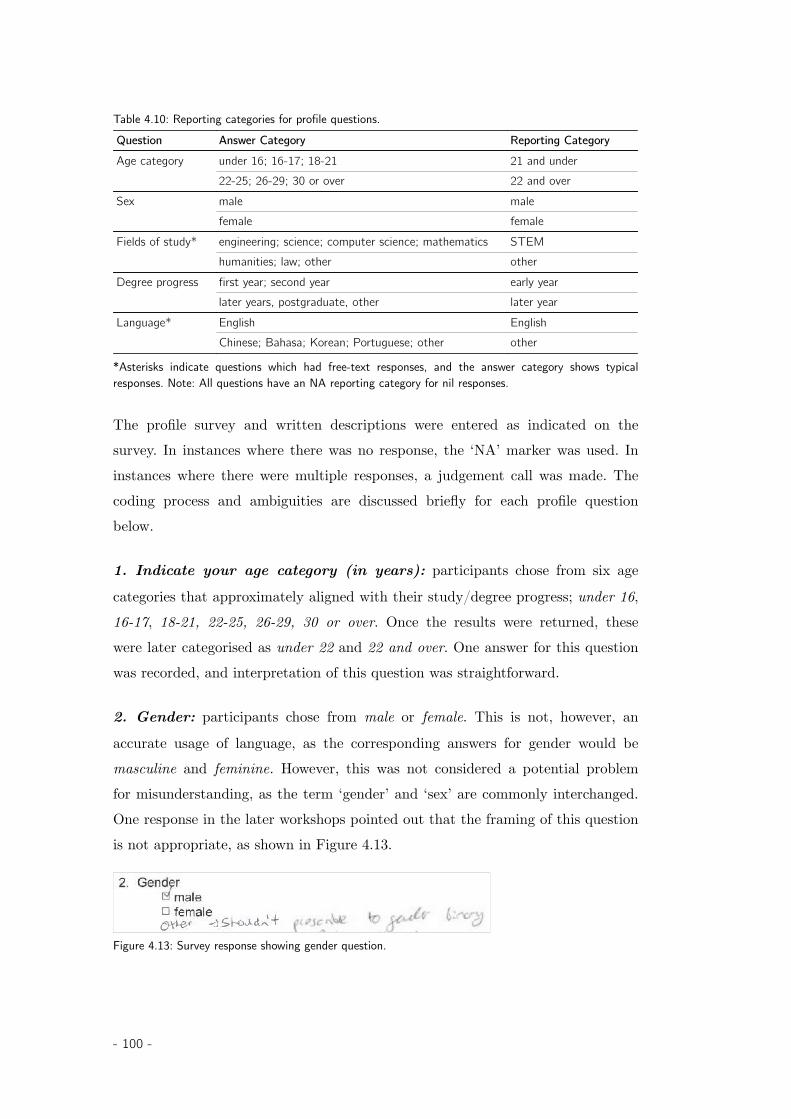
Table 4.10: Reporting categories for profile questions. Question Answer Category Reporting CategoryAge category under 16; 16-17; 18-21 21 and under
22-25; 26-29; 30 or over 22 and overSex male male
female femaleFields of study* engineering; science; computer science; mathematics STEM
humanities; law; other otherDegree progress first year; second year early year
later years, postgraduate, other later yearLanguage* English English
Chinese; Bahasa; Korean; Portuguese; other other
*Asterisks indicate questions which had free-text responses, and the answer category shows typicalresponses. Note: All questions have an NA reporting category for nil responses.
The profile survey and written descriptions were entered as indicated on thesurvey. In instances where there was no response, the ‘NA’ marker was used. Ininstances where there were multiple responses, a judgement call was made. Thecoding process and ambiguities are discussed briefly for each profile questionbelow.
1. Indicate your age category (in years): participants chose from six age
categories that approximately aligned with their study/degree progress; under 16,16-17, 18-21, 22-25, 26-29, 30 or over. Once the results were returned, thesewere later categorised as under 22 and 22 and over. One answer for this questionwas recorded, and interpretation of this question was straightforward.
2. Gender: participants chose from male or female. This is not, however, an
accurate usage of language, as the corresponding answers for gender would bemasculine and feminine. However, this was not considered a potential problemfor misunderstanding, as the term ‘gender’ and ‘sex’ are commonly interchanged.One response in the later workshops pointed out that the framing of this questionis not appropriate, as shown in Figure 4.13.
Figure 4.13: Survey response showing gender question.
- 100 -
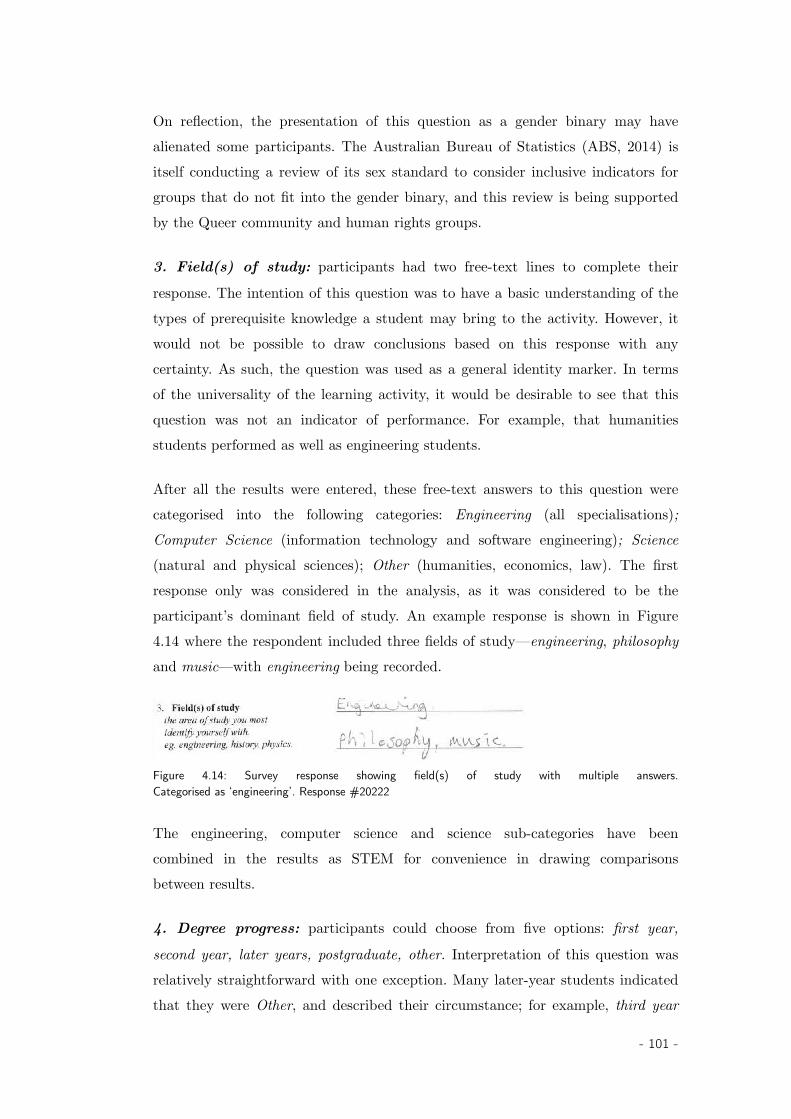
On reflection, the presentation of this question as a gender binary may havealienated some participants. The Australian Bureau of Statistics (ABS, 2014) isitself conducting a review of its sex standard to consider inclusive indicators forgroups that do not fit into the gender binary, and this review is being supportedby the Queer community and human rights groups.
3. Field(s) of study: participants had two free-text lines to complete their
response. The intention of this question was to have a basic understanding of thetypes of prerequisite knowledge a student may bring to the activity. However, itwould not be possible to draw conclusions based on this response with anycertainty. As such, the question was used as a general identity marker. In termsof the universality of the learning activity, it would be desirable to see that thisquestion was not an indicator of performance. For example, that humanitiesstudents performed as well as engineering students.
After all the results were entered, these free-text answers to this question werecategorised into the following categories: Engineering (all specialisations);Computer Science (information technology and software engineering); Science(natural and physical sciences); Other (humanities, economics, law). The firstresponse only was considered in the analysis, as it was considered to be theparticipant’s dominant field of study. An example response is shown in Figure4.14 where the respondent included three fields of study—engineering, philosophyand music—with engineering being recorded.
Figure 4.14: Survey response showing field(s) of study with multiple answers.Categorised as ‘engineering’. Response #20222
The engineering, computer science and science sub-categories have beencombined in the results as STEM for convenience in drawing comparisonsbetween results.
4. Degree progress: participants could choose from five options: first year,
second year, later years, postgraduate, other. Interpretation of this question wasrelatively straightforward with one exception. Many later-year students indicatedthat they were Other, and described their circumstance; for example, third year
- 101 -
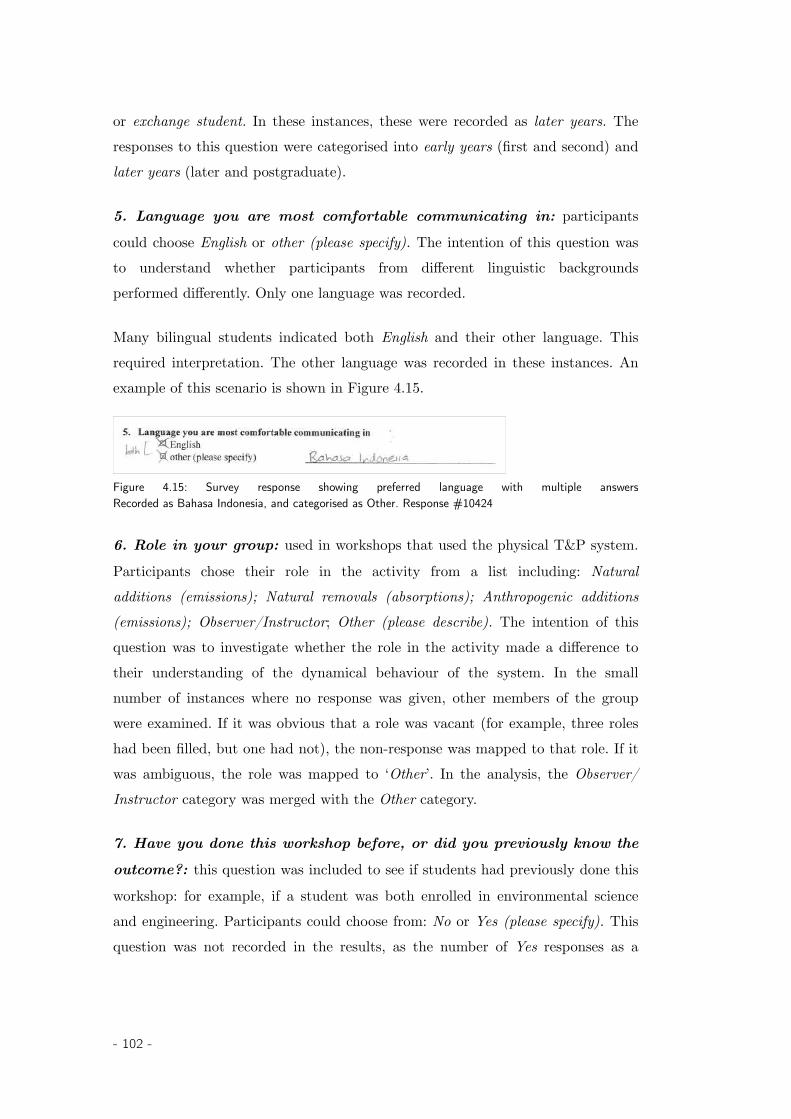
or exchange student. In these instances, these were recorded as later years. Theresponses to this question were categorised into early years (first and second) andlater years (later and postgraduate).
5. Language you are most comfortable communicating in: participants
could choose English or other (please specify). The intention of this question wasto understand whether participants from different linguistic backgroundsperformed differently. Only one language was recorded.
Many bilingual students indicated both English and their other language. Thisrequired interpretation. The other language was recorded in these instances. Anexample of this scenario is shown in Figure 4.15.
Figure 4.15: Survey response showing preferred language with multiple answersRecorded as Bahasa Indonesia, and categorised as Other. Response #10424
6. Role in your group: used in workshops that used the physical T&P system.
Participants chose their role in the activity from a list including: Naturaladditions (emissions); Natural removals (absorptions); Anthropogenic additions(emissions); Observer/Instructor; Other (please describe). The intention of thisquestion was to investigate whether the role in the activity made a difference totheir understanding of the dynamical behaviour of the system. In the smallnumber of instances where no response was given, other members of the groupwere examined. If it was obvious that a role was vacant (for example, three roleshad been filled, but one had not), the non-response was mapped to that role. If itwas ambiguous, the role was mapped to ‘Other’. In the analysis, the Observer/Instructor category was merged with the Other category.
7. Have you done this workshop before, or did you previously know the
outcome?: this question was included to see if students had previously done this
workshop: for example, if a student was both enrolled in environmental scienceand engineering. Participants could choose from: No or Yes (please specify). Thisquestion was not recorded in the results, as the number of Yes responses as a
- 102 -
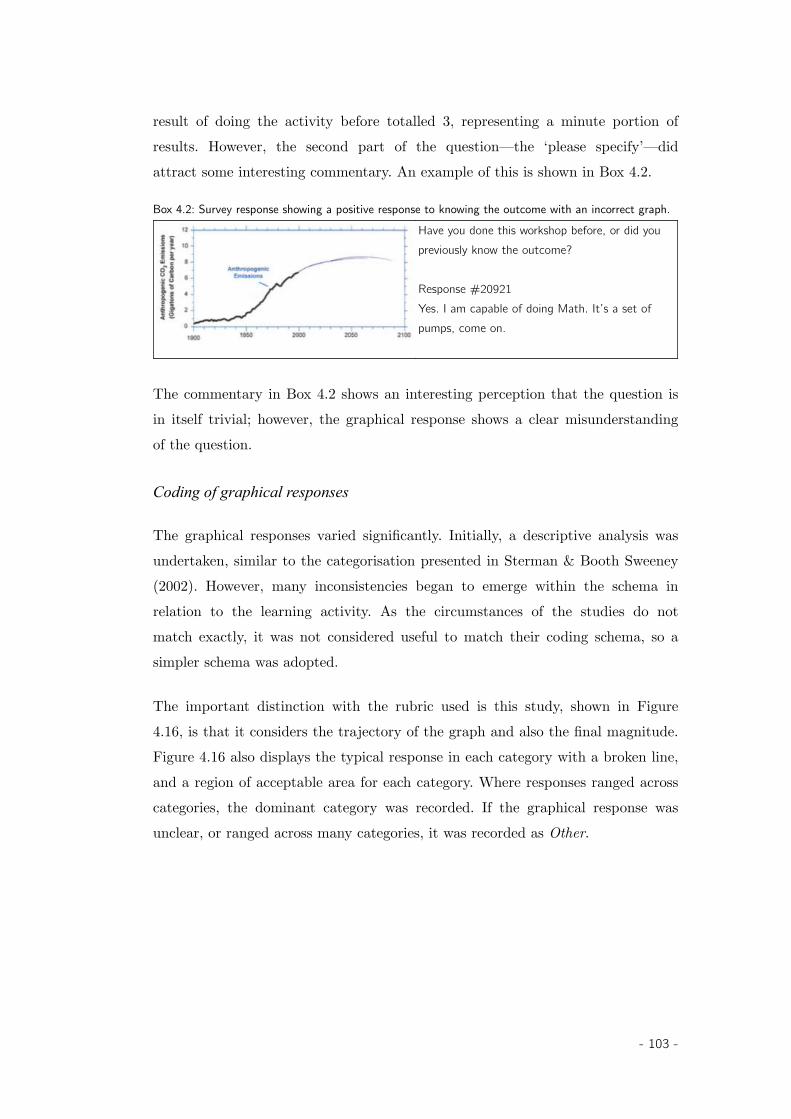
result of doing the activity before totalled 3, representing a minute portion ofresults. However, the second part of the question—the ‘please specify’—didattract some interesting commentary. An example of this is shown in Box 4.2.
Box 4.2: Survey response showing a positive response to knowing the outcome with an incorrect graph. Have you done this workshop before, or did you previously know the outcome?
Response #20921Yes. I am capable of doing Math. It’s a set of pumps, come on.
The commentary in Box 4.2 shows an interesting perception that the question isin itself trivial; however, the graphical response shows a clear misunderstandingof the question.
Coding of graphical responses
The graphical responses varied significantly. Initially, a descriptive analysis wasundertaken, similar to the categorisation presented in Sterman & Booth Sweeney(2002). However, many inconsistencies began to emerge within the schema inrelation to the learning activity. As the circumstances of the studies do notmatch exactly, it was not considered useful to match their coding schema, so asimpler schema was adopted.
The important distinction with the rubric used is this study, shown in Figure4.16, is that it considers the trajectory of the graph and also the final magnitude.Figure 4.16 also displays the typical response in each category with a broken line,and a region of acceptable area for each category. Where responses ranged acrosscategories, the dominant category was recorded. If the graphical response wasunclear, or ranged across many categories, it was recorded as Other.
- 103 -
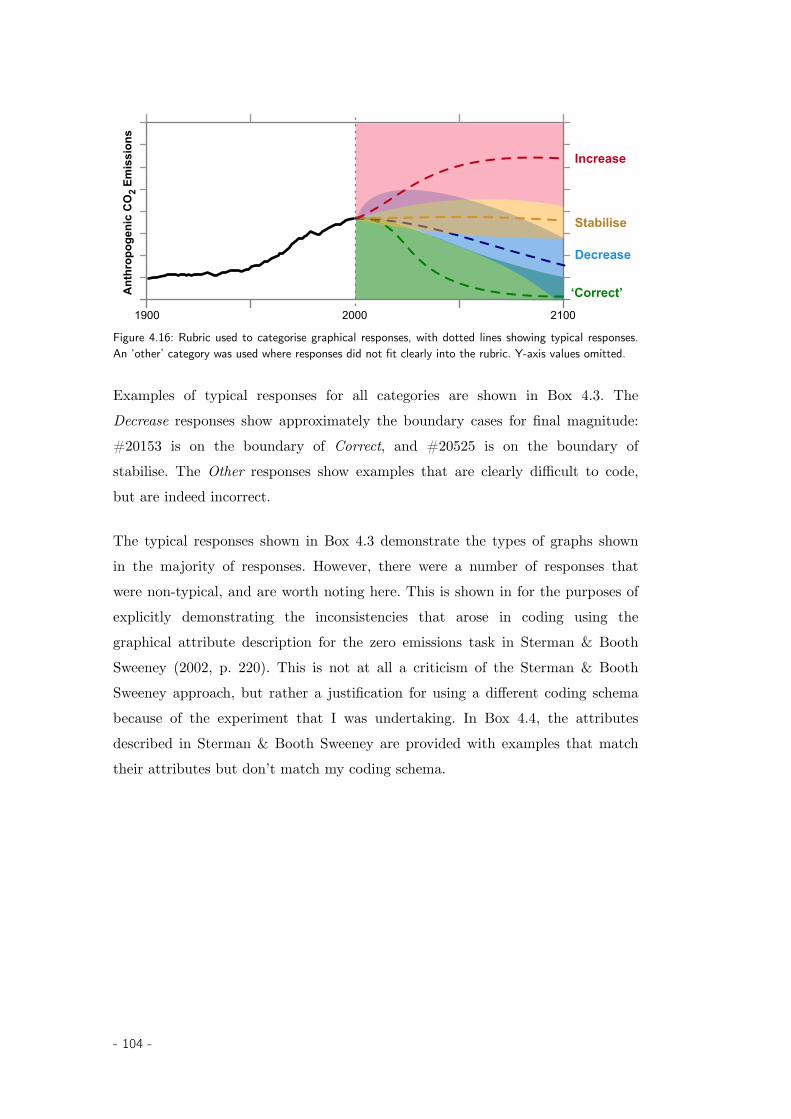
1900 2000
Ant
hrop
ogen
ic C
O2
Emis
sion
s
2100
Increase
Stabilise
Decrease
‘Correct’
Figure 4.16: Rubric used to categorise graphical responses, with dotted lines showing typical responses.An ‘other’ category was used where responses did not fit clearly into the rubric. Y-axis values omitted.
Examples of typical responses for all categories are shown in Box 4.3. TheDecrease responses show approximately the boundary cases for final magnitude:#20153 is on the boundary of Correct, and #20525 is on the boundary ofstabilise. The Other responses show examples that are clearly difficult to code,but are indeed incorrect.
The typical responses shown in Box 4.3 demonstrate the types of graphs shownin the majority of responses. However, there were a number of responses thatwere non-typical, and are worth noting here. This is shown in for the purposes ofexplicitly demonstrating the inconsistencies that arose in coding using thegraphical attribute description for the zero emissions task in Sterman & BoothSweeney (2002, p. 220). This is not at all a criticism of the Sterman & BoothSweeney approach, but rather a justification for using a different coding schemabecause of the experiment that I was undertaking. In Box 4.4, the attributesdescribed in Sterman & Booth Sweeney are provided with examples that matchtheir attributes but don’t match my coding schema.
- 104 -
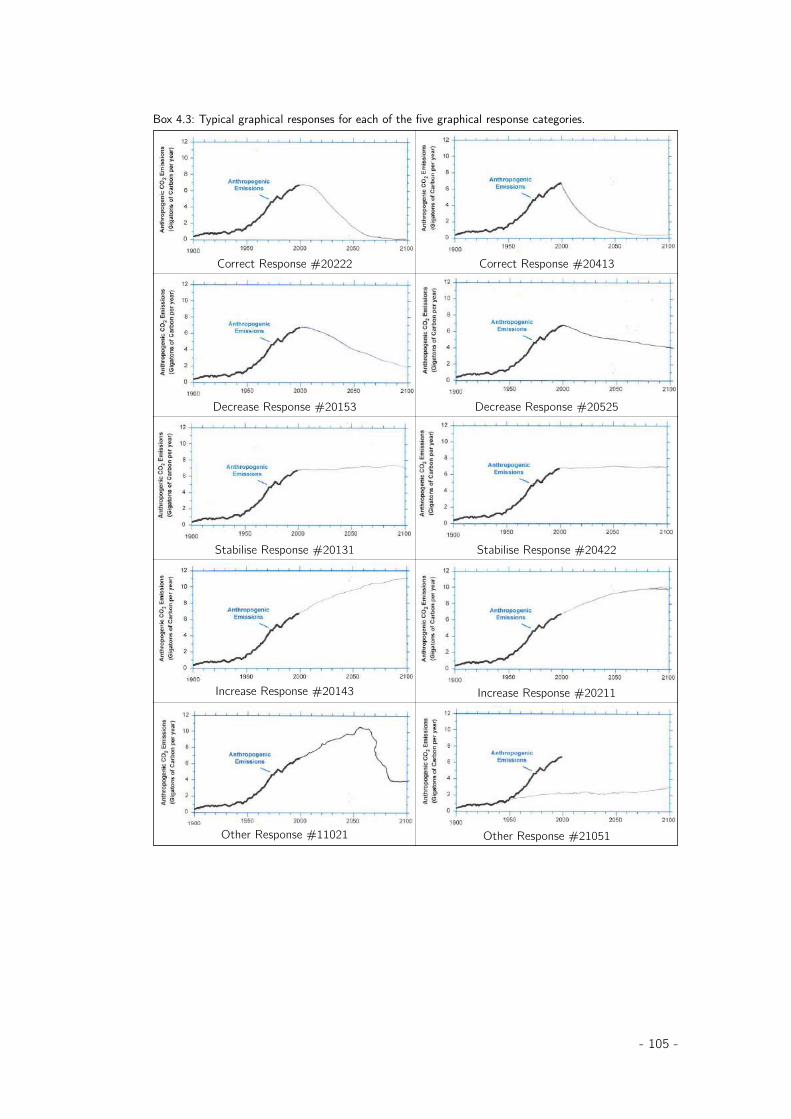
Box 4.3: Typical graphical responses for each of the five graphical response categories.
Correct Response #20222 Correct Response #20413
Decrease Response #20153 Decrease Response #20525
Stabilise Response #20131 Stabilise Response #20422
Increase Response #20143 Increase Response #20211
Other Response #11021 Other Response #21051
- 105 -
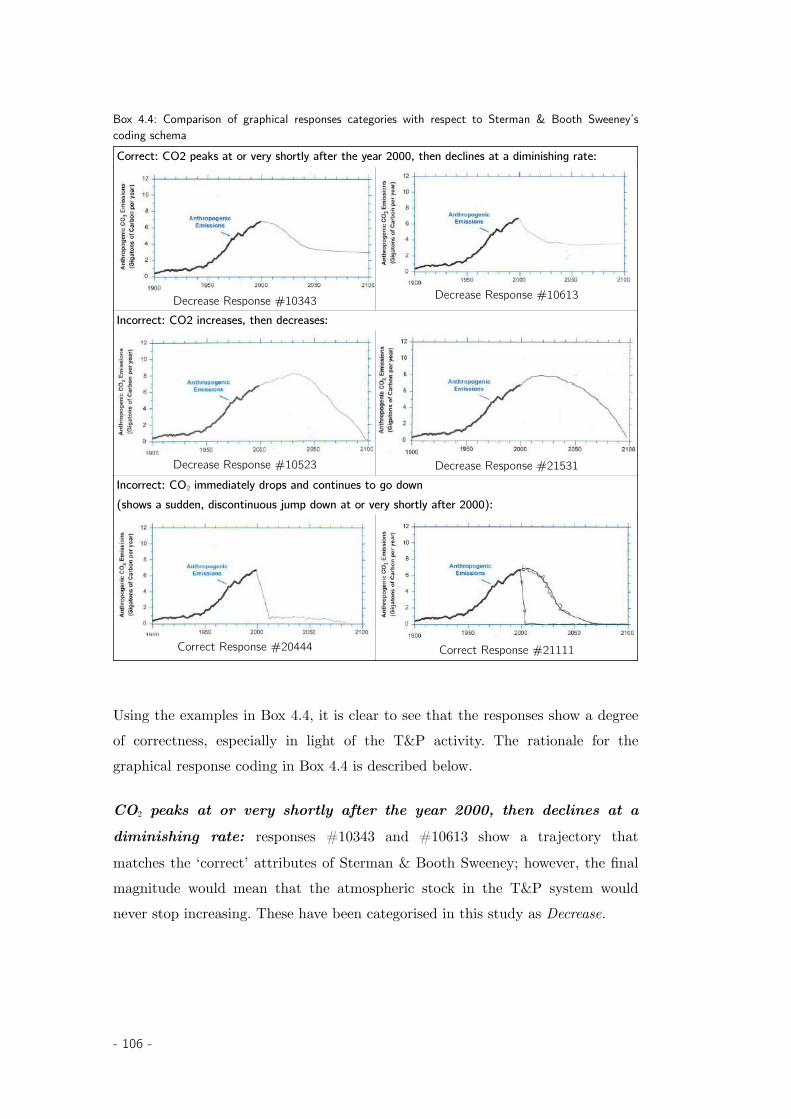
Box 4.4: Comparison of graphical responses categories with respect to Sterman & Booth Sweeney’scoding schemaCorrect: CO2 peaks at or very shortly after the year 2000, then declines at a diminishing rate:
Decrease Response #10343 Decrease Response #10613
Incorrect: CO2 increases, then decreases:
Decrease Response #10523 Decrease Response #21531Incorrect: CO2 immediately drops and continues to go down (shows a sudden, discontinuous jump down at or very shortly after 2000):
Correct Response #20444 Correct Response #21111
Using the examples in Box 4.4, it is clear to see that the responses show a degreeof correctness, especially in light of the T&P activity. The rationale for thegraphical response coding in Box 4.4 is described below.
CO2 peaks at or very shortly after the year 2000, then declines at a
diminishing rate: responses #10343 and #10613 show a trajectory that
matches the ‘correct’ attributes of Sterman & Booth Sweeney; however, the finalmagnitude would mean that the atmospheric stock in the T&P system wouldnever stop increasing. These have been categorised in this study as Decrease.
- 106 -
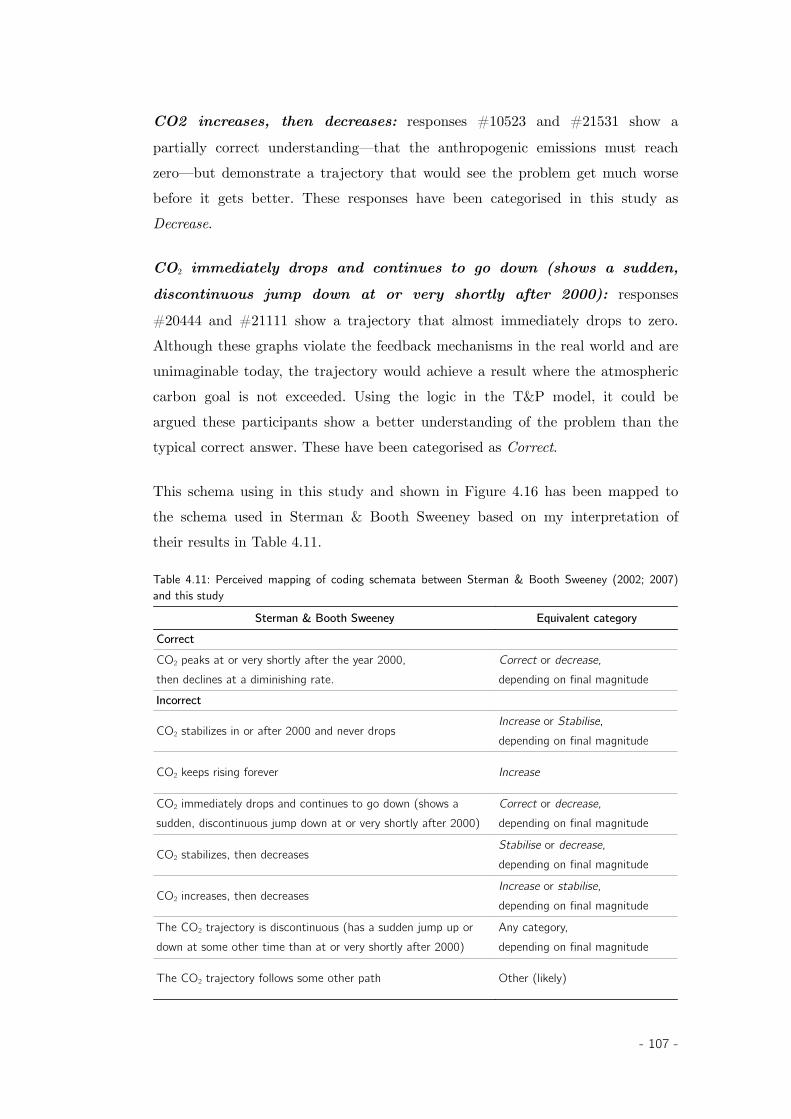
CO2 increases, then decreases: responses #10523 and #21531 show a
partially correct understanding—that the anthropogenic emissions must reachzero—but demonstrate a trajectory that would see the problem get much worsebefore it gets better. These responses have been categorised in this study asDecrease.
CO2 immediately drops and continues to go down (shows a sudden,
discontinuous jump down at or very shortly after 2000): responses
#20444 and #21111 show a trajectory that almost immediately drops to zero.Although these graphs violate the feedback mechanisms in the real world and areunimaginable today, the trajectory would achieve a result where the atmosphericcarbon goal is not exceeded. Using the logic in the T&P model, it could beargued these participants show a better understanding of the problem than thetypical correct answer. These have been categorised as Correct.
This schema using in this study and shown in Figure 4.16 has been mapped tothe schema used in Sterman & Booth Sweeney based on my interpretation oftheir results in Table 4.11.
Table 4.11: Perceived mapping of coding schemata between Sterman & Booth Sweeney (2002; 2007)and this study
Sterman & Booth Sweeney Equivalent categoryCorrectCO2 peaks at or very shortly after the year 2000, then declines at a diminishing rate.
Correct or decrease, depending on final magnitude
Incorrect
CO2 stabilizes in or after 2000 and never drops Increase or Stabilise, depending on final magnitude
CO2 keeps rising forever Increase
CO2 immediately drops and continues to go down (shows a sudden, discontinuous jump down at or very shortly after 2000)
Correct or decrease, depending on final magnitude
CO2 stabilizes, then decreasesStabilise or decrease, depending on final magnitude
CO2 increases, then decreasesIncrease or stabilise, depending on final magnitude
The CO2 trajectory is discontinuous (has a sudden jump up or down at some other time than at or very shortly after 2000)
Any category,depending on final magnitude
The CO2 trajectory follows some other path Other (likely)
- 107 -
Coding of written descriptions
The written descriptions were both transcribed and coded. Transcription ofwritten descriptions was undertaken by a professional transcription service. Onlythe relevant written question was provided to the transcription service, alongsidethe global identifier. Written descriptions were entered into a spreadsheet. Thetranscription service highlighted any unclear text13 with ‘unreadable’ and anynon-trivial formulae with ‘formula’. Once the transcription service had completedthis, I checked 5% of responses for accuracy, and found no significant issues. Iexamined the returned data and completed any indicated gaps.
For the text analysis, I corrected spelling errors14 and replaced the followingterms for consistency between workshops:
natural emissions/pump => natural additions/pumpnatural absorptions/pump => natural removals/pumpanthropogenic emissions/pump => anthropogenic additions/pumpanthropogenic absorption/pump => anthropogenic removals/pump
The written descriptions were also coded. Sterman & Booth Sweeney present acoding system for their CO2 and Temperature tests that extract concepts fromthe responses, including: mass balance, energy balance, pattern matching,inertia/delays, CO2 fertilisation, sink saturation, and technology. Whilst thisappears to be a useful coding system, it was immediately apparent that this wasnot the most useful way to interpret my results, and differentiating from theirapproach resulted in being a major influence on subsequent workshop designs.
In trying to code the written responses, I found that many participants drew agraph that was not adequately explained by their written description. Forexample, it was common to see a graph that showed an increasing future anthro-pogenic additions trajectory together with a written description that stated theanthropogenic additions needed to decrease to zero. This is discussed further in§6.2.
13. Text was either unclear due to handwriting illegibility or due to compression of the digital file.These were cleared up in all instances using the original paper responses14. Spelling errors were typically transcribed as they appeared in the handwritten description
- 108 -
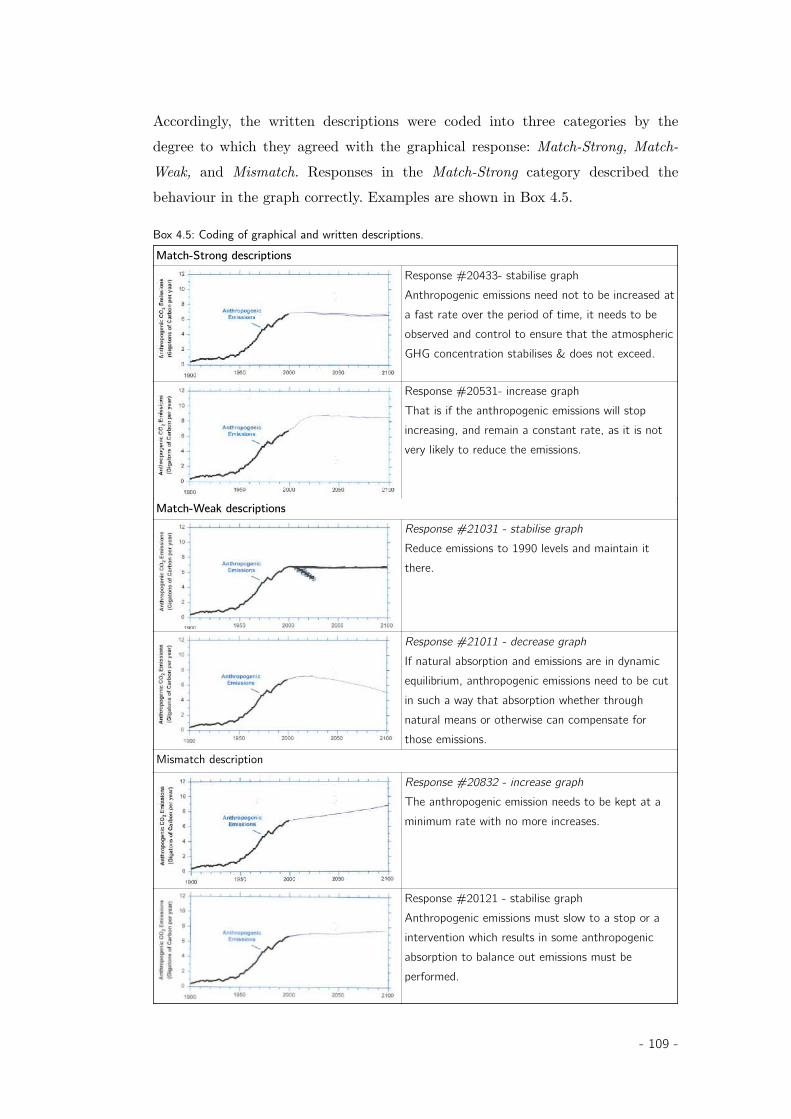
Accordingly, the written descriptions were coded into three categories by thedegree to which they agreed with the graphical response: Match-Strong, Match-Weak, and Mismatch. Responses in the Match-Strong category described thebehaviour in the graph correctly. Examples are shown in Box 4.5.
Box 4.5: Coding of graphical and written descriptions.Match-Strong descriptions
Response #20433- stabilise graphAnthropogenic emissions need not to be increased ata fast rate over the period of time, it needs to be observed and control to ensure that the atmosphericGHG concentration stabilises & does not exceed.
Response #20531- increase graphThat is if the anthropogenic emissions will stop increasing, and remain a constant rate, as it is not very likely to reduce the emissions.
Match-Weak descriptionsResponse #21031 - stabilise graph Reduce emissions to 1990 levels and maintain it there.
Response #21011 - decrease graphIf natural absorption and emissions are in dynamic equilibrium, anthropogenic emissions need to be cut in such a way that absorption whether through natural means or otherwise can compensate for those emissions.
Mismatch description
Response #20832 - increase graphThe anthropogenic emission needs to be kept at a minimum rate with no more increases.
Response #20121 - stabilise graphAnthropogenic emissions must slow to a stop or a intervention which results in some anthropogenic absorption to balance out emissions must be performed.
- 109 -
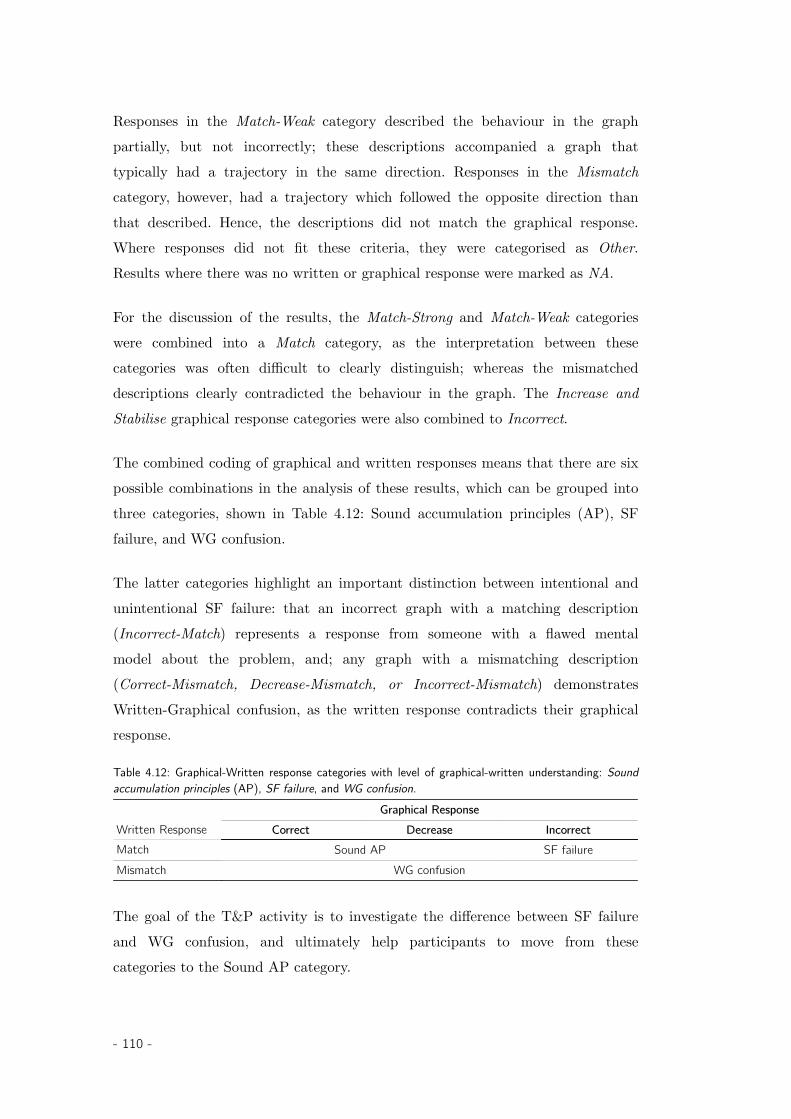
Responses in the Match-Weak category described the behaviour in the graphpartially, but not incorrectly; these descriptions accompanied a graph thattypically had a trajectory in the same direction. Responses in the Mismatchcategory, however, had a trajectory which followed the opposite direction thanthat described. Hence, the descriptions did not match the graphical response.Where responses did not fit these criteria, they were categorised as Other.Results where there was no written or graphical response were marked as NA.
For the discussion of the results, the Match-Strong and Match-Weak categorieswere combined into a Match category, as the interpretation between thesecategories was often difficult to clearly distinguish; whereas the mismatcheddescriptions clearly contradicted the behaviour in the graph. The Increase andStabilise graphical response categories were also combined to Incorrect.
The combined coding of graphical and written responses means that there are sixpossible combinations in the analysis of these results, which can be grouped intothree categories, shown in Table 4.12: Sound accumulation principles (AP), SFfailure, and WG confusion.
The latter categories highlight an important distinction between intentional andunintentional SF failure: that an incorrect graph with a matching description(Incorrect-Match) represents a response from someone with a flawed mentalmodel about the problem, and; any graph with a mismatching description(Correct-Mismatch, Decrease-Mismatch, or Incorrect-Mismatch) demonstratesWritten-Graphical confusion, as the written response contradicts their graphicalresponse.
Table 4.12: Graphical-Written response categories with level of graphical-written understanding: Soundaccumulation principles (AP), SF failure, and WG confusion.
Written ResponseGraphical Response
Correct Decrease IncorrectMatch Sound AP SF failureMismatch WG confusion
The goal of the T&P activity is to investigate the difference between SF failureand WG confusion, and ultimately help participants to move from thesecategories to the Sound AP category.
- 110 -
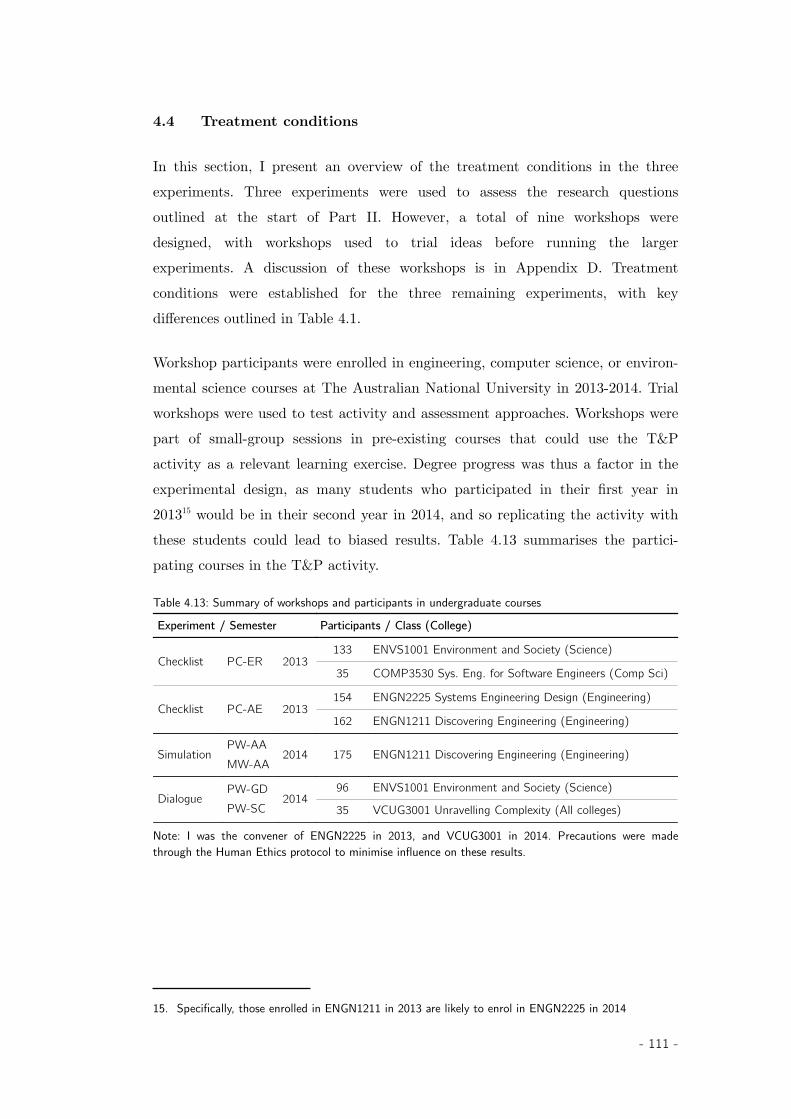
4.4 Treatment conditions
In this section, I present an overview of the treatment conditions in the threeexperiments. Three experiments were used to assess the research questionsoutlined at the start of Part II. However, a total of nine workshops weredesigned, with workshops used to trial ideas before running the largerexperiments. A discussion of these workshops is in Appendix D. Treatmentconditions were established for the three remaining experiments, with keydifferences outlined in Table 4.1.
Workshop participants were enrolled in engineering, computer science, or environ-mental science courses at The Australian National University in 2013-2014. Trialworkshops were used to test activity and assessment approaches. Workshops werepart of small-group sessions in pre-existing courses that could use the T&Pactivity as a relevant learning exercise. Degree progress was thus a factor in theexperimental design, as many students who participated in their first year in201315 would be in their second year in 2014, and so replicating the activity withthese students could lead to biased results. Table 4.13 summarises the partici-pating courses in the T&P activity.
Table 4.13: Summary of workshops and participants in undergraduate courses
Experiment / Semester Participants / Class (College)
Checklist PC-ER 2013133 ENVS1001 Environment and Society (Science)
35 COMP3530 Sys. Eng. for Software Engineers (Comp Sci)
Checklist PC-AE 2013154 ENGN2225 Systems Engineering Design (Engineering)
162 ENGN1211 Discovering Engineering (Engineering)
SimulationPW-AA MW-AA
2014 175 ENGN1211 Discovering Engineering (Engineering)
DialoguePW-GD PW-SC
201496 ENVS1001 Environment and Society (Science)
35 VCUG3001 Unravelling Complexity (All colleges)
Note: I was the convener of ENGN2225 in 2013, and VCUG3001 in 2014. Precautions were madethrough the Human Ethics protocol to minimise influence on these results.
15. Specifically, those enrolled in ENGN1211 in 2013 are likely to enrol in ENGN2225 in 2014
- 111 -
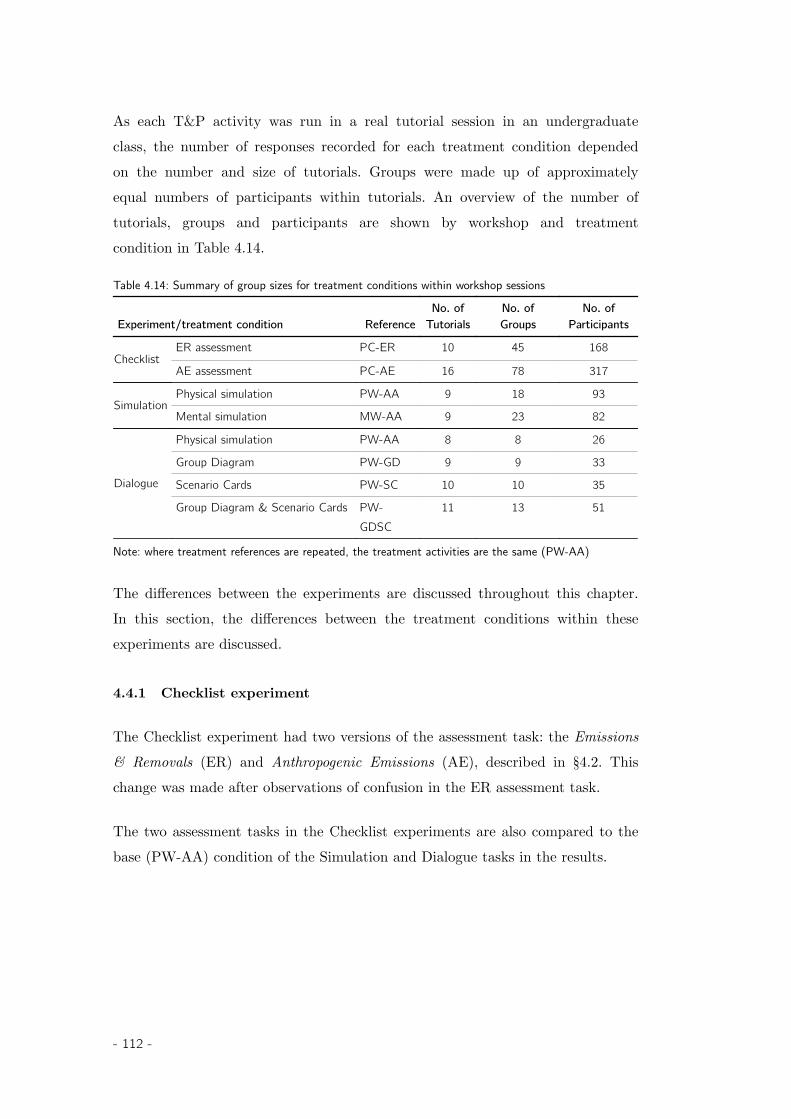
As each T&P activity was run in a real tutorial session in an undergraduateclass, the number of responses recorded for each treatment condition dependedon the number and size of tutorials. Groups were made up of approximatelyequal numbers of participants within tutorials. An overview of the number oftutorials, groups and participants are shown by workshop and treatmentcondition in Table 4.14.
Table 4.14: Summary of group sizes for treatment conditions within workshop sessions
Experiment/treatment condition ReferenceNo. of
TutorialsNo. ofGroups
No. ofParticipants
ChecklistER assessment PC-ER 10 45 168
AE assessment PC-AE 16 78 317
SimulationPhysical simulation PW-AA 9 18 93
Mental simulation MW-AA 9 23 82
Dialogue
Physical simulation PW-AA 8 8 26
Group Diagram PW-GD 9 9 33
Scenario Cards PW-SC 10 10 35
Group Diagram & Scenario Cards PW-GDSC
11 13 51
Note: where treatment references are repeated, the treatment activities are the same (PW-AA)
The differences between the experiments are discussed throughout this chapter.In this section, the differences between the treatment conditions within theseexperiments are discussed.
4.4.1 Checklist experiment
The Checklist experiment had two versions of the assessment task: the Emissions& Removals (ER) and Anthropogenic Emissions (AE), described in §4.2. Thischange was made after observations of confusion in the ER assessment task.
The two assessment tasks in the Checklist experiments are also compared to thebase (PW-AA) condition of the Simulation and Dialogue tasks in the results.
- 112 -
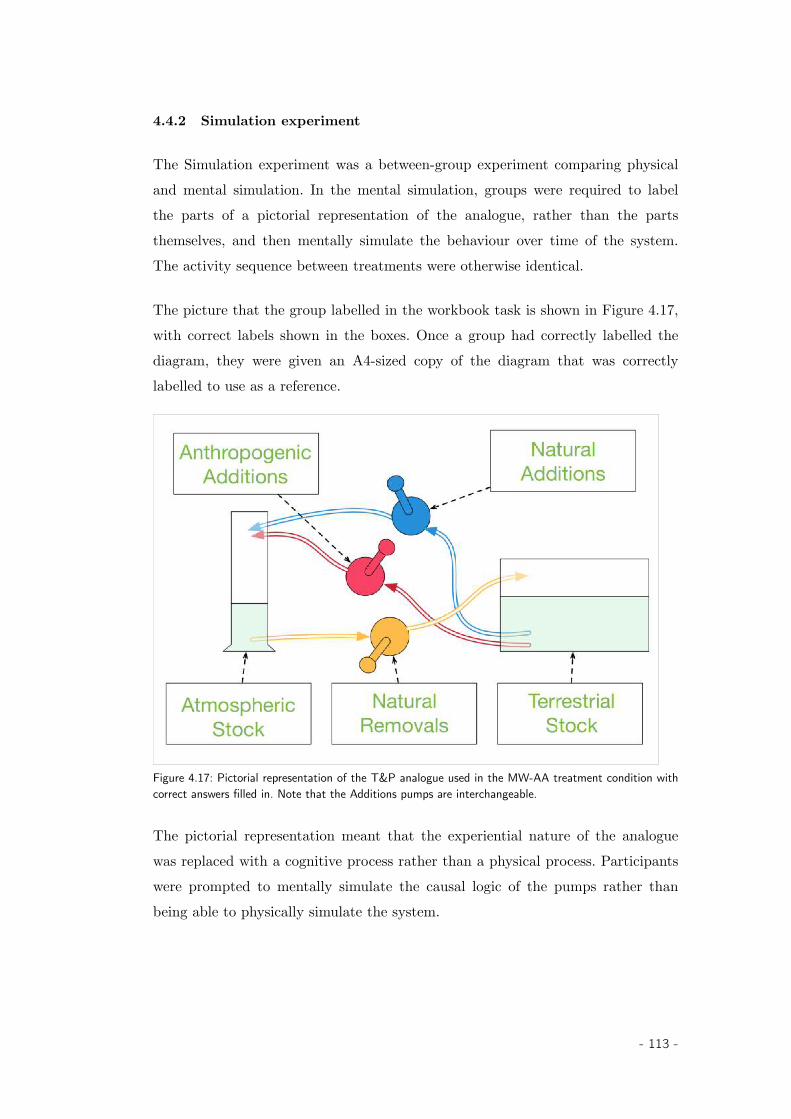
4.4.2 Simulation experiment
The Simulation experiment was a between-group experiment comparing physicaland mental simulation. In the mental simulation, groups were required to labelthe parts of a pictorial representation of the analogue, rather than the partsthemselves, and then mentally simulate the behaviour over time of the system.The activity sequence between treatments were otherwise identical.
The picture that the group labelled in the workbook task is shown in Figure 4.17,with correct labels shown in the boxes. Once a group had correctly labelled thediagram, they were given an A4-sized copy of the diagram that was correctlylabelled to use as a reference.
Figure 4.17: Pictorial representation of the T&P analogue used in the MW-AA treatment condition withcorrect answers filled in. Note that the Additions pumps are interchangeable.
The pictorial representation meant that the experiential nature of the analoguewas replaced with a cognitive process rather than a physical process. Participantswere prompted to mentally simulate the causal logic of the pumps rather thanbeing able to physically simulate the system.
- 113 -
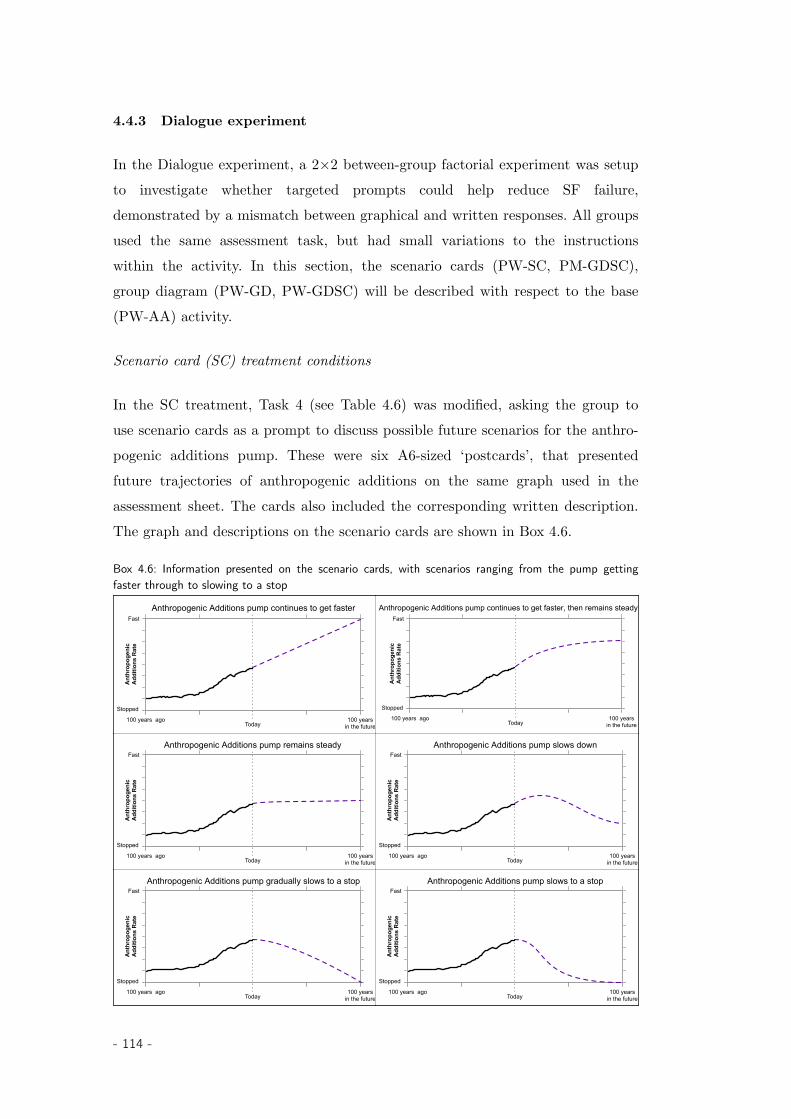
4.4.3 Dialogue experiment
In the Dialogue experiment, a 2×2 between-group factorial experiment was setupto investigate whether targeted prompts could help reduce SF failure,demonstrated by a mismatch between graphical and written responses. All groupsused the same assessment task, but had small variations to the instructionswithin the activity. In this section, the scenario cards (PW-SC, PM-GDSC),group diagram (PW-GD, PW-GDSC) will be described with respect to the base(PW-AA) activity.
Scenario card (SC) treatment conditions
In the SC treatment, Task 4 (see Table 4.6) was modified, asking the group touse scenario cards as a prompt to discuss possible future scenarios for the anthro-pogenic additions pump. These were six A6-sized ‘postcards’, that presentedfuture trajectories of anthropogenic additions on the same graph used in theassessment sheet. The cards also included the corresponding written description.The graph and descriptions on the scenario cards are shown in Box 4.6.
Box 4.6: Information presented on the scenario cards, with scenarios ranging from the pump gettingfaster through to slowing to a stop
Fast
Stopped
100 years agoToday
Ant
hrop
ogen
icA
dditi
ons
Rat
e
100 yearsin the future
Anthropogenic Additions pump continues to get fasterFast
Stopped
100 years agoToday
Ant
hrop
ogen
icA
dditi
ons
Rat
e
100 yearsin the future
Anthropogenic Additions pump continues to get faster, then remains steady
Fast
Stopped
100 years agoToday
Ant
hrop
ogen
icA
dditi
ons
Rat
e
100 yearsin the future
Anthropogenic Additions pump remains steadyFast
Stopped
100 years agoToday
Ant
hrop
ogen
icA
dditi
ons
Rat
e
100 yearsin the future
Anthropogenic Additions pump slows down
Fast
Stopped
100 years agoToday
Ant
hrop
ogen
icA
dditi
ons
Rat
e
100 yearsin the future
Anthropogenic Additions pump gradually slows to a stopFast
Stopped
100 years agoToday
Ant
hrop
ogen
icA
dditi
ons
Rat
e
100 yearsin the future
Anthropogenic Additions pump slows to a stop
- 114 -

The intention behind using the scenario cards was to investigate whether thisprompt would reduce the frequency of mismatching written and graphicalresponses by linking graphs with the correct description.
Group diagram (GD) treatment conditions
In the final workbook task, the GD treatment condition required groups to drawwhat the anthropogenic additions pump was required to do in order to reach theatmospheric carbon goal level, considering that the pumps in the natural cycleshould remain approximately equal. In the GD treatment, groups were alsorequired to draw the future trajectory of the anthropogenic additions rate in thefinal task.
The workbook modification for this task is shown in Figure 4.18. This taskreplicates the individual assessment task, and presents an opportunity for thegroup to make answers explicit before moving to the individual task.
- 115 -
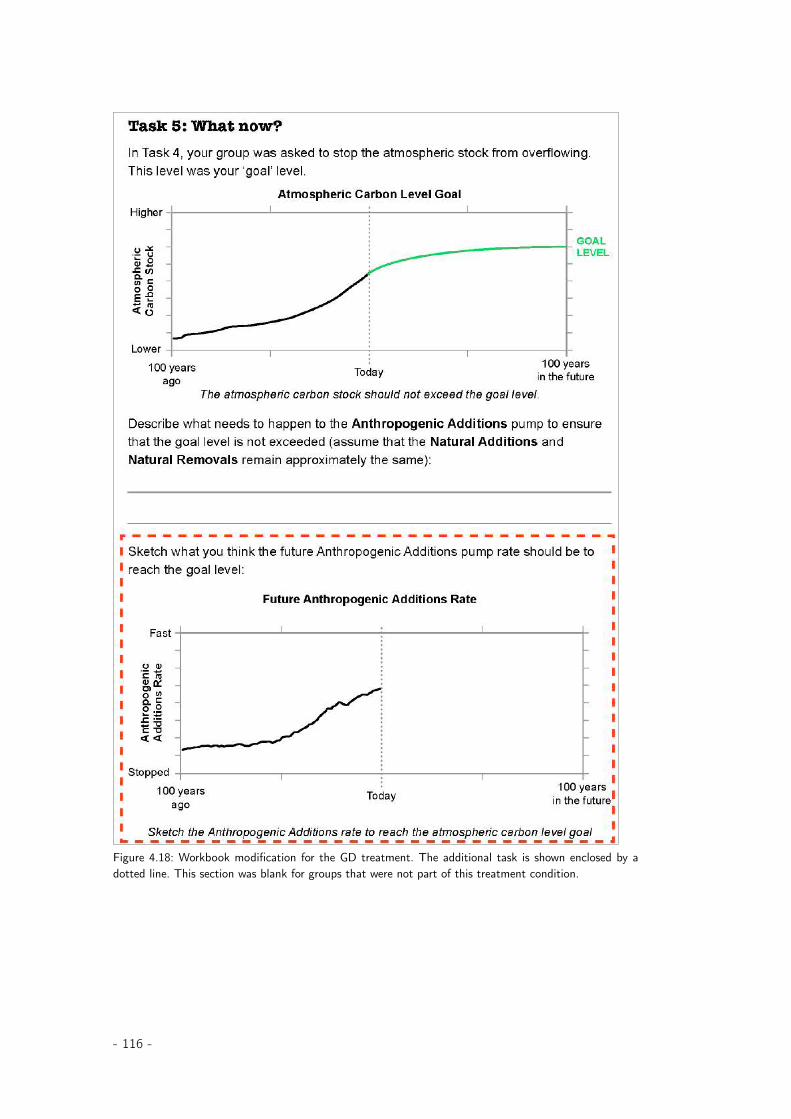
Figure 4.18: Workbook modification for the GD treatment. The additional task is shown enclosed by adotted line. This section was blank for groups that were not part of this treatment condition.
- 116 -
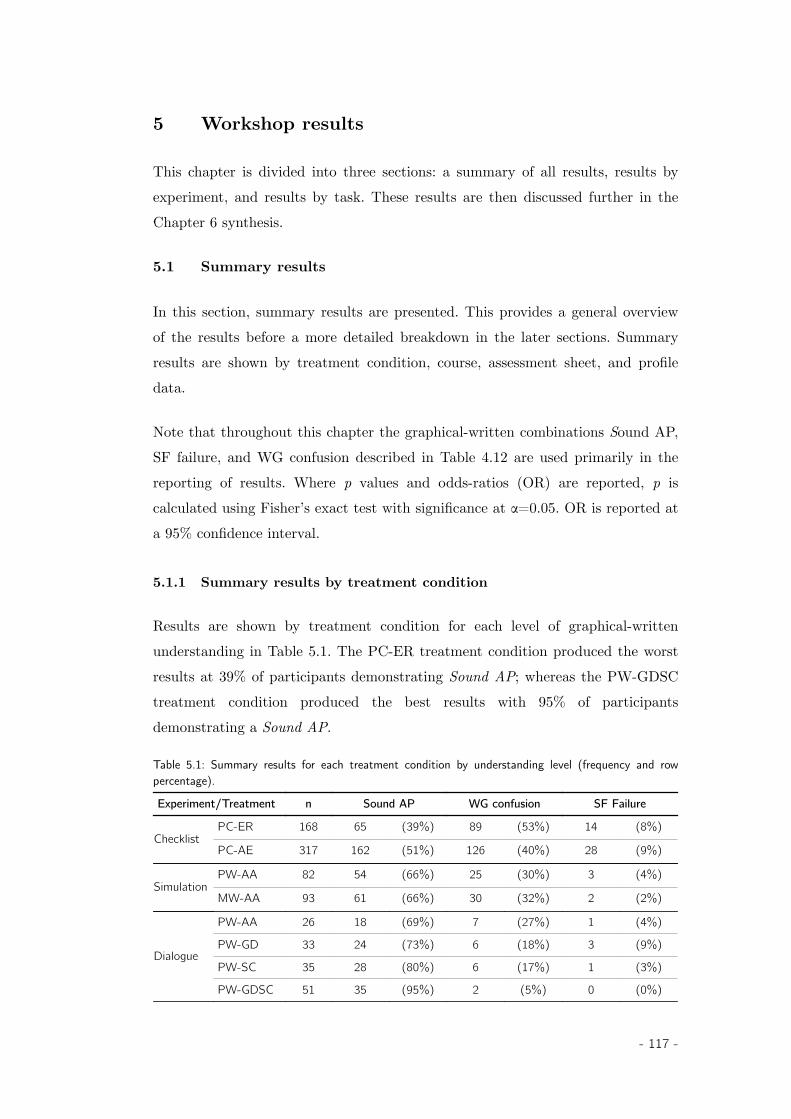
5 Workshop results
This chapter is divided into three sections: a summary of all results, results byexperiment, and results by task. These results are then discussed further in theChapter 6 synthesis.
5.1 Summary results
In this section, summary results are presented. This provides a general overviewof the results before a more detailed breakdown in the later sections. Summaryresults are shown by treatment condition, course, assessment sheet, and profiledata.
Note that throughout this chapter the graphical-written combinations Sound AP,SF failure, and WG confusion described in Table 4.12 are used primarily in thereporting of results. Where p values and odds-ratios (OR) are reported, p iscalculated using Fisher’s exact test with significance at α=0.05. OR is reported ata 95% confidence interval.
5.1.1 Summary results by treatment condition
Results are shown by treatment condition for each level of graphical-writtenunderstanding in Table 5.1. The PC-ER treatment condition produced the worstresults at 39% of participants demonstrating Sound AP; whereas the PW-GDSCtreatment condition produced the best results with 95% of participantsdemonstrating a Sound AP.
Table 5.1: Summary results for each treatment condition by understanding level (frequency and rowpercentage).
Experiment/Treatment n Sound AP WG confusion SF Failure
ChecklistPC-ER 168 65 (39%) 89 (53%) 14 (8%)
PC-AE 317 162 (51%) 126 (40%) 28 (9%)
SimulationPW-AA 82 54 (66%) 25 (30%) 3 (4%)
MW-AA 93 61 (66%) 30 (32%) 2 (2%)
Dialogue
PW-AA 26 18 (69%) 7 (27%) 1 (4%)
PW-GD 33 24 (73%) 6 (18%) 3 (9%)
PW-SC 35 28 (80%) 6 (17%) 1 (3%)
PW-GDSC 51 35 (95%) 2 (5%) 0 (0%)
- 117 -
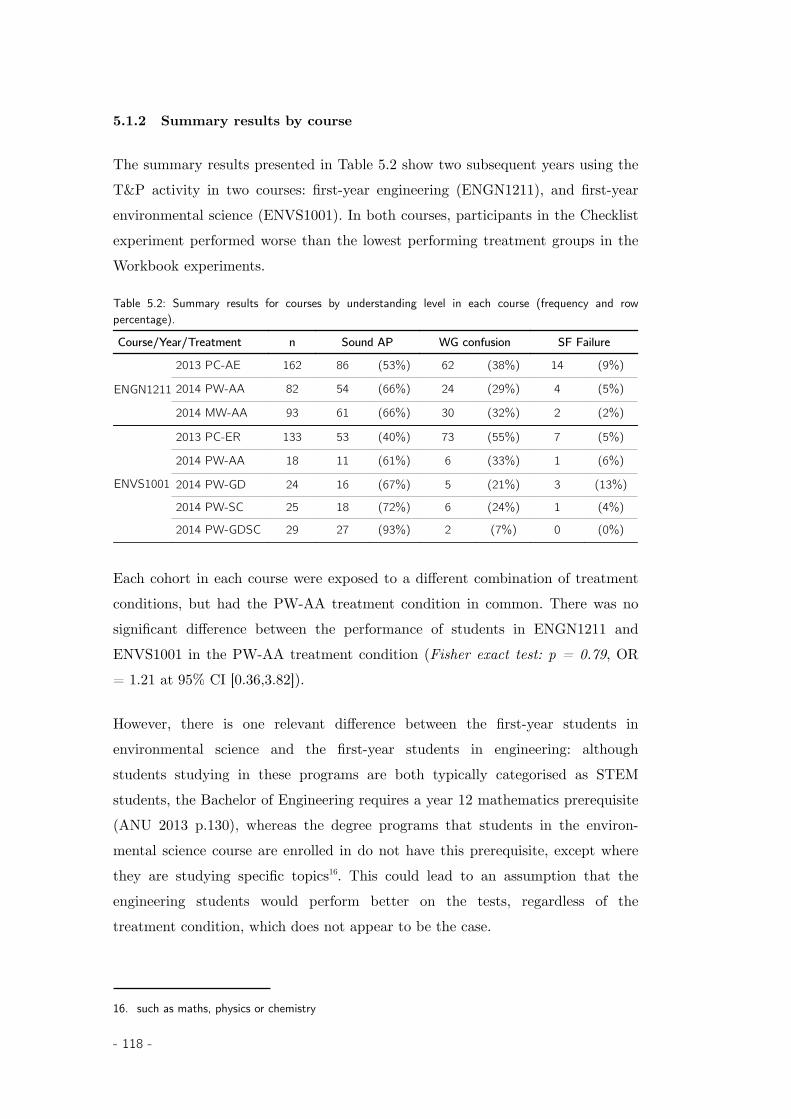
5.1.2 Summary results by course
The summary results presented in Table 5.2 show two subsequent years using theT&P activity in two courses: first-year engineering (ENGN1211), and first-yearenvironmental science (ENVS1001). In both courses, participants in the Checklistexperiment performed worse than the lowest performing treatment groups in theWorkbook experiments.
Table 5.2: Summary results for courses by understanding level in each course (frequency and rowpercentage).
Course/Year/Treatment n Sound AP WG confusion SF Failure
ENGN1211
2013 PC-AE 162 86 (53%) 62 (38%) 14 (9%)
2014 PW-AA 82 54 (66%) 24 (29%) 4 (5%)
2014 MW-AA 93 61 (66%) 30 (32%) 2 (2%)
ENVS1001
2013 PC-ER 133 53 (40%) 73 (55%) 7 (5%)
2014 PW-AA 18 11 (61%) 6 (33%) 1 (6%)
2014 PW-GD 24 16 (67%) 5 (21%) 3 (13%)
2014 PW-SC 25 18 (72%) 6 (24%) 1 (4%)
2014 PW-GDSC 29 27 (93%) 2 (7%) 0 (0%)
Each cohort in each course were exposed to a different combination of treatmentconditions, but had the PW-AA treatment condition in common. There was nosignificant difference between the performance of students in ENGN1211 andENVS1001 in the PW-AA treatment condition (Fisher exact test: p = 0.79, OR= 1.21 at 95% CI [0.36,3.82]).
However, there is one relevant difference between the first-year students inenvironmental science and the first-year students in engineering: althoughstudents studying in these programs are both typically categorised as STEMstudents, the Bachelor of Engineering requires a year 12 mathematics prerequisite(ANU 2013 p.130), whereas the degree programs that students in the environ-mental science course are enrolled in do not have this prerequisite, except wherethey are studying specific topics16. This could lead to an assumption that theengineering students would perform better on the tests, regardless of thetreatment condition, which does not appear to be the case.
16. such as maths, physics or chemistry
- 118 -
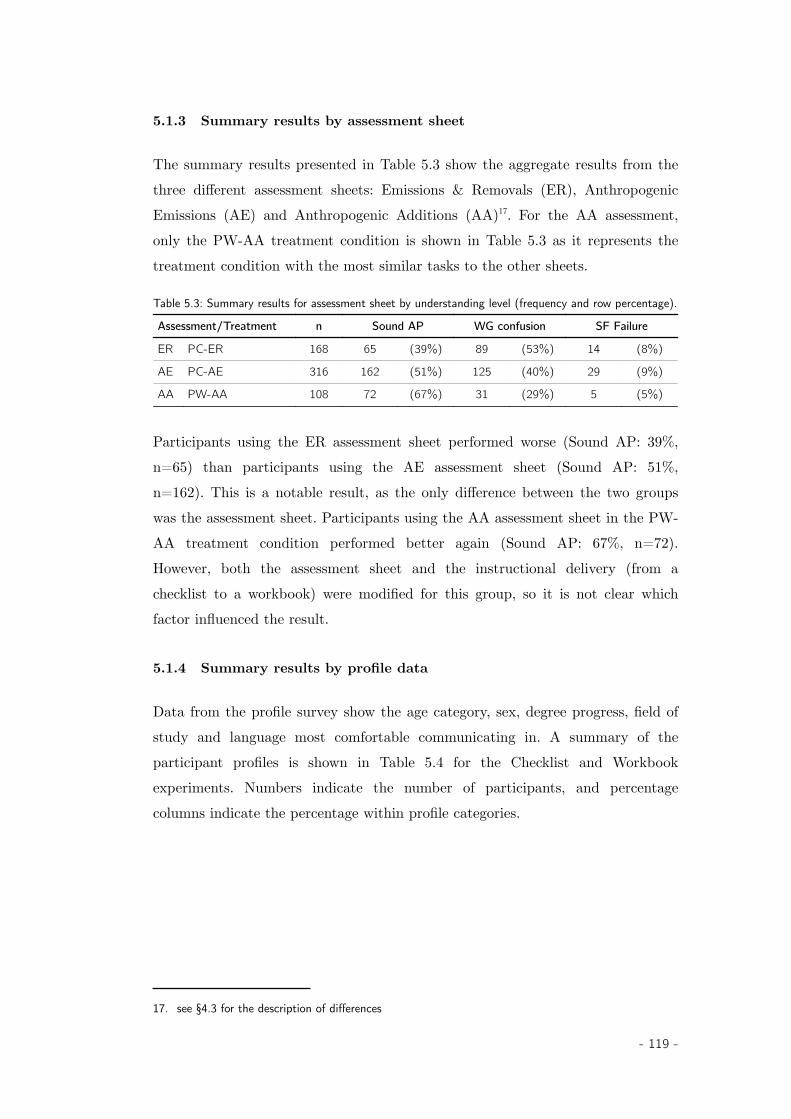
5.1.3 Summary results by assessment sheet
The summary results presented in Table 5.3 show the aggregate results from thethree different assessment sheets: Emissions & Removals (ER), AnthropogenicEmissions (AE) and Anthropogenic Additions (AA)17. For the AA assessment,only the PW-AA treatment condition is shown in Table 5.3 as it represents thetreatment condition with the most similar tasks to the other sheets.
Table 5.3: Summary results for assessment sheet by understanding level (frequency and row percentage).
Assessment/Treatment n Sound AP WG confusion SF Failure
ER PC-ER 168 65 (39%) 89 (53%) 14 (8%)
AE PC-AE 316 162 (51%) 125 (40%) 29 (9%)
AA PW-AA 108 72 (67%) 31 (29%) 5 (5%)
Participants using the ER assessment sheet performed worse (Sound AP: 39%,n=65) than participants using the AE assessment sheet (Sound AP: 51%,n=162). This is a notable result, as the only difference between the two groupswas the assessment sheet. Participants using the AA assessment sheet in the PW-AA treatment condition performed better again (Sound AP: 67%, n=72).However, both the assessment sheet and the instructional delivery (from achecklist to a workbook) were modified for this group, so it is not clear whichfactor influenced the result.
5.1.4 Summary results by profile data
Data from the profile survey show the age category, sex, degree progress, field ofstudy and language most comfortable communicating in. A summary of theparticipant profiles is shown in Table 5.4 for the Checklist and Workbookexperiments. Numbers indicate the number of participants, and percentagecolumns indicate the percentage within profile categories.
17. see §4.3 for the description of differences
- 119 -
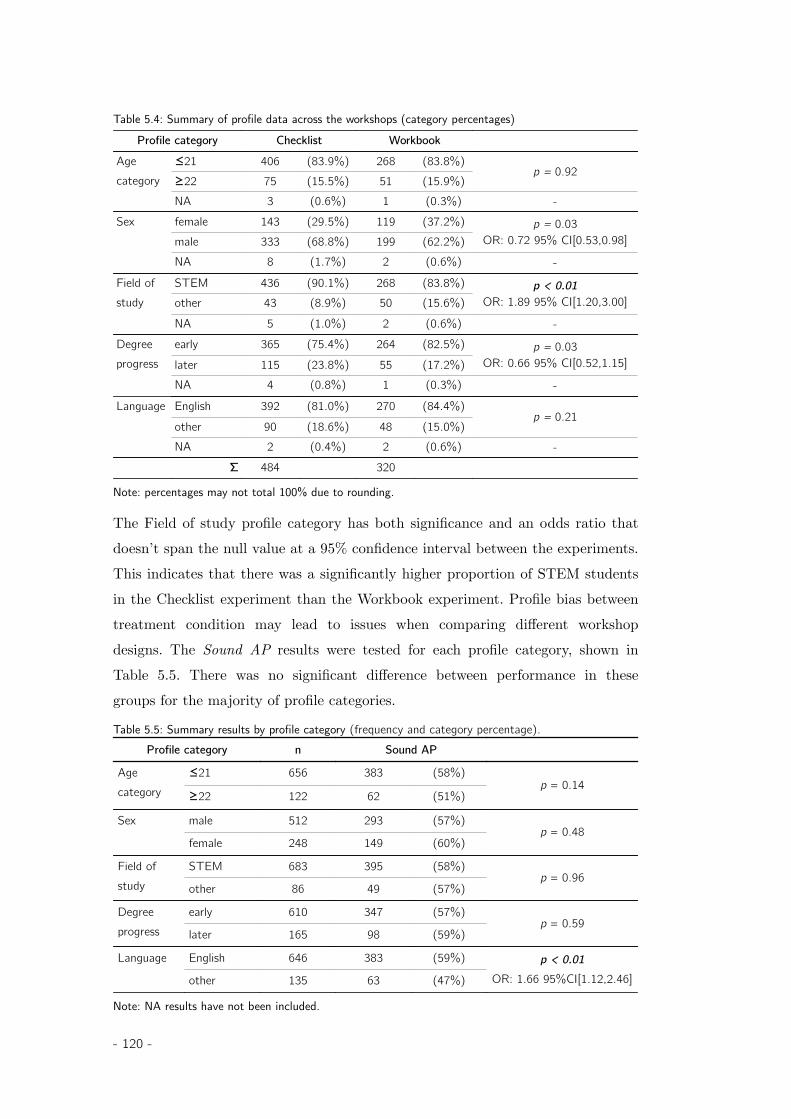
Table 5.4: Summary of profile data across the workshops (category percentages)Profile category Checklist Workbook
Age category
≤21 406 (83.9%) 268 (83.8%)p = 0.92
≥22 75 (15.5%) 51 (15.9%)NA 3 (0.6%) 1 (0.3%) -
Sex female 143 (29.5%) 119 (37.2%) p = 0.03OR: 0.72 95% CI[0.53,0.98]male 333 (68.8%) 199 (62.2%)
NA 8 (1.7%) 2 (0.6%) -Field of study
STEM 436 (90.1%) 268 (83.8%) p < 0.01OR: 1.89 95% CI[1.20,3.00]other 43 (8.9%) 50 (15.6%)
NA 5 (1.0%) 2 (0.6%) -Degreeprogress
early 365 (75.4%) 264 (82.5%) p = 0.03OR: 0.66 95% CI[0.52,1.15]later 115 (23.8%) 55 (17.2%)
NA 4 (0.8%) 1 (0.3%) -Language English 392 (81.0%) 270 (84.4%)
p = 0.21other 90 (18.6%) 48 (15.0%)NA 2 (0.4%) 2 (0.6%) -
Σ 484 320
Note: percentages may not total 100% due to rounding.
The Field of study profile category has both significance and an odds ratio thatdoesn’t span the null value at a 95% confidence interval between the experiments.This indicates that there was a significantly higher proportion of STEM studentsin the Checklist experiment than the Workbook experiment. Profile bias betweentreatment condition may lead to issues when comparing different workshopdesigns. The Sound AP results were tested for each profile category, shown inTable 5.5. There was no significant difference between performance in thesegroups for the majority of profile categories.
Table 5.5: Summary results by profile category (frequency and category percentage).Profile category n Sound AP
Agecategory
≤21 656 383 (58%)p = 0.14
≥22 122 62 (51%)
Sex male 512 293 (57%)p = 0.48
female 248 149 (60%)
Field of study
STEM 683 395 (58%)p = 0.96
other 86 49 (57%)
Degreeprogress
early 610 347 (57%)p = 0.59
later 165 98 (59%)
Language English 646 383 (59%) p < 0.01OR: 1.66 95%CI[1.12,2.46]other 135 63 (47%)
Note: NA results have not been included.
- 120 -

The only profile category that is an indicator of performance is the languagecategory. Participants who speak English as their first language performed signifi-cantly better (Sound AP: 59%, n=383) than speakers of other languages (SoundAP: 47%, n=63). This could lead to bias in the results if the proportion ofEnglish-speaking students is different between treatment groups. However, asshown in Table 5.4, there was no significant difference in chosen languagebetween the Checklist and Workbook experiments.
5.2 Results by experiment
In this section, I present results for the three experiments. In each experiment, Ireport the specific subset of workshops for each experiment, show the profile datafor each treatment condition, and report the level of graphical-writtenunderstanding for each treatment condition.
5.2.1 Scaffold experiment
Experiment 1: Scaffolded refinementDoes display of instructions and information in the T&P activity reduce SFfailure?
In the Scaffold experiment, the results for the three different assessment sheetswill be considered, extending the summary in §5.1.3. The Checklist experimentused the same instructions, with two assessment sheets: Emissions & Removals(ER) and Anthropogenic Emissions (AE). The result from the Workbookexperiment reported here was the base condition (PW-AA) for the Simulationand Dialogue experiments.
The treatment conditions are shown in Table 5.6, with instructions, assessmentsheet, year, course, and number of participants.
- 121 -
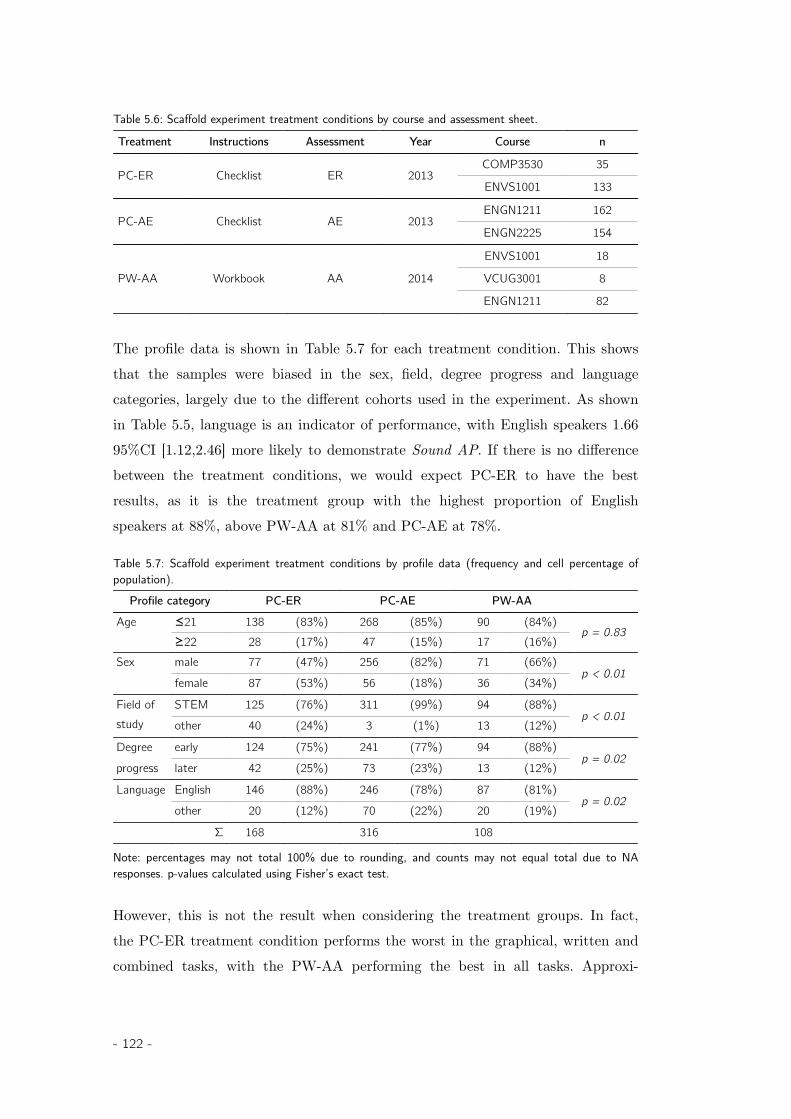
Table 5.6: Scaffold experiment treatment conditions by course and assessment sheet.
Treatment Instructions Assessment Year Course n
PC-ER Checklist ER 2013COMP3530 35
ENVS1001 133
PC-AE Checklist AE 2013ENGN1211 162
ENGN2225 154
PW-AA Workbook AA 2014
ENVS1001 18
VCUG3001 8
ENGN1211 82
The profile data is shown in Table 5.7 for each treatment condition. This showsthat the samples were biased in the sex, field, degree progress and languagecategories, largely due to the different cohorts used in the experiment. As shownin Table 5.5, language is an indicator of performance, with English speakers 1.6695%CI [1.12,2.46] more likely to demonstrate Sound AP. If there is no differencebetween the treatment conditions, we would expect PC-ER to have the bestresults, as it is the treatment group with the highest proportion of Englishspeakers at 88%, above PW-AA at 81% and PC-AE at 78%.
Table 5.7: Scaffold experiment treatment conditions by profile data (frequency and cell percentage ofpopulation).
Profile category PC-ER PC-AE PW-AAAge ≤21 138 (83%) 268 (85%) 90 (84%)
p = 0.83≥22 28 (17%) 47 (15%) 17 (16%)
Sex male 77 (47%) 256 (82%) 71 (66%)p < 0.01
female 87 (53%) 56 (18%) 36 (34%)
Field of study
STEM 125 (76%) 311 (99%) 94 (88%)p < 0.01
other 40 (24%) 3 (1%) 13 (12%)
Degree early 124 (75%) 241 (77%) 94 (88%)p = 0.02
progress later 42 (25%) 73 (23%) 13 (12%)
Language English 146 (88%) 246 (78%) 87 (81%)p = 0.02
other 20 (12%) 70 (22%) 20 (19%)
Σ 168 316 108
Note: percentages may not total 100% due to rounding, and counts may not equal total due to NAresponses. p-values calculated using Fisher’s exact test.
However, this is not the result when considering the treatment groups. In fact,the PC-ER treatment condition performs the worst in the graphical, written andcombined tasks, with the PW-AA performing the best in all tasks. Approxi-
- 122 -
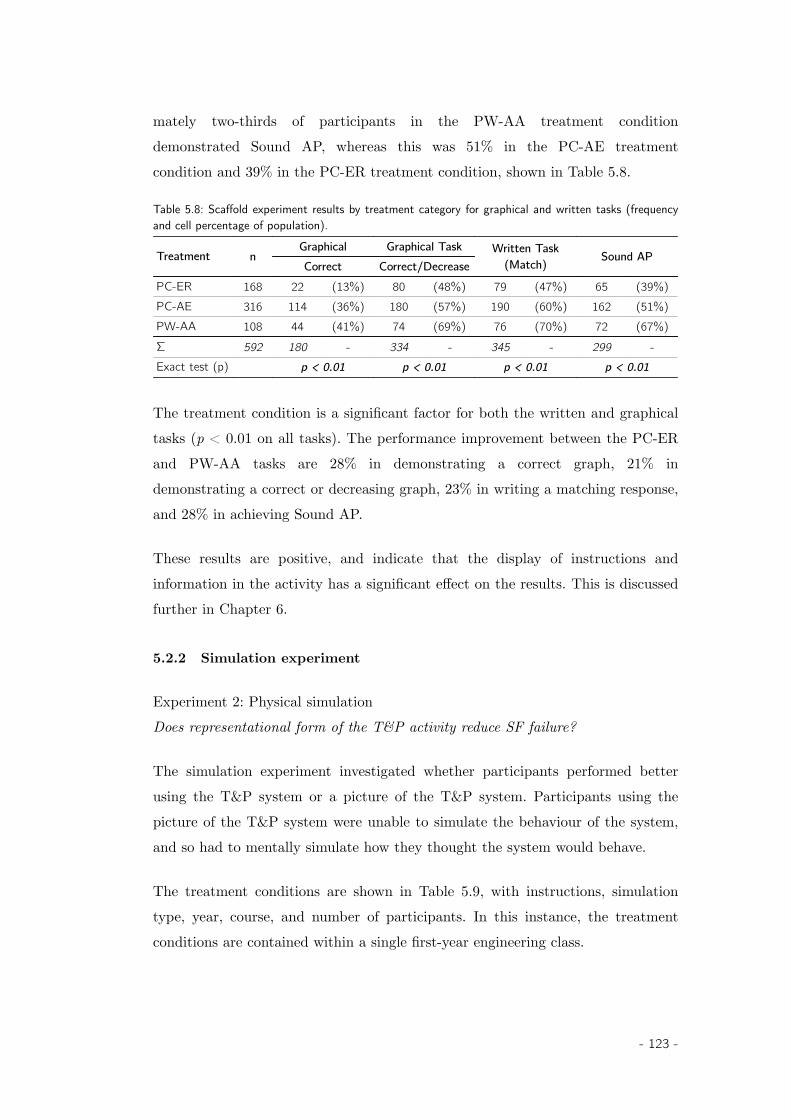
mately two-thirds of participants in the PW-AA treatment conditiondemonstrated Sound AP, whereas this was 51% in the PC-AE treatmentcondition and 39% in the PC-ER treatment condition, shown in Table 5.8.
Table 5.8: Scaffold experiment results by treatment category for graphical and written tasks (frequencyand cell percentage of population).
Treatment nGraphical Graphical Task Written Task
(Match) Sound APCorrect Correct/Decrease
PC-ER 168 22 (13%) 80 (48%) 79 (47%) 65 (39%)PC-AE 316 114 (36%) 180 (57%) 190 (60%) 162 (51%)PW-AA 108 44 (41%) 74 (69%) 76 (70%) 72 (67%)Σ 592 180 - 334 - 345 - 299 -Exact test (p) p < 0.01 p < 0.01 p < 0.01 p < 0.01
The treatment condition is a significant factor for both the written and graphicaltasks (p < 0.01 on all tasks). The performance improvement between the PC-ERand PW-AA tasks are 28% in demonstrating a correct graph, 21% indemonstrating a correct or decreasing graph, 23% in writing a matching response,and 28% in achieving Sound AP.
These results are positive, and indicate that the display of instructions andinformation in the activity has a significant effect on the results. This is discussedfurther in Chapter 6.
5.2.2 Simulation experiment
Experiment 2: Physical simulationDoes representational form of the T&P activity reduce SF failure?
The simulation experiment investigated whether participants performed betterusing the T&P system or a picture of the T&P system. Participants using thepicture of the T&P system were unable to simulate the behaviour of the system,and so had to mentally simulate how they thought the system would behave.
The treatment conditions are shown in Table 5.9, with instructions, simulationtype, year, course, and number of participants. In this instance, the treatmentconditions are contained within a single first-year engineering class.
- 123 -
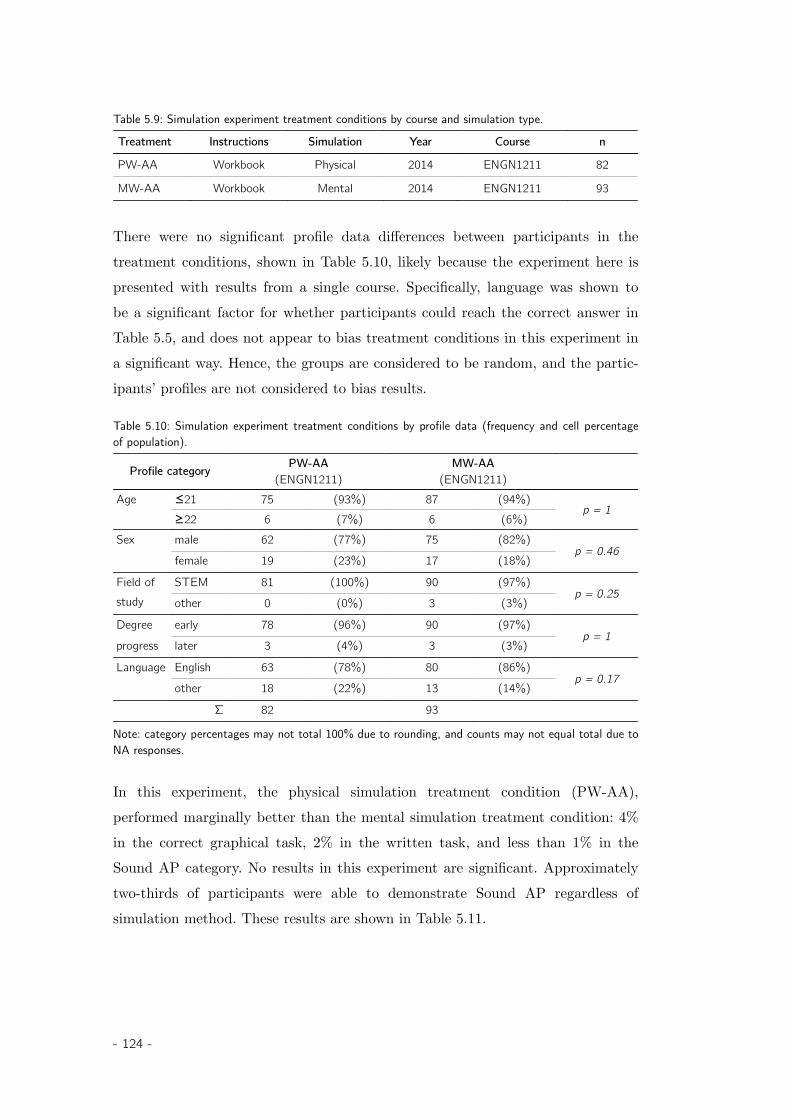
Table 5.9: Simulation experiment treatment conditions by course and simulation type.
Treatment Instructions Simulation Year Course n
PW-AA Workbook Physical 2014 ENGN1211 82
MW-AA Workbook Mental 2014 ENGN1211 93
There were no significant profile data differences between participants in thetreatment conditions, shown in Table 5.10, likely because the experiment here ispresented with results from a single course. Specifically, language was shown tobe a significant factor for whether participants could reach the correct answer inTable 5.5, and does not appear to bias treatment conditions in this experiment ina significant way. Hence, the groups are considered to be random, and the partic-ipants’ profiles are not considered to bias results.
Table 5.10: Simulation experiment treatment conditions by profile data (frequency and cell percentageof population).
Profile category PW-AA(ENGN1211)
MW-AA(ENGN1211)
Age ≤21 75 (93%) 87 (94%)p = 1
≥22 6 (7%) 6 (6%)Sex male 62 (77%) 75 (82%)
p = 0.46female 19 (23%) 17 (18%)
Field of study
STEM 81 (100%) 90 (97%)p = 0.25
other 0 (0%) 3 (3%)
Degree early 78 (96%) 90 (97%)p = 1
progress later 3 (4%) 3 (3%)
Language English 63 (78%) 80 (86%)p = 0.17
other 18 (22%) 13 (14%)
Σ 82 93
Note: category percentages may not total 100% due to rounding, and counts may not equal total due toNA responses.
In this experiment, the physical simulation treatment condition (PW-AA),performed marginally better than the mental simulation treatment condition: 4%in the correct graphical task, 2% in the written task, and less than 1% in theSound AP category. No results in this experiment are significant. Approximatelytwo-thirds of participants were able to demonstrate Sound AP regardless ofsimulation method. These results are shown in Table 5.11.
- 124 -
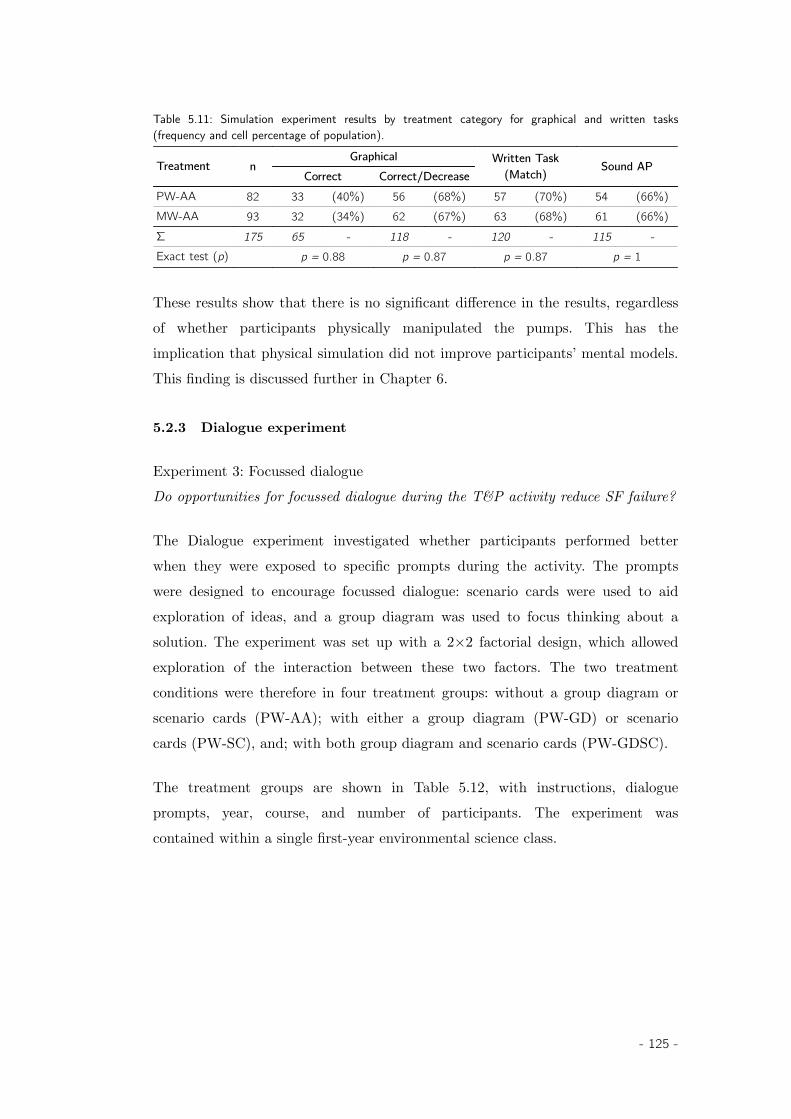
Table 5.11: Simulation experiment results by treatment category for graphical and written tasks(frequency and cell percentage of population).
Treatment nGraphical Written Task
(Match) Sound APCorrect Correct/Decrease
PW-AA 82 33 (40%) 56 (68%) 57 (70%) 54 (66%)MW-AA 93 32 (34%) 62 (67%) 63 (68%) 61 (66%)Σ 175 65 - 118 - 120 - 115 -Exact test (p) p = 0.88 p = 0.87 p = 0.87 p = 1
These results show that there is no significant difference in the results, regardlessof whether participants physically manipulated the pumps. This has theimplication that physical simulation did not improve participants’ mental models.This finding is discussed further in Chapter 6.
5.2.3 Dialogue experiment
Experiment 3: Focussed dialogueDo opportunities for focussed dialogue during the T&P activity reduce SF failure?
The Dialogue experiment investigated whether participants performed betterwhen they were exposed to specific prompts during the activity. The promptswere designed to encourage focussed dialogue: scenario cards were used to aidexploration of ideas, and a group diagram was used to focus thinking about asolution. The experiment was set up with a 2×2 factorial design, which allowedexploration of the interaction between these two factors. The two treatmentconditions were therefore in four treatment groups: without a group diagram orscenario cards (PW-AA); with either a group diagram (PW-GD) or scenariocards (PW-SC), and; with both group diagram and scenario cards (PW-GDSC).
The treatment groups are shown in Table 5.12, with instructions, dialogueprompts, year, course, and number of participants. The experiment wascontained within a single first-year environmental science class.
- 125 -
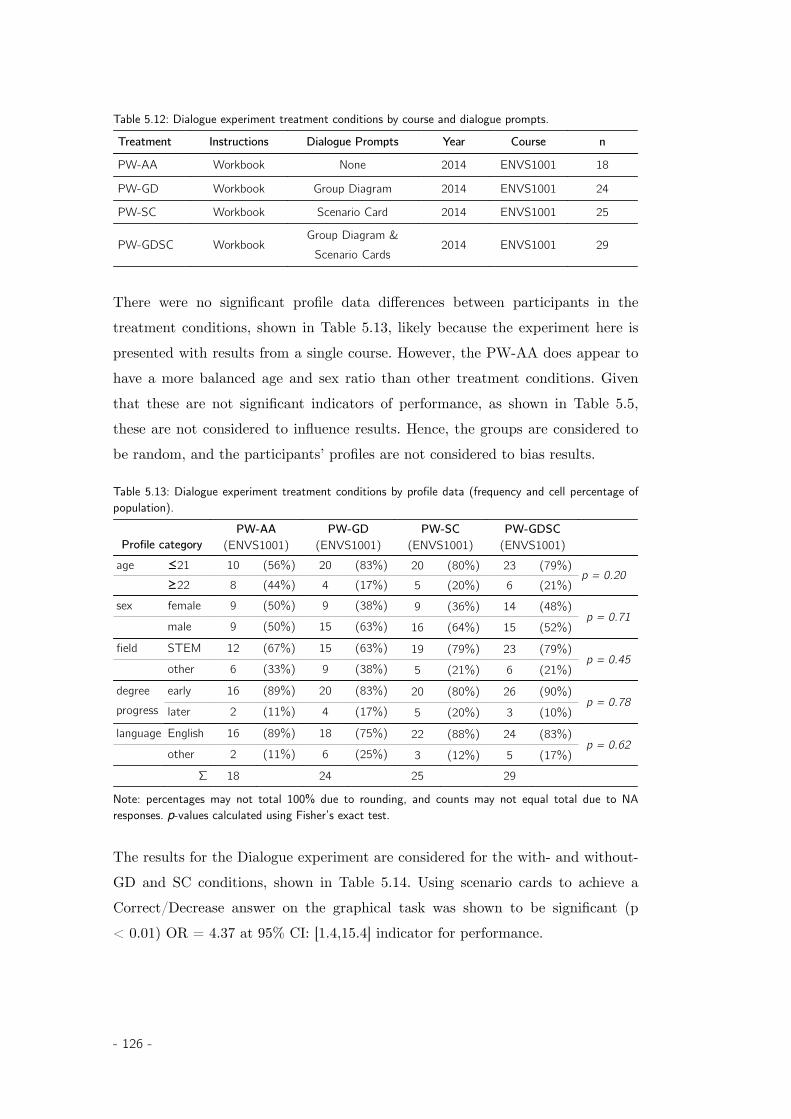
Table 5.12: Dialogue experiment treatment conditions by course and dialogue prompts.
Treatment Instructions Dialogue Prompts Year Course n
PW-AA Workbook None 2014 ENVS1001 18
PW-GD Workbook Group Diagram 2014 ENVS1001 24
PW-SC Workbook Scenario Card 2014 ENVS1001 25
PW-GDSC WorkbookGroup Diagram &
Scenario Cards2014 ENVS1001 29
There were no significant profile data differences between participants in thetreatment conditions, shown in Table 5.13, likely because the experiment here ispresented with results from a single course. However, the PW-AA does appear tohave a more balanced age and sex ratio than other treatment conditions. Giventhat these are not significant indicators of performance, as shown in Table 5.5,these are not considered to influence results. Hence, the groups are considered tobe random, and the participants’ profiles are not considered to bias results.
Table 5.13: Dialogue experiment treatment conditions by profile data (frequency and cell percentage ofpopulation).
Profile categoryPW-AA
(ENVS1001)PW-GD
(ENVS1001)PW-SC
(ENVS1001)PW-GDSC
(ENVS1001)age ≤21 10 (56%) 20 (83%) 20 (80%) 23 (79%)
p = 0.20≥22 8 (44%) 4 (17%) 5 (20%) 6 (21%)
sex female 9 (50%) 9 (38%) 9 (36%) 14 (48%)p = 0.71
male 9 (50%) 15 (63%) 16 (64%) 15 (52%)field STEM 12 (67%) 15 (63%) 19 (79%) 23 (79%)
p = 0.45other 6 (33%) 9 (38%) 5 (21%) 6 (21%)
degreeprogress
early 16 (89%) 20 (83%) 20 (80%) 26 (90%)p = 0.78
later 2 (11%) 4 (17%) 5 (20%) 3 (10%)language English 16 (89%) 18 (75%) 22 (88%) 24 (83%)
p = 0.62other 2 (11%) 6 (25%) 3 (12%) 5 (17%)
Σ 18 24 25 29
Note: percentages may not total 100% due to rounding, and counts may not equal total due to NAresponses. p-values calculated using Fisher’s exact test.
The results for the Dialogue experiment are considered for the with- and without-GD and SC conditions, shown in Table 5.14. Using scenario cards to achieve aCorrect/Decrease answer on the graphical task was shown to be significant (p< 0.01) OR = 4.37 at 95% CI: [1.4,15.4] indicator for performance.
- 126 -
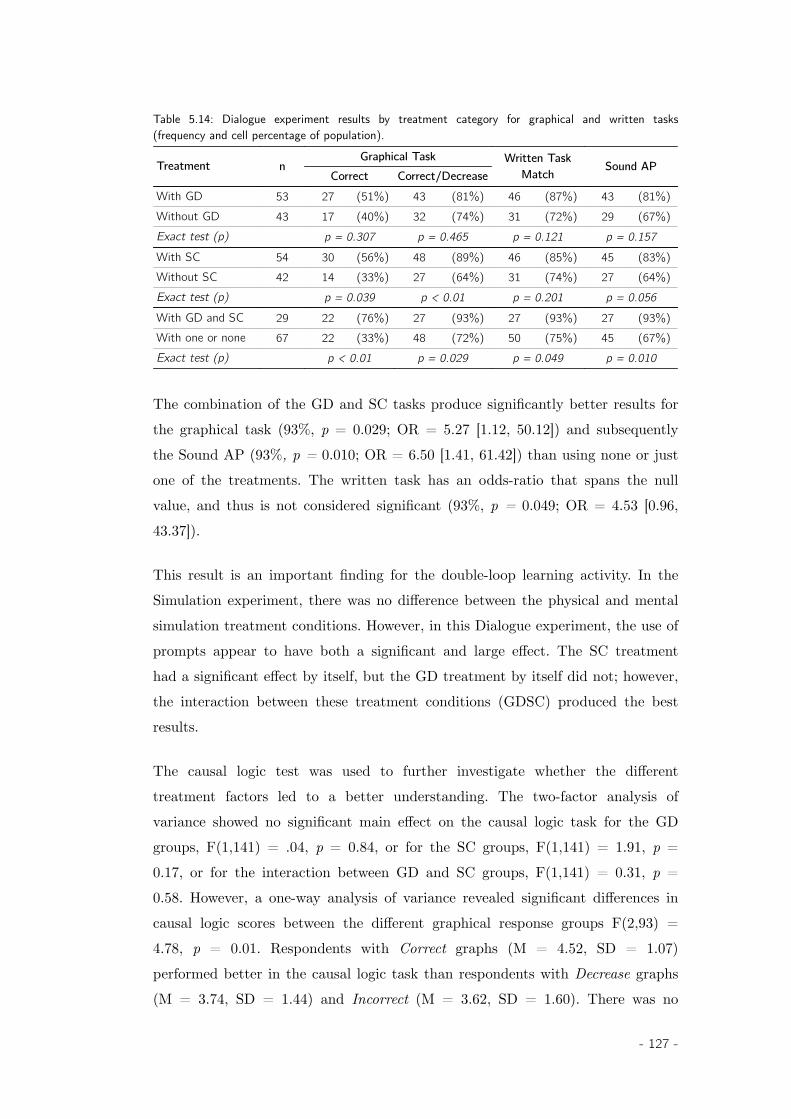
Table 5.14: Dialogue experiment results by treatment category for graphical and written tasks(frequency and cell percentage of population).
Treatment nGraphical Task Written Task
Match Sound APCorrect Correct/Decrease
With GD 53 27 (51%) 43 (81%) 46 (87%) 43 (81%)Without GD 43 17 (40%) 32 (74%) 31 (72%) 29 (67%)Exact test (p) p = 0.307 p = 0.465 p = 0.121 p = 0.157With SC 54 30 (56%) 48 (89%) 46 (85%) 45 (83%)Without SC 42 14 (33%) 27 (64%) 31 (74%) 27 (64%)Exact test (p) p = 0.039 p < 0.01 p = 0.201 p = 0.056With GD and SC 29 22 (76%) 27 (93%) 27 (93%) 27 (93%)With one or none 67 22 (33%) 48 (72%) 50 (75%) 45 (67%)Exact test (p) p < 0.01 p = 0.029 p = 0.049 p = 0.010
The combination of the GD and SC tasks produce significantly better results forthe graphical task (93%, p = 0.029; OR = 5.27 [1.12, 50.12]) and subsequentlythe Sound AP (93%, p = 0.010; OR = 6.50 [1.41, 61.42]) than using none or justone of the treatments. The written task has an odds-ratio that spans the nullvalue, and thus is not considered significant (93%, p = 0.049; OR = 4.53 [0.96,43.37]).
This result is an important finding for the double-loop learning activity. In theSimulation experiment, there was no difference between the physical and mentalsimulation treatment conditions. However, in this Dialogue experiment, the use ofprompts appear to have both a significant and large effect. The SC treatmenthad a significant effect by itself, but the GD treatment by itself did not; however,the interaction between these treatment conditions (GDSC) produced the bestresults.
The causal logic test was used to further investigate whether the differenttreatment factors led to a better understanding. The two-factor analysis ofvariance showed no significant main effect on the causal logic task for the GDgroups, F(1,141) = .04, p = 0.84, or for the SC groups, F(1,141) = 1.91, p =0.17, or for the interaction between GD and SC groups, F(1,141) = 0.31, p =0.58. However, a one-way analysis of variance revealed significant differences incausal logic scores between the different graphical response groups F(2,93) =4.78, p = 0.01. Respondents with Correct graphs (M = 4.52, SD = 1.07)performed better in the causal logic task than respondents with Decrease graphs(M = 3.74, SD = 1.44) and Incorrect (M = 3.62, SD = 1.60). There was no
- 127 -
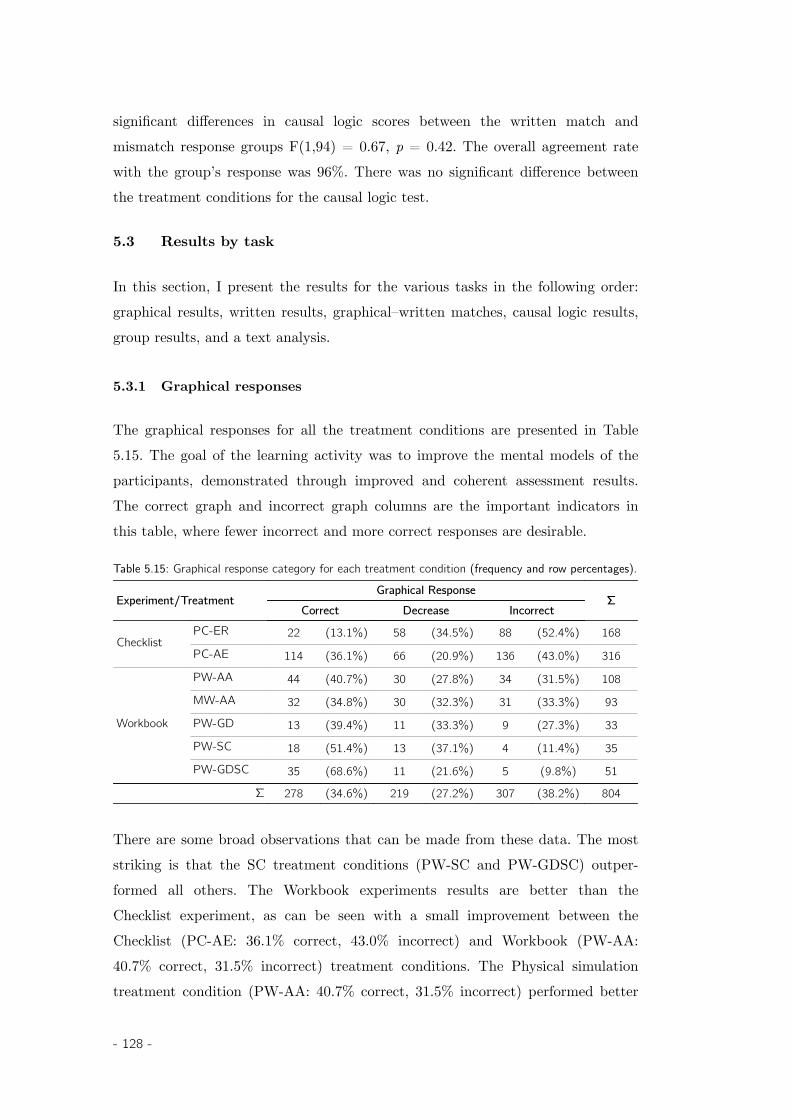
significant differences in causal logic scores between the written match andmismatch response groups F(1,94) = 0.67, p = 0.42. The overall agreement ratewith the group’s response was 96%. There was no significant difference betweenthe treatment conditions for the causal logic test.
5.3 Results by task
In this section, I present the results for the various tasks in the following order:graphical results, written results, graphical–written matches, causal logic results,group results, and a text analysis.
5.3.1 Graphical responses
The graphical responses for all the treatment conditions are presented in Table5.15. The goal of the learning activity was to improve the mental models of theparticipants, demonstrated through improved and coherent assessment results.The correct graph and incorrect graph columns are the important indicators inthis table, where fewer incorrect and more correct responses are desirable.
Table 5.15: Graphical response category for each treatment condition (frequency and row percentages).
Experiment/TreatmentGraphical Response
ΣCorrect Decrease Incorrect
ChecklistPC-ER 22 (13.1%) 58 (34.5%) 88 (52.4%) 168
PC-AE 114 (36.1%) 66 (20.9%) 136 (43.0%) 316
Workbook
PW-AA 44 (40.7%) 30 (27.8%) 34 (31.5%) 108MW-AA 32 (34.8%) 30 (32.3%) 31 (33.3%) 93PW-GD 13 (39.4%) 11 (33.3%) 9 (27.3%) 33PW-SC 18 (51.4%) 13 (37.1%) 4 (11.4%) 35PW-GDSC 35 (68.6%) 11 (21.6%) 5 (9.8%) 51
Σ 278 (34.6%) 219 (27.2%) 307 (38.2%) 804
There are some broad observations that can be made from these data. The moststriking is that the SC treatment conditions (PW-SC and PW-GDSC) outper-formed all others. The Workbook experiments results are better than theChecklist experiment, as can be seen with a small improvement between theChecklist (PC-AE: 36.1% correct, 43.0% incorrect) and Workbook (PW-AA:40.7% correct, 31.5% incorrect) treatment conditions. The Physical simulationtreatment condition (PW-AA: 40.7% correct, 31.5% incorrect) performed better
- 128 -
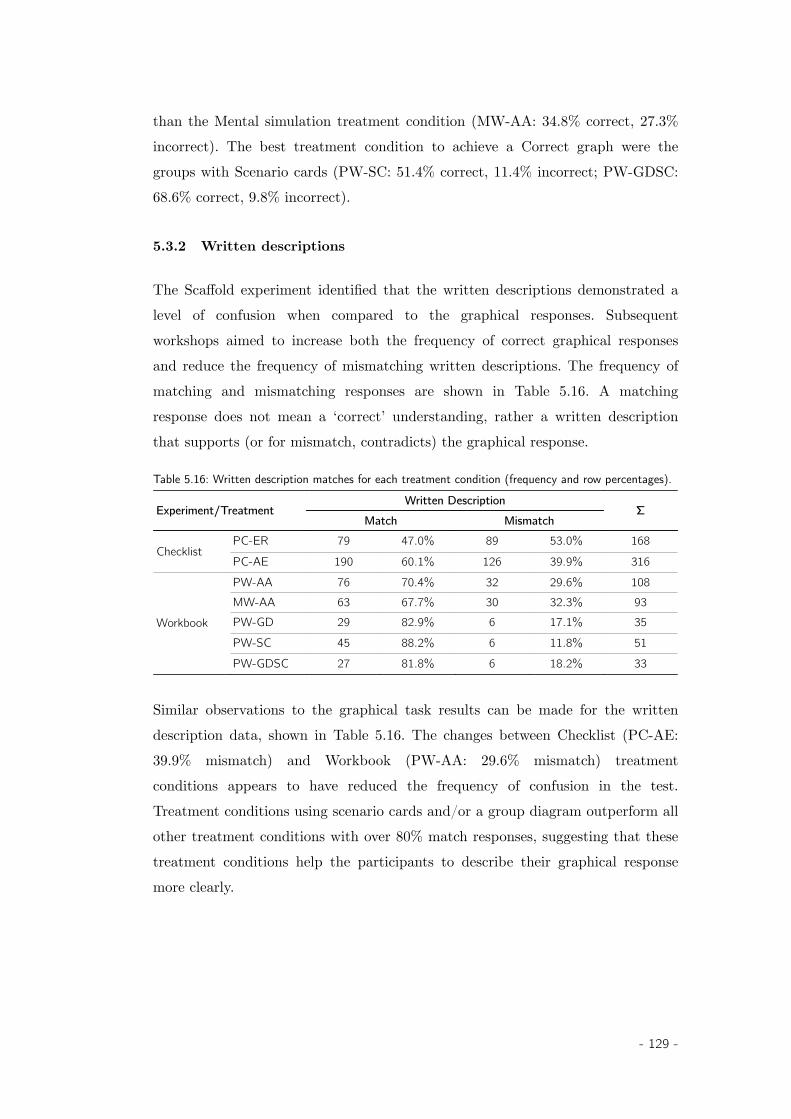
than the Mental simulation treatment condition (MW-AA: 34.8% correct, 27.3%incorrect). The best treatment condition to achieve a Correct graph were thegroups with Scenario cards (PW-SC: 51.4% correct, 11.4% incorrect; PW-GDSC:68.6% correct, 9.8% incorrect).
5.3.2 Written descriptions
The Scaffold experiment identified that the written descriptions demonstrated alevel of confusion when compared to the graphical responses. Subsequentworkshops aimed to increase both the frequency of correct graphical responsesand reduce the frequency of mismatching written descriptions. The frequency ofmatching and mismatching responses are shown in Table 5.16. A matchingresponse does not mean a ‘correct’ understanding, rather a written descriptionthat supports (or for mismatch, contradicts) the graphical response.
Table 5.16: Written description matches for each treatment condition (frequency and row percentages).
Experiment/TreatmentWritten Description
ΣMatch Mismatch
ChecklistPC-ER 79 47.0% 89 53.0% 168PC-AE 190 60.1% 126 39.9% 316
Workbook
PW-AA 76 70.4% 32 29.6% 108MW-AA 63 67.7% 30 32.3% 93PW-GD 29 82.9% 6 17.1% 35PW-SC 45 88.2% 6 11.8% 51PW-GDSC 27 81.8% 6 18.2% 33
Similar observations to the graphical task results can be made for the writtendescription data, shown in Table 5.16. The changes between Checklist (PC-AE:39.9% mismatch) and Workbook (PW-AA: 29.6% mismatch) treatmentconditions appears to have reduced the frequency of confusion in the test.Treatment conditions using scenario cards and/or a group diagram outperform allother treatment conditions with over 80% match responses, suggesting that thesetreatment conditions help the participants to describe their graphical responsemore clearly.
- 129 -
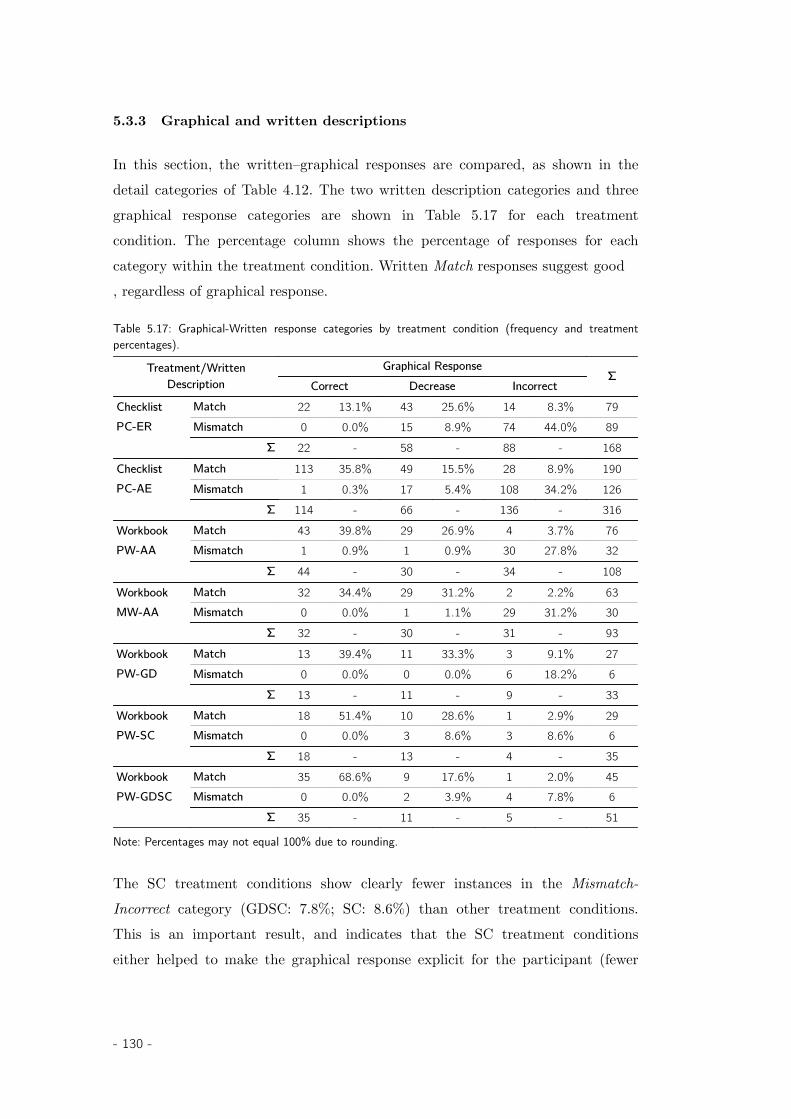
5.3.3 Graphical and written descriptions
In this section, the written–graphical responses are compared, as shown in thedetail categories of Table 4.12. The two written description categories and threegraphical response categories are shown in Table 5.17 for each treatmentcondition. The percentage column shows the percentage of responses for eachcategory within the treatment condition. Written Match responses suggest good , regardless of graphical response.
Table 5.17: Graphical-Written response categories by treatment condition (frequency and treatmentpercentages).
Treatment/WrittenDescription
Graphical ResponseΣ
Correct Decrease IncorrectChecklistPC-ER
Match 22 13.1% 43 25.6% 14 8.3% 79Mismatch 0 0.0% 15 8.9% 74 44.0% 89
Σ 22 - 58 - 88 - 168ChecklistPC-AE
Match 113 35.8% 49 15.5% 28 8.9% 190Mismatch 1 0.3% 17 5.4% 108 34.2% 126
Σ 114 - 66 - 136 - 316WorkbookPW-AA
Match 43 39.8% 29 26.9% 4 3.7% 76Mismatch 1 0.9% 1 0.9% 30 27.8% 32
Σ 44 - 30 - 34 - 108WorkbookMW-AA
Match 32 34.4% 29 31.2% 2 2.2% 63Mismatch 0 0.0% 1 1.1% 29 31.2% 30
Σ 32 - 30 - 31 - 93WorkbookPW-GD
Match 13 39.4% 11 33.3% 3 9.1% 27Mismatch 0 0.0% 0 0.0% 6 18.2% 6
Σ 13 - 11 - 9 - 33WorkbookPW-SC
Match 18 51.4% 10 28.6% 1 2.9% 29Mismatch 0 0.0% 3 8.6% 3 8.6% 6
Σ 18 - 13 - 4 - 35WorkbookPW-GDSC
Match 35 68.6% 9 17.6% 1 2.0% 45Mismatch 0 0.0% 2 3.9% 4 7.8% 6
Σ 35 - 11 - 5 - 51
Note: Percentages may not equal 100% due to rounding.
The SC treatment conditions show clearly fewer instances in the Mismatch-Incorrect category (GDSC: 7.8%; SC: 8.6%) than other treatment conditions.This is an important result, and indicates that the SC treatment conditionseither helped to make the graphical response explicit for the participant (fewer
- 130 -
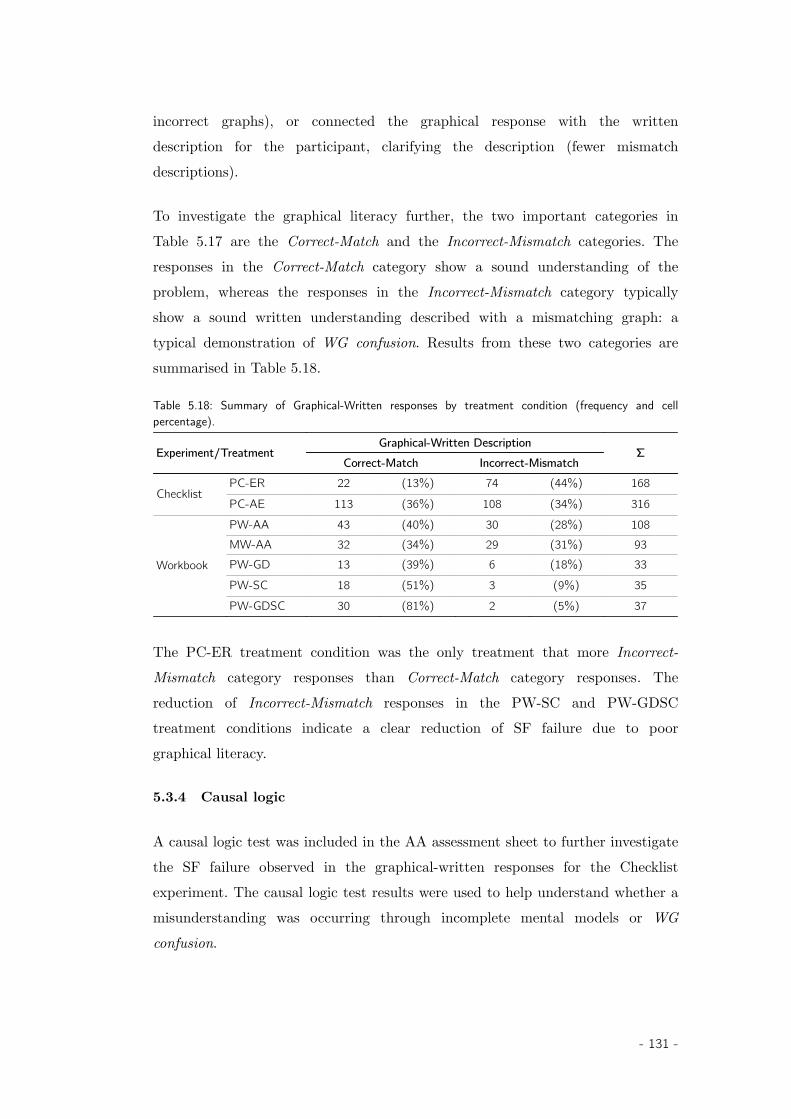
incorrect graphs), or connected the graphical response with the writtendescription for the participant, clarifying the description (fewer mismatchdescriptions).
To investigate the graphical literacy further, the two important categories inTable 5.17 are the Correct-Match and the Incorrect-Mismatch categories. Theresponses in the Correct-Match category show a sound understanding of theproblem, whereas the responses in the Incorrect-Mismatch category typicallyshow a sound written understanding described with a mismatching graph: atypical demonstration of WG confusion. Results from these two categories aresummarised in Table 5.18.
Table 5.18: Summary of Graphical-Written responses by treatment condition (frequency and cellpercentage).
Experiment/TreatmentGraphical-Written Description
ΣCorrect-Match Incorrect-Mismatch
ChecklistPC-ER 22 (13%) 74 (44%) 168PC-AE 113 (36%) 108 (34%) 316
Workbook
PW-AA 43 (40%) 30 (28%) 108MW-AA 32 (34%) 29 (31%) 93PW-GD 13 (39%) 6 (18%) 33PW-SC 18 (51%) 3 (9%) 35PW-GDSC 30 (81%) 2 (5%) 37
The PC-ER treatment condition was the only treatment that more Incorrect-Mismatch category responses than Correct-Match category responses. Thereduction of Incorrect-Mismatch responses in the PW-SC and PW-GDSCtreatment conditions indicate a clear reduction of SF failure due to poorgraphical literacy.
5.3.4 Causal logic
A causal logic test was included in the AA assessment sheet to further investigatethe SF failure observed in the graphical-written responses for the Checklistexperiment. The causal logic test results were used to help understand whether amisunderstanding was occurring through incomplete mental models or WGconfusion.
- 131 -
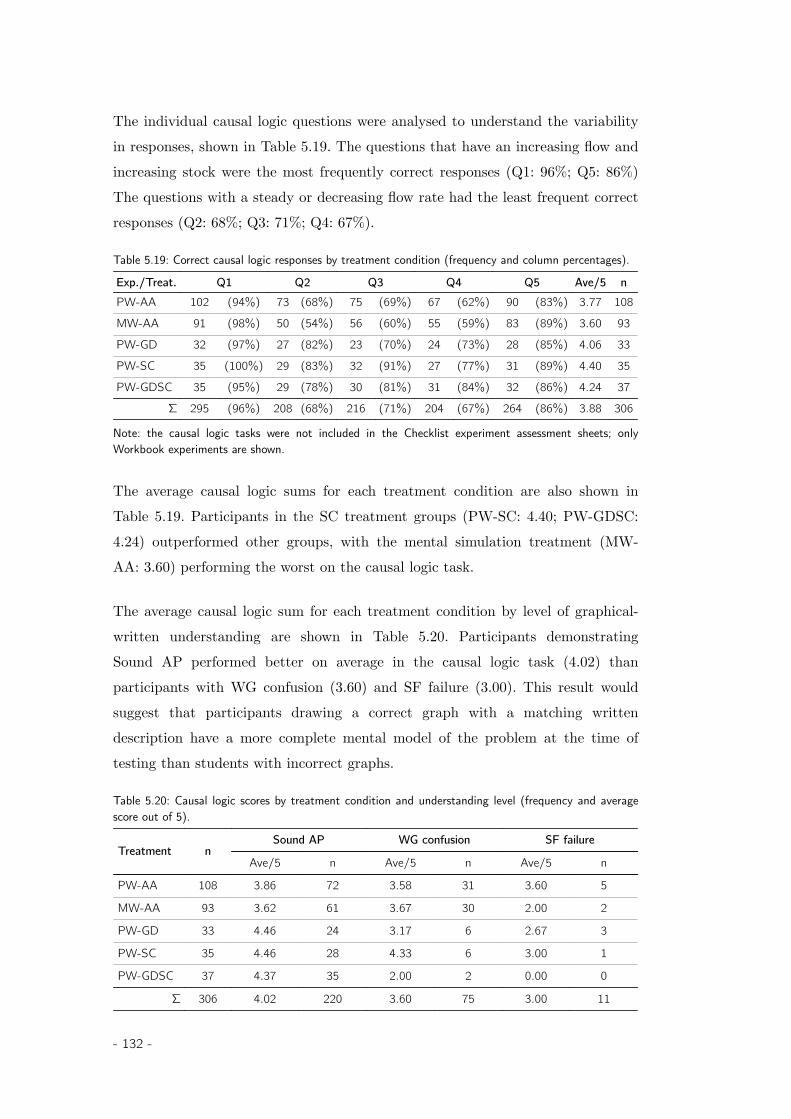
The individual causal logic questions were analysed to understand the variabilityin responses, shown in Table 5.19. The questions that have an increasing flow andincreasing stock were the most frequently correct responses (Q1: 96%; Q5: 86%)The questions with a steady or decreasing flow rate had the least frequent correctresponses (Q2: 68%; Q3: 71%; Q4: 67%).
Table 5.19: Correct causal logic responses by treatment condition (frequency and column percentages).
Exp./Treat. Q1 Q2 Q3 Q4 Q5 Ave/5 nPW-AA 102 (94%) 73 (68%) 75 (69%) 67 (62%) 90 (83%) 3.77 108
MW-AA 91 (98%) 50 (54%) 56 (60%) 55 (59%) 83 (89%) 3.60 93
PW-GD 32 (97%) 27 (82%) 23 (70%) 24 (73%) 28 (85%) 4.06 33
PW-SC 35 (100%) 29 (83%) 32 (91%) 27 (77%) 31 (89%) 4.40 35
PW-GDSC 35 (95%) 29 (78%) 30 (81%) 31 (84%) 32 (86%) 4.24 37
Σ 295 (96%) 208 (68%) 216 (71%) 204 (67%) 264 (86%) 3.88 306
Note: the causal logic tasks were not included in the Checklist experiment assessment sheets; onlyWorkbook experiments are shown.
The average causal logic sums for each treatment condition are also shown inTable 5.19. Participants in the SC treatment groups (PW-SC: 4.40; PW-GDSC:4.24) outperformed other groups, with the mental simulation treatment (MW-AA: 3.60) performing the worst on the causal logic task.
The average causal logic sum for each treatment condition by level of graphical-written understanding are shown in Table 5.20. Participants demonstratingSound AP performed better on average in the causal logic task (4.02) thanparticipants with WG confusion (3.60) and SF failure (3.00). This result wouldsuggest that participants drawing a correct graph with a matching writtendescription have a more complete mental model of the problem at the time oftesting than students with incorrect graphs.
Table 5.20: Causal logic scores by treatment condition and understanding level (frequency and averagescore out of 5).
Treatment nSound AP WG confusion SF failure
Ave/5 n Ave/5 n Ave/5 n
PW-AA 108 3.86 72 3.58 31 3.60 5
MW-AA 93 3.62 61 3.67 30 2.00 2
PW-GD 33 4.46 24 3.17 6 2.67 3
PW-SC 35 4.46 28 4.33 6 3.00 1
PW-GDSC 37 4.37 35 2.00 2 0.00 0
Σ 306 4.02 220 3.60 75 3.00 11
- 132 -
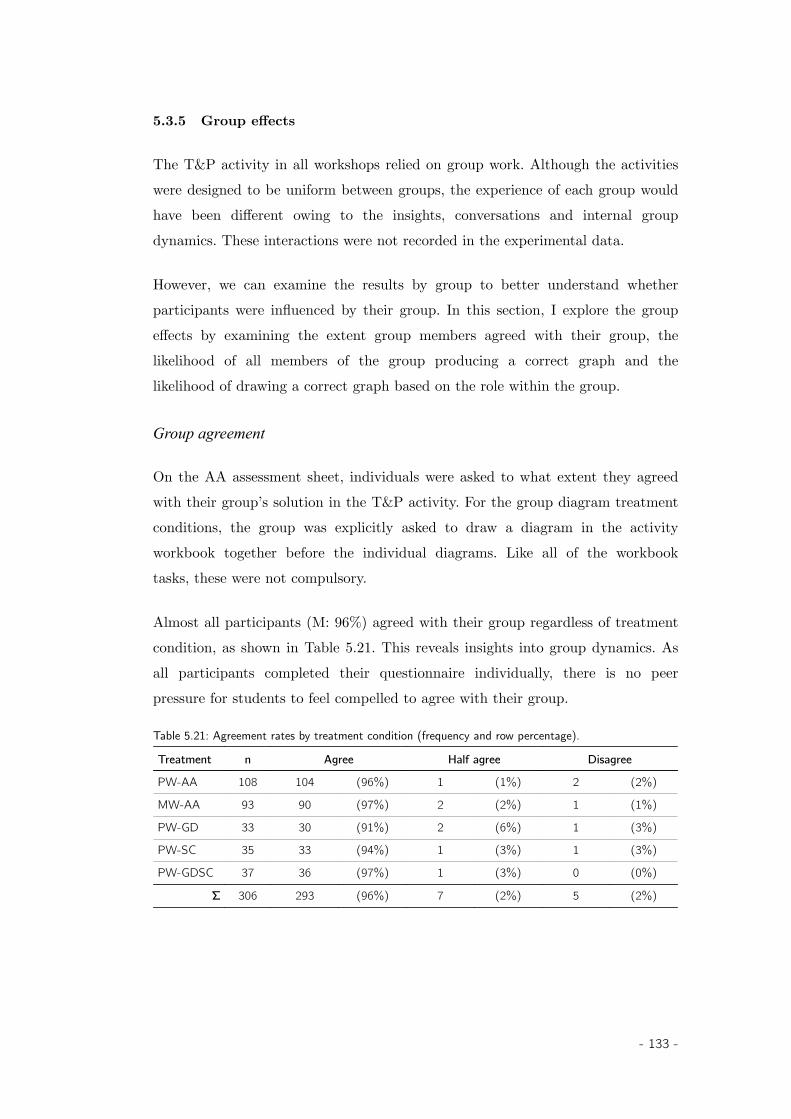
5.3.5 Group effects
The T&P activity in all workshops relied on group work. Although the activitieswere designed to be uniform between groups, the experience of each group wouldhave been different owing to the insights, conversations and internal groupdynamics. These interactions were not recorded in the experimental data.
However, we can examine the results by group to better understand whetherparticipants were influenced by their group. In this section, I explore the groupeffects by examining the extent group members agreed with their group, thelikelihood of all members of the group producing a correct graph and thelikelihood of drawing a correct graph based on the role within the group.
Group agreement
On the AA assessment sheet, individuals were asked to what extent they agreedwith their group’s solution in the T&P activity. For the group diagram treatmentconditions, the group was explicitly asked to draw a diagram in the activityworkbook together before the individual diagrams. Like all of the workbooktasks, these were not compulsory.
Almost all participants (M: 96%) agreed with their group regardless of treatmentcondition, as shown in Table 5.21. This reveals insights into group dynamics. Asall participants completed their questionnaire individually, there is no peerpressure for students to feel compelled to agree with their group.
Table 5.21: Agreement rates by treatment condition (frequency and row percentage).
Treatment n Agree Half agree Disagree
PW-AA 108 104 (96%) 1 (1%) 2 (2%)
MW-AA 93 90 (97%) 2 (2%) 1 (1%)
PW-GD 33 30 (91%) 2 (6%) 1 (3%)
PW-SC 35 33 (94%) 1 (3%) 1 (3%)
PW-GDSC 37 36 (97%) 1 (3%) 0 (0%)
Σ 306 293 (96%) 7 (2%) 5 (2%)
- 133 -
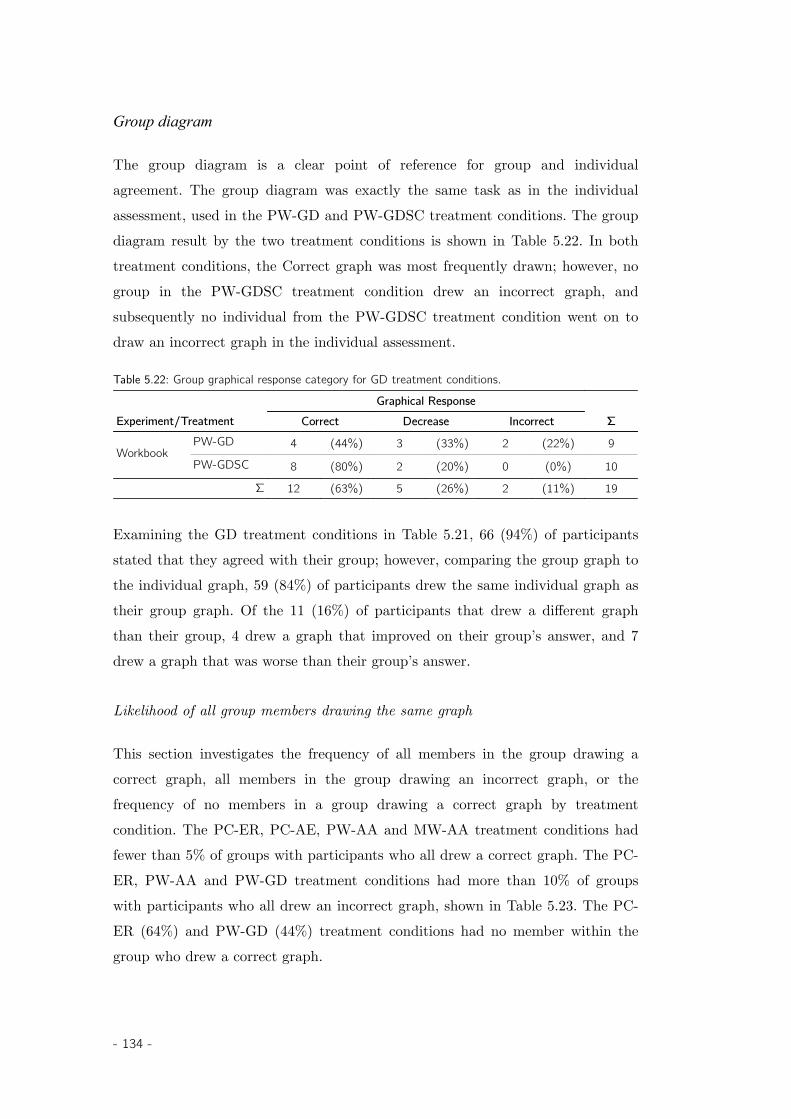
Group diagram
The group diagram is a clear point of reference for group and individualagreement. The group diagram was exactly the same task as in the individualassessment, used in the PW-GD and PW-GDSC treatment conditions. The groupdiagram result by the two treatment conditions is shown in Table 5.22. In bothtreatment conditions, the Correct graph was most frequently drawn; however, nogroup in the PW-GDSC treatment condition drew an incorrect graph, andsubsequently no individual from the PW-GDSC treatment condition went on todraw an incorrect graph in the individual assessment.
Table 5.22: Group graphical response category for GD treatment conditions.
Graphical ResponseExperiment/Treatment Correct Decrease Incorrect Σ
WorkbookPW-GD 4 (44%) 3 (33%) 2 (22%) 9
PW-GDSC 8 (80%) 2 (20%) 0 (0%) 10
Σ 12 (63%) 5 (26%) 2 (11%) 19
Examining the GD treatment conditions in Table 5.21, 66 (94%) of participantsstated that they agreed with their group; however, comparing the group graph tothe individual graph, 59 (84%) of participants drew the same individual graph astheir group graph. Of the 11 (16%) of participants that drew a different graphthan their group, 4 drew a graph that improved on their group’s answer, and 7drew a graph that was worse than their group’s answer.
Likelihood of all group members drawing the same graph
This section investigates the frequency of all members in the group drawing acorrect graph, all members in the group drawing an incorrect graph, or thefrequency of no members in a group drawing a correct graph by treatmentcondition. The PC-ER, PC-AE, PW-AA and MW-AA treatment conditions hadfewer than 5% of groups with participants who all drew a correct graph. The PC-ER, PW-AA and PW-GD treatment conditions had more than 10% of groupswith participants who all drew an incorrect graph, shown in Table 5.23. The PC-ER (64%) and PW-GD (44%) treatment conditions had no member within thegroup who drew a correct graph.
- 134 -
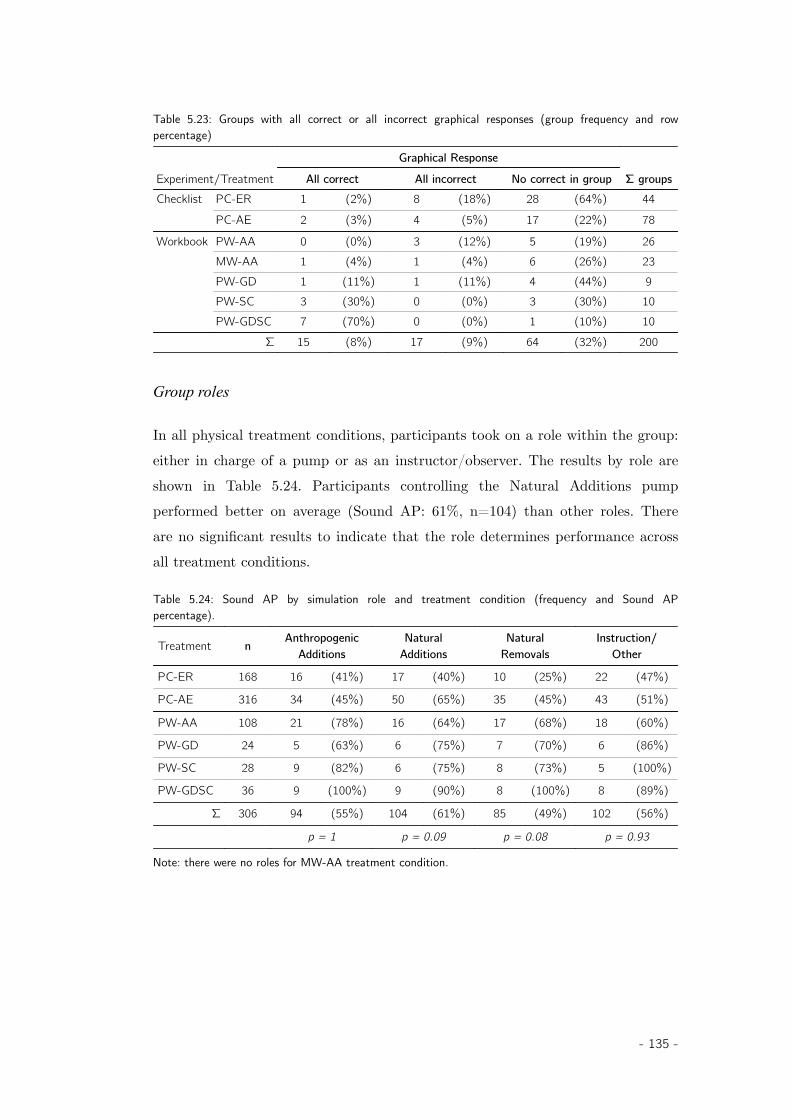
Table 5.23: Groups with all correct or all incorrect graphical responses (group frequency and rowpercentage)
Experiment/Treatment
Graphical Response
Σ groupsAll correct All incorrect No correct in groupChecklist PC-ER 1 (2%) 8 (18%) 28 (64%) 44
PC-AE 2 (3%) 4 (5%) 17 (22%) 78
Workbook PW-AA 0 (0%) 3 (12%) 5 (19%) 26MW-AA 1 (4%) 1 (4%) 6 (26%) 23PW-GD 1 (11%) 1 (11%) 4 (44%) 9PW-SC 3 (30%) 0 (0%) 3 (30%) 10PW-GDSC 7 (70%) 0 (0%) 1 (10%) 10
Σ 15 (8%) 17 (9%) 64 (32%) 200
Group roles
In all physical treatment conditions, participants took on a role within the group:either in charge of a pump or as an instructor/observer. The results by role areshown in Table 5.24. Participants controlling the Natural Additions pumpperformed better on average (Sound AP: 61%, n=104) than other roles. Thereare no significant results to indicate that the role determines performance acrossall treatment conditions.
Table 5.24: Sound AP by simulation role and treatment condition (frequency and Sound APpercentage).
Treatment n AnthropogenicAdditions
NaturalAdditions
NaturalRemovals
Instruction/Other
PC-ER 168 16 (41%) 17 (40%) 10 (25%) 22 (47%)
PC-AE 316 34 (45%) 50 (65%) 35 (45%) 43 (51%)
PW-AA 108 21 (78%) 16 (64%) 17 (68%) 18 (60%)
PW-GD 24 5 (63%) 6 (75%) 7 (70%) 6 (86%)
PW-SC 28 9 (82%) 6 (75%) 8 (73%) 5 (100%)
PW-GDSC 36 9 (100%) 9 (90%) 8 (100%) 8 (89%)
Σ 306 94 (55%) 104 (61%) 85 (49%) 102 (56%)
p = 1 p = 0.09 p = 0.08 p = 0.93
Note: there were no roles for MW-AA treatment condition.
- 135 -
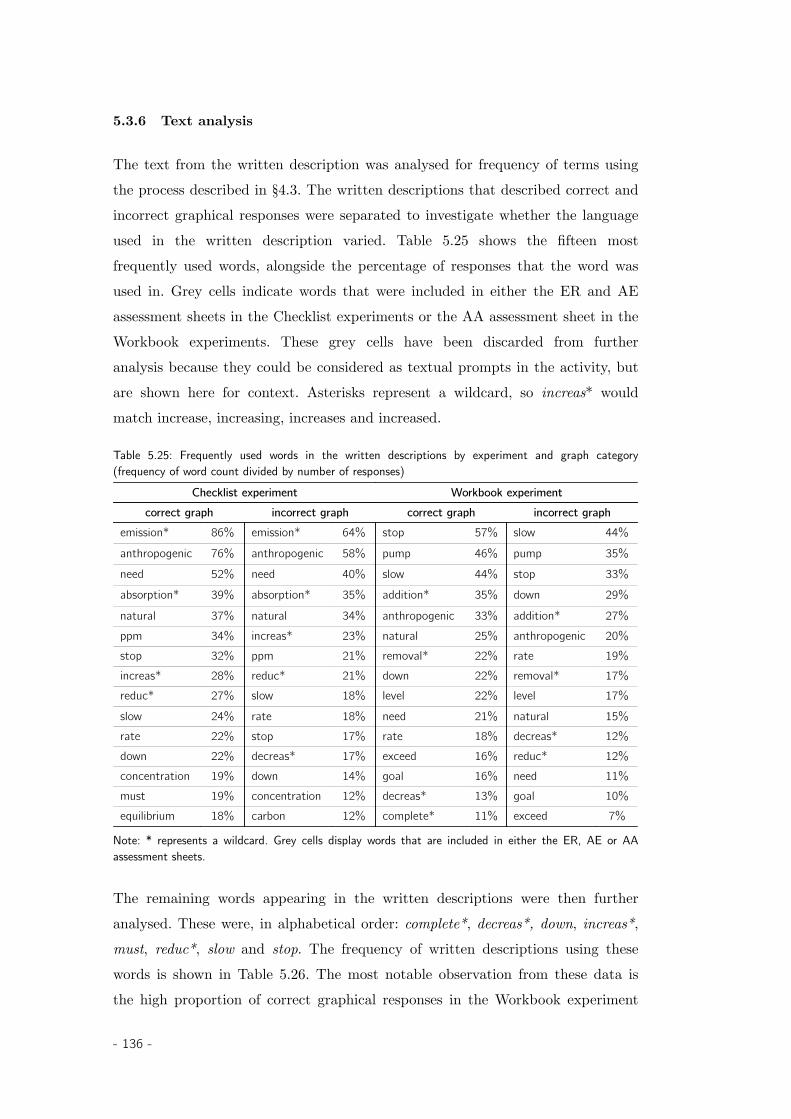
5.3.6 Text analysis
The text from the written description was analysed for frequency of terms usingthe process described in §4.3. The written descriptions that described correct andincorrect graphical responses were separated to investigate whether the languageused in the written description varied. Table 5.25 shows the fifteen mostfrequently used words, alongside the percentage of responses that the word wasused in. Grey cells indicate words that were included in either the ER and AEassessment sheets in the Checklist experiments or the AA assessment sheet in theWorkbook experiments. These grey cells have been discarded from furtheranalysis because they could be considered as textual prompts in the activity, butare shown here for context. Asterisks represent a wildcard, so increas* wouldmatch increase, increasing, increases and increased.
Table 5.25: Frequently used words in the written descriptions by experiment and graph category(frequency of word count divided by number of responses)
Checklist experiment Workbook experimentcorrect graph incorrect graph correct graph incorrect graph
emission* 86% emission* 64% stop 57% slow 44%anthropogenic 76% anthropogenic 58% pump 46% pump 35%need 52% need 40% slow 44% stop 33%absorption* 39% absorption* 35% addition* 35% down 29%natural 37% natural 34% anthropogenic 33% addition* 27%ppm 34% increas* 23% natural 25% anthropogenic 20%stop 32% ppm 21% removal* 22% rate 19%increas* 28% reduc* 21% down 22% removal* 17%reduc* 27% slow 18% level 22% level 17%slow 24% rate 18% need 21% natural 15%rate 22% stop 17% rate 18% decreas* 12%down 22% decreas* 17% exceed 16% reduc* 12%concentration 19% down 14% goal 16% need 11%must 19% concentration 12% decreas* 13% goal 10%equilibrium 18% carbon 12% complete* 11% exceed 7%
Note: * represents a wildcard. Grey cells display words that are included in either the ER, AE or AAassessment sheets.
The remaining words appearing in the written descriptions were then furtheranalysed. These were, in alphabetical order: complete*, decreas*, down, increas*,must, reduc*, slow and stop. The frequency of written descriptions using thesewords is shown in Table 5.26. The most notable observation from these data isthe high proportion of correct graphical responses in the Workbook experiment
- 136 -
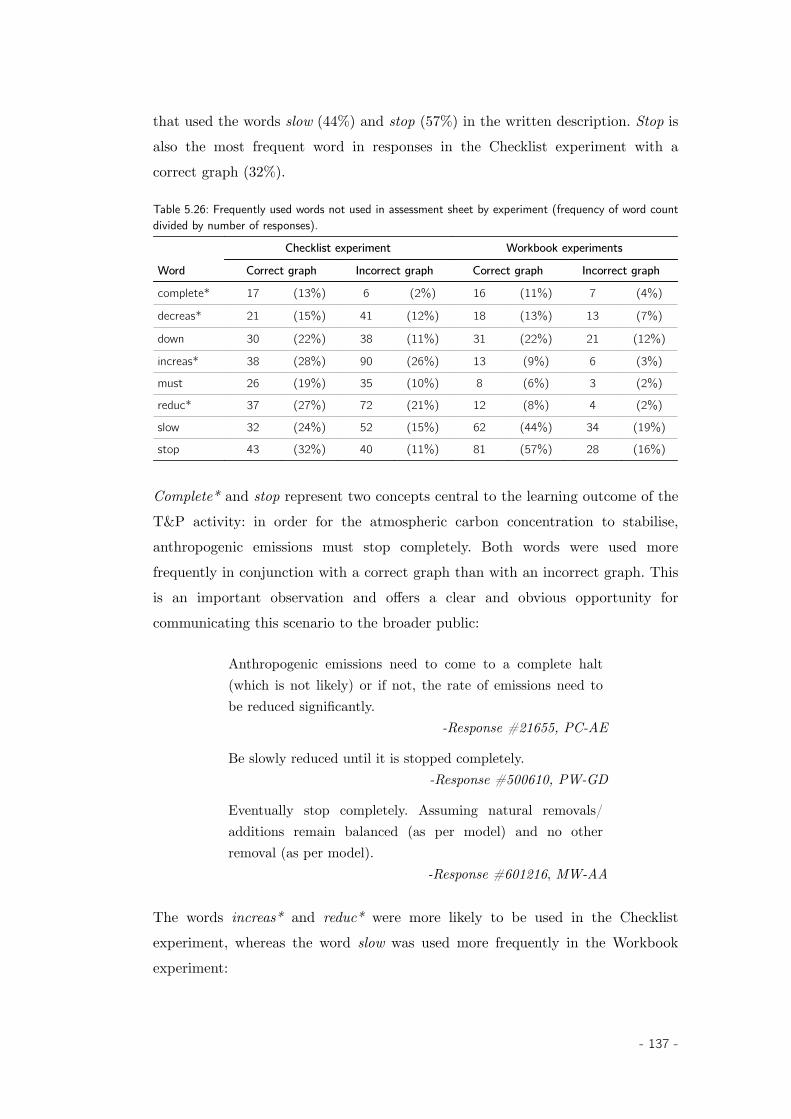
that used the words slow (44%) and stop (57%) in the written description. Stop isalso the most frequent word in responses in the Checklist experiment with acorrect graph (32%).
Table 5.26: Frequently used words not used in assessment sheet by experiment (frequency of word countdivided by number of responses).
Word
Checklist experiment Workbook experiments
Correct graph Incorrect graph Correct graph Incorrect graph
complete* 17 (13%) 6 (2%) 16 (11%) 7 (4%)
decreas* 21 (15%) 41 (12%) 18 (13%) 13 (7%)
down 30 (22%) 38 (11%) 31 (22%) 21 (12%)
increas* 38 (28%) 90 (26%) 13 (9%) 6 (3%)
must 26 (19%) 35 (10%) 8 (6%) 3 (2%)
reduc* 37 (27%) 72 (21%) 12 (8%) 4 (2%)
slow 32 (24%) 52 (15%) 62 (44%) 34 (19%)
stop 43 (32%) 40 (11%) 81 (57%) 28 (16%)
Complete* and stop represent two concepts central to the learning outcome of theT&P activity: in order for the atmospheric carbon concentration to stabilise,anthropogenic emissions must stop completely. Both words were used morefrequently in conjunction with a correct graph than with an incorrect graph. Thisis an important observation and offers a clear and obvious opportunity forcommunicating this scenario to the broader public:
Anthropogenic emissions need to come to a complete halt(which is not likely) or if not, the rate of emissions need tobe reduced significantly.
-Response #21655, PC-AE
Be slowly reduced until it is stopped completely.-Response #500610, PW-GD
Eventually stop completely. Assuming natural removals/additions remain balanced (as per model) and no otherremoval (as per model).
-Response #601216, MW-AA
The words increas* and reduc* were more likely to be used in the Checklistexperiment, whereas the word slow was used more frequently in the Workbookexperiment:
- 137 -
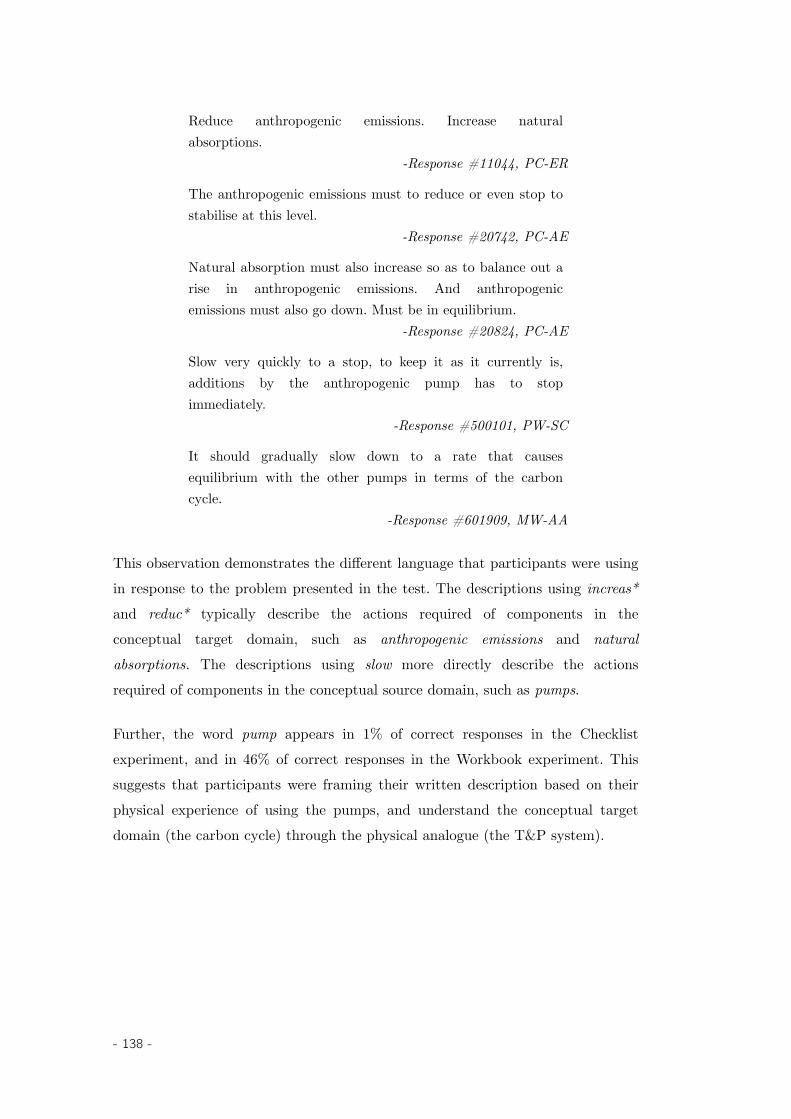
Reduce anthropogenic emissions. Increase naturalabsorptions.
-Response #11044, PC-ER
The anthropogenic emissions must to reduce or even stop tostabilise at this level.
-Response #20742, PC-AE
Natural absorption must also increase so as to balance out arise in anthropogenic emissions. And anthropogenicemissions must also go down. Must be in equilibrium.
-Response #20824, PC-AE
Slow very quickly to a stop, to keep it as it currently is,additions by the anthropogenic pump has to stopimmediately.
-Response #500101, PW-SC
It should gradually slow down to a rate that causesequilibrium with the other pumps in terms of the carboncycle.
-Response #601909, MW-AA
This observation demonstrates the different language that participants were usingin response to the problem presented in the test. The descriptions using increas*and reduc* typically describe the actions required of components in theconceptual target domain, such as anthropogenic emissions and naturalabsorptions. The descriptions using slow more directly describe the actionsrequired of components in the conceptual source domain, such as pumps.
Further, the word pump appears in 1% of correct responses in the Checklistexperiment, and in 46% of correct responses in the Workbook experiment. Thissuggests that participants were framing their written description based on theirphysical experience of using the pumps, and understand the conceptual targetdomain (the carbon cycle) through the physical analogue (the T&P system).
- 138 -

PART III SYNTHESIS
Preface
In Part I, I introduced the background for this thesis, examining stock-and-flowthinking and the carbon cycle, and philosophies of how knowledge is created. InPart II, I detailed my workshop methodology and presented my results. Here, inPart III, I conclude this thesis by discussing the implications of my findings inthe context of STEM education.
In Chapter 6, I explore the results of the experiments in relation to the double-loop learning approach presented in Chapter 3. I answer the research questionsoutlined in Chapter 4, and discuss the outcomes of the experiments.
In Chapter 7, I conclude this thesis by drawing out challenges for educators usingconstructionist approaches in undergraduate STEM courses, and detailingopportunities for further work.
- 139 -

- 140 -
6 Analysis and Discussion
You can’t think about thinking without thinking about thinking about something.- Seymour Papert (2005)
I have organised this chapter around the implications arising from the experi-mental results. First, I discuss the research questions proposed in Chapter 4. Thisleads to a discussion of the difference between stock-flow failure and written-graphical confusion, and to a reflection on the difference between hands-onlearning and constructionism. Finally, I conclude the analysis by proposingdouble-loop learning as a powerful idea.
6.1 Analysis of research questions
In this section, the three research questions are discussed, building on the resultspresented for the three experiments in Chapter 5.
6.1.1 Scaffolded refinement
Research Question: Does display of instructions and information in the T&Pactivity reduce SF failure?
Display of instructions and information within the T&P activity had a cleareffect on participants’ ability to draw the correct graph, and provide a matchingwritten description.
There were three treatment conditions considered to answer this question: PC-ER, PC-AE and PW-AA. Each treatment condition used a different assessmentsheet. The PC and PW treatments used different instructions: PC treatmentsused checklist instructions and the PW treatment used workbook instructions.
This research question investigates whether this display of information reducedSF failure. SF failure was measured using the levels of understanding described inTable 4.12. Results in the Sound AP category demonstrate sound understandingof accumulation principles in the given context: the graphical response shows afuture anthropogenic emissions that fall significantly from current levels, and the
- 141 -
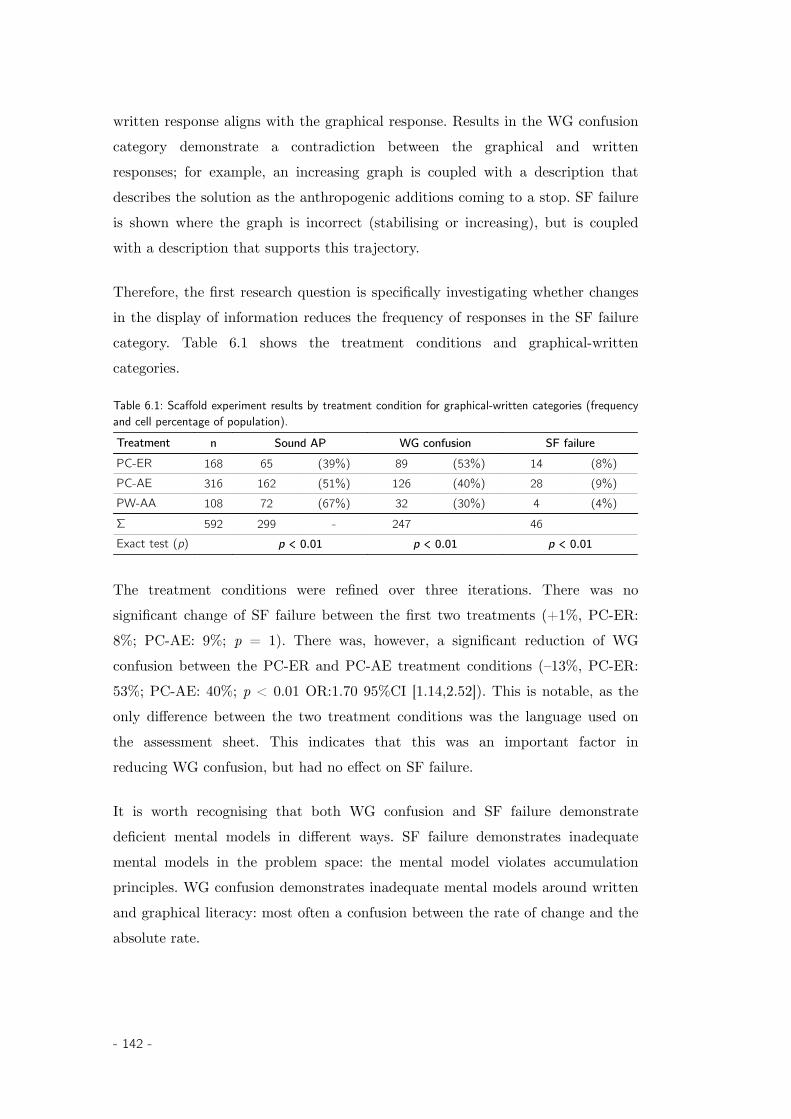
written response aligns with the graphical response. Results in the WG confusioncategory demonstrate a contradiction between the graphical and writtenresponses; for example, an increasing graph is coupled with a description thatdescribes the solution as the anthropogenic additions coming to a stop. SF failureis shown where the graph is incorrect (stabilising or increasing), but is coupledwith a description that supports this trajectory.
Therefore, the first research question is specifically investigating whether changesin the display of information reduces the frequency of responses in the SF failurecategory. Table 6.1 shows the treatment conditions and graphical-writtencategories.
Table 6.1: Scaffold experiment results by treatment condition for graphical-written categories (frequencyand cell percentage of population).Treatment n Sound AP WG confusion SF failurePC-ER 168 65 (39%) 89 (53%) 14 (8%)PC-AE 316 162 (51%) 126 (40%) 28 (9%)PW-AA 108 72 (67%) 32 (30%) 4 (4%)Σ 592 299 - 247 46Exact test (p) p < 0.01 p < 0.01 p < 0.01
The treatment conditions were refined over three iterations. There was nosignificant change of SF failure between the first two treatments (+1%, PC-ER:8%; PC-AE: 9%; p = 1). There was, however, a significant reduction of WGconfusion between the PC-ER and PC-AE treatment conditions (–13%, PC-ER:53%; PC-AE: 40%; p < 0.01 OR:1.70 95%CI [1.14,2.52]). This is notable, as theonly difference between the two treatment conditions was the language used onthe assessment sheet. This indicates that this was an important factor inreducing WG confusion, but had no effect on SF failure.
It is worth recognising that both WG confusion and SF failure demonstratedeficient mental models in different ways. SF failure demonstrates inadequatemental models in the problem space: the mental model violates accumulationprinciples. WG confusion demonstrates inadequate mental models around writtenand graphical literacy: most often a confusion between the rate of change and theabsolute rate.
- 142 -
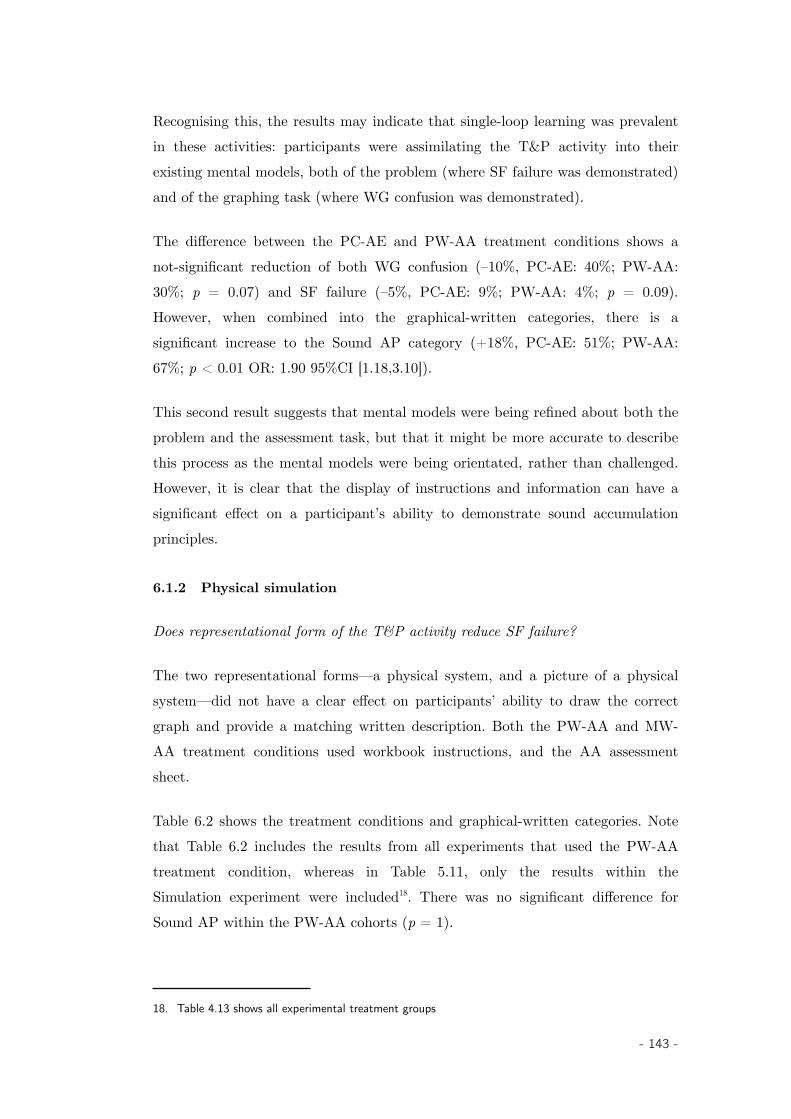
Recognising this, the results may indicate that single-loop learning was prevalentin these activities: participants were assimilating the T&P activity into theirexisting mental models, both of the problem (where SF failure was demonstrated)and of the graphing task (where WG confusion was demonstrated).
The difference between the PC-AE and PW-AA treatment conditions shows anot-significant reduction of both WG confusion (–10%, PC-AE: 40%; PW-AA:30%; p = 0.07) and SF failure (–5%, PC-AE: 9%; PW-AA: 4%; p = 0.09).However, when combined into the graphical-written categories, there is asignificant increase to the Sound AP category (+18%, PC-AE: 51%; PW-AA:67%; p < 0.01 OR: 1.90 95%CI [1.18,3.10]).
This second result suggests that mental models were being refined about both theproblem and the assessment task, but that it might be more accurate to describethis process as the mental models were being orientated, rather than challenged.However, it is clear that the display of instructions and information can have asignificant effect on a participant’s ability to demonstrate sound accumulationprinciples.
6.1.2 Physical simulation
Does representational form of the T&P activity reduce SF failure?
The two representational forms—a physical system, and a picture of a physicalsystem—did not have a clear effect on participants’ ability to draw the correctgraph and provide a matching written description. Both the PW-AA and MW-AA treatment conditions used workbook instructions, and the AA assessmentsheet.
Table 6.2 shows the treatment conditions and graphical-written categories. Notethat Table 6.2 includes the results from all experiments that used the PW-AAtreatment condition, whereas in Table 5.11, only the results within theSimulation experiment were included18. There was no significant difference forSound AP within the PW-AA cohorts (p = 1).
18. Table 4.13 shows all experimental treatment groups
- 143 -

Table 6.2: Simulation experiment results by treatment condition for graphical-written categories(frequency and cell percentage of population).Treatment n Sound AP WG confusion SF failure PW-AA ENVS1001 82 54 (66%) 25 (30%) 3 (4%) PW-AA ENGN1211 18 61 (66%) 6 (33%) 1 (6%) PW-AA VCUG3001 8 7 (88%) 1 (13%) 0 (0%)PW-AA Total 108 72 (67%) 32 (30%) 4 (4%)MW-AA 93 61 (66%) 30 (32%) 2 (2%)
Σ 201 133 - 62 6Exact test (p) p = 0.88 p = 0.76 p = 0.69
There were fewer instances of SF failure in the MW-AA condition (–2%, PW-AA:4%; MW-AA: 2%) and fewer instances of WG confusion in the PW-AA (–2%,PW-AA: 30%; MW-AA: 32%). However, both these results are small and notsignificant.
Just like the modeller who constructs a model and then is surprised by itsbehaviour, I was surprised (and frustrated) to see that the physical simulationactivity did not perform better than the mental simulation.
After careful consideration of the motives behind this research question andexperiment, my interpretation is that this result was not the failure of the experi-mental conditions, but rather it demonstrates that the T&P activity was an easy-to-access and strong conceptual metaphor. Participants used the T&P system tothink through the problem without interacting directly with the system. Thebehaviour of the system could be inferred, based on the participant’s experiencewith container-schema logic.
This observation led to another between-group experiment, included in AppendixD. Second-year engineering students were given the bathtub test (similar to thatdescribed in Box 2.1, and shown in Box D.5), with competing cover stories: oneusing a pump system similar to the T&P system, one using a bathtub, and oneusing mathematical additions and subtractions. A summary of the results areshown in Table 6.3 for this linear dynamics task.
- 144 -
Table 6.3: Linear dynamics results by graphical response (column percentages)Graphical response Abstract Bathtub PumpsCorrect 32 (43%) 49 (63%) 44 (60%)Incorrect 42 (57%) 29 (37%) 29 (40%)
Σ 74 - 78 - 73 -Exact test (p) p = 0.01 p = 0.12 p = 0.39
The Pumps treatment performed slightly better than the Bathtub treatment;however, there was no significant difference between the Bathtub and Pumpstreatments (p = 0.87). The Abstract treatment performed significantly worsethan other two, with participants only half as likely to draw a correct graph (p =0.01, OR: 0.48 95%CI[0.26,0.87]).
This result supports the argument that the T&P system helps students to reasonthrough basic stock-and-flow concepts. In this linear dynamics test, students wererequired only to mentally simulate the behaviour of the system. Students withthe Pumps treatment were easily able to assimilate their mental models, andperformed just as well as those with the Bathtub treatment.
The answer to this research question at this stage is that representational formdoes not appear to reduce SF failure. Other representational forms could beexperimented with, such as the use of flight simulators and other computersimulation interfaces, or in the application to other problems and contexts.However, with almost a third of participants still demonstrating WG confusion,representational form alone does not appear to be an indicator of performance.
- 145 -
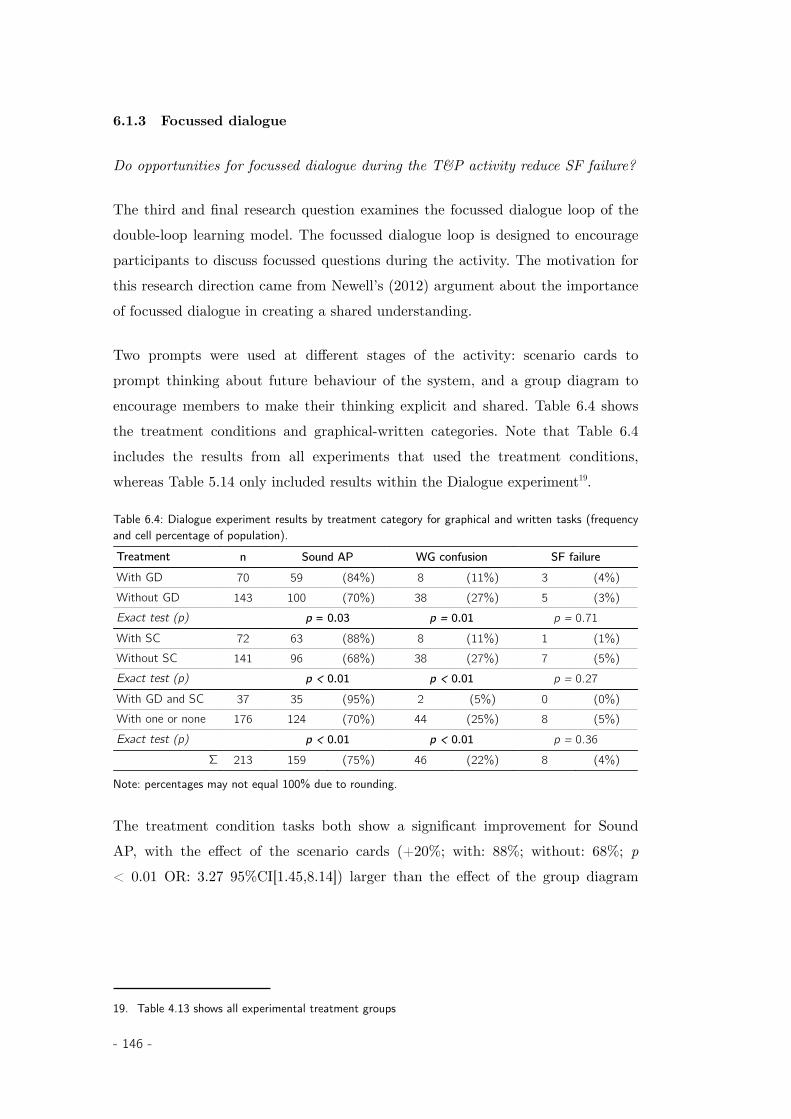
6.1.3 Focussed dialogue
Do opportunities for focussed dialogue during the T&P activity reduce SF failure?
The third and final research question examines the focussed dialogue loop of thedouble-loop learning model. The focussed dialogue loop is designed to encourageparticipants to discuss focussed questions during the activity. The motivation forthis research direction came from Newell’s (2012) argument about the importanceof focussed dialogue in creating a shared understanding.
Two prompts were used at different stages of the activity: scenario cards toprompt thinking about future behaviour of the system, and a group diagram toencourage members to make their thinking explicit and shared. Table 6.4 showsthe treatment conditions and graphical-written categories. Note that Table 6.4includes the results from all experiments that used the treatment conditions,whereas Table 5.14 only included results within the Dialogue experiment19.
Table 6.4: Dialogue experiment results by treatment category for graphical and written tasks (frequencyand cell percentage of population).Treatment n Sound AP WG confusion SF failureWith GD 70 59 (84%) 8 (11%) 3 (4%)Without GD 143 100 (70%) 38 (27%) 5 (3%)Exact test (p) p = 0.03 p = 0.01 p = 0.71With SC 72 63 (88%) 8 (11%) 1 (1%)Without SC 141 96 (68%) 38 (27%) 7 (5%)Exact test (p) p < 0.01 p < 0.01 p = 0.27With GD and SC 37 35 (95%) 2 (5%) 0 (0%)With one or none 176 124 (70%) 44 (25%) 8 (5%)Exact test (p) p < 0.01 p < 0.01 p = 0.36
Σ 213 159 (75%) 46 (22%) 8 (4%)
Note: percentages may not equal 100% due to rounding.
The treatment condition tasks both show a significant improvement for SoundAP, with the effect of the scenario cards (+20%; with: 88%; without: 68%; p< 0.01 OR: 3.27 95%CI[1.45,8.14]) larger than the effect of the group diagram
19. Table 4.13 shows all experimental treatment groups
- 146 -
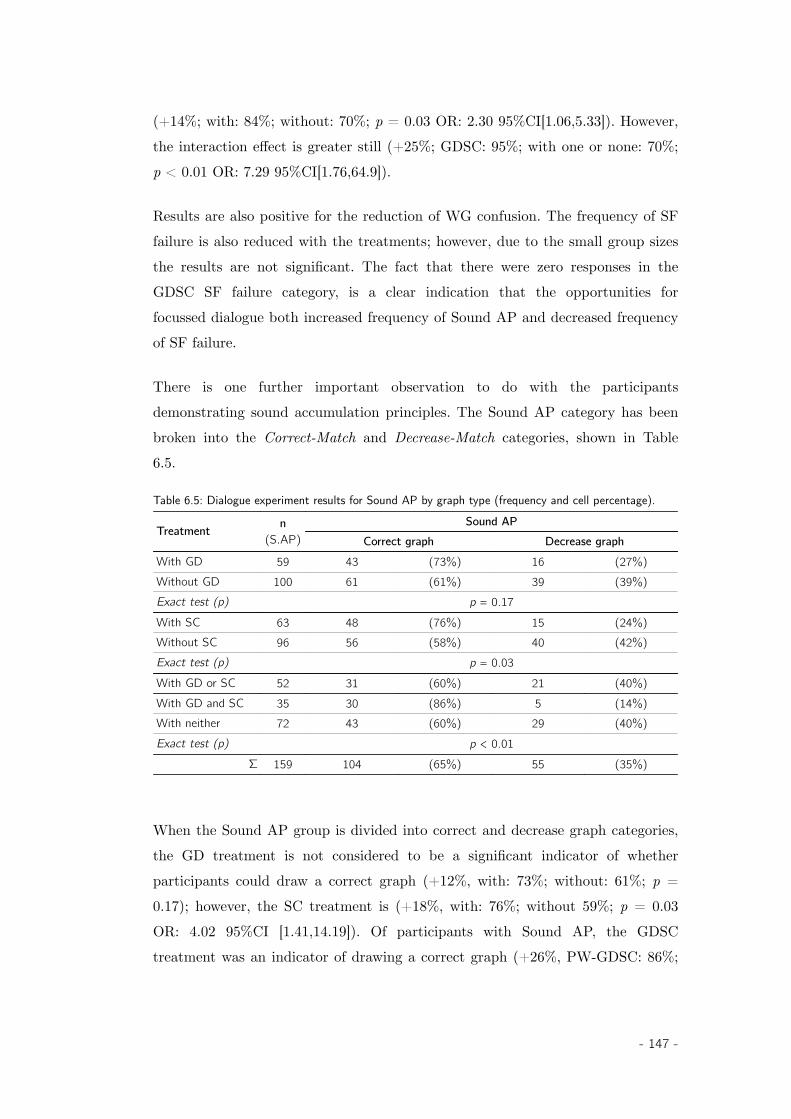
(+14%; with: 84%; without: 70%; p = 0.03 OR: 2.30 95%CI[1.06,5.33]). However,the interaction effect is greater still (+25%; GDSC: 95%; with one or none: 70%;p < 0.01 OR: 7.29 95%CI[1.76,64.9]).
Results are also positive for the reduction of WG confusion. The frequency of SFfailure is also reduced with the treatments; however, due to the small group sizesthe results are not significant. The fact that there were zero responses in theGDSC SF failure category, is a clear indication that the opportunities forfocussed dialogue both increased frequency of Sound AP and decreased frequencyof SF failure.
There is one further important observation to do with the participantsdemonstrating sound accumulation principles. The Sound AP category has beenbroken into the Correct-Match and Decrease-Match categories, shown in Table6.5.
Table 6.5: Dialogue experiment results for Sound AP by graph type (frequency and cell percentage).
Treatment n(S.AP)
Sound APCorrect graph Decrease graph
With GD 59 43 (73%) 16 (27%)Without GD 100 61 (61%) 39 (39%)Exact test (p) p = 0.17With SC 63 48 (76%) 15 (24%)Without SC 96 56 (58%) 40 (42%)Exact test (p) p = 0.03With GD or SC 52 31 (60%) 21 (40%)With GD and SC 35 30 (86%) 5 (14%)With neither 72 43 (60%) 29 (40%)Exact test (p) p < 0.01
Σ 159 104 (65%) 55 (35%)
When the Sound AP group is divided into correct and decrease graph categories,the GD treatment is not considered to be a significant indicator of whetherparticipants could draw a correct graph (+12%, with: 73%; without: 61%; p =0.17); however, the SC treatment is (+18%, with: 76%; without 59%; p = 0.03OR: 4.02 95%CI [1.41,14.19]). Of participants with Sound AP, the GDSCtreatment was an indicator of drawing a correct graph (+26%, PW-GDSC: 86%;
- 147 -
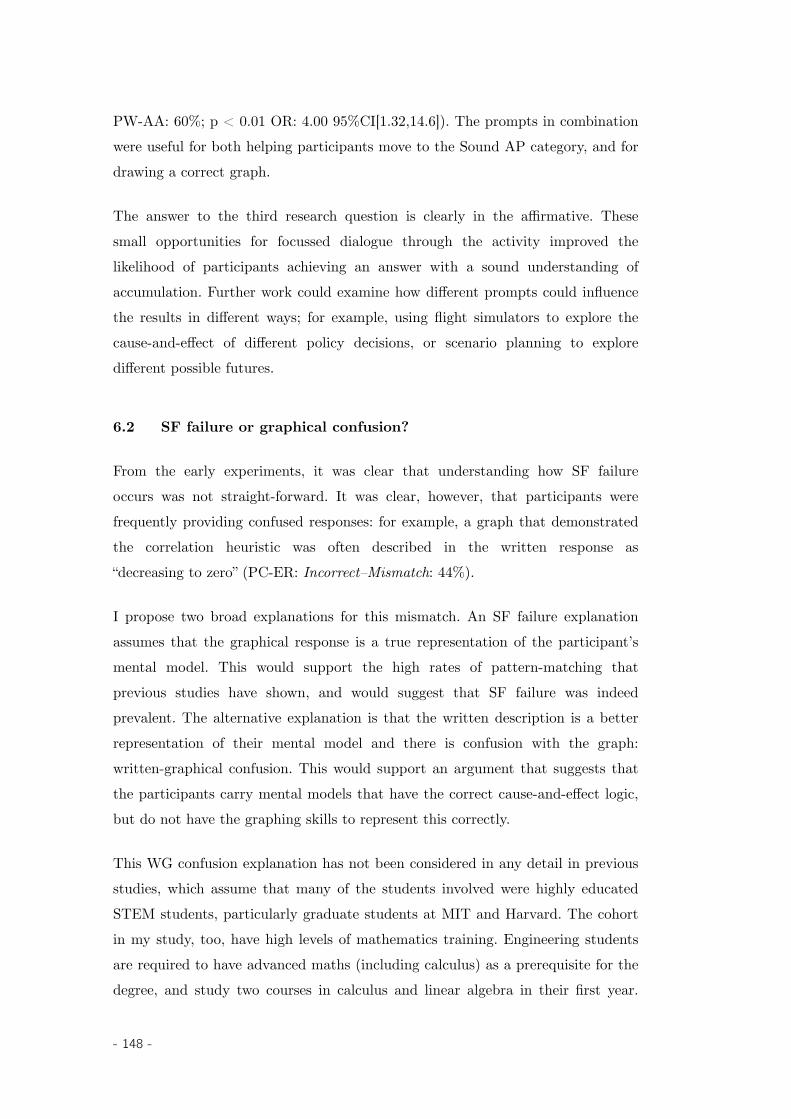
PW-AA: 60%; p < 0.01 OR: 4.00 95%CI[1.32,14.6]). The prompts in combinationwere useful for both helping participants move to the Sound AP category, and fordrawing a correct graph.
The answer to the third research question is clearly in the affirmative. Thesesmall opportunities for focussed dialogue through the activity improved thelikelihood of participants achieving an answer with a sound understanding ofaccumulation. Further work could examine how different prompts could influencethe results in different ways; for example, using flight simulators to explore thecause-and-effect of different policy decisions, or scenario planning to exploredifferent possible futures.
6.2 SF failure or graphical confusion?
From the early experiments, it was clear that understanding how SF failureoccurs was not straight-forward. It was clear, however, that participants werefrequently providing confused responses: for example, a graph that demonstratedthe correlation heuristic was often described in the written response as“decreasing to zero” (PC-ER: Incorrect–Mismatch: 44%).
I propose two broad explanations for this mismatch. An SF failure explanationassumes that the graphical response is a true representation of the participant’smental model. This would support the high rates of pattern-matching thatprevious studies have shown, and would suggest that SF failure was indeedprevalent. The alternative explanation is that the written description is a betterrepresentation of their mental model and there is confusion with the graph:written-graphical confusion. This would support an argument that suggests thatthe participants carry mental models that have the correct cause-and-effect logic,but do not have the graphing skills to represent this correctly.
This WG confusion explanation has not been considered in any detail in previousstudies, which assume that many of the students involved were highly educatedSTEM students, particularly graduate students at MIT and Harvard. The cohortin my study, too, have high levels of mathematics training. Engineering studentsare required to have advanced maths (including calculus) as a prerequisite for thedegree, and study two courses in calculus and linear algebra in their first year.
- 148 -
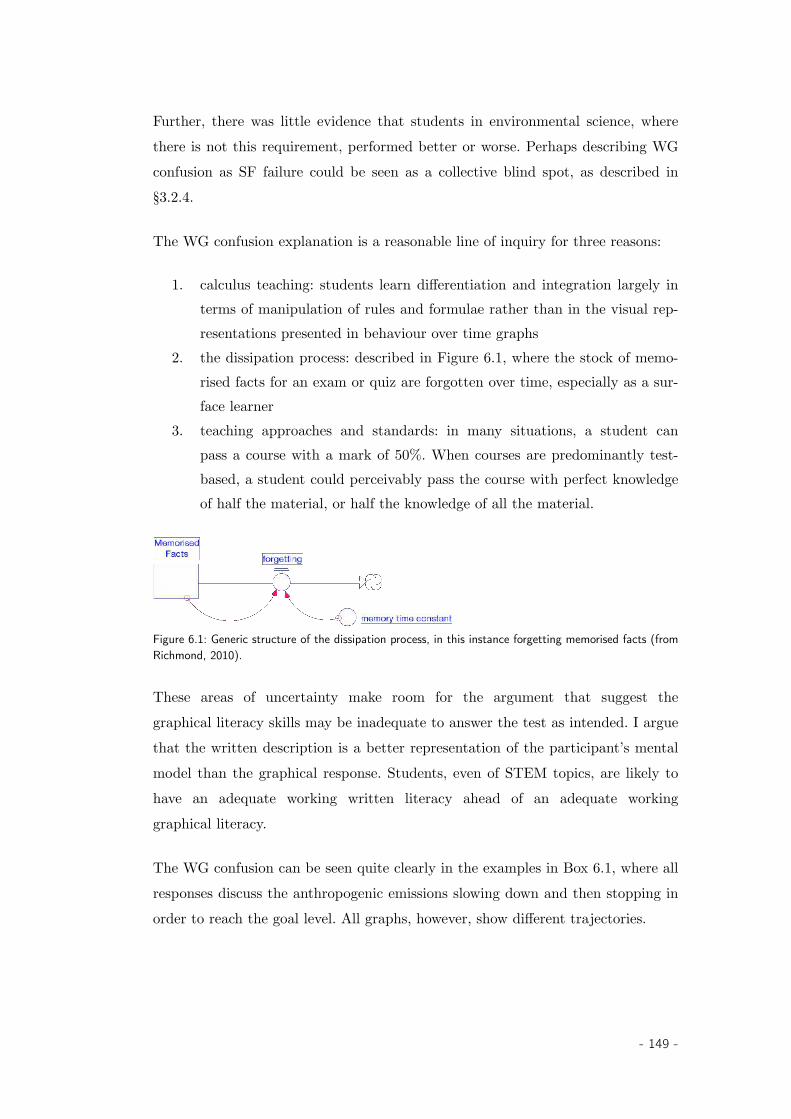
Further, there was little evidence that students in environmental science, wherethere is not this requirement, performed better or worse. Perhaps describing WGconfusion as SF failure could be seen as a collective blind spot, as described in§3.2.4.
The WG confusion explanation is a reasonable line of inquiry for three reasons:
1. calculus teaching: students learn differentiation and integration largely interms of manipulation of rules and formulae rather than in the visual rep-resentations presented in behaviour over time graphs
2. the dissipation process: described in Figure 6.1, where the stock of memo-rised facts for an exam or quiz are forgotten over time, especially as a sur-face learner
3. teaching approaches and standards: in many situations, a student canpass a course with a mark of 50%. When courses are predominantly test-based, a student could perceivably pass the course with perfect knowledgeof half the material, or half the knowledge of all the material.
Figure 6.1: Generic structure of the dissipation process, in this instance forgetting memorised facts (fromRichmond, 2010).
These areas of uncertainty make room for the argument that suggest thegraphical literacy skills may be inadequate to answer the test as intended. I arguethat the written description is a better representation of the participant’s mentalmodel than the graphical response. Students, even of STEM topics, are likely tohave an adequate working written literacy ahead of an adequate workinggraphical literacy.
The WG confusion can be seen quite clearly in the examples in Box 6.1, where allresponses discuss the anthropogenic emissions slowing down and then stopping inorder to reach the goal level. All graphs, however, show different trajectories.
- 149 -
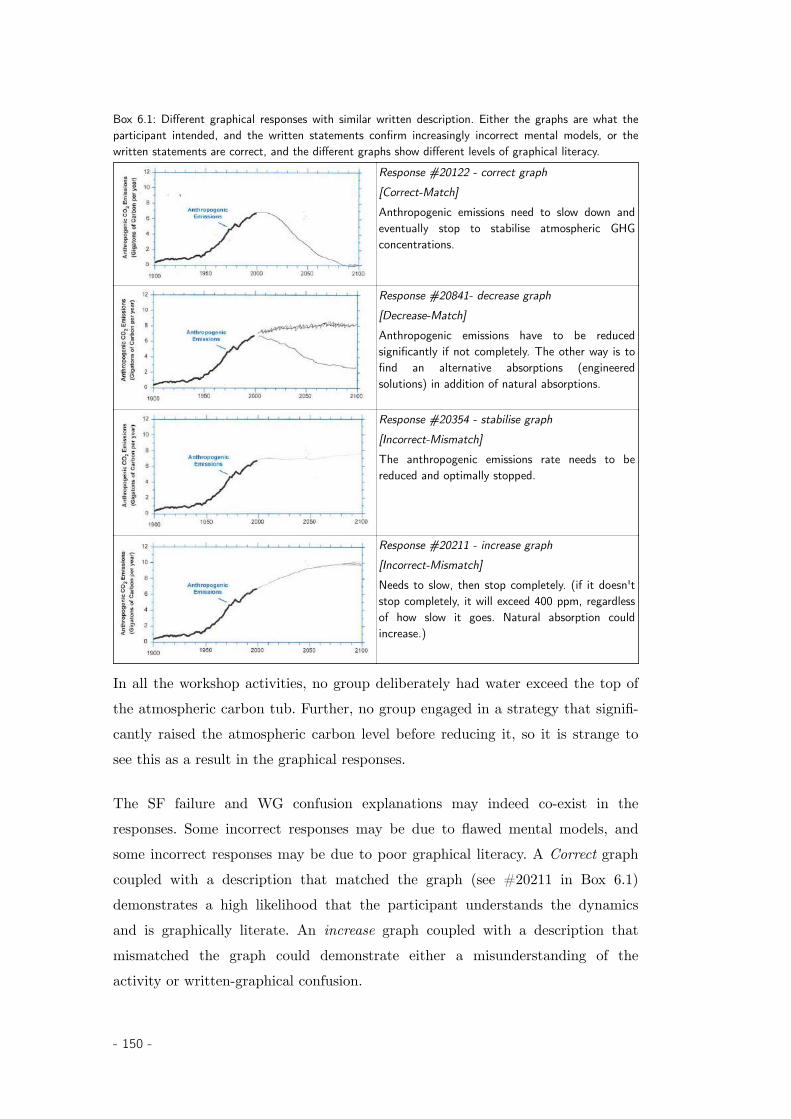
Box 6.1: Different graphical responses with similar written description. Either the graphs are what theparticipant intended, and the written statements confirm increasingly incorrect mental models, or thewritten statements are correct, and the different graphs show different levels of graphical literacy.
Response #20122 - correct graph[Correct-Match]Anthropogenic emissions need to slow down andeventually stop to stabilise atmospheric GHGconcentrations.
Response #20841- decrease graph[Decrease-Match]Anthropogenic emissions have to be reducedsignificantly if not completely. The other way is tofind an alternative absorptions (engineeredsolutions) in addition of natural absorptions.
Response #20354 - stabilise graph [Incorrect-Mismatch]The anthropogenic emissions rate needs to bereduced and optimally stopped.
Response #20211 - increase graph[Incorrect-Mismatch]Needs to slow, then stop completely. (if it doesn'tstop completely, it will exceed 400 ppm, regardlessof how slow it goes. Natural absorption couldincrease.)
In all the workshop activities, no group deliberately had water exceed the top ofthe atmospheric carbon tub. Further, no group engaged in a strategy that signifi-cantly raised the atmospheric carbon level before reducing it, so it is strange tosee this as a result in the graphical responses.
The SF failure and WG confusion explanations may indeed co-exist in theresponses. Some incorrect responses may be due to flawed mental models, andsome incorrect responses may be due to poor graphical literacy. A Correct graphcoupled with a description that matched the graph (see #20211 in Box 6.1)demonstrates a high likelihood that the participant understands the dynamicsand is graphically literate. An increase graph coupled with a description thatmismatched the graph could demonstrate either a misunderstanding of theactivity or written-graphical confusion.
- 150 -
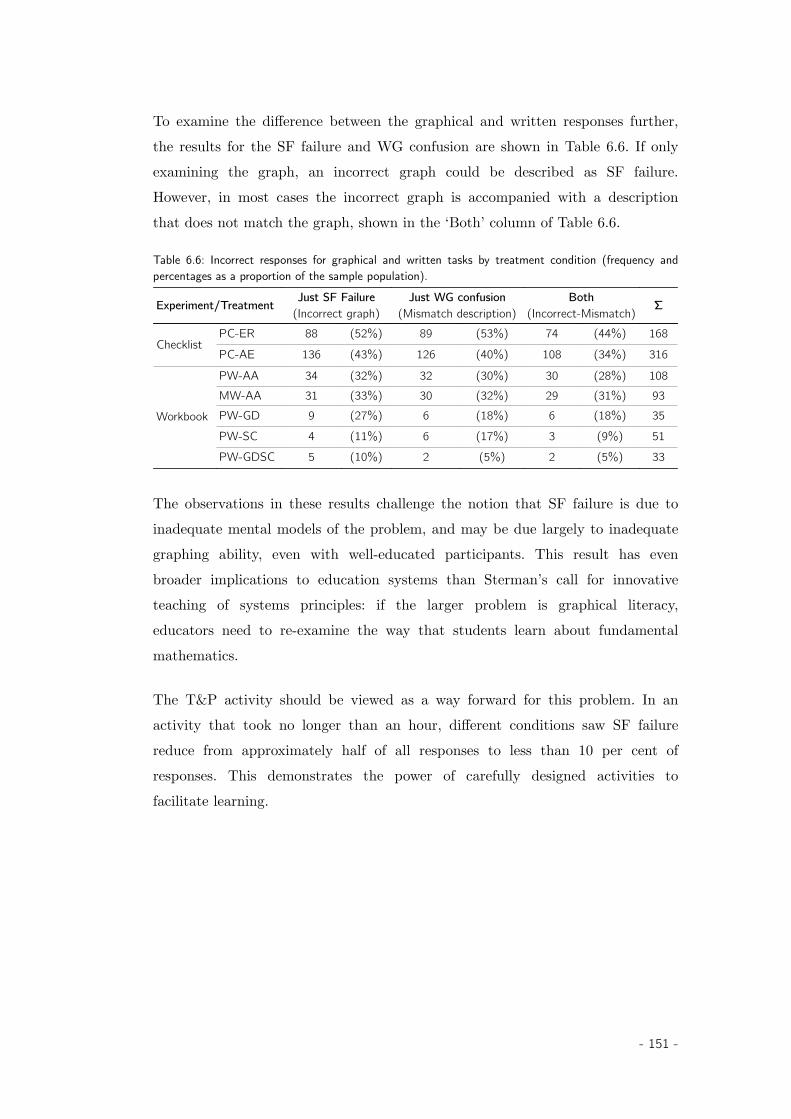
To examine the difference between the graphical and written responses further,the results for the SF failure and WG confusion are shown in Table 6.6. If onlyexamining the graph, an incorrect graph could be described as SF failure.However, in most cases the incorrect graph is accompanied with a descriptionthat does not match the graph, shown in the ‘Both’ column of Table 6.6.
Table 6.6: Incorrect responses for graphical and written tasks by treatment condition (frequency andpercentages as a proportion of the sample population).
Experiment/Treatment Just SF Failure(Incorrect graph)
Just WG confusion(Mismatch description)
Both(Incorrect-Mismatch) Σ
ChecklistPC-ER 88 (52%) 89 (53%) 74 (44%) 168PC-AE 136 (43%) 126 (40%) 108 (34%) 316
Workbook
PW-AA 34 (32%) 32 (30%) 30 (28%) 108MW-AA 31 (33%) 30 (32%) 29 (31%) 93PW-GD 9 (27%) 6 (18%) 6 (18%) 35PW-SC 4 (11%) 6 (17%) 3 (9%) 51PW-GDSC 5 (10%) 2 (5%) 2 (5%) 33
The observations in these results challenge the notion that SF failure is due toinadequate mental models of the problem, and may be due largely to inadequategraphing ability, even with well-educated participants. This result has evenbroader implications to education systems than Sterman’s call for innovativeteaching of systems principles: if the larger problem is graphical literacy,educators need to re-examine the way that students learn about fundamentalmathematics.
The T&P activity should be viewed as a way forward for this problem. In anactivity that took no longer than an hour, different conditions saw SF failurereduce from approximately half of all responses to less than 10 per cent ofresponses. This demonstrates the power of carefully designed activities tofacilitate learning.
- 151 -
6.3 Hands-on learning is not the same as constructionism
The distinction between hand-on learning and constructionism became extremelyapparent to me after the first trial workshop with students, where I struggled toget students to understand what was happening in this fantastic hands-onactivity that I had created for them.
During this initial failure, I was reminded of my undergraduate engineeringeducation experience: apparently pointless problem sets, cut-and-paste-from-the-internet-until-the-code-works programming exercises, and cramming for endlessand meaningless exams. Now sitting on the other side, I was getting frustrated atmy students for apparently experiencing the same thing.
The difference in performance occurred when the activity switched from beingjust a hands-on activity to a double-loop learning activity. That is, when thelearning in the activity shifted from an experience I shared with students (thechecklist experiments) to being an experience that the students created forthemselves based on my prompts (the workbook experiments). This, of course,failed at first, and is described in §D.4, but by changing my own mental modelsabout the problem, I have been able to leverage constructionist pedagogy withmodest success.
This observation has had a pervasive effect on observations of my own teachingand teaching in my discipline. Engineering has always had opportunities toengage with experiential, hands-on learning, particularly because of itsapplication of natural sciences to the construction of real-world objects. Thehardware lab is a classic example of this. However, many laboratories are createdto mirror the checklist process of workbook exercises, rather than being designedto provide opportunities for students to engage in constructionist learning.
- 152 -
It seems most efficient to provide students with step-by-stepassistance, tools, and tricks to organize their thoughts andget to a finished product as quickly as possible. This well-intentioned support may in fact have the effect of stiflingcreativity and forcing students to create products thatsimply mirror the checklist they have been given. Students,especially the “good” students who have been well-trained tofollow directions, will march through the steps with littlethought at all.
- Martinez & Stager (2013)
A recent conversation with a laboratory technician comes to mind. He was(politely) complaining about having to set up a later-year undergraduateelectronics hardware lab to the point where the lab work was essentially a plug-and-play activity. He would much prefer to see the students having to design andassemble the circuitry themselves. He said that there was not enough time for thestudents to do this within the laboratory session, as they didn’t have the requiredhands-on experience with the equipment. This situation is a damning example ofthe state of engineering education, and is no doubt replicated (and not recordedin the education literature) across the country and the globe.
It could be argued that making things accessible and technically easy for studentsin practicals is a useful approach for educators, as students focus on thetheoretical grounding required to pass examinations in preparation for theworkforce. However, Trevelyan argues that the pedagogy in engineering educationdoes not even align with actual engineering practice. The engineering educationliterature “reveals an overwhelming belief that engineering is all about solitarytechnical work: technical problem-solving and design” (Trevelyan, 2010, p. 384).The important skills required in professional practice are not learnt at university,such as life-long learning (Trevelyan, 2014). There is no reason why these skillscould not be learnt at university, or indeed be the primary focus of a universityprogram in engineering.
The founder of the field of system dynamics, Jay W. Forrester, recognised thedisconnect between education practices and the need to develop creative problem-solvers in a 1967 symposium to the USA National Academy of Engineering:
- 153 -

[The engineer] must identify the significant and criticalproblems, but in his education, problems have beenpredetermined and assigned. He must develop the judgmentto know what solutions to problems are possible, but inschool the problems encountered are known to have answers.He should be excited by new and unsolved challenges, butfor 20 years he has lived in an educational system where heknows he is repeating the work of last year's students.
- Jay W. Forrester(in National Academy of Engineering 1970)
The ‘maker’ movement and its proponents (makers) may offer direction in thisarea. Makers explore engineering disciplines, such as electronics, mechatronics,materials science and design through play and tinkering with physical objects.Making, hacking, tinkering, failing and improving are everyday activities formakers.
Martinez and Stager (2013) describe constructionism as the best way to ‘do’constructivism. In Seymour Papert’s Constructionist Learning Lab, he outlinesthe philosophy behind this particular maker space with eight big ideas,paraphrased from Stager (2005) below:
1. learn by doing2. technology as a building material3. through ‘hard’ fun4. by learning to learn5. by taking the proper amount of time for the job6. you can’t get it right without getting it wrong7. do unto ourselves as we do unto our students8. knowing about digital technology is as important as reading andwriting
Making and tinkering puts the student in a social environment where the role of‘instructor’ is removed and replaced with ‘facilitator’. Open-ended challenges areeffective prompts, which the students solve through constructing objects thatsatisfy the question. For example, “Make something that will start here and endthere in one minute” (Martinez & Stager, 2013). Students are encouraged to solveproblems that are important to their task, and the role of the facilitator is to
- 154 -
provide prompts that extend the students’ inquiry. For example, when a workingprototype has achieved the first goal, the goal can be stretched: can you makesomething that will start here and stop there in 10 seconds?
Building such a learning environment in a university classroom is not straight-forward. It is in stark contrast to the prevailing pedagogy of lectures, problemsets, and theory exams. These approaches ignore opportunities for the student toreconstruct the theoretical knowledge that a start-here, stop-there designchallenge could offer. The challenge could be used to explore a variety ofconcepts, approaches and intangible benefits that might be required to completethe challenge, such as the social interactions required for team work, communi-cation to seek new perspectives, collaboration to troubleshoot ideas, andreturning to the drawing board when mental models are proved wrong;essentially, learning how to learn.
6.4 Double-loop learning as a powerful idea
Throughout the design of the T&P activity and through the results, it becameclear that careful design of the activity could allow students to use the T&Psystem to create their own knowledge about the carbon cycle. As studentsworked their way through the workbook, there were countless shared ‘aha’moments and deep, meaningful discussion among students as they began torealise that zero emissions is drastically different to zero growth in emissions.
The most memorable of these took place in a local primary school, where I wasrunning an activity alongside Paul Compston, Barry Newell, and a classroomteacher with a group of about 20 year 3 to year 6 students. Towards the end ofthe session, I asked the students to think about what sorts of things they coulddo in their daily life to help reduce the atmospheric carbon stock. Studentsproposed plans to plant trees, walk to school, recycle at home, et cetera. Onestudent talked about a future where everyone would drive electric cars. But,unlike the previous ideas, the student next to him admonished him. He had hadhis ‘aha’ moment. He exclaimed to the class that, “This would not be enough!” Itcould only ever stop the water level from going up. Not only should we stop thewater from rising but we need to do things that would bring the level down.
- 155 -
The understanding of this primary school student has had a lasting effect on meas an educator. It was clear that this student, without any formal training insystem dynamics, let alone textbook calculus, was able to clearly understand thecausal logic that undergraduate STEM students were getting confused about. Forme, this was a first-hand experience of the type of intuition that I had heard JayW. Forrester talk about at his fireside chat with Khalid Saeed at the 2012International System Dynamics Conference in Washington. Forrester haddescribed young children intuitively understanding complex dynamics, such asthat which govern the accumulation of friends in the playground, and how goodor bad behaviour can change this accumulation.
It's much easier to teach system dynamics in grades onethrough eight than it is any time later, because they have alot less to unlearn. All the fundamental ideas can be graspedin the first few years. There have been people who quitesuccessfully explained to kindergarteners the importance ofstocks and flows. The water in the bathtub is a stock. Theflows are obvious. Your reputation is a stock. The good andbad things you do are the flows. And they can go throughtheir environment and find the stocks and the flows. By fifthand sixth grade they can be doing computer simulationmodels that, for the most part, are now being taught ingraduate school.
- Jay W. Forrester in conversation with Khalid Saeed (2013)
My experience with this primary school student showed me first-hand that therewas a powerful idea at play. However, it wasn’t until the last experiment that Irealised that the powerful idea was not the T&P activity itself, but rather theprocess of double-loop learning that prompted students to have their own ‘aha’moments.
- 156 -
7 Conclusion
The best way to construct knowledge or understanding is throughthe construction of something shareable, outside of a student’s head. [...]
such artifacts are evidence of learning.
- Martinez & Stager (2013)
The aim of this thesis was to improve how engineering educators understand theuse of concrete experiences in the learning process.
I investigated this aim by creating a physical simulation activity to help studentsdiscover for themselves the dynamics of the carbon cycle, and map the futuretrajectory of anthropogenic additions required to stabilise the level ofatmospheric carbon. I found that alongside the physical simulation itself,informed, scaffolded dialogue is essential for students to achieve a soundunderstanding of the problem.
7.1 Lessons for educators
The double-loop learning model has been the backbone of this thesis. Along withthe T&P activity itself, the model is also the major outcome of this thesis.
The variables used in Sterman’s double-loop learning model were used toexamine mental models in the Chapter 3 literature review. The researchmethodology in Chapter 4 was framed around the instance of the double-looplearning model for physical simulation. Whilst the lessons from this thesis couldbe applied broadly to many educational fields, here I generalise my experiencefrom the T&P activity to opportunities and challenges for constructionistapproaches in engineering education. I do this by examining considerations forpractical classes in engineering through the links in the double-loop learninginfluence diagram, annotated in Figure 7.1.
- 157 -
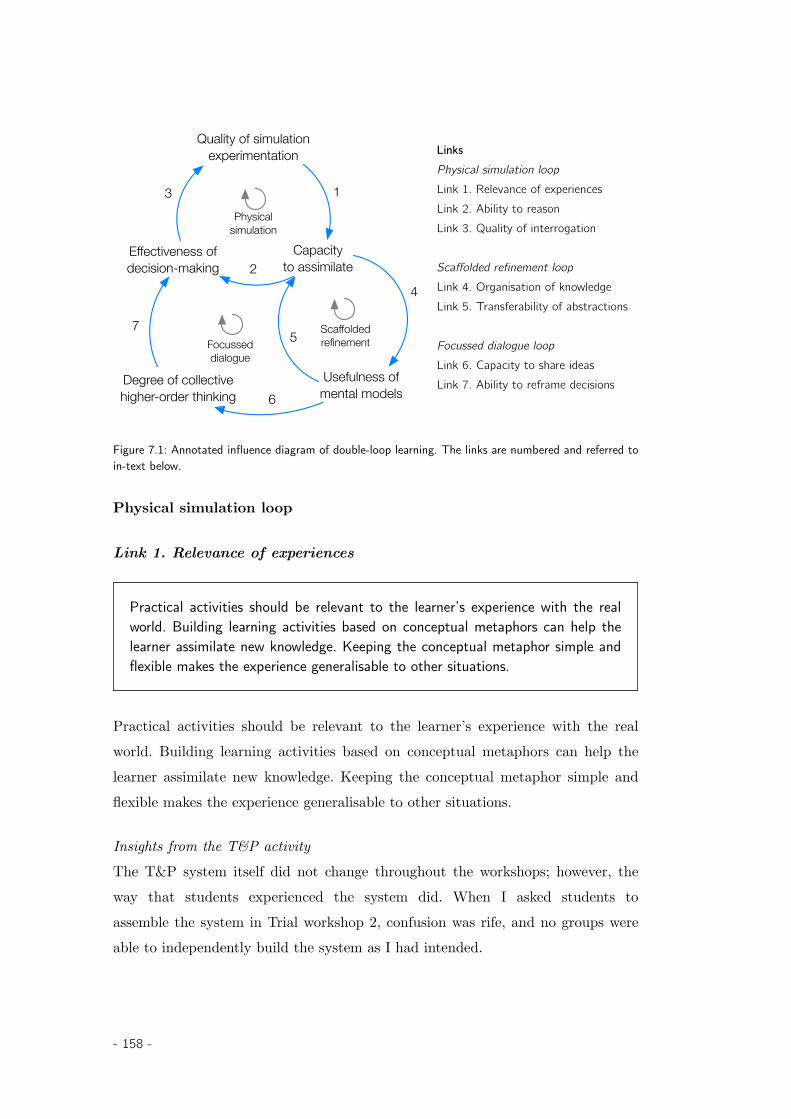
Quality of simulationexperimentation
Capacityto assimilate
Usefulness ofmental models
Physicalsimulation
Focusseddialogue
Degree of collectivehigher-order thinking
Scaffolded refinement
Effectiveness of decision-making
1
2
5
3
4
6
7
LinksPhysical simulation loopLink 1. Relevance of experiencesLink 2. Ability to reasonLink 3. Quality of interrogation
Scaffolded refinement loopLink 4. Organisation of knowledgeLink 5. Transferability of abstractions
Focussed dialogue loopLink 6. Capacity to share ideasLink 7. Ability to reframe decisions
Figure 7.1: Annotated influence diagram of double-loop learning. The links are numbered and referred toin-text below.
Physical simulation loop
Link 1. Relevance of experiences
Practical activities should be relevant to the learner’s experience with the realworld. Building learning activities based on conceptual metaphors can help thelearner assimilate new knowledge. Keeping the conceptual metaphor simple andflexible makes the experience generalisable to other situations.
Practical activities should be relevant to the learner’s experience with the realworld. Building learning activities based on conceptual metaphors can help thelearner assimilate new knowledge. Keeping the conceptual metaphor simple andflexible makes the experience generalisable to other situations.
Insights from the T&P activityThe T&P system itself did not change throughout the workshops; however, theway that students experienced the system did. When I asked students toassemble the system in Trial workshop 2, confusion was rife, and no groups wereable to independently build the system as I had intended.
- 158 -
In the Checklist experiment, students picked up an assembled system and wereasked to identify which pump they were controlling (Sound AP: PC-AE 51%;n=162). In the Workbook experiments, students were given an assembled system,but were required to label the components in the system before the activitybegan (Sound AP: PW-AA 67%, n=72).
Further, the T&P system was easily understood, to the extent that the studentscould simulate the behaviour of the system without interacting at all with thephysical system (Sound AP: MW-AA 66%, n=61).
See the discussion about Trial workshop 2 in §D.3, The rationale about thedecision to use a pre-assembled system in §4.1.1, and the summary result betweentreatment conditions in §5.1.1.
Link 2. Ability to reason
The practical should orientate the learner to the interactions within the problemspace, and help the learner reason about the problem clearly. Obstacles that areimpeding the learner’s ability to reason should be removed.
Insights from the T&P activityThe activity originally described the carbon cycle using the terms ‘emissions’ and‘absorptions’. Observations during the Checklist experiment indicated thatstudents were having trouble negotiating the terminology, and that this wasinhibiting their ability to reason. In the Workbook experiments, the terms‘additions’ and ‘removals’ were used instead, and this confusion appeared toreduce.
The written descriptions between the Checklist and Workbook experimentssomewhat demonstrate this change. Considering responses that drew a correctgraph, emission* was the most frequently used word in the Checklist experiment,used in 86% of responses; in the Workbook experiment, additions was used in35% of responses. Whereas, the most frequently used word in the Workbookexperiment was stop, used in 57% of responses; Checklist experiment: 32%. The
- 159 -
students in the Workbook experiment appear to be reasoning with the problemmore clearly than the students in the Checklist experiment, who were negotiatingthe terminology.
See the discussion about the change in language in §4.1.1, and the text analysisresults in §5.3.6.
Link 3. Quality of interrogation
The practical should enable students to conduct high-quality, open-endedinterrogation of the ideas.
Insights from the T&P activityThe simulation environment should be consistent with the behaviour of theproblem that is being modelled. In early trial versions of the activity within myresearch group, the pipes between the tubs were not fixed, and instead relied onsomeone in the group to hold them in place. This meant that effort was beingspent dealing with the mechanics of the activity, rather than spending that timelearning. Further, with the pipes being placed into the tubs, students could easilychange their level in relation to the water, meaning that what was an additionspump could easily turn into a removals pump, violating the intended structure ofthe system.
Eventually, the pipes were cut to exact sizes, and holes were drilled into the tubsat appropriate levels and made watertight. Although there were other smallmechanical problem with this, such as small amounts of water leaking out ofpumps, tubs near toppling due to the vigour of pumpers, and pumps occasionallybreaking, the majority of the effort was engaging with the system and interro-gating the behaviour of the system.
- 160 -
Scaffolded refinement loop
Link 4. Organisation of knowledge
Practical activities should be readily organised into learners’ existing stock ofmental models. Careful attention is required to prompt learners to check-in withand question their mental models continuously through their learning, based onobservations from the practical.
Insights from the T&P activitySimulation is an ideal activity to interrogate a problem. However, simulationitself does not ensure that the interrogation is challenging or useful; opportunitiesto reflect on the simulation environment and its meaning are important toinclude in the instructions.
Reflecting back on the Checklist experiment, the nine dot-point instructionsdescribe the desired simulation behaviour I wanted students to experience.Student could conceivably go through the activity with little understanding ofwhat they are doing or why. In the Checklist experiment, written-graphicalconfusion was common (WG confusion: PC-ER: 54%). This was a missedopportunity for their learning.
In the Workbook instructions, students were orientated and prompted to thinkabout the activity. This was done a number of ways. The instructions includedbehaviour over time graphs, helping to show the intended behaviour over time.Headings in the instruction tasks were used, such as ‘Task 3: Simulate theNatural Carbon Cycle’, which may have contributed to the orientation of ideasthrough the experiment. Further, targeted questions were used through theexperiment:
• What real-world thing does the water in your system represent?• [D]iscuss what kinds of real-world things are represented by the Natural Ad-
ditions and Natural Removals pumps. What happens when one of the pumpsis running faster or slower than the other?
• [D]iscuss with your group how to stop the atmospheric stock fromoverflowing.
- 161 -
• Describe what needs to happen to the Anthropogenic Additions pump to en-sure that the goal level is not exceeded (assume that the Natural Additionsand Natural Removals remain approximately the same).
These small questions prompted students to think both about the meaning of theactivity and their actions within it. On reflection, there could have been manymore opportunities within the instructions to do this; however, written-graphicalconfusion reduced over the experiments (WG confusion: PC-AE: 40%; PW-AA:30%; PW-GDSC: 5%).
See the instruction sheets in Appendix A for the full instructions used in theexperiment, and the discussion about the development of all the workshopinstructions in §4.2.
Link 5. Transferability of abstractions
Learners should use the practical to develop mental models that improves theircapacity to understand the world around them, and reason with the theory inuseful ways.
Insights from the T&P activityThe learning environment should be simple and flexible, as to allow creative andimaginative thought about the problem at hand. This observation aligns with thehigher-order thinking skills, such as abstraction, generalisation and transferringto new domains.
The debriefing discussions about the activity were rich for demonstrations ofgeneralisable knowledge. These discussions were not formally part of theexperiment. The discussion was based on a series of semi-structured questionsthat had prepared answers. These evolved and changed based on the direction ofdiscussions, but centred on:
• how would you improve the T&P system to better represent other importantaspects of the carbon cycle?
• what could you (your family/community/city/country) do in your daily lifeto reduce your anthropogenic additions to zero?
• what would happen to global emissions if you (your family/community/city/country) decided to drop to zero?
- 162 -
The answers to these questions, which were asked after assessment, demonstratehow students were able to assimilate their experience of the T&P into theirmental models, and relate these to other situations.
For example, students typically improved the system by suggesting adding ananthropogenic removals pump. Then showing students the relatively insignificantamount of carbon that is currently removed anthropogenically from theatmosphere compared to the burning of fossil fuels (the size of the economy)helped them to see the importance of, for example, decarbonising the economy.Increasing the speed of the removals pump was another common strategy,through planting more trees. This was an opportunity to demonstrate the effectof deforestation, and highlight the distinction between different types of stocks,such as that trees are buffers, and both absorb and respire carbon and decay onshort timeframes, returning carbon into the atmosphere and to the soil.
These examples show how students were using the T&P activity as the sourcedomain for their thinking about the problem, and could imagine how the systemwould behave with a new structure, new rules or new information. See thediscussion in §6.4 for further examples of this creative thought.
Focussed dialogue loop
Link 6. Capacity to share ideas
The practical should prompt learners to make their thinking explicit to others.This both prompts learners to organise their knowledge more carefully, andprovides an opportunity for learners to collaborate and learn from each other.
Insights from the T&P activityThe Dialogue experiment shows how thinking was made explicit through thecreation of a graph. Creation is a fundamental part of constructionist pedagogy,although admittedly a better task may have been to get students to build newmodels of their own, collaborate on interesting projects, or write a poem.
The group simulation nature of the activity helped to get students interactingwith each other’s ideas. The scaffolded questions through the workbook helped tocreate a shared environment for knowledge creation. The construction of a graph
- 163 -
as a group had an effect on the performance of individuals in the assessmenttask, shown by the improvement in Sound AP between the with GD groups(81%) and without GD groups (67%).
However, of the nine groups in this treatment condition, only four drew a‘correct’ group diagram. One group in this treatment condition went on to havesolutions that were all incorrect, and four groups went on to have no individualgraphs correct. This could be an example of group think, where the focusseddialogue was useful for reaching a shared understanding, but not a correct sharedunderstanding.
See the results in §5.2.3 for the dialogue experiment, and the discussion in §6.1.3for further examples.
Link 7. Ability to reframe decisions
The practical should enable individuals to collectively reframe their decisionsand allow them to explore ideas that are outside their individual capacity togenerate.
Insights from the T&P activityThe combination of the scenario cards and the group diagram was the mosteffective treatment condition to help students demonstrate a soundunderstanding of accumulation principles. The scenario cards were a significantindicator of drawing a correct graph (with SC: 56%; without SC: 33%; p =0.039).
However, it was the combination with the group diagram that achieved the bestresults. The GDSC treatment condition (Sound AP: PW-GDSC: 93%) outper-formed the base treatment (Sound AP: PW-AA: 67%), and the originaltreatment condition (Sound AP: PC-ER: 39%). The GDSC treatment was alsoan indicator of drawing a correct graph (with both: 76%; with SC, GD or neither:33%), and groups using scenario cards and group diagram outperformed groupsjust using the group diagram task (PW-GDSC: 80%; PW-GD: 44%). No groupsin the PW-GDSC group drew an incorrect graph, and subsequently noindividuals drew an incorrect graph.
- 164 -

This highlights the importance of not only focussed dialogue, but informedfocussed dialogue. See the results in §5.2.3 for the Dialogue experiment, and thediscussion in §6.1.3 for further examples.
7.2 Further research
There is, of course, more to be done. To explore the further work, I will examinethe links from the double-loop learning model again, in the frame of opportu-nities to improve in the T&P system as a tool for teaching accumulationprinciples.
Physical simulation loop
Link 1. Relevance of experiences
Further work is required to explore how the system can be applied to othercontexts. The Creative Learning Exchange (CLE) house a large range of mate-rials designed for educators to use, such as graphing the accumulation of mon-ey in a bank account, or the processes of trees growing in a forest. These areready opportunities for physical simulation using a system like the Tubs &Pumps.
Link 2. Ability to reason
There are opportunities to explore how students interact with the T&P sys-tem and their in-situ ability to reason. Future work is required to see whetherthe physical simulation can be transferred to other media to enhance the expe-rience, such as systems built on electronic sensors with in-built feedback, inter-acting with real-time graphs, providing formative feedback through theactivity.
Link 3. Quality of interrogation
The process of physical simulation is a sensory experience. However, the physi-cal system can be easily manipulated in ways that don’t observe feedbackprocesses, and can’t be easily changed into other situations. Future work is re-quired to understand whether the quality of interrogation in physical simula-
- 165 -
tion could be improved, perhaps with the introduction of flight-simulator ap-proaches, and flexible scenarios where students could be stretched once theyhave mastered one situation to examine new contexts and different policyenvironments.
Scaffolded refinement loop
Link 4. Organisation of knowledge
Further work is required to examine whether there are better ways to presenttasks and instructions. The growth of grass-roots maker movements, onlineuser created content, and purposeful use of technology may be an opportunityto engage in better modes of delivering instructions and prompts, and betteraligned with the way that students engage with content.
This has relevance to the display of information in many different activities inengineering education, such as the display of content, worksheets, laboratoryinstructions, assignment guides and exams.
Link 5. Transferability of abstractions
The T&P activity was designed to be incorporated into existing tutorials as ashort introduction to systems thinking. However, these courses were not sys-tem dynamics courses, and theory was not developed further. The T&P sys-tem could serve as a powerful base metaphor for a course on system dynamicsor that develops systems thinking skills further.
Research is required to investigate whether the T&P activity could serve as apowerful, or at least useful, idea for students beginning to study systemdynamics.
- 166 -

Focussed dialogue loop
Link 6. Capacity to share ideas
Students need the opportunity to construct their own ideas about the prob-lem, and then test them in a safe, encouraging environment. However, theresults suggest that the group diagram orientated some groups, and disorien-tated others. Timely, formative feedback may be a useful technique to helpgroups of students orientate their thinking about the problem. Further re-search could examine the effect of formative feedback on the group decision-making process.
Link 7. Ability to reframe decisions
The scenario cards were useful to help students draw the correct graph. How-ever, it is not clear whether students used the graphs and text on the scenariocards to generate their own mental models about the problem, or whetherthey adopted the solution and made it fit their mental model. Further workcould examine the use of other techniques for reframing thinking as a group,such as scenario planning between groups, to prompt broader discussion.
As a conclusion, it is worthwhile reflecting on the future of the T&P activity inrelation to helping students construct their own understanding of accumulationprinciples. This thesis has made clear that there are directions forward in thefield of SF failure, most notably through building the capacity of students todistinguish between stocks and flows. Future work is required to transfer thelessons of this experiment in physical simulation to other contexts and theorydomains, to help students understand other concepts. And, perhaps mostimportantly, nurturing the powerful idea of using a constructionist approach todouble-loop learning to teach fundamental accumulation principles. The lessonsthat come out of this thesis have relevance for engineering educators and otherdisciplines where accumulation principles are paramount, both at university andother teaching scenarios.
- 167 -

This page is intentionally blank
- 168 -

8 Appendices
APPENDIX
- A1 -

Appendix A Workshop instructions
A.1 Checklist workshop instructions
GREENHOUSE GAS (GHG) WORKSHOP INSTRUCTIONS
In your groups of 4, allocate the roles of:
• Anthropogenic emissions• Natural emissions• Natural absorptions• Instructor/Observer
Please read these instructions out aloud before starting the activity. During the activity, the Instructor/Observer should prompt the group.
1. Ask the Natural Emissions to pump to a level of half the capacity of the atmospheric stock, then stop
2. Ask the Natural Absorptions to drain the atmospheric stock completely, then stop
3. Ask the Anthropogenic Emissions to pump to a level of half the capacity of the atmospheric stock, then stop
4. Now ask the Natural Emissions and Natural Absorptions to pump in a relationship to maintain the water level at half the capacity of the atmospheric stock. Prompt the emissions to speed up and then slow down and observe the water level.
5. Ask the Natural Emissions and Natural Absorptions to concentrate on matching their flow rates, rather than looking at the atmospheric stock. This represents Dynamic Equilibrium.
6. Now ask the Anthropogenic Emissions to pump at a very slow rate, and prompted to increase that rate over a period of time
7. When the atmospheric stock reaches a level about 2cm from the top of the atmospheric stock, the Observer will ask the group to troubleshoot how to stop it from overflowing. Keep in mind that the Natural Emissions and Natural Absorptions should roughly stay the same.
8. You can repeat step 7 to see if other strategies work.
9. Participants discuss the observed dynamics
- A2 -
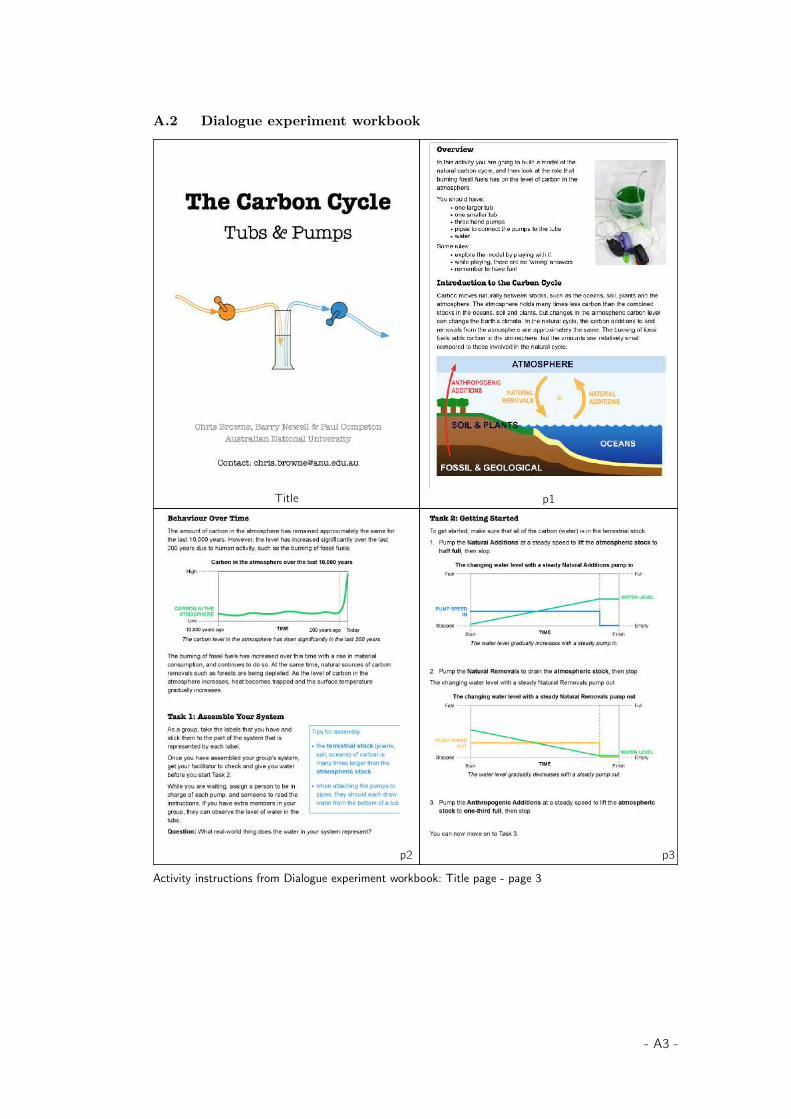
A.2 Dialogue experiment workbook
Title p1
p2 p3
Activity instructions from Dialogue experiment workbook: Title page - page 3
- A3 -
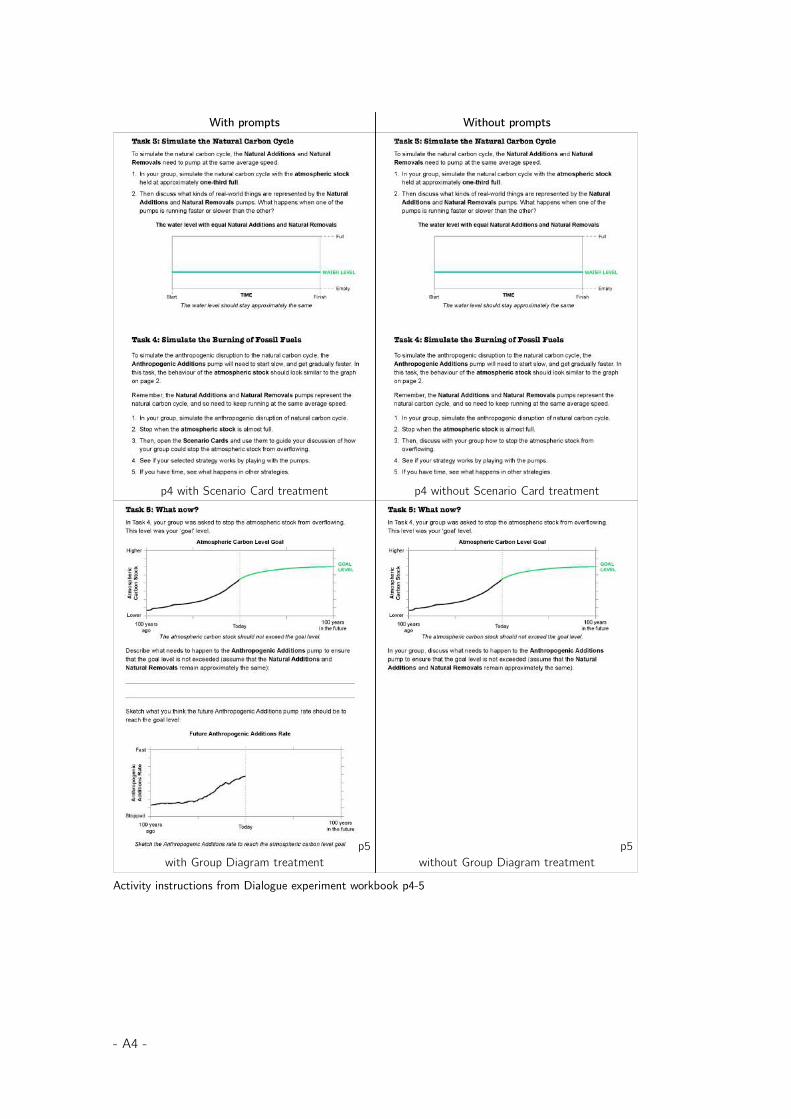
With prompts Without prompts
p4 with Scenario Card treatment p4 without Scenario Card treatment
p5with Group Diagram treatment
p5without Group Diagram treatment
Activity instructions from Dialogue experiment workbook p4-5
- A4 -
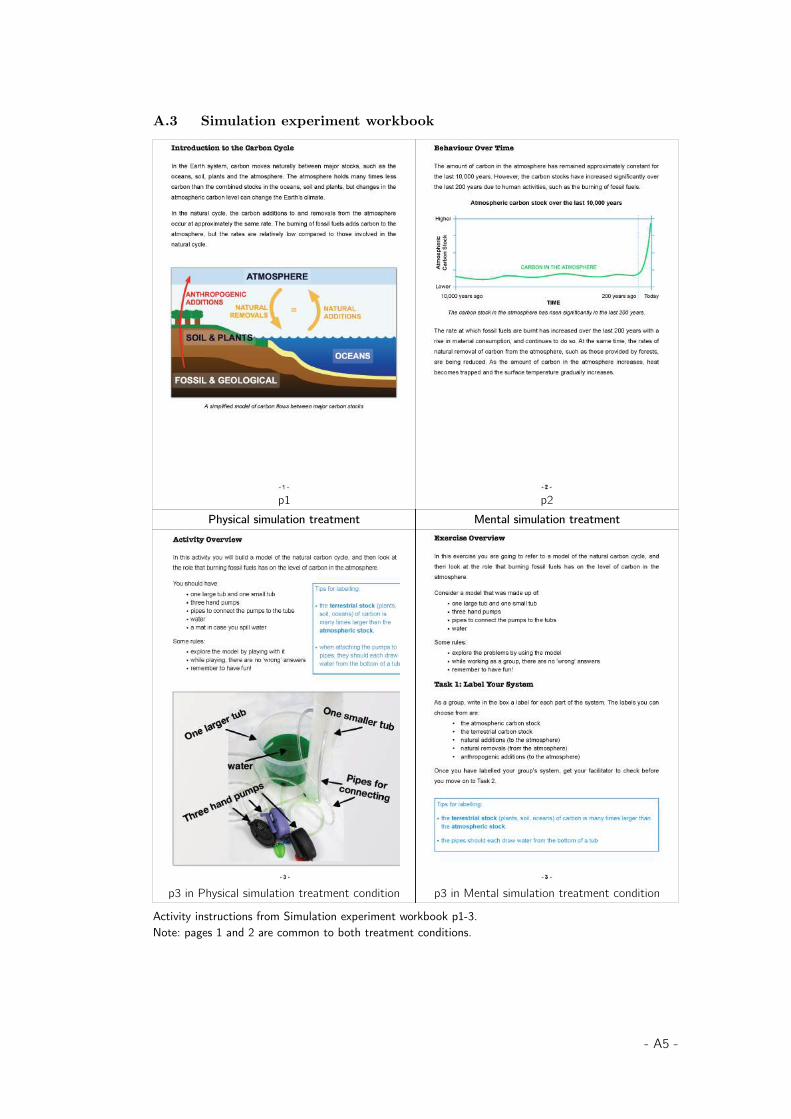
A.3 Simulation experiment workbook
p1 p2Physical simulation treatment Mental simulation treatment
p3 in Physical simulation treatment condition p3 in Mental simulation treatment condition
Activity instructions from Simulation experiment workbook p1-3.Note: pages 1 and 2 are common to both treatment conditions.
- A5 -
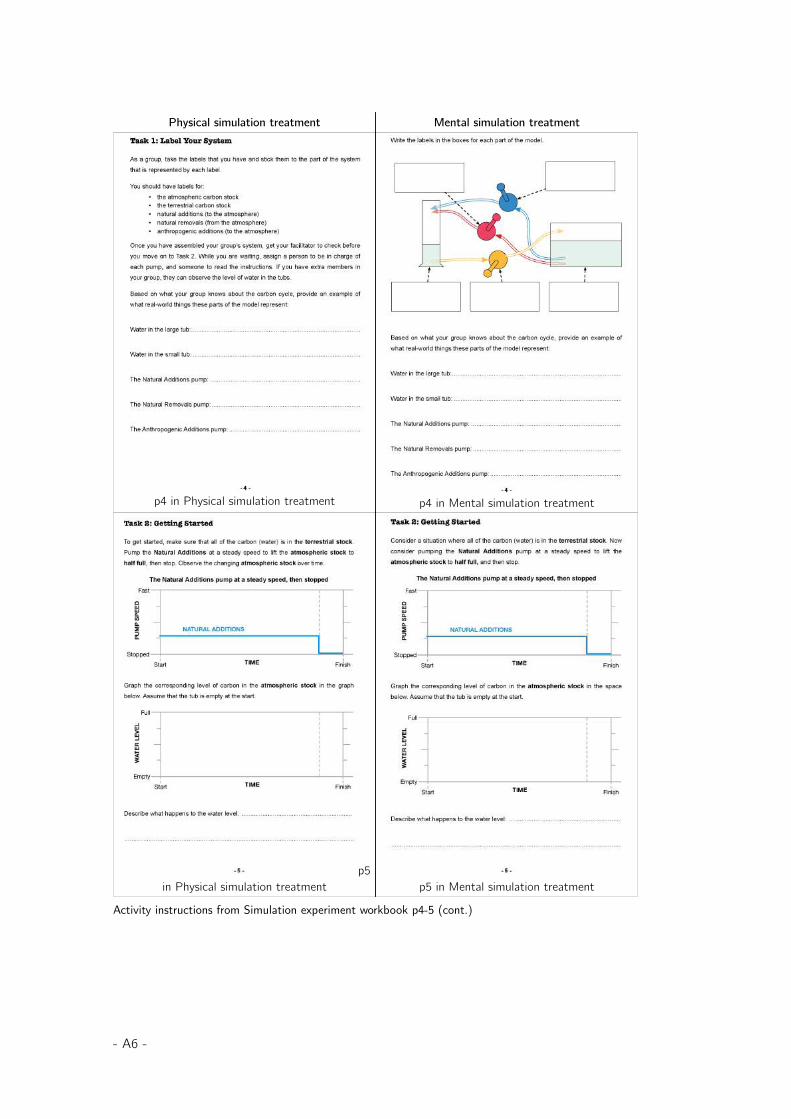
Physical simulation treatment Mental simulation treatment
p4 in Physical simulation treatment p4 in Mental simulation treatment
p5in Physical simulation treatment p5 in Mental simulation treatment
Activity instructions from Simulation experiment workbook p4-5 (cont.)
- A6 -
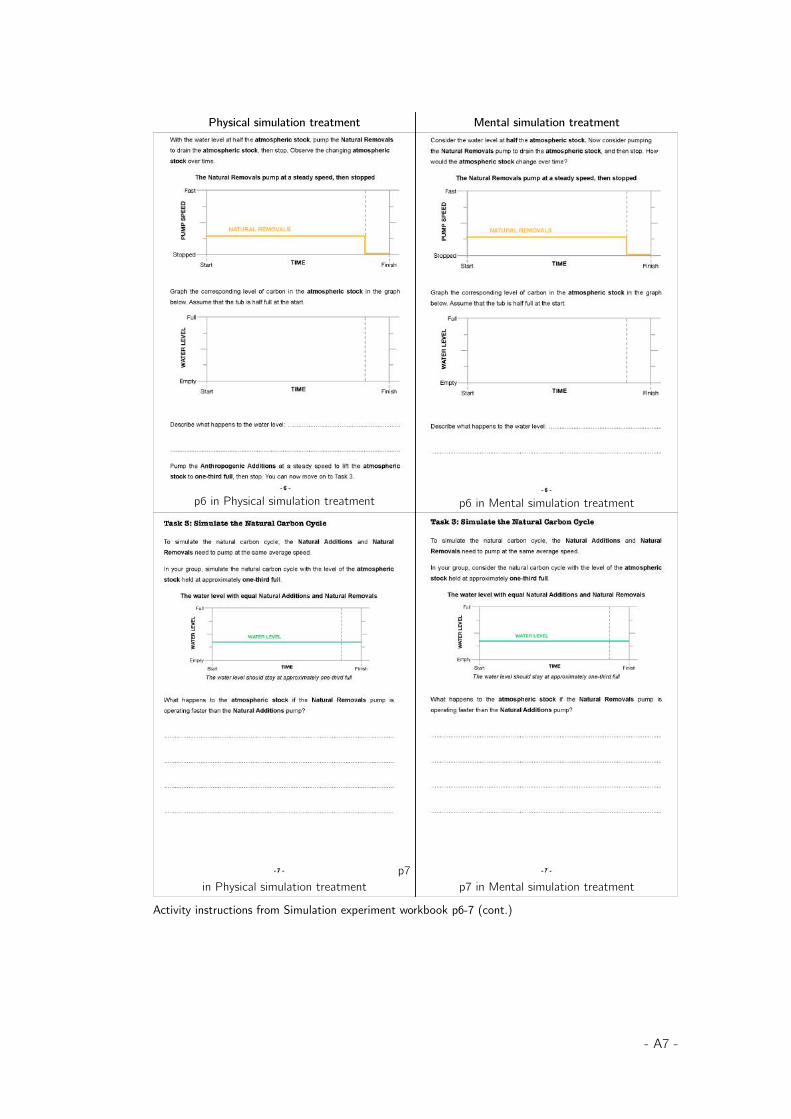
Physical simulation treatment Mental simulation treatment
p6 in Physical simulation treatment p6 in Mental simulation treatment
p7in Physical simulation treatment p7 in Mental simulation treatment
Activity instructions from Simulation experiment workbook p6-7 (cont.)
- A7 -
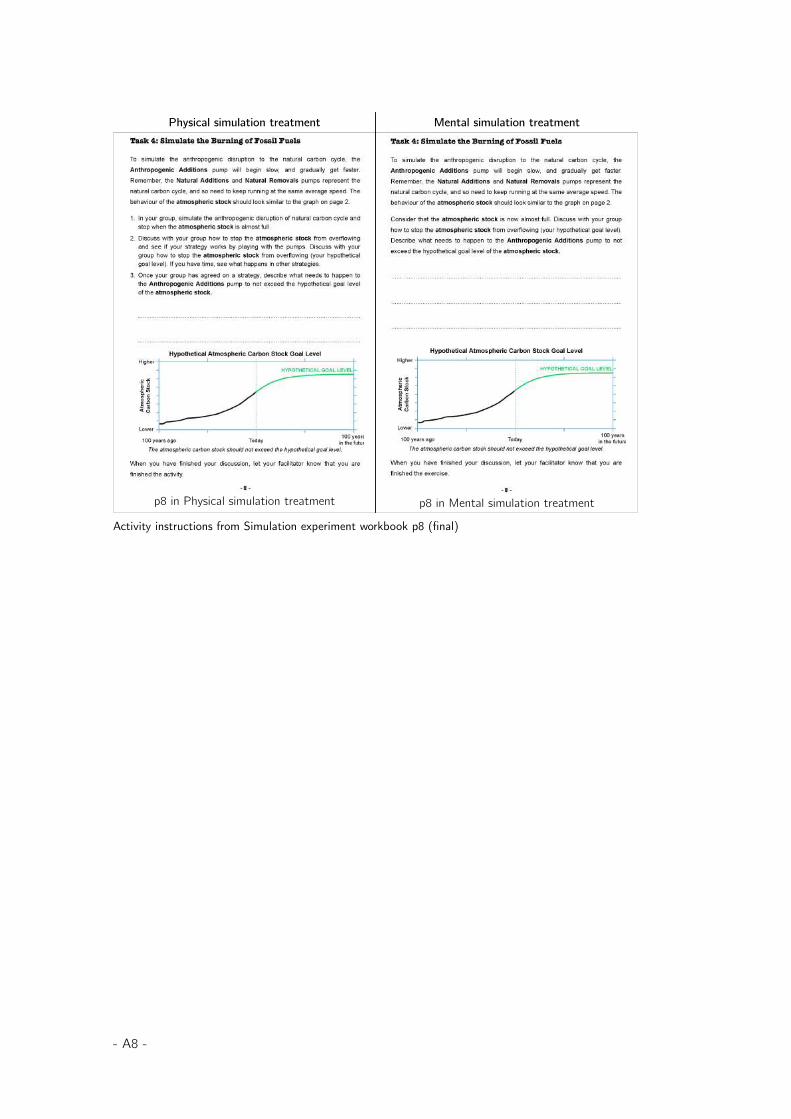
Physical simulation treatment Mental simulation treatment
p8 in Physical simulation treatment p8 in Mental simulation treatment
Activity instructions from Simulation experiment workbook p8 (final)
- A8 -
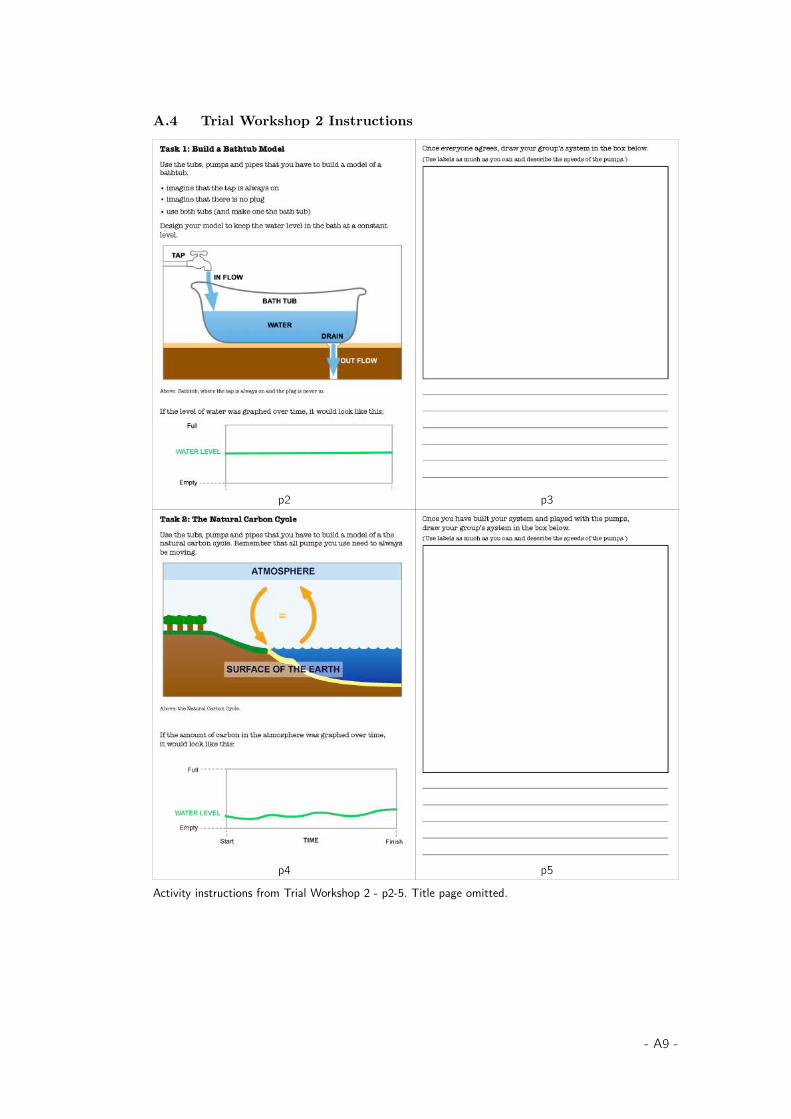
A.4 Trial Workshop 2 Instructions
p2 p3
p4 p5
Activity instructions from Trial Workshop 2 - p2-5. Title page omitted.
- A9 -
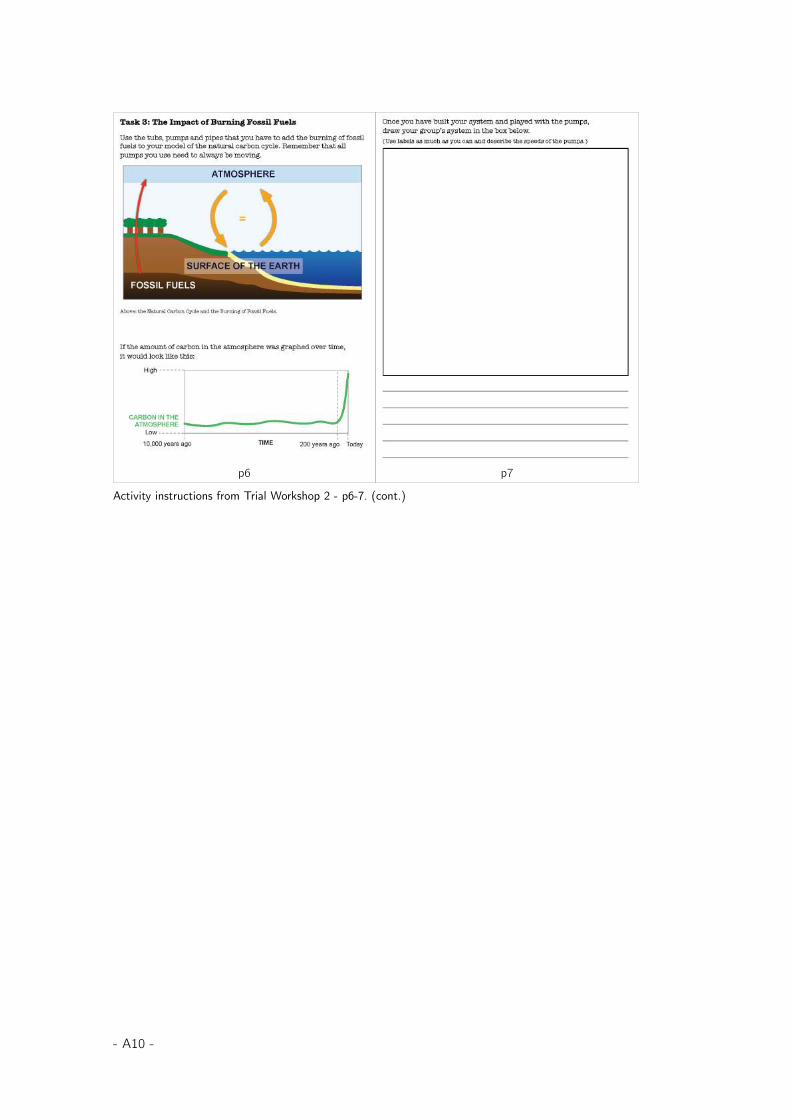
p6 p7
Activity instructions from Trial Workshop 2 - p6-7. (cont.)
- A10 -
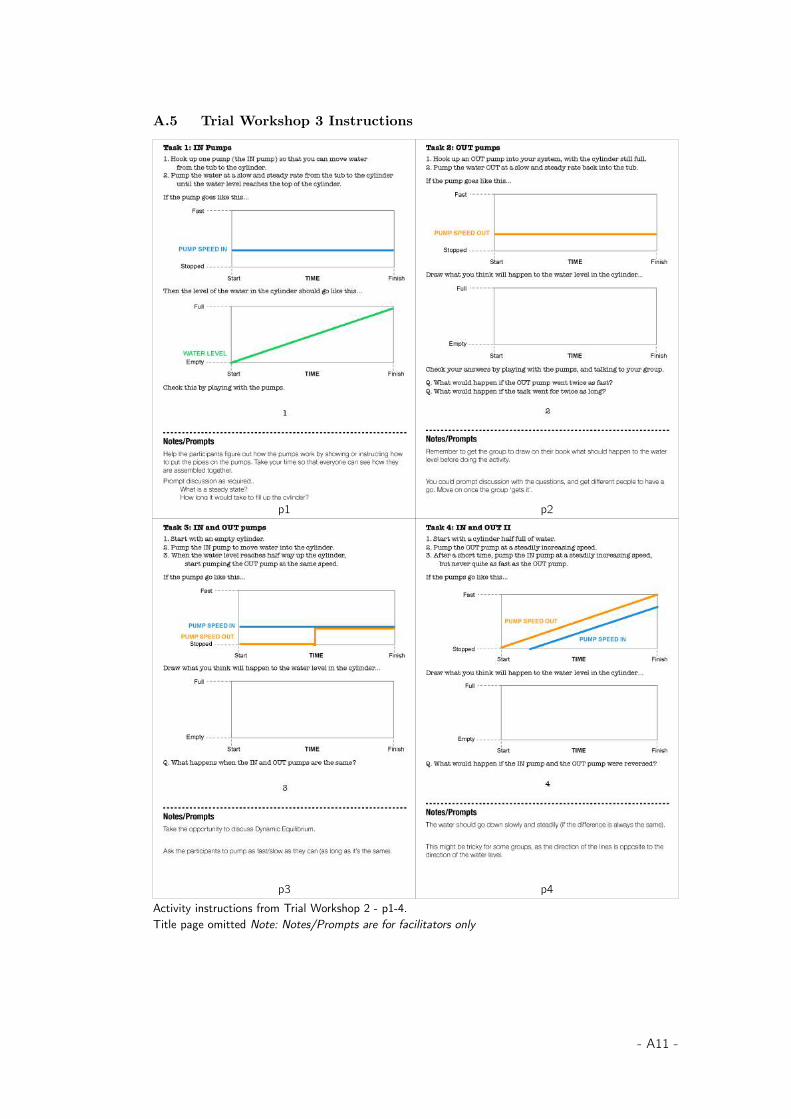
A.5 Trial Workshop 3 Instructions
p1 p2
p3 p4Activity instructions from Trial Workshop 2 - p1-4. Title page omitted Note: Notes/Prompts are for facilitators only
- A11 -
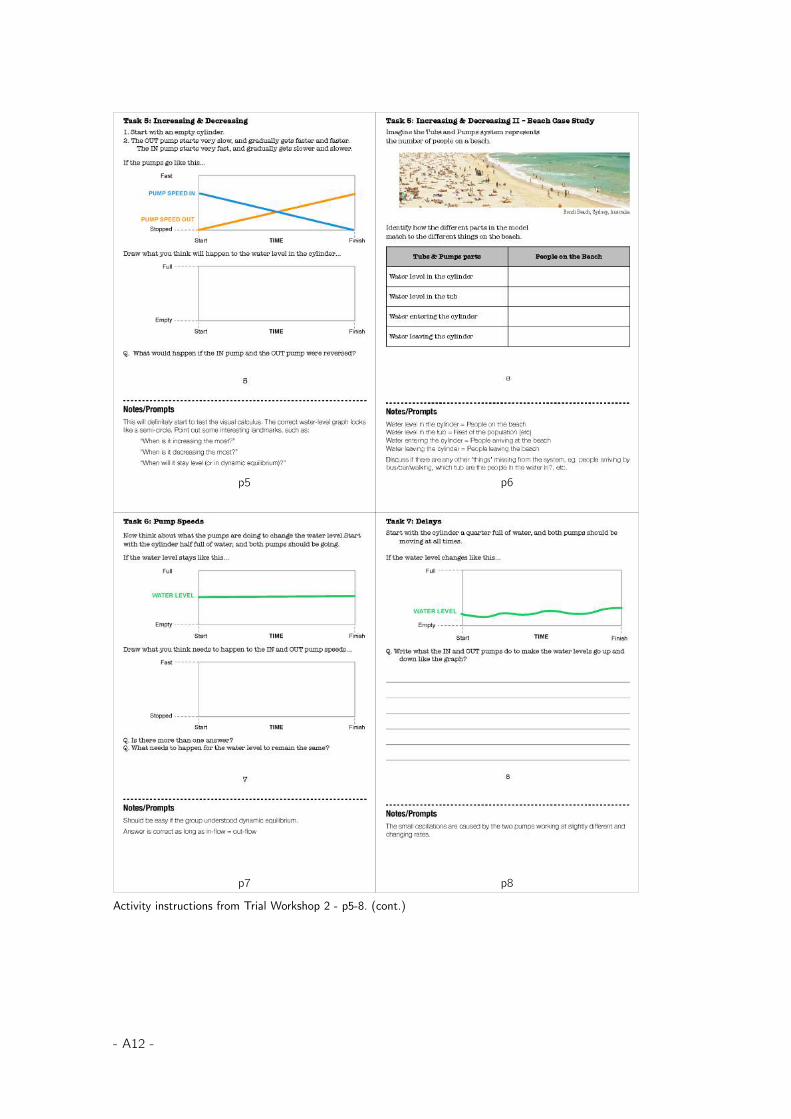
p5 p6
p7 p8
Activity instructions from Trial Workshop 2 - p5-8. (cont.)
- A12 -

p9 p10
p11 p12
Activity instructions from Trial Workshop 3 p9-12. (cont.)
- A13 -
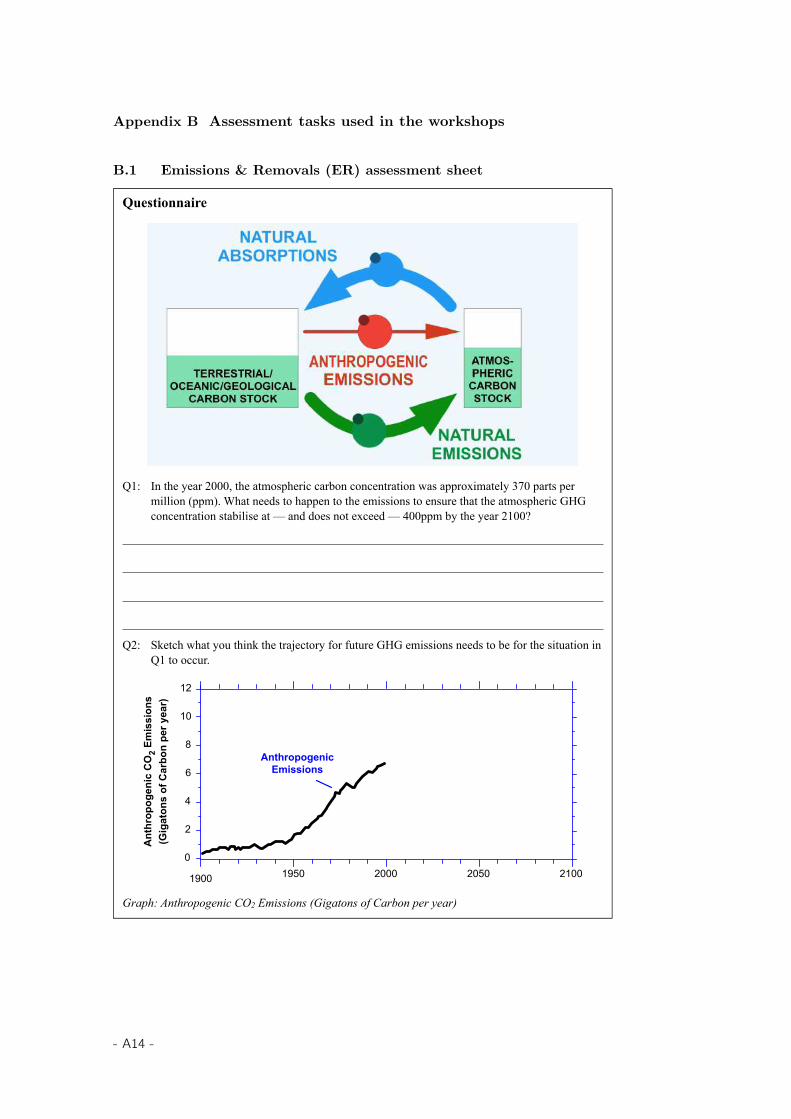
Appendix B Assessment tasks used in the workshops
B.1 Emissions & Removals (ER) assessment sheet
Questionnaire
Q1: In the year 2000, the atmospheric carbon concentration was approximately 370 parts per million (ppm). What needs to happen to the emissions to ensure that the atmospheric GHG concentration stabilise at — and does not exceed — 400ppm by the year 2100?
Q2: Sketch what you think the trajectory for future GHG emissions needs to be for the situation in Q1 to occur.
Graph: Anthropogenic CO2 Emissions (Gigatons of Carbon per year)
12
10
8
6
4
2
0
1900 1950 2000 2050 2100
AnthropogenicEmissions
Ant
hrop
ogen
ic C
O2
Emis
sion
s(G
igat
ons
of C
arbo
n pe
r yea
r)
- A14 -
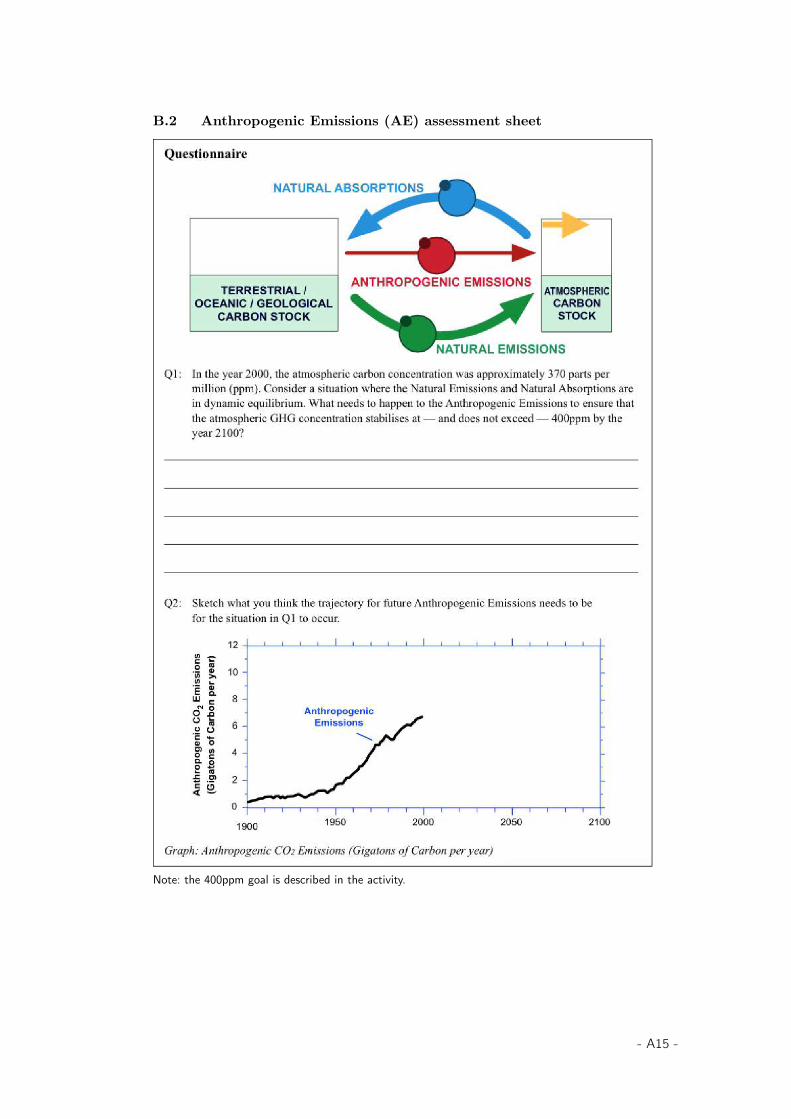
B.2 Anthropogenic Emissions (AE) assessment sheet
Note: the 400ppm goal is described in the activity.
- A15 -
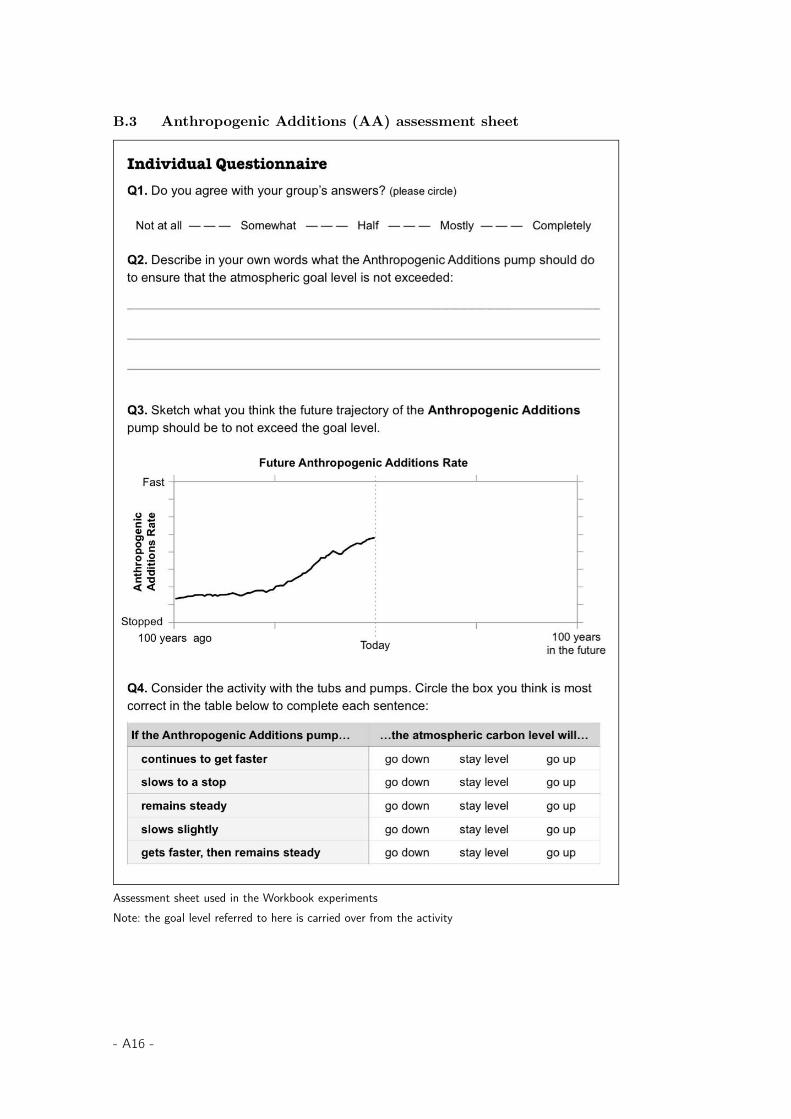
B.3 Anthropogenic Additions (AA) assessment sheet
Assessment sheet used in the Workbook experimentsNote: the goal level referred to here is carried over from the activity
- A16 -

B.4 Profile questionnaire
The profile questionnaire used across workshops Note: in the Mental simulation treatment condition, Q6was omitted. The age categories under 16 and 16-17 was added for Trial Workshop 2, which includedhigh school students.
- A17 -
Appendix C Video transcripts
C.1 Checklist experiment video transcript
Consider the problem of greenhouse gas emissions. In 2001 the IntergovernmentalPanel on Climate Change (IPCC), a scientific panel organised by the United Nations,concluded that the Earth's climate system is unequivocally warming. They attributethis to human activities, which cause warming through processes that increaseconcentrations of greenhouse gases in the atmosphere, such as deforestation andburning fossil fuels. In recent years, many countries have been looking for a solutionto reduce greenhouse gas emissions, such as through taxes or emissions tradingschemes. We are going to do a quick activity to see what the likely effect of suchinterventions could be. The climate system is an extremely complex system, withmany interrelated parts and components.
One way to consider a complex problem is to reduce it to its key drivers. In thecarbon cycle, the four largest 'stocks' of carbon are the Oceans, Terrestrial andGeological structures, and the Atmosphere. Carbon is a part of all living things, andpasses through the carbon cycle in varying ways and at varying rates. The ocean isthe largest carbon stock, with much of the carbon being stored in cooler, deeperregions. Fossil fuels and geological structures are the next largest store, followed byterrestrial stores, such as soils and plants. The Atmosphere is the smallest store,containing a much smaller amount than the Terrestrial, Geological and Oceanicstores combined. Remember that we are building a simple model, so there are otherstocks and relationships not shown here, but these are considered the key stocks. Theunits used here are Gigatons of Carbon.
The next aspect of the carbon cycle is how much carbon moves between these stocks.The natural cycles can be considered as fairly consistent, with about the sameamount of carbon being absorbed as being emitted. Though, these processes areincreasingly becoming out of sync, as, for example, deforestation makes it moredifficult for terrestrial sources to absorb carbon, leading to more carbon in theatmosphere, resulting in warmer surface temperatures. The major change to thecycle, however, is the burning of fossil fuels. It is interesting to note how small thisflow is compared to the much larger numbers exchanged naturally, but that thisemission is of major concern. The units for the flows used here are Gigatons ofCarbon per year. Again, remember that we are building a simple model, so smallerflows, such as volcanic activity accounting for 0.2GtC/year, aren't considered here.
- A18 -

So how does this help us understand what we can do about greenhouse gasemissions? We can use this simple model to build a simple physical analogue of thissystem to help us understand the problem space. Let's consider the Terrestrial,Oceanic, and Geological carbon stock as water in a container. The more water that isin the tub, the more carbon is held in the stock. The atmosphere is represented by asmaller and separate container, with a much smaller amount of water in it. Thecontainers are connected by tubes that allow the water to transfer between them.These represent the natural emissions, the natural absorptions and the anthro-pogenic — or human-related — emissions.
The rate at which the water flows through the tubes is determined by a pump, whichwe can control. If we only pump the natural emissions, the atmospheric carbon levelwill rise. Likewise, if we only pump the natural absorptions, the atmospheric carbonlevel will fall. And if we only pump the anthropogenic emissions, the atmosphericcarbon level will rise. Note that it is moving at a very slow rate compared to thenatural processes. If we pump the natural emissions and the natural absorptions atsimilar rates — even if those rates change — the amount of carbon in theatmosphere will remain stable. This is called 'dynamic' equilibrium. This scenario issimilar to what was happening on Earth before the industrial revolution.
Let's start pumping the anthropogenic emissions to see what happens. Very slowly atfirst, but eventually a rapid rise. Remember, although it was a relatively smallnumber, it flows each year and over time that can lead to a big increase in theatmospheric carbon stock level - or the atmospheric carbon concentration. Looking atthis graph, it becomes plain to see that something needs to change in this system ifwe are to reach a stable atmospheric carbon concentration of, for example, 400ppm.One of the suggested changes is for countries to reduce their emissions.
Let's have a look at what the anthropogenic emissions pump was doing in theexample before. We are using a simple scale here that one revolution of the pumpoccurs every time one gigaton of carbon is released each decade. The industrialrevolution kickstarted an increase in anthropogenic carbon emissions, and since theSecond World War emissions have continued to rise at an increased rate. One policyresponse is to reduce emissions back to 1990 levels, or rates.
The question then becomes, will reducing emissions back to 1990 rates, help to levelout the greenhouse gas concentrations? In groups of three, you will explore thedynamics of this simple system. One person will take on the role of NaturalAbsorptions, one will take on the role of Natural Emissions, and one will take on therole of Anthropogenic Emissions. You might also have a fourth person to helpinstruct and observe.
Good luck!
[END]
- A19 -

C.2 Workbook experiment video transcript
Note: the Simulation workshop had two videos - one for the physical simulation and one for the mentalsimulation experiment. The audio track for both videos is identical.
In this activity, you are going to build a model of the natural carbon cycle to look atthe role that burning fossil fuels has on the level of carbon in the atmosphere.
Your model includes: one small tub, one larger tub, pipes for connecting, three handpumps, and water. There are some rules for the activity: explore the activity by usingthe model, while working as a group, there are no ‘wrong’ answers, and remember tohave fun!
In the Earth system, carbon moves naturally between major stocks, such as theoceans, soil, plants and the atmosphere. The atmosphere holds many times lesscarbon than the combined stocks in the oceans, soil and plants, but changes in theatmospheric carbon level can change the Earth’s climate. In the natural cycle, thecarbon additions and removals from the atmosphere occur at approximately thesame. The burning of fossil fuels adds carbon to the atmosphere, but the amounts arerelatively small compared to those involved in the natural cycle.
The amount of carbon in the atmosphere has remained approximately the same forthe last 10,000 years. However, the level has increased significantly over the last 200years due to human activity, such as the burning of fossil fuels.
You’re now ready to work through the activity. Good luck!
[END]
- A20 -

Appendix D Reflections on trial workshops
In this section, I briefly discuss the evolution of the workshop design. Thisevolution occurred as a reflection of student behaviour in the workshopsdescribed in this thesis, and more importantly the workshops that were used astrial workshops. The complete list of workshop timings and participant cohortsare described in Table D.1, extending Table 4.13.
Table D.1: Summary of all workshop timings and courses
Workshop/Time Class/group (College)
Trial 1 Sem 1, 2013 VCUG3001 Unravelling Complexity (All colleges)
Checklist Sem 1, 2013 ENVS1001 Environment and Society (Science)COMP3530 Systems Engineering for Software Engineers (Comp.S)ENGN2225 Systems Engineering Design (Engineering)
Experimentation Sem 1, 2013 Last two groups: ENGN1211 Discovering Engineering (Engn)
Trial 2 June 2013 High School Outreach (Engineering)
Trial 3 June–November 2013
International System Dynamics Conference (Workshop)ENVS8003 Climate Change Vulnerability and Adaptation (Science)Primary School Outreach (Science Week)NYSF - National Youth Science Forum (national HS program)
Linear Pretest Sem 1, 2014 ENGN1211 Discovering Engineering (Engineering)
Simulation Sem 1, 2014 ENGN1211 Discovering Engineering (Engineering)
Dialogue Sem 1, 2014 ENVS1001 Environment and Society (Science)VCUG3001 Unravelling Complexity (All colleges)
Linear Cover Stories
Sem 1, 2014 ENGN2226 Systems Engineering Analysis (Engineering)
Note: I was the convener of ENGN2225 in 2013, and VCUG3001 and ENGN2226 in 2014.
- A21 -

In this section of the appendix, I describe the evolution of the assessment tasksand activities in relation to five observations:
1. Assessment confusionstudents simply being confused by what the test was asking them to do
2. Group discussionexperimentation with structured discussion prior to assessment
3. System assemblyexperimentation with participants constructing the system from scratch
4. Towards a learning activityexperimentation with focus on learning rather than assessment
5. Linear dynamicsexperimentation with pretests and linear exercises with different cover stories
D.1 Test confusion
Trial workshop 1 was the first real activity outside of the informal activities thatI had run within my research group. It was also the first group that did not haveany training in systems thinking. The assessment task for the activity is shown inFigure D.1. It shows a scenario where the carbon concentration drops andstabilises at approximately 340ppm, and asks participants to graph and write therequired trajectory for this to occur. This is the carbon stabilisation (340ppm)exercise from Sterman & Booth Sweeney (2002; 2007).
- A22 -
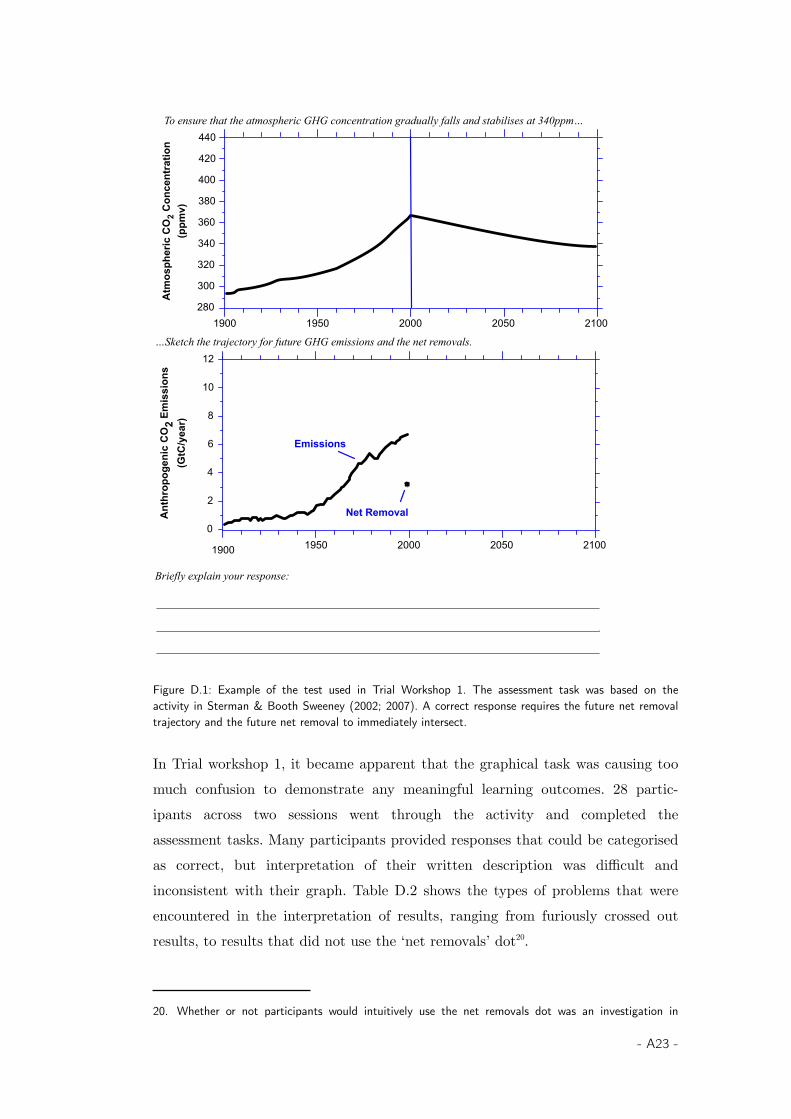
440
420
400
380
360
340
320
300
2801900 1950 2000 2050 2100
Atm
osph
eric
CO
2 C
once
ntra
tion
(ppm
v)
12
10
8
6
4
2
0
1900 1950 2000 2050 2100
Emissions
Ant
hrop
ogen
ic C
O2 E
mis
sion
s(G
tC/y
ear)
Net Removal
…Sketch the trajectory for future GHG emissions and the net removals.
To ensure that the atmospheric GHG concentration gradually falls and stabilises at 340ppm…
Briefly explain your response:
Figure D.1: Example of the test used in Trial Workshop 1. The assessment task was based on theactivity in Sterman & Booth Sweeney (2002; 2007). A correct response requires the future net removaltrajectory and the future net removal to immediately intersect.
In Trial workshop 1, it became apparent that the graphical task was causing toomuch confusion to demonstrate any meaningful learning outcomes. 28 partic-ipants across two sessions went through the activity and completed theassessment tasks. Many participants provided responses that could be categorisedas correct, but interpretation of their written description was difficult andinconsistent with their graph. Table D.2 shows the types of problems that wereencountered in the interpretation of results, ranging from furiously crossed outresults, to results that did not use the ‘net removals’ dot20.
20. Whether or not participants would intuitively use the net removals dot was an investigation in
- A23 -
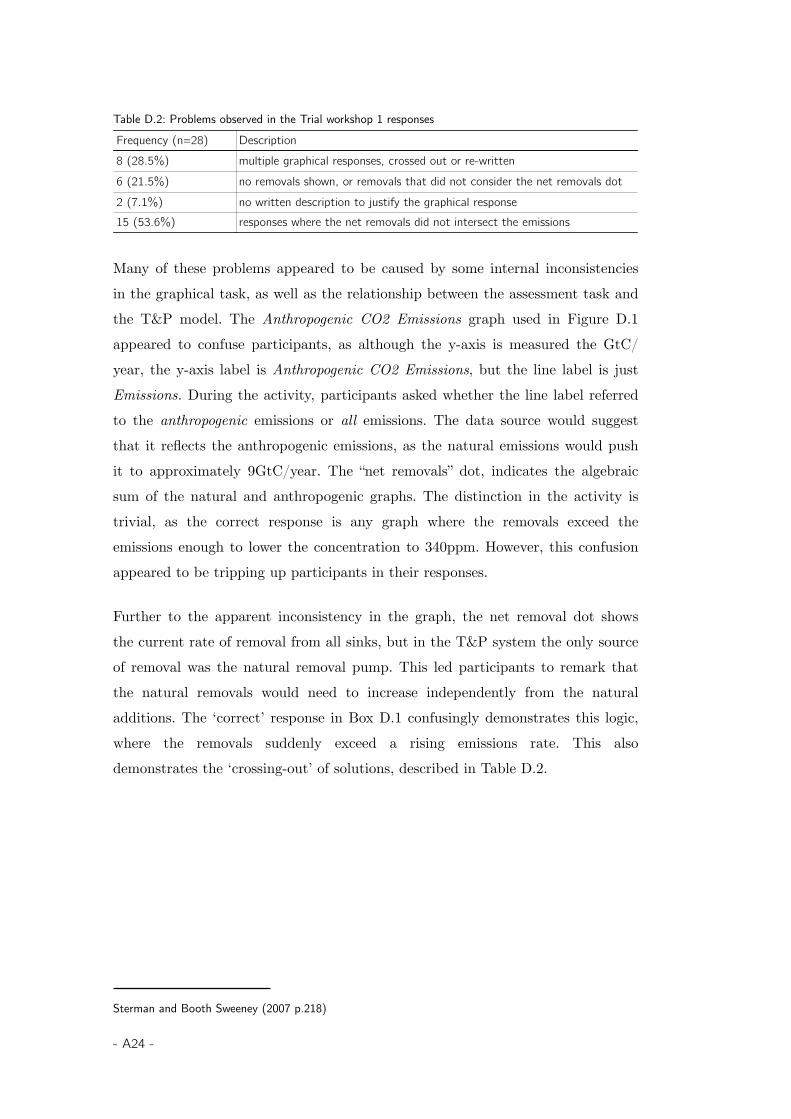
Table D.2: Problems observed in the Trial workshop 1 responsesFrequency (n=28) Description8 (28.5%) multiple graphical responses, crossed out or re-written6 (21.5%) no removals shown, or removals that did not consider the net removals dot2 (7.1%) no written description to justify the graphical response15 (53.6%) responses where the net removals did not intersect the emissions
Many of these problems appeared to be caused by some internal inconsistenciesin the graphical task, as well as the relationship between the assessment task andthe T&P model. The Anthropogenic CO2 Emissions graph used in Figure D.1appeared to confuse participants, as although the y-axis is measured the GtC/year, the y-axis label is Anthropogenic CO2 Emissions, but the line label is justEmissions. During the activity, participants asked whether the line label referredto the anthropogenic emissions or all emissions. The data source would suggestthat it reflects the anthropogenic emissions, as the natural emissions would pushit to approximately 9GtC/year. The “net removals” dot, indicates the algebraicsum of the natural and anthropogenic graphs. The distinction in the activity istrivial, as the correct response is any graph where the removals exceed theemissions enough to lower the concentration to 340ppm. However, this confusionappeared to be tripping up participants in their responses.
Further to the apparent inconsistency in the graph, the net removal dot showsthe current rate of removal from all sinks, but in the T&P system the only sourceof removal was the natural removal pump. This led participants to remark thatthe natural removals would need to increase independently from the naturaladditions. The ‘correct’ response in Box D.1 confusingly demonstrates this logic,where the removals suddenly exceed a rising emissions rate. This alsodemonstrates the ‘crossing-out’ of solutions, described in Table D.2.
Sterman and Booth Sweeney (2007 p.218)
- A24 -
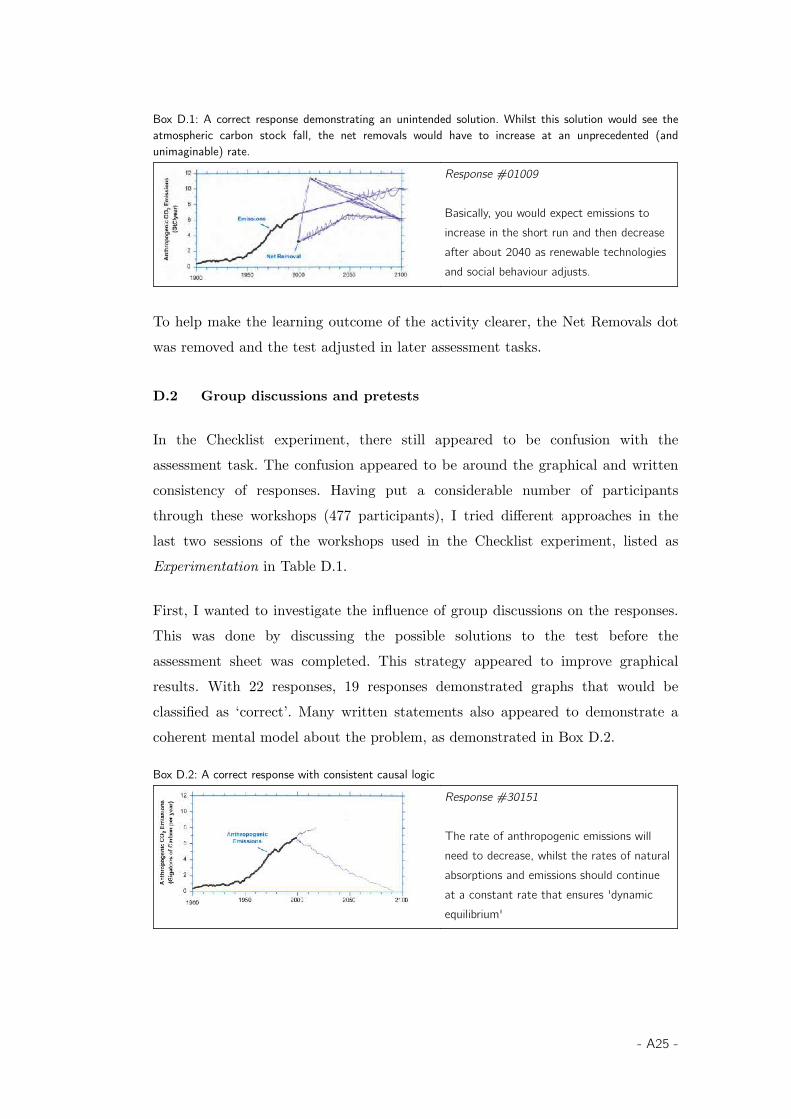
Box D.1: A correct response demonstrating an unintended solution. Whilst this solution would see theatmospheric carbon stock fall, the net removals would have to increase at an unprecedented (andunimaginable) rate.
Response #01009
Basically, you would expect emissions to increase in the short run and then decrease after about 2040 as renewable technologies and social behaviour adjusts.
To help make the learning outcome of the activity clearer, the Net Removals dotwas removed and the test adjusted in later assessment tasks.
D.2 Group discussions and pretests
In the Checklist experiment, there still appeared to be confusion with theassessment task. The confusion appeared to be around the graphical and writtenconsistency of responses. Having put a considerable number of participantsthrough these workshops (477 participants), I tried different approaches in thelast two sessions of the workshops used in the Checklist experiment, listed asExperimentation in Table D.1.
First, I wanted to investigate the influence of group discussions on the responses.This was done by discussing the possible solutions to the test before theassessment sheet was completed. This strategy appeared to improve graphicalresults. With 22 responses, 19 responses demonstrated graphs that would beclassified as ‘correct’. Many written statements also appeared to demonstrate acoherent mental model about the problem, as demonstrated in Box D.2.
Box D.2: A correct response with consistent causal logic
Response #30151
The rate of anthropogenic emissions will need to decrease, whilst the rates of naturalabsorptions and emissions should continue at a constant rate that ensures 'dynamic equilibrium'
- A25 -

Observing that a large proportion of participants that could arrive at a muchclearer response with a relatively small prompt was an interesting observation.There were two main concerns that I had with this approach. The first was therepeatability. In the discussion, I had left it open to participants to direct theoutcome of the class, and dominant participants may have had an undesiredeffect on the rest of the class. If this was the case, it did not necessarily helpimprove individual participants’ understanding about stocks and flows. Thesecond concern was that these dominant participants could have directed thegroup towards an incorrect answer, meaning that the activity may have indirectlyconfused participants.
I also wanted to investigate whether responses changed throughout the activity. Ihad initially made the decision to use Sterman & Booth Sweeney’s observationthat understanding of stocks and flows was poor as the starting point for thestudy. Together with observations that a pre-test/post-test methodology couldhave other hidden effects, such as priming students, meant that no ‘pre-test’ wasused in the T&P activity. The effect of using a pre-test was, however, anunknown consideration in the workshop design. As a trial, I gave the sameassessment task to participants before (test 1) and after (test 2) the activity, aswell as after the discussion of solutions (test 3).
There were 26 students in this trial group. Over the three tests, the frequency of‘correct’ and ‘decrease’ graphical responses increased, and the frequency of‘stabilise’ and ‘increase’ graphical responses reduced. These results are shown inTable D.3, along with the relative changes of responses. Thirteen (50%) of theparticipants did not change their response between test 1 and test 3. 9 partic-ipants (35%) improved their response between test 1 and test 2, and a further 2participants (8%) improved their response between test 2 and test 3.
- A26 -
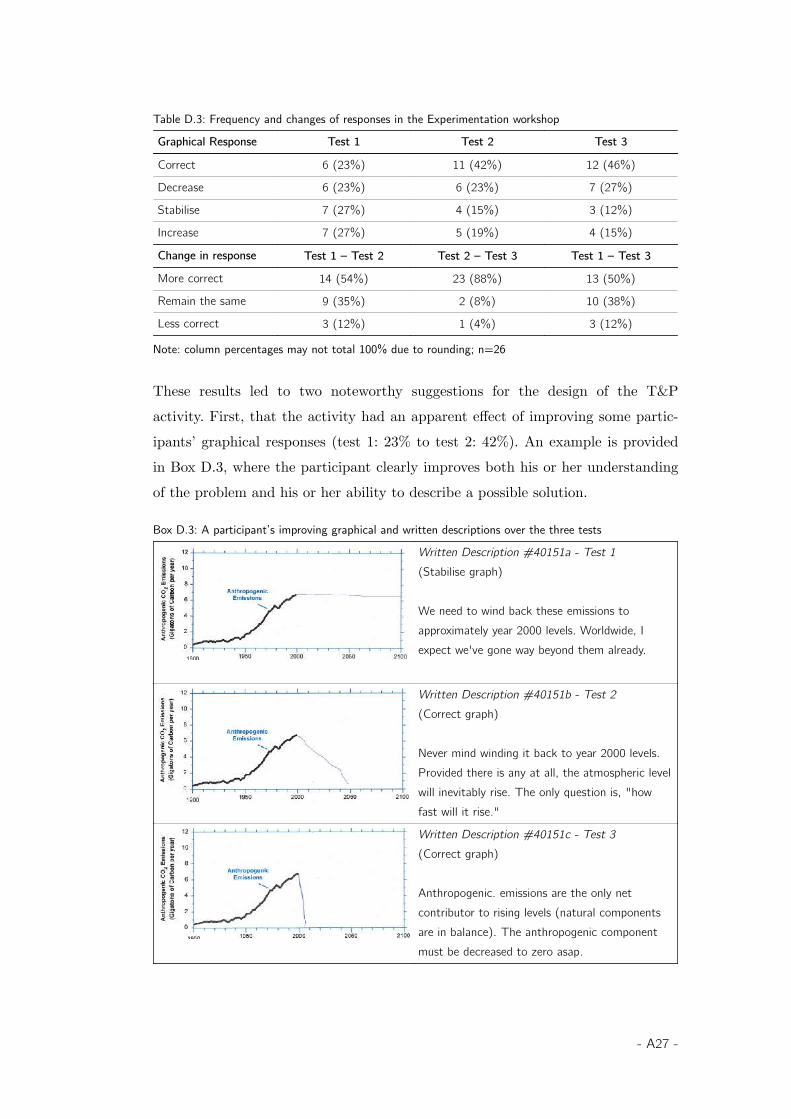
Table D.3: Frequency and changes of responses in the Experimentation workshop
Graphical Response Test 1 Test 2 Test 3
Correct 6 (23%) 11 (42%) 12 (46%)
Decrease 6 (23%) 6 (23%) 7 (27%)
Stabilise 7 (27%) 4 (15%) 3 (12%)
Increase 7 (27%) 5 (19%) 4 (15%)
Change in response Test 1 – Test 2 Test 2 – Test 3 Test 1 – Test 3
More correct 14 (54%) 23 (88%) 13 (50%)
Remain the same 9 (35%) 2 (8%) 10 (38%)
Less correct 3 (12%) 1 (4%) 3 (12%)
Note: column percentages may not total 100% due to rounding; n=26
These results led to two noteworthy suggestions for the design of the T&Pactivity. First, that the activity had an apparent effect of improving some partic-ipants’ graphical responses (test 1: 23% to test 2: 42%). An example is providedin Box D.3, where the participant clearly improves both his or her understandingof the problem and his or her ability to describe a possible solution.
Box D.3: A participant’s improving graphical and written descriptions over the three tests
Written Description #40151a - Test 1(Stabilise graph)
We need to wind back these emissions to approximately year 2000 levels. Worldwide, I expect we've gone way beyond them already.
Written Description #40151b - Test 2(Correct graph)
Never mind winding it back to year 2000 levels. Provided there is any at all, the atmospheric levelwill inevitably rise. The only question is, "how fast will it rise."
Written Description #40151c - Test 3(Correct graph)
Anthropogenic. emissions are the only net contributor to rising levels (natural components are in balance). The anthropogenic component must be decreased to zero asap.
- A27 -
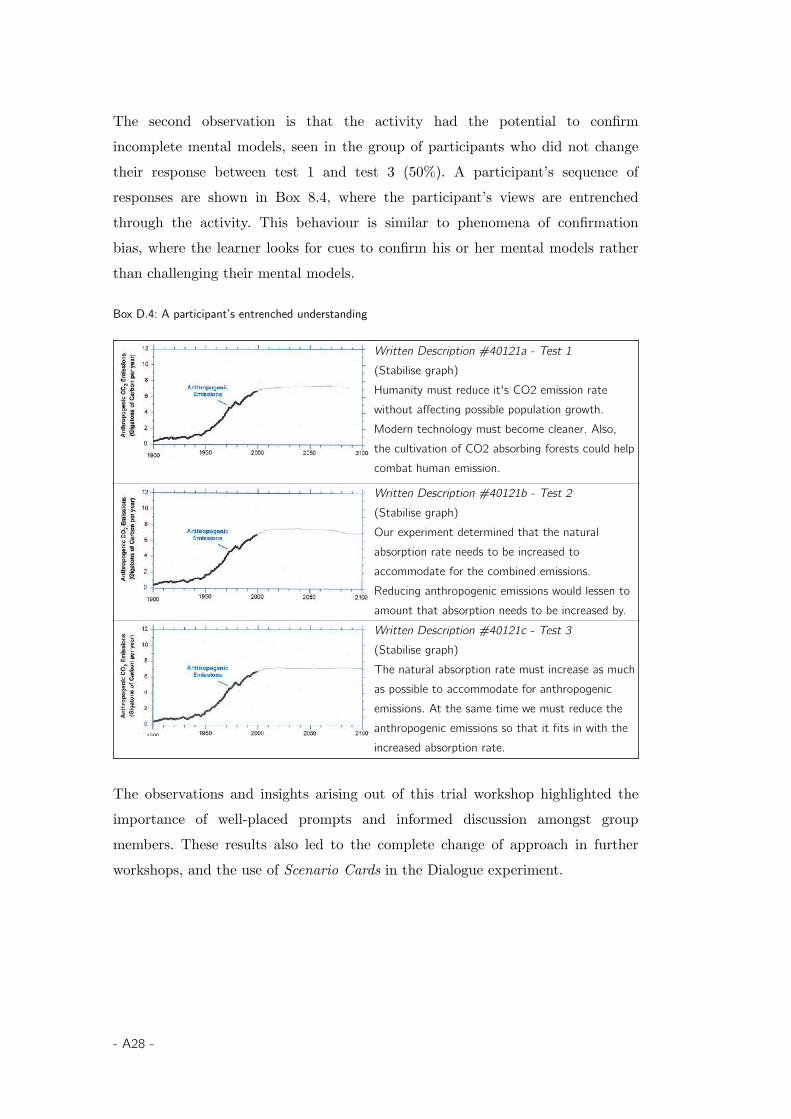
The second observation is that the activity had the potential to confirmincomplete mental models, seen in the group of participants who did not changetheir response between test 1 and test 3 (50%). A participant’s sequence ofresponses are shown in Box 8.4, where the participant’s views are entrenchedthrough the activity. This behaviour is similar to phenomena of confirmationbias, where the learner looks for cues to confirm his or her mental models ratherthan challenging their mental models.
Box D.4: A participant’s entrenched understanding
Written Description #40121a - Test 1(Stabilise graph)Humanity must reduce it's CO2 emission rate without affecting possible population growth. Modern technology must become cleaner. Also, the cultivation of CO2 absorbing forests could helpcombat human emission.
Written Description #40121b - Test 2(Stabilise graph)Our experiment determined that the natural absorption rate needs to be increased to accommodate for the combined emissions. Reducing anthropogenic emissions would lessen to amount that absorption needs to be increased by.Written Description #40121c - Test 3(Stabilise graph)The natural absorption rate must increase as muchas possible to accommodate for anthropogenic emissions. At the same time we must reduce the anthropogenic emissions so that it fits in with the increased absorption rate.
The observations and insights arising out of this trial workshop highlighted theimportance of well-placed prompts and informed discussion amongst groupmembers. These results also led to the complete change of approach in furtherworkshops, and the use of Scenario Cards in the Dialogue experiment.
- A28 -
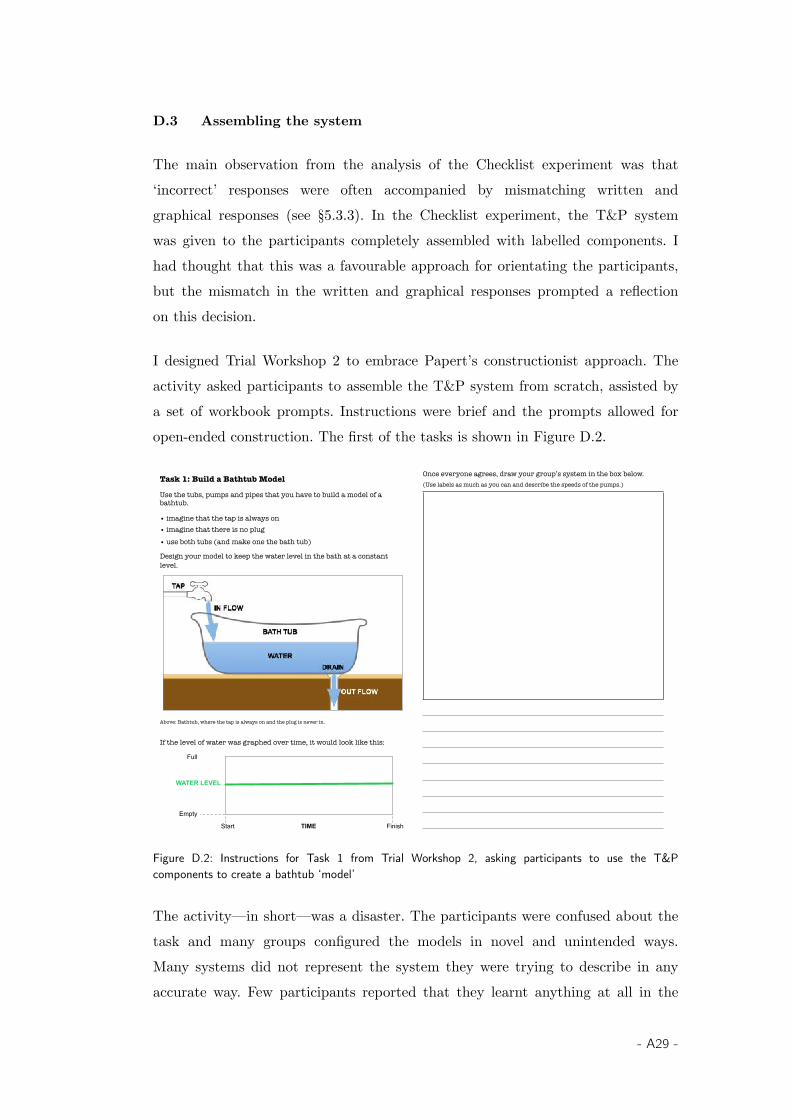
D.3 Assembling the system
The main observation from the analysis of the Checklist experiment was that‘incorrect’ responses were often accompanied by mismatching written andgraphical responses (see §5.3.3). In the Checklist experiment, the T&P systemwas given to the participants completely assembled with labelled components. Ihad thought that this was a favourable approach for orientating the participants,but the mismatch in the written and graphical responses prompted a reflectionon this decision.
I designed Trial Workshop 2 to embrace Papert’s constructionist approach. Theactivity asked participants to assemble the T&P system from scratch, assisted bya set of workbook prompts. Instructions were brief and the prompts allowed foropen-ended construction. The first of the tasks is shown in Figure D.2.
Task 1: Build a Bathtub Model
Use the tubs, pumps and pipes that you have to build a model of a bathtub.
• imagine that the tap is always on• imagine that there is no plug
• use both tubs (and make one the bath tub)
Design your model to keep the water level in the bath at a constant level.
Above: Bathtub, where the tap is always on and the plug is never in.
If the level of water was graphed over time, it would look like this:
Empty
WATER LEVEL
Full
Start FinishTIME
Once everyone agrees, draw your group’s system in the box below.(Use labels as much as you can and describe the speeds of the pumps.)
Figure D.2: Instructions for Task 1 from Trial Workshop 2, asking participants to use the T&Pcomponents to create a bathtub ‘model’
The activity—in short—was a disaster. The participants were confused about thetask and many groups configured the models in novel and unintended ways.Many systems did not represent the system they were trying to describe in anyaccurate way. Few participants reported that they learnt anything at all in the
- A29 -
activity. It was clear that the task of assembling the T&P system required muchmore scaffolding than could be provided in a 1-hour session. Although thestudents completing the activity were of high school age, it wasn’t at all clearthat more senior students would perform any better.
Adding to this difficulty was an observation that I had made previously, but wasexacerbated by the general confusion in this activity. It concerned theterminology used to describe the carbon cycle, but was further highlighted withthe general confusion in this activity. The term ‘anthropogenic’ often confusedparticipants, but most of them understood what it meant. However, coupled withthe terms ‘emissions’ and ‘absorptions’, the conversations within groups wereoften confused. In later workshops, ‘emissions’ was replaced with ‘additions’ and‘absorptions’ was replaced with ‘removals’. This also had a clearer connection tothe container and bathtub metaphors described in Chapter 3.
This workshop helped me to understand the value of presenting a constructedmodel that participants could begin to manipulate without prior knowledge, andextend their learning from this point. I had thought that assembling the modelwould be a good starting point, and by assembling the system the participantswould better understand the system. However, through this activity it becameclear that labelling an already constructed model (that is, explicitly identifyingthe parts by sticking labels on the parts) would achieve a similar goal withoutthe possibility of total confusion.
This led to a modification in the Workbook experiment that involved placinglabels on the system components prior to starting the pumping activities, andcould be described as directed play rather than free play.
D.4 Using a learning activity
Trial Workshop 3 represented a useful shift in the way that I approached thedesign of the T&P activity in the Workbook workshops, and this section takes asmall detour as it describes a series of events that changed my own thinkingabout the activity.
- A30 -

The concept of having a test to evaluate the participant’s understanding had satuncomfortably with me, as it is widely known that doing well on a test does notmean that the knowledge is retained. Richmond’s (2010) generic structure of athe dissipation process comes to mind, as shown in Figure 6.1. The stock ofmemorised facts—such as those learnt to pass an exam—diminishes over timethrough a process of forgetting. This decay is related to the size of the stock - themore facts learnt, the faster that facts will be forgotten.
I wanted to highlight the importance of the T&P metaphor as a tool for concretelearning, not as another learning exercise that will be forgotten. I wanted partic-ipants to leave the exercise seeing the world around them in terms of tubs,pumps and interactions, the same way that systems thinkers see the world interms of stocks, flows and feedback. I removed the assessment task from theactivity, and set about building a better learning activity.
In the Trial Workshop 2, I tried to reduce the frequency of mismatched writtenand graphical responses by prompting participants to construct the system. Inthe Trial Workshop 3, I tried to achieve the same goal by giving participantsexperience of distinguishing stocks and flows. Many of the mismatched responsessuggested that the participants were “pattern matching” – using the “correlationheuristic”. If participants could see graphical examples of stock-and-flowbehaviour over time before drawing their own graphs, then perhaps the frequencyof mismatched responses could be reduced.
In the checklist experiment, only an A4 prompting sheet was given (see materialin §A.1). In Trial Workshop 3, tasks from the prompting sheet were used withgraphical representations laid out in a similar way to the assessment task. Thetwo tasks shown in Box D.3 are conceptually the same tasks as those given in thefirst two tasks of the A4 prompting sheet used in the Checklist activity. However,the graphical representation prompt participants to consider the what thebehaviour over time graph would look like.
- A31 -
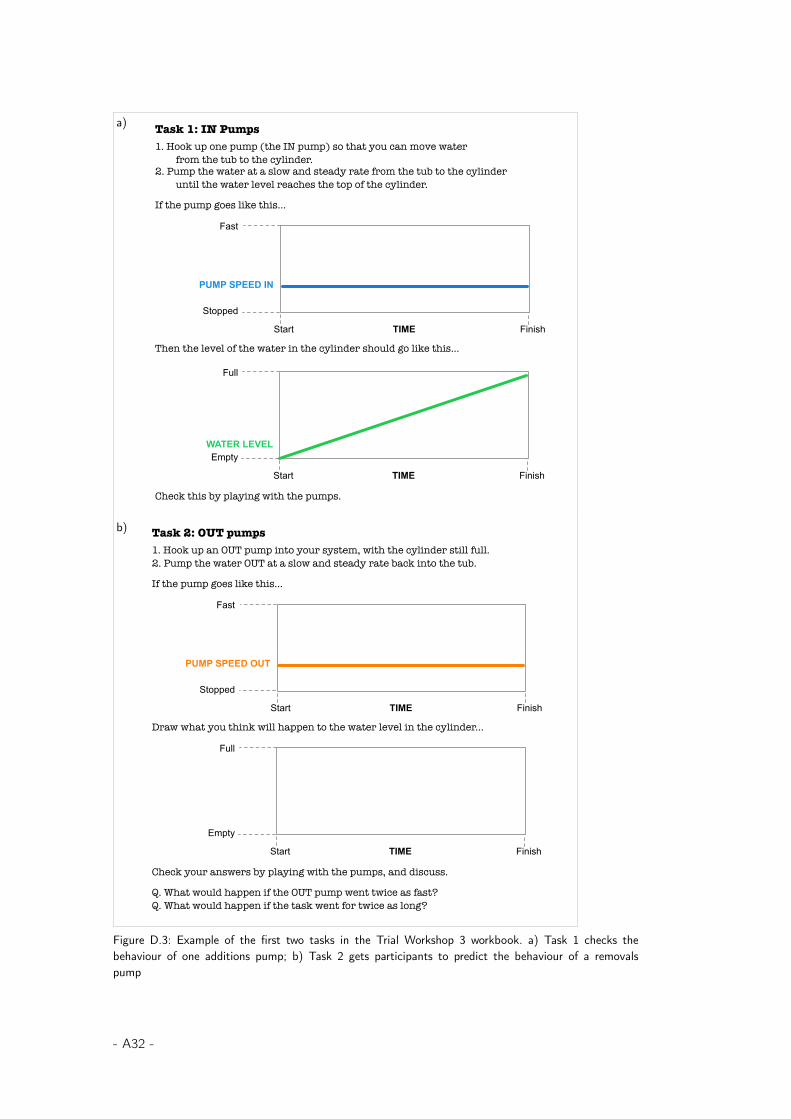
a) Task 1: IN Pumps1. Hook up one pump (the IN pump) so that you can move water
from the tub to the cylinder.2. Pump the water at a slow and steady rate from the tub to the cylinder
until the water level reaches the top of the cylinder.
If the pump goes like this…
Then the level of the water in the cylinder should go like this…
Check this by playing with the pumps.
Stopped
PUMP SPEED IN
Fast
Start FinishTIME
EmptyWATER LEVEL
Full
Start FinishTIME
b) Task 2: OUT pumps1. Hook up an OUT pump into your system, with the cylinder still full.2. Pump the water OUT at a slow and steady rate back into the tub.
If the pump goes like this…
Draw what you think will happen to the water level in the cylinder...
Check your answers by playing with the pumps, and discuss.
Q. What would happen if the OUT pump went twice as fast?Q. What would happen if the task went for twice as long?
Stopped
PUMP SPEED OUT
Fast
Start FinishTIME
Empty
Full
Start FinishTIME
Figure D.3: Example of the first two tasks in the Trial Workshop 3 workbook. a) Task 1 checks thebehaviour of one additions pump; b) Task 2 gets participants to predict the behaviour of a removalspump
- A32 -
In all, there were nine tasks that progressively went from a one-pump systemshown in Figure D.3 to a three-pump system described in the T&P system of thecarbon cycle. Participants demonstrated an understanding of how the T&Pmetaphor (the conceptual source domain) worked, before applying it to carboncycle (the conceptual target domain). Participants were thinking through theproblems in terms of the T&P system. As Draper (2010) describes, the systemsconcepts were apparently transparent.
The discussions that followed this trial workshop were also the richest that I hadobserved. The first I recount in §6.4. The second took place after I presented theT&P activity at the 2013 International System Dynamics Conference in Boston.The small group of participants had a deep and engaging discussion about theuniversality of the activity as a learning tool for systems concepts, particularly inprimary schools. Computer simulation has rightly dominated the field of systemdynamics. Although the computer allows for powerful simulation, it can be seenas a ‘black box’, where commands are processed without students necessarilyunderstanding the underlying mechanism. The T&P activity was seen as a usefulexperiential introduction to systems by ST educators.
It was at this conference that I started a conversation, with Anne LeVigne andTracy Benson from the Waters Foundation and Lees Stunz from the CreativeLearning Exchange, on developing the T&P activity into an broader educationalactivity. This conversation continues, and they have prototyped and modifiedtheir own versions for use in primary schools.
These discussions prompted me to remember an observation that I had madebefore the formal phase of my dissertation experiments began, and I was stilldeveloping the T&P activity. Barry Newell ran an informal exercise (which Iwould later develop into the T&P activity) as a tutorial demonstration inENGN3410 Engineering Sustainable Systems in semester 2, 2012.
It involved the pumps, a bucket and a beer glass. We were using the activity tocomplement the weekly reading on the systems basics (chapter 1 of Meadows,2008) to help students identify simple system behaviour. In a relatively free-form
- A33 -

demonstration of ‘bathtub’ dynamics, we had asked the students to operate thepumps as fast as possible. Of course, the water level didn’t change significantlyeven though the pump operators were furiously pumping.
Many weeks later, we were discussing the system archetypes in a tutorial. Wewere talking about the ‘escalation’ archetype, and a student reminded the classabout the activity we had run with the pumps, remarking that the competingincreased effort in the balancing loops were like the pumps getting faster andfaster, and the only way to stop this was to ‘let go’ (stop pumping). Similar tothe primary school student, this student had used the pumps as a problemsolving tool, a tool for concrete learning, and as a lens through which to see theworld.
These observations led to further changes in the activities. The workbookappeared to provide a useful prompt for participants. The number of tasks werereduced from nine to five, removing some duplication. However, I also wanted toexplore some additional aspects of the experiment: first, the effect of asking thegroup to agree to a solution before undertaking the individual test. This becamethe GD treatment in the Dialogue experiment. Second, the effect of promptingparticipants towards the solution by presenting them with a number of scenariosshowing a graph with a matching written description. This became the SCtreatment in the Dialogue experiment. Finally, I wanted to investigate the effectof playing with the pumps or just viewing a pictorial representation of the pumpsystem. This became the Mental simulation treatment in the Simulationworkshop.
To make any valid comparison to the earlier workshops, I decided to keep theassessment task from the Checklist workshops in the experiment. My experiencesdid, however, prompt a number of subtle changes. First, in line with the groupdiagram treatment, I wanted to investigate whether the individual thought thatthe group had affected their answer, so a 5-point Likert scale from ‘not at all’ to‘completely’ was used to ask to what extent did you agree with your group.Second, I wanted to test the participant’s causal logic separate from the graphicalresponse and written description as another way of interpreting theirunderstanding of the exercise. These are shown in §4.3.3. Third, I the y-axisnumerical scale from the graph was replaced with a relative scale, as many
- A34 -
students in the Checklist experiment had used the numbers to calculate thesolution rather than the conceptual source domain. This change is shown in§4.3.2.
The insights that I gained through these trial workshops do not contributedirectly to the results presented in Chapter 5, but do contextualise how theworkshops developed through challenging my own mental models about theproblem central to this thesis.
D.5 Linear dynamics
A linear dynamics task was used on two occasions towards the end of allworkshops: once as a pretest, and once to investigate the role of cover stories onthe assessment task. A pretest was intentionally not part of the learning activity.However, after observing the mismatch between written and graphical responsesin the earlier workshops, and the great improvement in results observed in trialworkshops, I decided to conduct a pretest in the Simulation experiment.
I also didn’t want to prime participants around the outcome of the T&P activityin the pre-test, so a simpler linear dynamics or ‘bathtub’ test was used (see Box2.1 as an example). The intention of including this test was to investigatewhether participants had the intuition to complete the visual integration taskwhen it involved linear dynamics, before testing the more complicated non-linearvisual integration task presented in the carbon cycle task. The graphicalcomponent of the test is shown in Figure D.4.
- A35 -
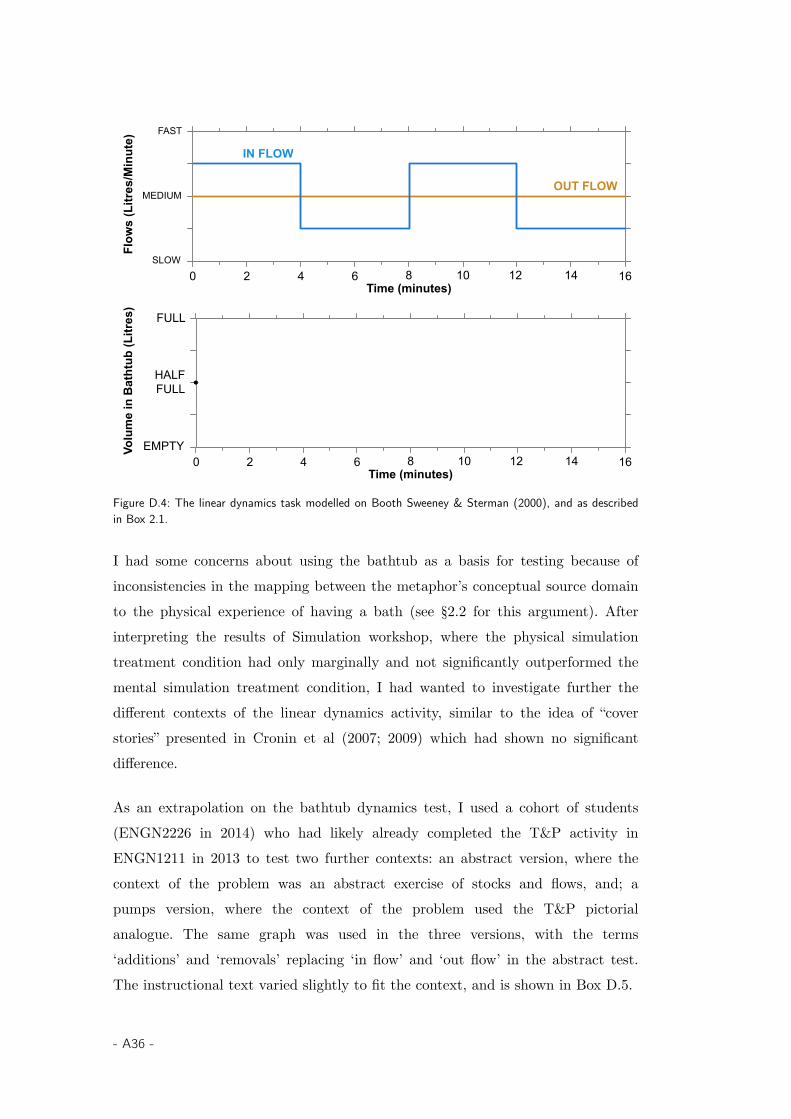
FAST
MEDIUM
SLOW
0
Flow
s (L
itres
/Min
ute)
2 4 6 8 10 12 14 16
IN FLOW
OUT FLOW
Time (minutes)
FULL
HALFFULL
EMPTY0
Volu
me
in B
atht
ub (L
itres
)
2 4 6 8 10 12 14 16Time (minutes)
Figure D.4: The linear dynamics task modelled on Booth Sweeney & Sterman (2000), and as describedin Box 2.1.
I had some concerns about using the bathtub as a basis for testing because ofinconsistencies in the mapping between the metaphor’s conceptual source domainto the physical experience of having a bath (see §2.2 for this argument). Afterinterpreting the results of Simulation workshop, where the physical simulationtreatment condition had only marginally and not significantly outperformed themental simulation treatment condition, I had wanted to investigate further thedifferent contexts of the linear dynamics activity, similar to the idea of “coverstories” presented in Cronin et al (2007; 2009) which had shown no significantdifference.
As an extrapolation on the bathtub dynamics test, I used a cohort of students(ENGN2226 in 2014) who had likely already completed the T&P activity inENGN1211 in 2013 to test two further contexts: an abstract version, where thecontext of the problem was an abstract exercise of stocks and flows, and; apumps version, where the context of the problem used the T&P pictorialanalogue. The same graph was used in the three versions, with the terms‘additions’ and ‘removals’ replacing ‘in flow’ and ‘out flow’ in the abstract test.The instructional text varied slightly to fit the context, and is shown in Box D.5.
- A36 -
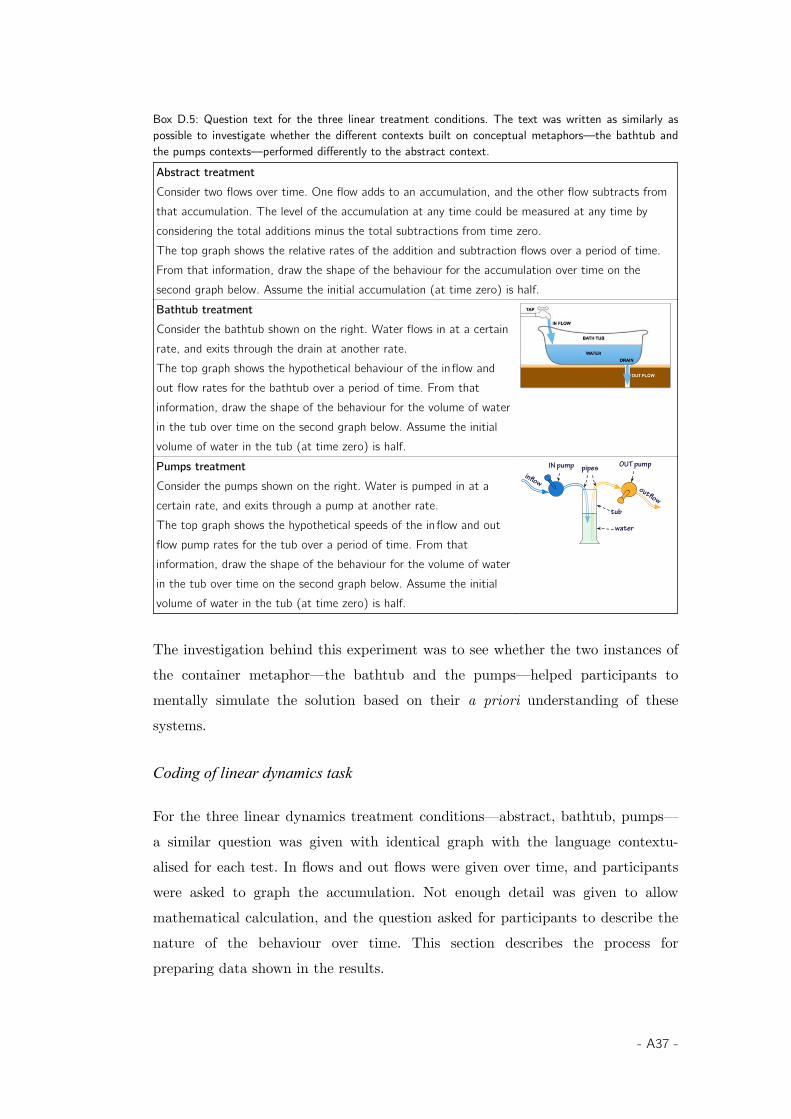
Box D.5: Question text for the three linear treatment conditions. The text was written as similarly aspossible to investigate whether the different contexts built on conceptual metaphors—the bathtub andthe pumps contexts—performed differently to the abstract context.Abstract treatmentConsider two flows over time. One flow adds to an accumulation, and the other flow subtracts from that accumulation. The level of the accumulation at any time could be measured at any time by considering the total additions minus the total subtractions from time zero. The top graph shows the relative rates of the addition and subtraction flows over a period of time. From that information, draw the shape of the behaviour for the accumulation over time on the second graph below. Assume the initial accumulation (at time zero) is half.Bathtub treatmentConsider the bathtub shown on the right. Water flows in at a certain rate, and exits through the drain at another rate.The top graph shows the hypothetical behaviour of the inflow and out flow rates for the bathtub over a period of time. From that information, draw the shape of the behaviour for the volume of waterin the tub over time on the second graph below. Assume the initial volume of water in the tub (at time zero) is half.Pumps treatmentConsider the pumps shown on the right. Water is pumped in at a certain rate, and exits through a pump at another rate.The top graph shows the hypothetical speeds of the inflow and out flow pump rates for the tub over a period of time. From that information, draw the shape of the behaviour for the volume of waterin the tub over time on the second graph below. Assume the initial volume of water in the tub (at time zero) is half.
tub
pipes OUT pump
water
outflow
inflow
IN pump
The investigation behind this experiment was to see whether the two instances ofthe container metaphor—the bathtub and the pumps—helped participants tomentally simulate the solution based on their a priori understanding of thesesystems.
Coding of linear dynamics task
For the three linear dynamics treatment conditions—abstract, bathtub, pumps—a similar question was given with identical graph with the language contextu-alised for each test. In flows and out flows were given over time, and participantswere asked to graph the accumulation. Not enough detail was given to allowmathematical calculation, and the question asked for participants to describe thenature of the behaviour over time. This section describes the process forpreparing data shown in the results.
- A37 -

The graphical responses for the linear dynamics test were categorised by shapeand relative amplitude and period using a rubric. A correct response needed tobe linear and periodic, with local maxima at t=4,12, with a local minima as half-full at t=0,8,16. Incorrect responses had one or more of the criteria not met. Thetypical categories are shown in Table D.4. Responses that did not fit into theseresponse categories were recorded as other.
Table D.4: Rubric for categorising graphical responses in the linear dynamics task
Criterion Category CorrectPartially incorrect Pattern
matchPeriodic
linear non-linearpoints shapeShape linear × × ×
non-linear × ×square-wave ×
Local t=4,12 × × ×maxima other t × ×Local half at t=0,8,16 × ×
× ×minima other t or amplitude ×
Category code correct CSIP CPIS PM PL PNL
As there was no numerical data given in the test, correct responses could have alocal maxima at any value higher than half-full and would still be categorised ascorrect. Partially incorrect responses had either an incorrect local maxima orminima or an incorrect shape (typically non-linear). Pattern-matching responseswere typically a square wave, and were coded as such at any amplitude. Periodiclinear and non-linear had local minima and maxima at different t. Examples oftypical graphical responses are shown Box D.6.
- A38 -
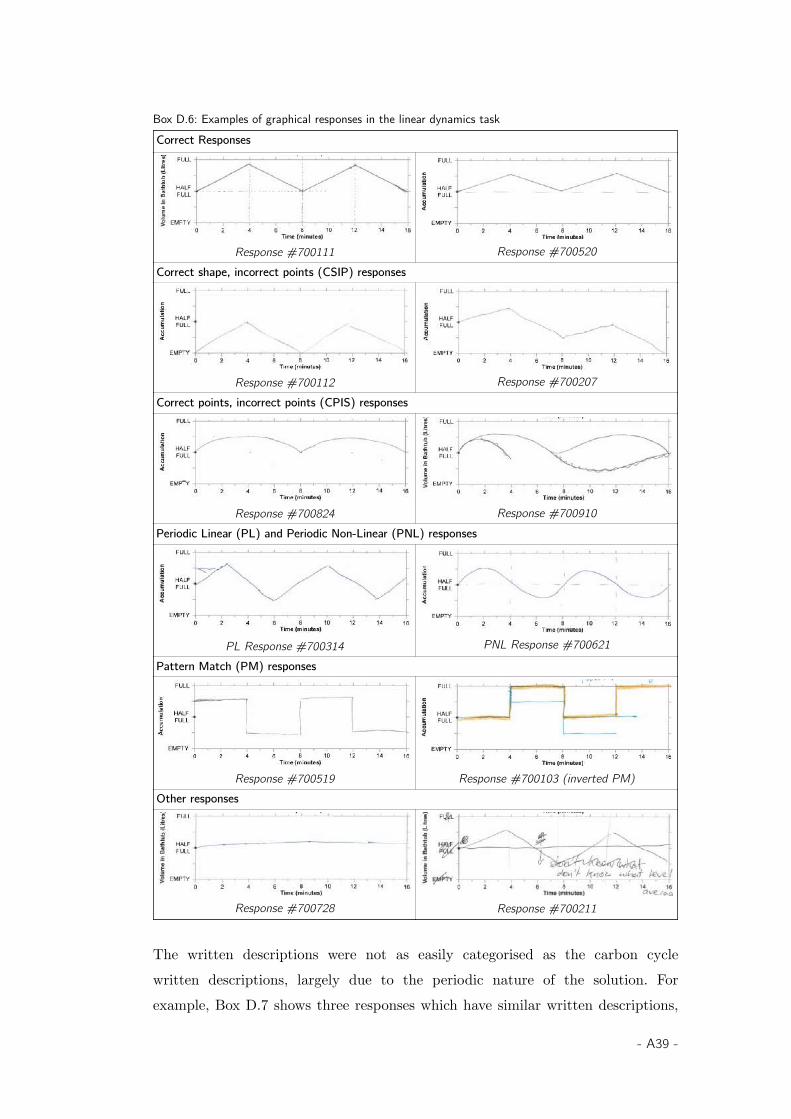
Box D.6: Examples of graphical responses in the linear dynamics taskCorrect Responses
Response #700111 Response #700520Correct shape, incorrect points (CSIP) responses
Response #700112 Response #700207Correct points, incorrect points (CPIS) responses
Response #700824 Response #700910Periodic Linear (PL) and Periodic Non-Linear (PNL) responses
PL Response #700314 PNL Response #700621Pattern Match (PM) responses
Response #700519 Response #700103 (inverted PM)Other responses
Response #700728 Response #700211
The written descriptions were not as easily categorised as the carbon cyclewritten descriptions, largely due to the periodic nature of the solution. Forexample, Box D.7 shows three responses which have similar written descriptions,
- A39 -
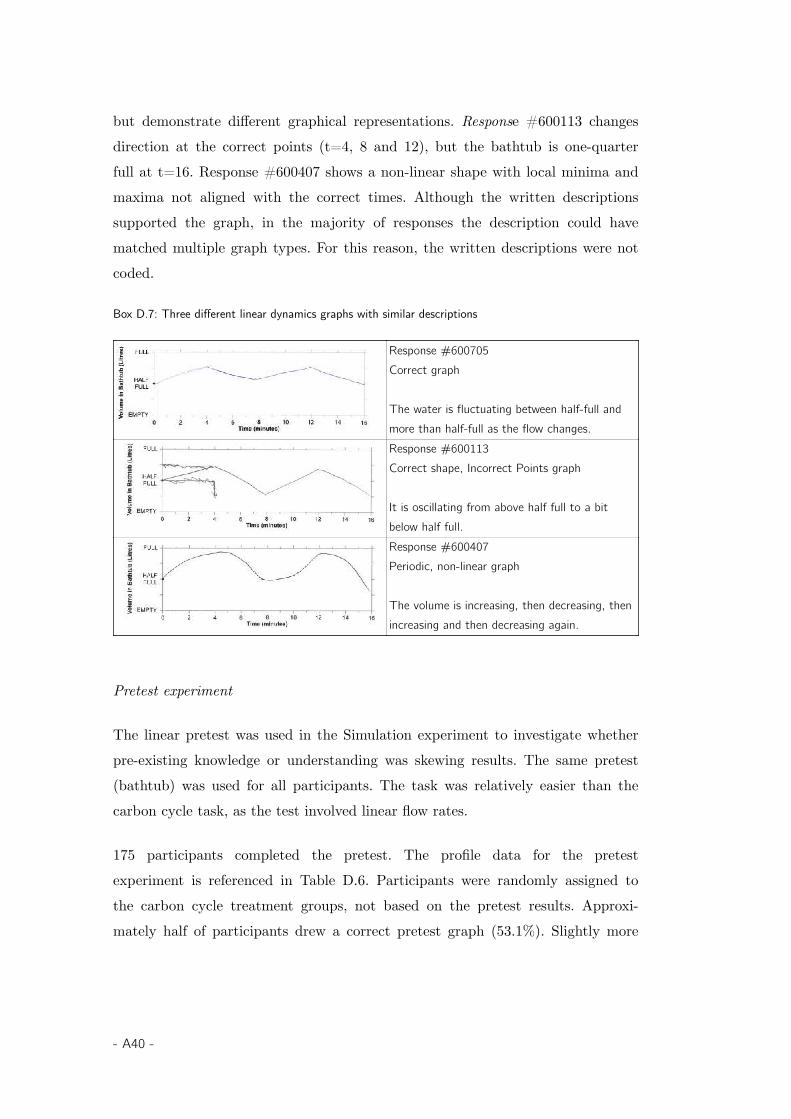
but demonstrate different graphical representations. Response #600113 changesdirection at the correct points (t=4, 8 and 12), but the bathtub is one-quarterfull at t=16. Response #600407 shows a non-linear shape with local minima andmaxima not aligned with the correct times. Although the written descriptionssupported the graph, in the majority of responses the description could havematched multiple graph types. For this reason, the written descriptions were notcoded.
Box D.7: Three different linear dynamics graphs with similar descriptions
Response #600705Correct graph
The water is fluctuating between half-full and more than half-full as the flow changes.Response #600113Correct shape, Incorrect Points graph
It is oscillating from above half full to a bit below half full.Response #600407Periodic, non-linear graph
The volume is increasing, then decreasing, thenincreasing and then decreasing again.
Pretest experiment
The linear pretest was used in the Simulation experiment to investigate whetherpre-existing knowledge or understanding was skewing results. The same pretest(bathtub) was used for all participants. The task was relatively easier than thecarbon cycle task, as the test involved linear flow rates.
175 participants completed the pretest. The profile data for the pretestexperiment is referenced in Table D.6. Participants were randomly assigned tothe carbon cycle treatment groups, not based on the pretest results. Approxi-mately half of participants drew a correct pretest graph (53.1%). Slightly more
- A40 -
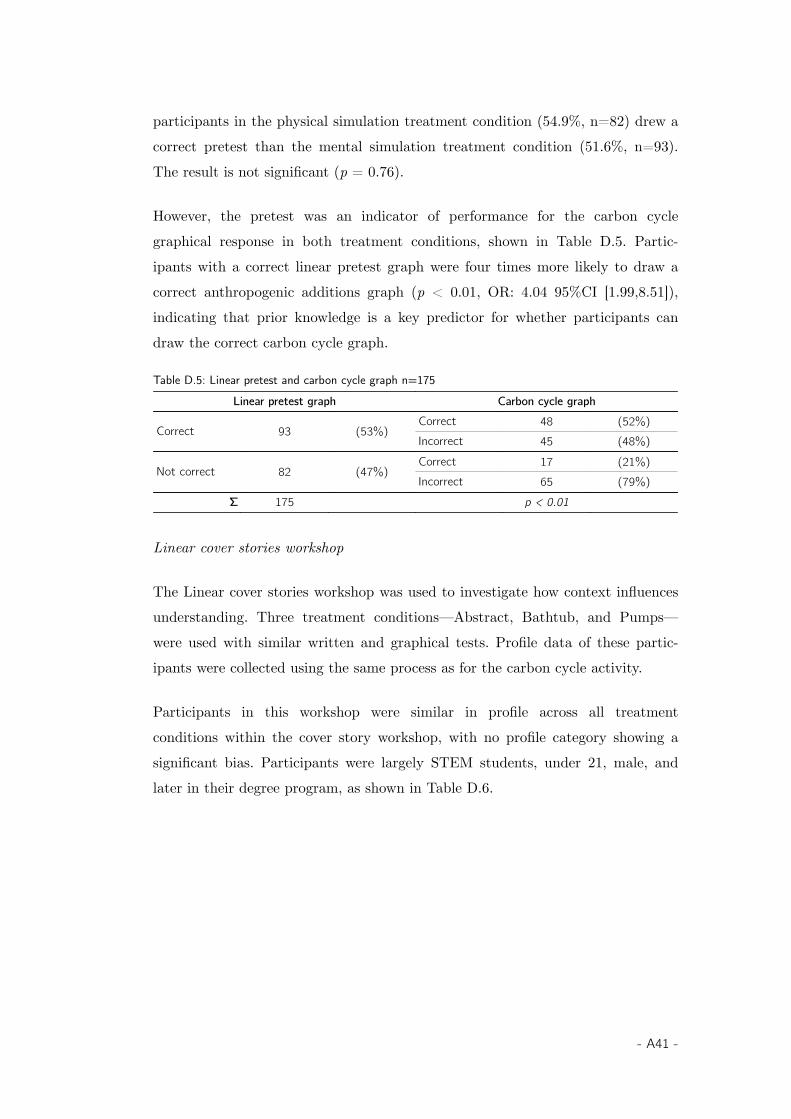
participants in the physical simulation treatment condition (54.9%, n=82) drew acorrect pretest than the mental simulation treatment condition (51.6%, n=93).The result is not significant (p = 0.76).
However, the pretest was an indicator of performance for the carbon cyclegraphical response in both treatment conditions, shown in Table D.5. Partic-ipants with a correct linear pretest graph were four times more likely to draw acorrect anthropogenic additions graph (p < 0.01, OR: 4.04 95%CI [1.99,8.51]),indicating that prior knowledge is a key predictor for whether participants candraw the correct carbon cycle graph.
Table D.5: Linear pretest and carbon cycle graph n=175Linear pretest graph Carbon cycle graph
Correct 93 (53%)Correct 48 (52%)Incorrect 45 (48%)
Not correct 82 (47%)Correct 17 (21%)Incorrect 65 (79%)
Σ 175 p < 0.01
Linear cover stories workshop
The Linear cover stories workshop was used to investigate how context influencesunderstanding. Three treatment conditions—Abstract, Bathtub, and Pumps—were used with similar written and graphical tests. Profile data of these partic-ipants were collected using the same process as for the carbon cycle activity.
Participants in this workshop were similar in profile across all treatmentconditions within the cover story workshop, with no profile category showing asignificant bias. Participants were largely STEM students, under 21, male, andlater in their degree program, as shown in Table D.6.
- A41 -
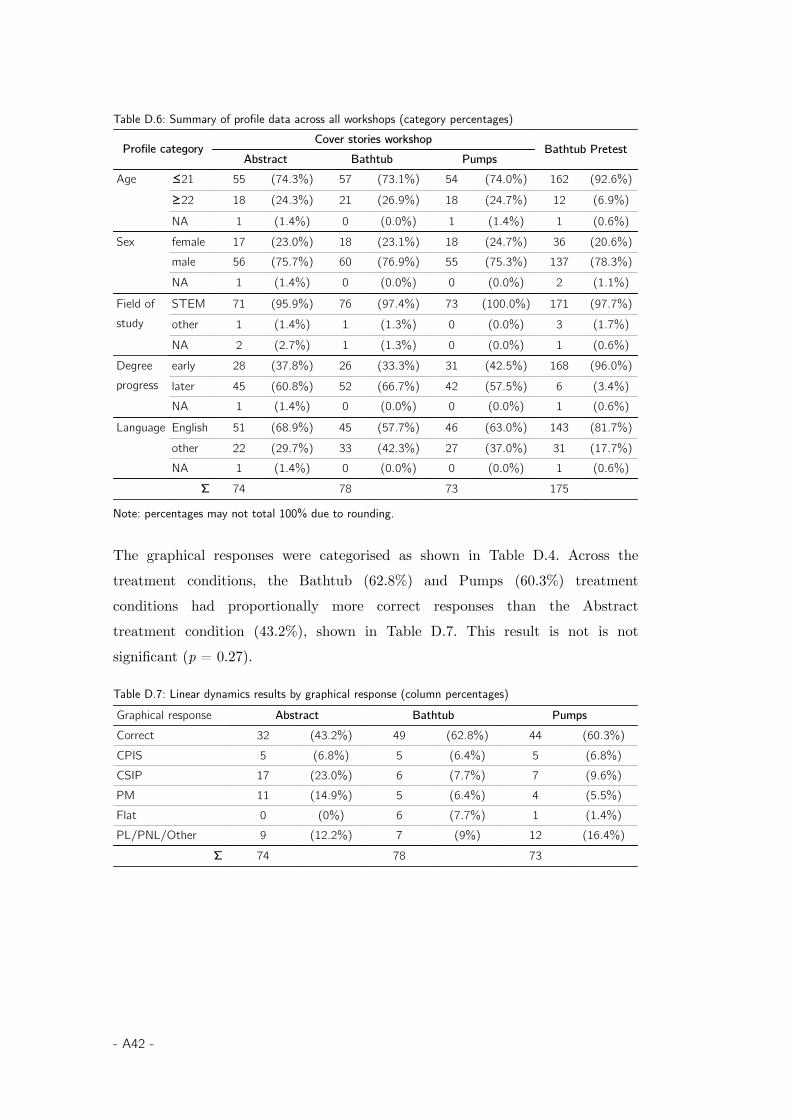
Table D.6: Summary of profile data across all workshops (category percentages)
Profile categoryCover stories workshop
Bathtub PretestAbstract Bathtub Pumps
Age ≤21 55 (74.3%) 57 (73.1%) 54 (74.0%) 162 (92.6%)≥22 18 (24.3%) 21 (26.9%) 18 (24.7%) 12 (6.9%)
NA 1 (1.4%) 0 (0.0%) 1 (1.4%) 1 (0.6%)Sex female 17 (23.0%) 18 (23.1%) 18 (24.7%) 36 (20.6%)
male 56 (75.7%) 60 (76.9%) 55 (75.3%) 137 (78.3%)NA 1 (1.4%) 0 (0.0%) 0 (0.0%) 2 (1.1%)
Field of study
STEM 71 (95.9%) 76 (97.4%) 73 (100.0%) 171 (97.7%)other 1 (1.4%) 1 (1.3%) 0 (0.0%) 3 (1.7%)NA 2 (2.7%) 1 (1.3%) 0 (0.0%) 1 (0.6%)
Degreeprogress
early 28 (37.8%) 26 (33.3%) 31 (42.5%) 168 (96.0%)later 45 (60.8%) 52 (66.7%) 42 (57.5%) 6 (3.4%)NA 1 (1.4%) 0 (0.0%) 0 (0.0%) 1 (0.6%)
Language English 51 (68.9%) 45 (57.7%) 46 (63.0%) 143 (81.7%)other 22 (29.7%) 33 (42.3%) 27 (37.0%) 31 (17.7%)NA 1 (1.4%) 0 (0.0%) 0 (0.0%) 1 (0.6%)
Σ 74 78 73 175
Note: percentages may not total 100% due to rounding.
The graphical responses were categorised as shown in Table D.4. Across thetreatment conditions, the Bathtub (62.8%) and Pumps (60.3%) treatmentconditions had proportionally more correct responses than the Abstracttreatment condition (43.2%), shown in Table D.7. This result is not is notsignificant (p = 0.27).
Table D.7: Linear dynamics results by graphical response (column percentages)Graphical response Abstract Bathtub PumpsCorrect 32 (43.2%) 49 (62.8%) 44 (60.3%)CPIS 5 (6.8%) 5 (6.4%) 5 (6.8%)CSIP 17 (23.0%) 6 (7.7%) 7 (9.6%)PM 11 (14.9%) 5 (6.4%) 4 (5.5%)Flat 0 (0%) 6 (7.7%) 1 (1.4%)PL/PNL/Other 9 (12.2%) 7 (9%) 12 (16.4%)
Σ 74 78 73
- A42 -
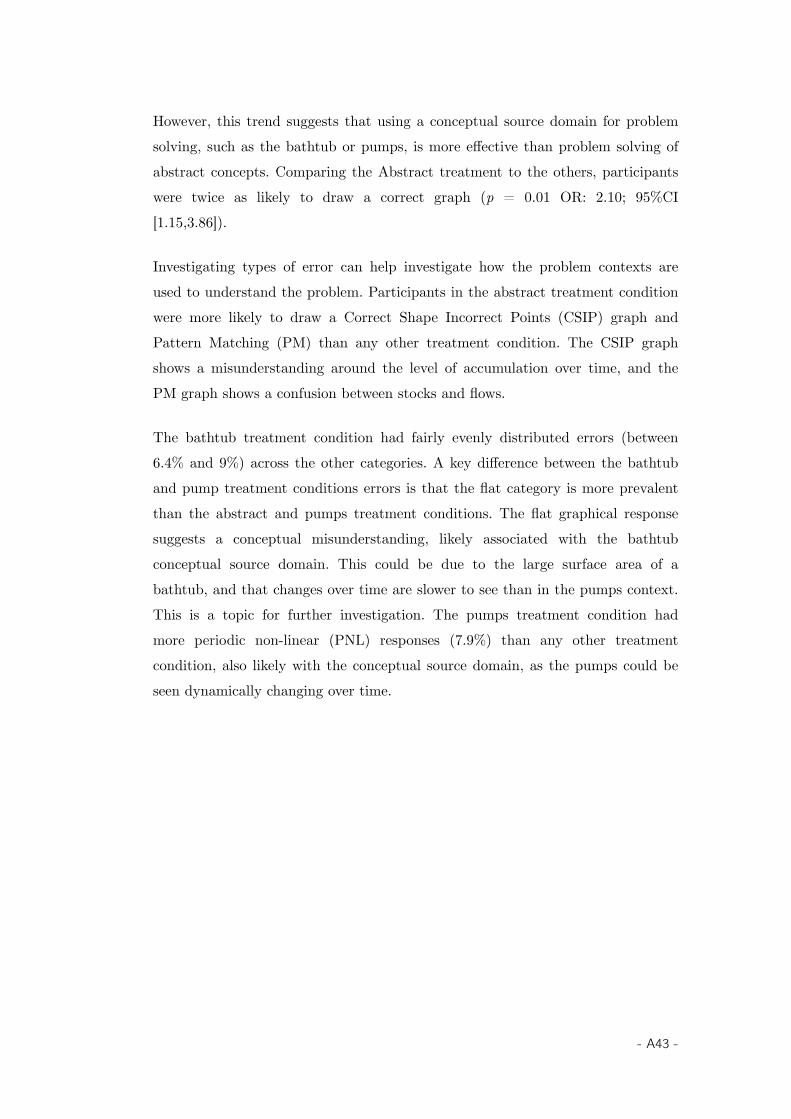
However, this trend suggests that using a conceptual source domain for problemsolving, such as the bathtub or pumps, is more effective than problem solving ofabstract concepts. Comparing the Abstract treatment to the others, participantswere twice as likely to draw a correct graph (p = 0.01 OR: 2.10; 95%CI[1.15,3.86]).
Investigating types of error can help investigate how the problem contexts areused to understand the problem. Participants in the abstract treatment conditionwere more likely to draw a Correct Shape Incorrect Points (CSIP) graph andPattern Matching (PM) than any other treatment condition. The CSIP graphshows a misunderstanding around the level of accumulation over time, and thePM graph shows a confusion between stocks and flows.
The bathtub treatment condition had fairly evenly distributed errors (between6.4% and 9%) across the other categories. A key difference between the bathtuband pump treatment conditions errors is that the flat category is more prevalentthan the abstract and pumps treatment conditions. The flat graphical responsesuggests a conceptual misunderstanding, likely associated with the bathtubconceptual source domain. This could be due to the large surface area of abathtub, and that changes over time are slower to see than in the pumps context.This is a topic for further investigation. The pumps treatment condition hadmore periodic non-linear (PNL) responses (7.9%) than any other treatmentcondition, also likely with the conceptual source domain, as the pumps could beseen dynamically changing over time.
- A43 -

- A44 -

9 Bibliography
ABC RN Breakfast, 2015, radio broadcast, ABC Radio National, Sydney, 19November. Interview with Richard Denniss and Fran Kelly.
Afternoon Journal, c1980, television series, TV PUC São Paulo and KTVSolucoes, Brazil. Conversation with Seymour Papert and Paulo Friere.
Andersen, D. & Richardson, G. P., 1997, Scripts for group model building,System Dynamics Review, 13(2), pp. 107-29.
Andersen, D. F., Vennix, J. A. M., Richardson, G. P., & Rouwette, E., 2007,‘Group model building: problem structuring, policy simulation and decisionsupport’, The Journal of the Operational Research Society, 58 (5), 691–694
Argyris, C., 1976, Single-loop and double-loop models in research on decisionmaking, Administrative science quarterly, pp. 363-75.
Argyris, C., & Schön, D., 1974, Theory in practice: Increasing professional effec-tiveness, Jossey Bass, San Francisco.
Aronson, E. 1978, The jigsaw classroom. Sage, Oxford, England.
Australian Bureau of Statistics, 2014, Review of the sex standard, viewed 12January 2015, http://www.abs.gov.au/websitedbs/D3310114.nsf/home/Review+of+the+Sex+Standard
Australian National University (ANU), 2013, Undergraduate Handbook, TheAustralian National University, Canberra. p.130
Baker, R.M., 1996, “Supertutes”, “Yes Minister” and Action Research: methods toassist geography teaching. Paper delivered at the International GeographyCongress, The Hague
Bammer, G., 2013, Disciplining interdisciplinarity: integration and implemen-tation sciences for researching complex real-world problems, ANU ePress,Canberra.
Bammer, G. & Smithson, M., 2009, Uncertainty and risk: multidisciplinaryperspectives, Earthscan, London.
Barker, T., Davidson, O., Davidson, W., Huq, S., Karoly, D., Kattsov, V., Liu, J.,Lohmann, U., Manning, M. & Matsuno, T., 2007, Climate change 2007:Synthesis report, Valencia, IPCC.
- A45 -

Barton, B.F., and Marthalee S.B., 1983, ‘The Nature and Treatment of Profes-sional Engineering Problems—The Technical Writing Teacher's Responsi-bility.’ Journal of technical writing and communication 13.4 : 355-368.
Benson, 2010, ‘Changing School Culture: Creating Student-Centered Classrooms’,in J Richmond, L Stuntz, K Richmond & J Egner (eds), Tracing connec-tions: voices of systems thinkers, isee systems and Creative LearningExchange, Acton, MA.
Biggs, J.B. & Collis, K.F., 1982, Evaluating the quality of learning: the SOLOtaxonomy, Academic Press, New York.
Bligh, D.A., 2000, What's the use of lectures? Jossey-Bass Publishers, SanFrancisco.
Bloom, B. S.; Engelhart, M. D.; Furst, E. J.; Hill, W. H.; Krathwohl, D. R., 1956,Taxonomy of educational objectives: The classification of educational goals.Handbook I: Cognitive domain, David McKay Company, New York.
Boden, T.A., G. Marland, and R.J. Andres. 2013. Global, Regional, and NationalFossil-Fuel CO2 Emissions. Carbon Dioxide Information Analysis Center,Oak Ridge National Laboratory, U.S. Department of Energy, Oak Ridge,TN.
Booth Sweeney, L. & Sterman, J.D., 2000, ‘Bathtub dynamics: initial results of asystems thinking inventory’, System Dynamics Review, 16(4), pp. 249-86.
Boulton, G., & Lucas, C., 2008, What are universities for? League of EuropeanResearch Universities, viewed 4 December 2013, http://www.leru.org/?cGFnZT00
Box, G.E.P. & Draper, N.R., 1987, Empirical Model-Building and ResponseSurfaces, Wiley, NY.
Braun, W., 2002, The System Archetypes, The Systems Modeling Workbook p.27: Published online at: http://wwwu.uni-klu.ac.at/gossimit/pap/sd/wb_sysarch.pdf.
Brockhaus, F., Arnold, J., Schwarz, M. & Sedlmeier, P., 2013, ‘Does the modifi-cation of the representation format affect stock-flow-thinking?’ Proceedingsof the 2013 International System Dynamics Conference, System DynamicsSociety, Albany, NY
- A46 -
Browne, C., & Rajan, T., 2015, ‘Using Distributed Constructionism inEngineering Tutorials: Requirements Engineering’ Proceedings of the 26thAnnual Conference for the Australasian Association for EngineeringEducation. Torquay.
Buskes, G., Shen, B. & Shallcross, D., 2010, ‘Promoting student engagement inlectures through a trial use of response clickers’, Proceedings of the 21stAnnual Conference for the Australasian Association for EngineeringEducation. p.290.
Chapin, H., 1978, ‘Flowers are Red’, on Living Room Suite, LP, Elektra, NewYork
Cox, S., 2014, ‘Using analogues to explore deformation of the Earth’s crust’,presentation at CMBE & CPMS Teaching and Learning Colloquium, ANU,4 November 2014
Cronin, M.A, & Gonzalez, C., 2007, ‘Understanding the building blocks of systemdynamics’. System Dynamics Review, 23(1), 1–17.
Cronin, M.A., Gonzalez, C. & Sterman, J.D., 2009, ‘Why don’t well-educatedadults understand accumulation? A challenge to researchers, educators, andcitizens, Organizational Behavior and Human Decision Processes, 108(1),pp. 116-30.
Crutzen, P.J., 2002, Geology of mankind, Nature, 415(6867):23.
De Bono, E., 2000, Six thinking hats, Penguin, London.
Deming, W.E., 2000, Out of the crisis, MIT Press, Cambridge, MA.
Dewey, J., 1938, Experience and education, Touchstone, New York.
Draper, F. 2010, ‘Teaching by wondering around: learning about the worldnaturally’, in J Richmond, L Stuntz, K Richmond & J Egner (eds), Tracingconnections: voices of systems thinkers, isee systems and Creative LearningExchange, Acton, MA.
Dyball, R. & Newell, B., 2014, Understanding human ecology: a systems approachto sustainability, Routledge, Oxon, UK.
Fiddaman, T., 1997, Feedback Complexity in Integrated Climate-EconomyModels. PhD thesis, MIT Sloan School of Management, Cambridge, MA(unpublished).
- A47 -
Ford, A.F., 1999, Modeling the environment: an introduction to system dynamicsmodels of environmental systems, Island Press, Washington, D.C.
Forrester, J.W., 1969, Urban dynamics, Pegasus Communications, Waltham, MA.
Forrester, J.W., 1970, Engineering for the benefit of mankind: a symposium heldat the third autumn meeting of the National Academy of Engineering,National Academy of Engineering, Washington D.C.
Forrester, J.W., 1989, ‘The Beginning of System Dynamics’ Banquet Talk at theinternational meeting of the System Dynamics Society, Stuttgart, Germany,July 13, viewed 18 August 2013, http://web.mit.edu/sysdyn/sd-intro/D-4165-1.pdf
Forrester, J.W., 2009, Some basic concepts in system dynamics. Sloan School ofManagement. Massachusetts Institute of Technology. Cambridge, MA.
Friere, P., 2005, Pedagogy of the Oppressed, 30th Anniversary Edition,Continuum, New York.
Hattie, J., 2013, Visible learning: A synthesis of over 800 meta-analyses relatingto achievement, Routledge, Oxon, UK.
Hovmand, P., 2014, Community Based System Dynamics, Springer, New York.
IPCC, 2005, IPCC Special Report on Carbon Dioxide Capture and Storage.Prepared by Working Group III of the Intergovernmental Panel on ClimateChange [Metz, B., O. Davidson, H. C. de Coninck, M. Loos, and L. A.Meyer (eds.)]. Cambridge University Press, Cambridge, UK
Kapmeier, F., 2004, ‘Findings from four years of bathtub dynamics at highermanagement education institutions in Stuttgart’, Proceedings of the 2013International System Dynamics Conference, Cambridge, MA, SystemDynamics Society, Albany, NY.
Kapmeier, F., with Tilebein, M., & Happach, R.M., 2015, ‘Bathtub Dynamicsrevisited: Exploring the engineering domain’ Proceedings of the 2015International System Dynamics Conference, Cambridge, MA, SystemDynamics Society, Albany, NY.
- A48 -
Keeling, C.D., Piper, S.C., Bacastow, R.B., Wahlen, M., Whorf, T.P., Heimann,M. & Meijer, H.A., 2005, ‘Atmospheric CO2 and 13CO2 exchange with theterrestrial biosphere and oceans from 1978 to 2000: observations andcarbon cycle implications’, pages 83-113, in A History of Atmospheric CO2and its effects on Plants, Animals, and Ecosystems, editors, Ehleringer,J.R., T. E. Cerling, M. D. Dearing, Springer Verlag, New York.
Kelly, P. 2007. ‘Green light on the hill is hard to miss’, The Australian, 4 April2007.
King, R., 2008, ‘Engineers for the future’, Australian Council of EngineeringDeans, Epping
Kolb, D.A. ,1984, Experiential learning: experience as the source of learning anddevelopment, Prentice-Hall, NJ.
Kuznig, R., 2009, ‘The Carbon Bathtub’, National Geographic, viewed 4 June2013 at http://ngm.nationalgeographic.com/big-idea/05/carbon-bath
Lakoff, G., 2004, Don't think of an elephant!: know your values and frame thedebate - the essential guide for progressives, Chelsea Green Publishing,White River Junction, Vermont.
Lakoff, G. & Johnson, M., 1999, Philosophy in the flesh: The embodied mind andits challenge to western thought, Basic books, New York.
Lakoff, G. & Johnson, M., 2003, Metaphors we live by, University of ChicagoPress, Chicago.
Lantz, M.E., 2010, ‘The use of Clickers in the classroom: Teaching innovation ormerely an amusing novelty?’ Computers in Human Behavior, 26(4), pp.556-61.
LaVigne, A., Benson, T., and Marlin, S., 2015, ‘Developing Understanding ofDynamic Systems Within Early Childhood Settings’, Proceedings of the2015 International System Dynamics Conference, System DynamicsSociety, Albany, NY
Lyman, F., 1987, ‘Think-pair-share: An expanding teaching technique’, MAA-CIE Cooperative News, 1(1), pp. 1-2.
Maani, K.E. & Cavana, R.Y., 2007, Systems thinking, system dynamics:managing change and complexity, Prentice Hall, Auckland, N.Z..
- A49 -

MacArthur, J.R. & Jones, L.L., 2008, ‘A review of literature reports of clickersapplicable to college chemistry classrooms’, Chem. Educ. Res. Pract., 9(3),pp. 187-95.
Martinez, S.L. & Stager, G., 2013, Invent to learn: Making, tinkering, andengineering in the classroom, Constructing Modern Knowledge Press,Torrance, CA.
Maxwell, T., Andersen, D.F., Richardson, G.P., & Stewart, T.R., 1994, ‘MentalModels and Dynamic Decision Making in a Simulation of Welfare Reform’,Proceedings of the 1994 International System Dynamics Conference,Stirling, Scotland, System Dynamics Society, Albany, NY.
May, K.T., 2013, ‘The 20 most popular TED Talks, as of December 2013’,TEDBlog, web log post, 16 December 2013, viewed 8 January 2015, http://blog.ted.com/2013/12/16/the-most-popular-20-ted-talks-2013/
Meadows, D.H., 2008, Thinking in systems, Wright, D. ed. Chelsea GreenPublishing, White River Junction, Vermont.
Meadows, D.H., Meadows, D.L., Randers, J., Behrens III, W.W., 1972, TheLimits to Growth: a report for the Club of Rome's project on thepredicament of mankind, Universe Books, New York.
Meadows, D.H., Robinson, J.M., 2007 (1985), The Electronic Oracle: ComputerModels & Social Decisions, reprint, John Wiley & Sons, New York.
Morecroft , J.D.W., 1982, A Critical Review of Diagramming Tools for Conceptu-alizing Feedback System Models. Dynamica 8(1)
Morecroft, J.D.W., 1988 ‘System dynamics and microworlds for policymakers’,European Journal of Operational Research 35 p.301-320
Morice, C.P., Kennedy, J.J. Rayner, N.A, & Jones, P.D., 2012, ‘Quantifyinguncertainties in global and regional temperature change using an ensembleof observational estimates: The HadCRUT4 dataset’, J. Geophys. Res., 117,D08101.
Newell, B., 1988, Turtle confusion: Logo puzzles and riddles, Curriculum Devel-opment Centre, Woden, ACT.
Newell, B., 2012, ‘Simple models, powerful ideas: Towards effective integrativepractice’, Global Environmental Change, 22(3), pp. 776-83.
- A50 -

Newell, B., and Proust, K., 2012, Introduction to Collaborative ConceptualModelling, Working Paper, ANU Open Access Research. https://digitalcol-lections.anu.edu.au/handle/1885/9386
PA Consulting, 2009, Dynamic Planning for COIN in Afghanistan, viewed 3January 2015 at: http://msnbcmedia.msn.com/i/MSNBC/Components/Photo/_new/Afghanistan_Dynamic_Planning.pdf
Papert, S., 1980, Mindstorms: Children, computers, and powerful ideas, BasicBooks, Inc., NY.
Papert, S., 2005, ‘You can’t think about thinking without thinking aboutthinking about something’. Contemporary Issues in Technology and TeacherEducation, 5(3/4), 366-367.
Piaget, J., 1973, To understand is to invent: the future of education, GrossmanPublishers, New York.
Reddy, M.J. 1979, ‘The conduit metaphor - a case of frame conflict in ourlanguage about language’, in A Ortony (ed), Metaphor and thought,Cambridge University Press, Cambridge, pp. 284-324.
Richardson, G.P., 2011, ‘Reflections on the foundations of system dynamics’,System Dynamics Review, 27(3), pp. 219-43.
Richardson, G.P. & Pugh, A.L.I., 1981, Introduction to system dynamicsmodeling, Pegasus Communications, Waltham, MA.
Richmond, B., 2010, Tracing Connections, Richmond, J., Stuntz, L., Richmond,K. & Egner, J. eds. isee systems, Hanover, NH.
Robinson, K. 2006, Do schools kill creativity?, online video, February 2006,TED Conferences LCC, New York, viewed 16 December 2013, http://www.ted.com/talks/ken_robinson_says_schools_kill_creativity
Rockström, J., Steffen, W., Noone, K., Persson, Chapin, F.S., Lambin, E.F.,Lenton, T.M., Scheffer, M., Folke, C. & Schellnhuber, H.J., 2009, ‘A safeoperating space for humanity’, Nature, 461(7263), pp. 472-5.
Rogers, E., 2003, The Diffusion of Innovations. Fifth Edition. The Free Press,New York
- A51 -

Rogers. S., 2010, ‘The McChrystal Afghanistan PowerPoint slide: can you do anybetter?’, The Guardian Online, viewed 3 January 2015 at:http://www.theguardian.com/news/datablog/2010/apr/29/mcchrystal-afghanistan-powerpoint-slide
Saeed, K., 2013, System Dynamics: A disruptive science. A conversation with JayW. Forrester, founder of the field, viewed online 4 January 2015 at:http://cpe.wpi.edu/images/CPE-New/System_Dynamics_Online_-_forrester2013_interview_edited_short.pdf
Scripps, 2015, ‘Atmospheric CO2 Data’, Scripps Institution of Oceanography, UCSan Diego, viewed 11 January 2015, http://scrippsco2.ucsd.edu/data/atmospheric_co2.html
Sedlmeier, P., Brockhaus, F. & Schwarz, M. 2014, ‘Visual integration with stock-flow models: How far can intuition carry us?’ in P Bender, R Hochmuth,PR Fischer, D Frischemeier & T Wassong (eds), Mit Werkzeugen Mathe-matik und Stochastik lernen - Using Tools for Learning Mathematics andStatistics, Springer Fachmedien Wiesbaden, Wiesbaden.
Senge, P.M., 2006, The fifth discipline: the art and practice of the learningorganization, Doubleday/Currency, New York.
Shannon, C.E. & Weaver, W., 1949, The Mathematical Theory of Communi-cation, University of Illinois Press, Champaign, IL.
Smith, J. & Browne, C.A., 2013, ‘Pieces of the puzzle - impacts of using thejigsaw classroom within peer-facilitated tutorials on engineering designprojects.’ Proceedings of the 24th Annual Conference for the AustralasianAssociation for Engineering Education. Gold Coast.
Stager, G., 2005, Papertian Constructionism and the Design of ProductiveContexts for Learning, EuroLogo 2005 conference.
Steffen, W., Richardson, K., Rockström, J., Cornell, S.E., Fetzer, I., Bennett,E.M., Biggs, R., Carpenter, S.R., de Vries, W. & de Wit, C.A., 2015,Planetary boundaries: Guiding human development on a changing planet,Science, p. 1259855.
Sterman, J.D., 2000, Business dynamics, Irwin-McGraw-Hill, Boston, MA.
Sterman, J.D., 2008, ‘Risk communication on climate: mental models and massbalance,’ Science, 322(5901), pp. 532-3.
- A52 -
Sterman, J.D., 2010, ‘Does formal system dynamics training improve people'sunderstanding of accumulation?’ System Dynamics Review, 26(4), pp.316-34.
Sterman, J.D. & Booth Sweeney, L., 2002, ‘Cloudy skies: assessing public under-standing of global warming’, System Dynamics Review, 18(2), pp. 207-40.
Sterman, J.D. & Booth Sweeney, L., 2007, ‘Understanding public complacencyabout climate change: Adults’ mental models of climate change violateconservation of matter’, Climatic Change, 80(3-4), pp. 213-38.
Stocker, T.F., Qin, D., Plattner, G.K., Tignor, M., Allen, S.K., Boschung, J.,Nauels, A., Xia, Y., Bex, V. & Midgley, P.M., 2013, ‘IPCC, 2013: Summaryfor Policymakers. In Climate Change 2013: The Physical Science Basis’,Contribution of Working Group I to the Fifth Assessment Report of theIntergovernmental Panel on Climate Change, Cambridge Univ. Press,Cambridge, UK.
TED, n.d., The most popular talks of all time, TED Conferences LCC, New York,viewed 4 December 2015, https://www.ted.com/playlists/171/the_most_popular_talks_of_all
Turner, G. M. 2008, ‘A comparison of The Limits to Growth with 30 years ofreality’, Global Environmental Change, 18, pp. 397-411.
Trevelyan, J., 2010, ‘Mind the Gaps: Engineering Education and Practice’,Proceedings of the 21st Annual Conference for the Australasian Associationfor Engineering Education. Sydney.
Trevelyan, J 2014, The Making of an Expert Engineer: How to Have a WonderfulCareer Creating a Better World and Spending Lots of Money Belonging toOther People. in Not available. CRC Press/Balkema, London, pp. 581.
UNFCCC, 2009, ‘Copenhagen Accord’. U.N. Framework Convention on ClimateChange. United Nations. 18 December 2009.
UNFCCC, 2015, ‘Adoption of the Paris Agreement’. U.N. Framework Conventionon Climate Change. United Nations. 12 December 2015.
Vennix, J., 1996, Group model building, Wiley, New York.
Vygotsky, L. S., 1978, Mind in society: The development of higher psychologicalprocesses. Cambridge, MA: Harvard University Press.Δ
Vygotsky, L. S., 1986, Thought and language MIT Press, Cambridge, MA.
- A53 -

Warren, K., 2014, ‘Agile SD: fast, effective, reliable’, Proceedings of the 2014International System Dynamics Conference, Delft, The Netherlands,System Dynamics Society, Albany, NY.
Zhao, Y., 2014, Who's afraid of the big bad dragon? Why China has the best (andworst) education system in the world, Jossey-Bass, San Francisco, CA.
- A54 -

Abbreviations
General abbreviations used in text
ABC Australian Broadcasting Commission
ANU Australian National University
CCM collaborative conceptual modelling
CCS carbon capture and storage
CLE Creative Learning Exchange
COIN counter-insurgency
DC direct current
DMAIC define, measure, analyse, improve and control
GtC gigatons of carbon
IPCC Intergovernmental Panel on Climate Change
MOOCs massive open online courses
NYSF National Youth Science Forum
OECD Organisation for Economic Co-operation and Development
ppm parts per million
TMI think, make, improve
UNFCCC United Nations Framework Convention on Climate Change
Note: see the Glossary on page xv for abbreviations associated with the design ofthe T&P activity.
- A55 -