Embed Size (px)
Citation preview
ENVIRONMENTAL RESEARCH 48, 7-16 (1989)
A Dose-Response Analysis of Cadmium in the General Environment with Special Reference to Total Cadmium
Intake Limit
KoJi NOGAWA, RYUMON HONDA, TERUHIKO KIDO, IKIKO TSURITANI,
YUICHI YAMADA, MASAO ISHIZAKI, AND HARUKI YAMAYA
Kanazawa Medical University, Uchinada, Ishikawa, 920-02 Japan
Received October 14, 1987
An epidemiological study on the dose-response relationship of cadmium was performed on 1850 Cd-exposed and 294 nonexposed inhabitants of the Kakehashi River basin in Ishikawa Prefecture. 132-microglobulinuria was used as an index of the effect of cadmium on health and the average cadmium concentration in locally produced rice was employed as an indicator of cadmium exposure. Cadmium exposure was found to affect health in a dose- related manner when the subjects were classified according to the average cadmium con- centration in their village rice and their length of residence in the polluted area. Based on the available data, the total cadmium intake that produced an adverse effect on health was calculated as approximately 2000 mg for both men and women. ¢ 1989 Academic Press, Inc.
INTRODUCTION
Defining a threshold limit or maximum allowable intake of cadmium (Cd) is difficult because its effect on health is the result of its accumulation over a long period of time. In general, two major approaches to solving this problem have been used. One involves the use of metabolic models to estimate the total Cd exposure necessary to damage health (Kjellstr6m, 1985a), while the other is ep- idemiological. Epidemiological studies in Japan have provided empirical models for dose-response relationships in cases of Cd-induced renal damage (Fukushima et al., 1973; Saito et al., 1976; Kjellstr6m et al., 1977; Kojima et al., 1977; Nogawa et al., 1978; Nogawa and Ishizaki, 1979) and we ourselves have previously per- formed two such investigations of Cd in the general environment (Nogawa et al., 1978; Nogawa and Ishizaki, 1979). Although these studies demonstrated that the influence of Cd in humans is dose related, there were some difficulties in deter- mining an accurate maximum allowable intake of this element, i.e., using moder- ately sensitive indices of health effects, there was no information available con- cerning history of residence in Cd-polluted areas or sex-related differences in susceptibility.
We place a high priority on defining the total Cd intake limit as a means of protecting people from Cd-induced health problems, because such effects occur after very long exposures to environmental Cd.
Consequently, the purpose of this study is to investigate the dose-response relationship between total Cd intake and renal dysfunction among the general public. Furthermore, the total Cd intake producing renal dysfunction was esti- mated.
0013-9351/89 $3.00 Copyright © 1989 by Academic Press, Inc. All rights of reproduction in any form reserved.
8 NOGAWA ET AL.
MATERIALS AND METHODS
Selection of Target Group
The investigation was carried out in 1981 and 1982 in the Cd-polluted Kakehashi River basin in Ishikawa Prefecture on inhabitants over 50 years of age. Cd com- pounds are transported by the Kakehashi River from a mine upstream to the rice fields of the study area where the river water is used for irrigation. The target group consisted of 3508 inhabitants 0574 men and 1934 women) with a separate control group consisting of 312 (142 men and 170 women) over 50-year-old inhab- itants of unpolluted hamlets adjacent to the Kakehashi River basin. These par- ticipants accounted for 91 and 94% of the inhabitants, in this age range, in the Cd-polluted and unpolluted areas, respectively.
Selection of Health Effect Indices and Dose Variables
Urinary [32-microglobulin (~2-m) was chosen as the index of Cd-induced health effects due to its high sensitivity to these. The average rice Cd concentration in each hamlet was used as the dose variable since, in the study area, over 70% of the total Cd intake has been shown to be derived from rice (Ishikawa Prefecture, 1976; Tsuchiya and Iwao, 1978). History of residence and type of rice consumed (household rice or commercial rice) were determined for each participant by questionnaire.
Sampling and Analysis of Urine and Rice
A morning urine sample was collected from each participant, neutralized when necessary after pH testing, and then kept frozen at - 20°C until analysis. [32-m was determined by radioimmunoassay using a kit (Phadebas ~2-microtest, Pharmacia Diagnostics AB, Sweden) and creatinine was measured by Jaff6 reaction (Bonnes and Taussky, 1945). For the purposes of the present study, [32-microglobulinuria (132-m-uria) was defined as a urinary 132-111 concentration equal to or greater than 1000 p~g/liter or equal to or greater than 1000 ~g/g creatinine (g cr.).
In 1974, rice was collected from the farmers in all of the polluted hamlets, divided into 22 groups according to location, and stored in warehouses. Rice samples were extracted randomly from the bags of each hamlet and mixed well before being assayed for Cd. Thus, the average rice Cd concentration in each hamlet was determined (Ishikawa Prefecture, 1976). Concentrations of rice-borne Cd were measured by atomic absorption spectrophotometry after wet ashing with HzSO4/HNO3/HC104 and extraction with ammonium pyrrolidine dithiocarba- mate-methyl-isobutyl ketone (APDC-MIBK).
RESULTS
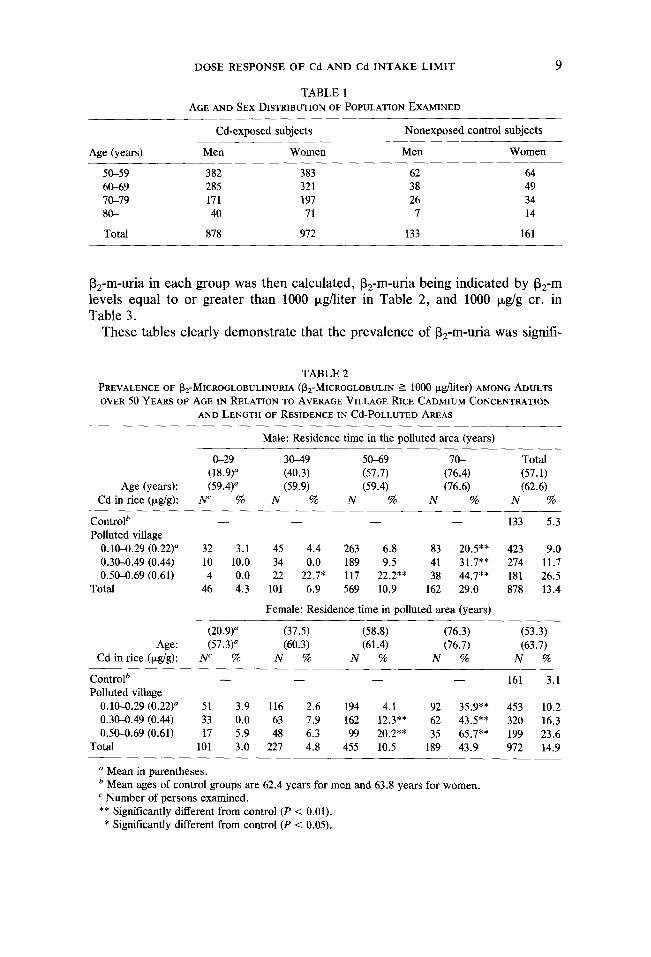
On the basis of answers to the questionnaire, 1850 subjects (878 men and 972 women) who had eaten only their own household rice were selected from the target group. Table 1 presents the age and sex distributions of this group and the control-population. As shown in Tables 2 and 3, subjects were divided into 12 subgroups on the basis of their length of residence at their present address, and the average Cd concentration of the rice in their hamlets. The prevalence of
DOSE RESPONSE OF Cd AND Cd INTAKE LIMIT
TABLE 1 AGE AND SEX DISTRIBUTION OF POPULATION EXAMINED
Cd-exposed subjects Nonexposed control subjects
Age (years) Men Women Men Women
50-59 382 383 62 64 60-69 285 321 38 49 70-79 171 197 26 34 80- 40 71 7 14
Total 878 972 133 161
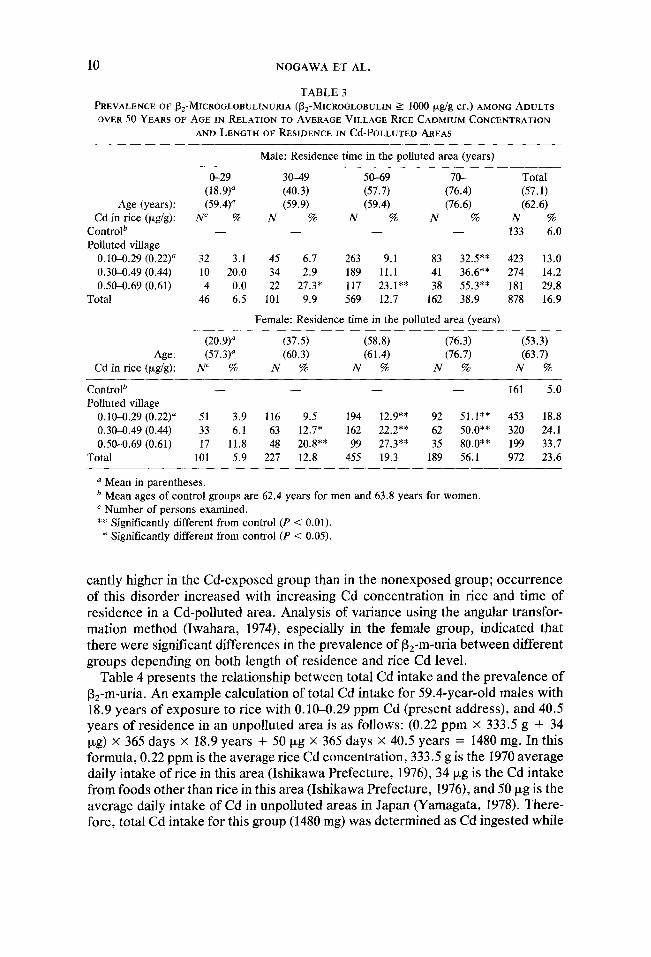
[32-m-uria in each group was then calculated, [32-m-uria being indicated by [32-m levels equal to or greater than 1000 ~g/liter in Table 2, and 1000 p~g/g cr. in Table 3.
These tables clearly demonstrate that the prevalence of [32-m-uria was signifi-
TABLE 2 PREVALENCE OF ~2-MICROGLOBULINURIA (~2-MICROGLOBULIN >= 1000 ~g/liter) AMONG ADULTS OVER 50 YEARS OF AGE IN RELATION TO AVERAGE VILLAGE RICE CADMIUM CONCENTRATION
AND LENGTH OF RESIDENCE IN Cd-PoLLUTED AREAS
Male: Residence time in the polluted area (years)
0-29 30-49 50-69 70- Total (18.9) a (40.3) (57.7) (76.4) (57.1)
Age (years): (59.4) a (59.9) (59.4) (76.6) (62.6) Cd in rice (p~g/g): N C % N % N % N % N %
Control b . . . . 133 5.3 Polluted village
0.10-0.29 (0.22) a 32 3.1 45 4.4 263 6.8 83 20.5** 423 9.0 0.30--0.49 (0.44) 10 10.0 34 0.0 189 9.5 41 31.7"* 274 11.7 0.50-0.69 (0.61) 4 0.0 22 22.7* 117 22.2** 38 44.7** 181 26.5
Total 46 4.3 101 6.9 569 10.9 162 29.0 878 13.4
Female: Residence time in polluted area (years)
(20.9) a (37.5) (58.8) (76.3) (53.3) Age: (57.3) ~ (60.3) (61.4) (76.7) (63.7)
Cd in rice (~zg/g): N c % N % N % N % N %
Control b . . . . 161 3.1 Polluted village
0.10-0.29 (0.22) a 51 3.9 116 2.6 194 4.1 92 35.9** 453 10.2 0.30-0.49 (0.44) 33 0.0 63 7.9 162 12.3"* 62 43.5** 320 16.3 0.50-0.69 (0.61) 17 5.9 48 6.3 99 20.2** 35 65.7** 199 23.6
Total 101 3.0 227 4.8 455 10.5 189 43.9 972 14.9
a Mean in parentheses. b Mean ages of control groups are 62.4 years for men and 63.8 years for women. c Number of persons examined. ** Significantly different from control (P < 0.01). * Significantly different from control (P < 0.05).
10 NOGAWA ET AL.
TABLE 3 PREVALENCE OF ~2-MICROGLOBULINURIA (~2-MICROGLOBULIN ~ 1000 ~g/g cr.) AMONG ADULTS OVER 50 YEARS OF AGE IN RELATION TO AVERAGE VILLAGE RICE CADMIUM CONCENTRATION
AND LENGTH OF RESIDENCE IN Cd-POLLUTED AREAS
Male: Residence time in the polluted area (years)
0-29 30--49 50--69 70- Total (18.9) ~ (40.3) (57.7) (76.4) (57.1)
Age (years): (59.4) a (59.9) (59.4) (76.6) (62.6) Cd in rice (/xg/g): N c % N % N % N % N %
Control b . . . . 133 6.0 Polluted village
0.10--0.29 (0.22) a 32 3.1 45 6.7 263 9.1 83 32.5** 423 13.0 0.30-0.49 (0.44) 10 20.0 34 2.9 189 11.1 41 36.6** 274 14.2 0.50-0.69 (0.61) 4 0.0 22 27.3* 117 23.1"* 38 55.3** 181 29.8
Total 46 6.5 101 9.9 569 12.7 162 38.9 878 16.9
Female: Residence time in the polluted area (years)
(20.9) ~ (37.5) (58.8) (76.3) (53.3) Age: (57.3) ~ (60.3) (61.4) (76.7) (63.7)
Cd in rice (p~g/g): N ¢ % N % N % N % N %
Control b . . . . 161 5.0 Polluted village
0.10-0.29 (0.22) a 51 3.9 116 9.5 194 12.9"* 92 51.1"* 453 18.8 0.30-0.49 (0.44) 33 6.1 63 12.7" 162 22.2** 62 50.0** 320 24.1 0.50-0.69 (0.61) 17 11.8 48 20.8** 99 27.3** 35 80.0** 199 33.7
Total 101 5.9 227 12.8 455 19.3 189 56.1 972 23.6
a Mean in parentheses. b Mean ages of control groups are 62.4 years for men and 63.8 years for women. c Number of persons examined. ** Significantly different from control (P < 0.01).
* Significantly different from control (P < 0.05).
cantly higher in the Cd-exposed group than in the nonexposed group; occurrence of this disorder increased with increasing Cd concentration in rice and time of residence in a Cd-polluted area. Analysis of variance using the angular transfor- mation method (Iwahara, 1974), especially in the female group, indicated that there were significant differences in the prevalence of 132-m-uria between different groups depending on both length of residence and rice Cd level.
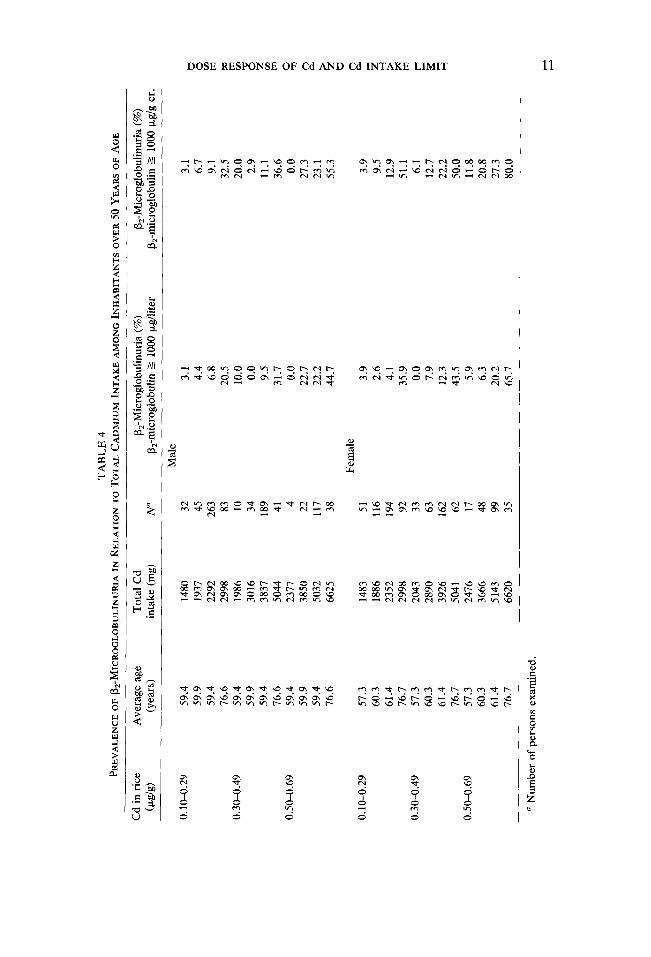
Table 4 presents the relationship between total Cd intake and the prevalence of P2-m-uria. An example calculation of total Cd intake for 59.4-year-old males with 18.9 years of exposure to rice with 0.10-0.29 ppm Cd (present address), and 40.5 years of residence in an unpolluted area is as follows: (0.22 ppm x 333.5 g + 34 Ixg) x 365 days x 18.9 years + 50 ~g x 365 days x 40.5 years = 1480 rag. In this formula, 0.22 ppm is the average rice Cd concentration, 333.5 g is the 1970 average daily intake of rice in this area 0shikawa Prefecture, 1976), 34 ~g is the Cd intake from foods other than rice in this area (Ishikawa Prefecture, 1976), and 50 txg is the average daily intake of Cd in unpolluted areas in Japan (Yamagata, 1978). There- fore, total Cd intake for this group (1480 rag) was determined as Cd ingested while
DOSE RESPONSE OF Cd AND Cd INTAKE LIMIT 11
to c~ < to C~
< to
>
Z <
< t~ z
Z
<
m
<
z
~r,.)
Z
<
z
Z
,¢
~7
m
Z to
>
All
• ~ 0/)
¼
,_,, :fl_
~ . . - ,
~D
<
; .h
-6 .=.
~D
~D e'~
,.O
E
Z
12 N O G A W A ET AL.
at the present, polluted address (741 rag) plus that absorbed while in residence in unpolluted areas (739 rag).
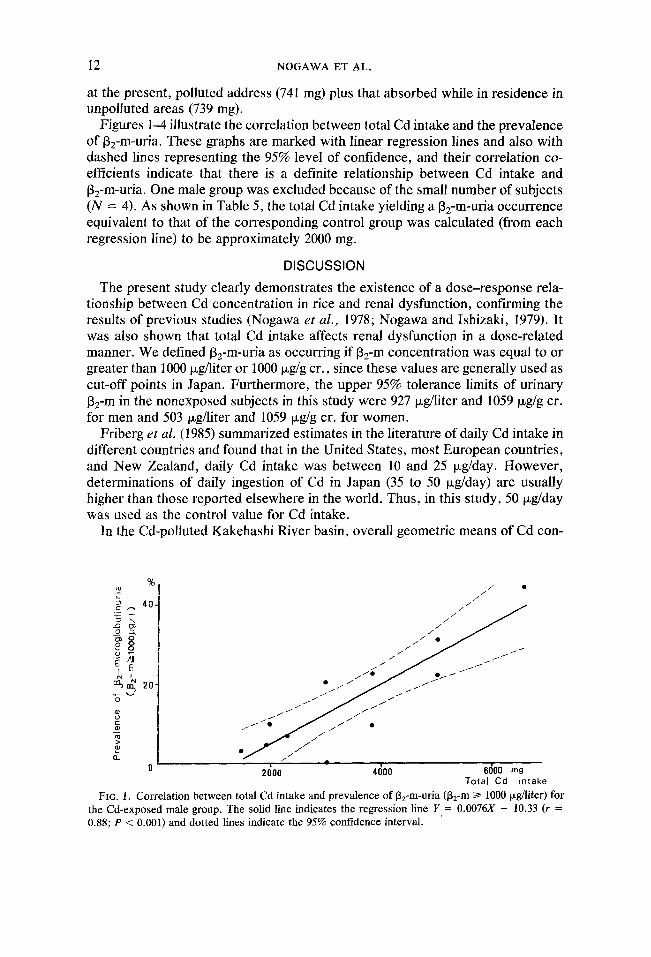
Figures 1--4 illustrate the correlation between total Cd intake and the prevalence of [32-m-uria. These graphs are marked with linear regression lines and also with dashed lines representing the 95% level of confidence, and their correlation co- efficients indicate that there is a definite relationship between Cd intake and flz-m-uria. One male group was excluded because of the small number of subjects (N = 4). As shown in Table 5, the total Cd intake yielding a [32-m-uria occurrence equivalent to that of the corresponding control group was calculated (from each regression line) to be approximately 2000 mg.
DISCUSSION
The present study clearly demonstrates the existence of a dose-response rela- tionship between Cd concentration in rice and renal dysfunction, confirming the results of previous studies (Nogawa et al., 1978; Nogawa and Ishizaki, 1979). It was also shown that total Cd intake affects renal dysfunction in a dose-related manner. We defined 132-m-uria as occurring if [3z-m concentration was equal to or greater than 1000 ixg/liter or 1000 p~g/g cr., since these values are generally used as cut-off points in Japan. Furthermore, the upper 95% tolerance limits of urinary 132-m in the nonexposed subjects in this study were 927 ~g/liter and 1059 p~g/g cr. for men and 503 ~g/liter and 1059 ~g/g cr. for women.
Friberg et al. (1985) summarized estimates in the literature of daily Cd intake in different countries and found that in the United States, most European countries, and New Zealand, daily Cd intake was between 10 and 25 p,g/day. However, determinations of daily ingestion of Cd in Japan (35 to 50 ~g/day) are usually higher than those reported elsewhere in the world. Thus, in this study, 50 ~g/day was used as the control value for Cd intake.
In the Cd-polluted Kakehashi River basin, overall geometric means of Cd con-
%
,-, 40-1
2 ; o .a ~ g ~ O 0
J
20,
0
g C IlJ
Q-
0
/ / •
/ / / "
/ / / /
• / j f ~
f f J . f ~
/ . . / , / "
i -- ' • ! ' ' | .... 2000 4000 6000 rng
Total Cd intake
FIG. 1. Correlation be tween total Cd intake and prevalence of [32-m-uria (13z-m ~> 1000 ~g/liter) for the Cd-exposed male group. The solid line indicates the regress ion line Y = 0.0076X - 10.33 (r = 0.88; P < 0.001) and dotted lines indicate the 95% confidence interval.
DOSE RESPONSE OF Cd AND Cd INTAKE LIMIT 13
.-
o ~ 40. ._o ~1
~ 20
/ / /
. / / • ./ /-
/ , / . / "
/ J r
f J J •
/ . / - j j
¢-
2000 4000 6(~00 mg Total Cd intake
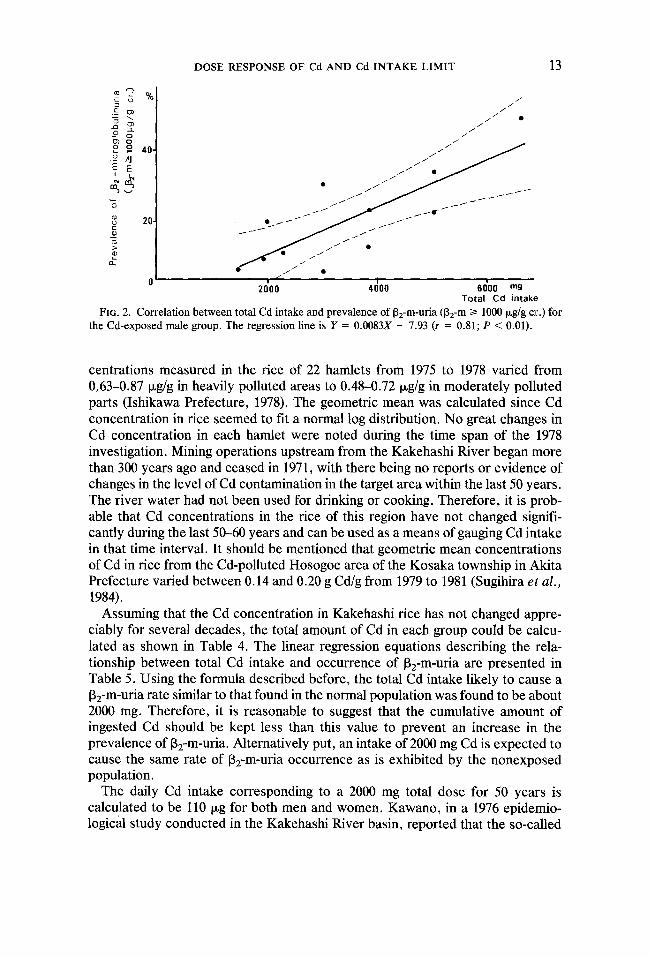
FIG. 2. Correlation between total Cd intake and prevalence of [32-m-uria ([$2-m >/ 1000 p.g/g cr.) for the Cd-exposed male group. The regression line is Y = 0.0083X - 7.93 (r = 0.81; P < 0.01).
centrations measured in the rice of 22 hamlets from 1975 to 1978 varied from 0,63-0.87 p,g/g in heavily polluted areas to 0.48-0.72 p,g/g in moderately polluted parts (Ishikawa Prefecture, 1978). The geometric mean was calculated since Cd concentration in rice seemed to fit a normal log distribution. No great changes in Cd concentration in each hamlet were noted during the time span of the 1978 investigation. Mining operations upstream from the Kakehashi River began more than 300 years ago and ceased in 1971, with there being no reports or evidence of changes in the level of Cd contamination in the target area within the last 50 years. The river water had not been used for drinking or cooking. Therefore, it is prob- able that Cd concentrations in the rice of this region have not changed signifi- cantly during the last 50-60 years and can be used as a means of gauging Cd intake in that time interval. It should be mentioned that geometric mean concentrations of Cd in rice from the Cd-polluted Hosogoe area of the Kosaka township in Akita Prefecture varied between 0.14 and 0.20 g Cd/g from 1979 to 1981 (Sugihira et al., 1984).
Assuming that the Cd concentration in Kakehashi rice has not changed appre- ciably for several decades, the total amount of Cd in each group could be calcu- lated as shown in Table 4. The linear regression equations describing the rela- tionship between total Cd intake and occurrence of 132-m-uria are presented in Table 5. Using the formula described before, the total Cd intake likely to cause a 132-m-uria rate similar to that found in the normal population was found to be about 2000 rag. Therefore, it is reasonable to suggest that the cumulative amount of ingested Cd should be kept less than this value to prevent an increase in the prevalence of [~2-m-uria. Alternatively put, an intake of 2000 mg Cd is expected to cause the same rate of [32-m-uria occurrence as is exhibited by the nonexposed population.
The daily Cd intake corresponding to a 2000 mg total dose for 50 years is calculated to be 110 p~g for both men and women. Kawano, in a 1976 epidemio- logical study conducted in the Kakehashi River basin, reported that the so-called
14 N O G A W A ET AL.
%
r~
• £ \ 60 -5 O3 _(3 ::3. 0
g E 4O
~ 2o
Q~ 0
/ / / /
/ / / /
/ / / / •
• / / / / J f l /
/ / j j J / f 1 / / / / I •
• O • ~ / /
2000 4000 6(~00 m g Total Cd intake
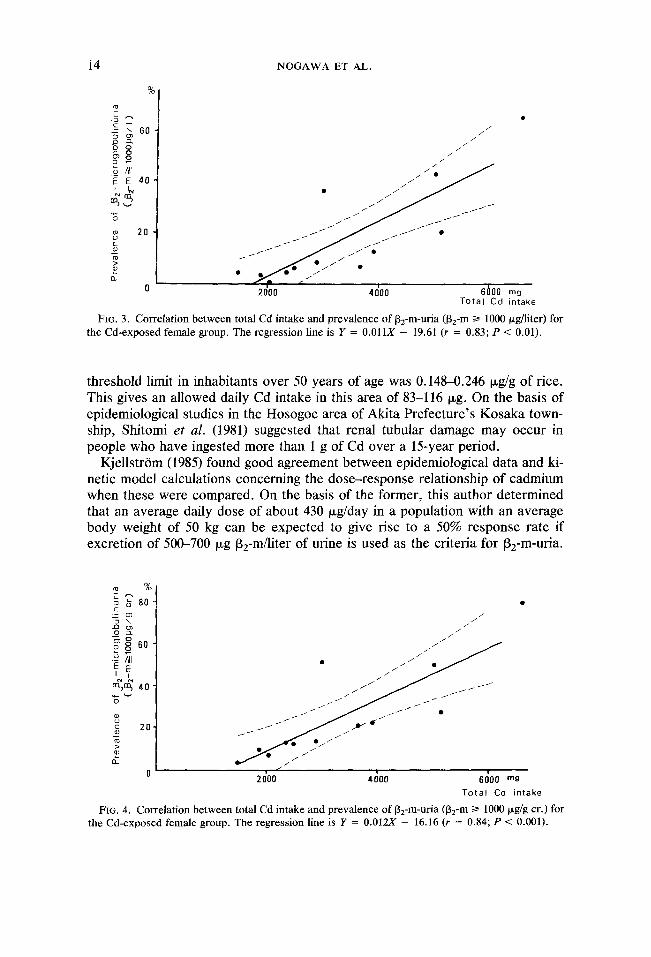
FIG. 3. Correlation between total Cd intake and prevalence of [32-m-uria (132-m i> 1000 ~Lg/liter) for the Cd-exposed female group. The regression line is Y = 0 .011X - 19.61 (r = 0.83; P < 0.01).
threshold limit in inhabitants over 50 years of age was 0.148-0.246 Ixg/g of rice. This gives an allowed daily Cd intake in this area of 83-116 Ixg, On the basis of epidemiological studies in the Hosogoe area of Akita Prefecture's Kosaka town- ship, Shitomi et al. (1981) suggested that renal tubular damage may occur in people who have ingested more than 1 g of Cd over a 15-year period.
Kjellstr6m (1985) found good agreement between epidemiological data and ki- netic model calculations concerning the dose-response relationship of cadmium when these were compared. On the basis of the former, this author determined that an average daily dose of about 430 ixg/day in a population with an average body weight of 50 kg can be expected to give rise to a 50% response rate if excretion of 500-700 p~g [3z-m/liter of urine is used as the criteria for [32-m-uria.
= 8 8 0 C
~_ O3
_o ~ O 3 0 0 o ° 6 0
~,~ 40 0
g c 2 0
a_ 0
/ / / /
/ / /
/ / / • / •
7./..//" j / / f ~ J / f / / / / J /
j J J f / j • 1 / 1 / . .~1¢ /
2~;oo 4~oo 6~;oo , , ,~,
Total Cd intake
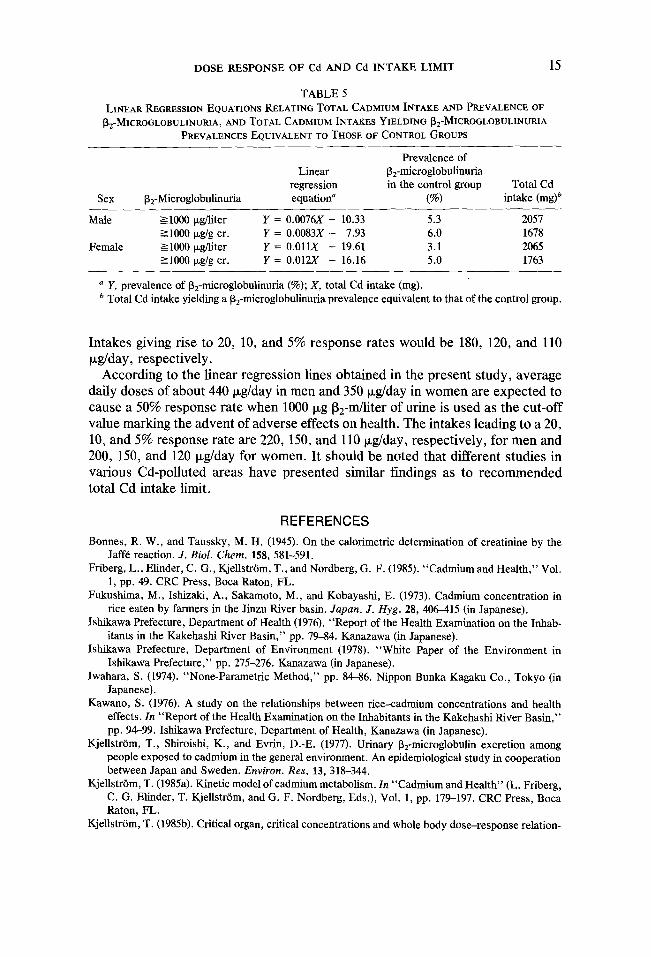
FIG. 4. Correlation between total Cd intake and prevalence of 132-m-uria (~32-m t> 1000 p,g/g cr.) for the Cd-exposed female group. The regression line is Y = 0 .012X - 16.16 (r = 0.84; P < 0.001).
DOSE RESPONSE OF Cd AND Cd INTAKE LIMIT 15
TABLE 5 LINEAR REGRESSION EQUATIONS RELATING TOTAL CADMIUM INTAKE AND PREVALENCE OF
~2-MICROGLOBULINUR1A, AND TOTAL CADMIUM INTAKES YIELDING ~2-MICROGLOBULINURIA PREVALENCES EQUIVALENT TO THOSE OF CONTROL GROUPS
Prevalence of Linear 132-microglobulinuria
regression in the control group Total Cd Sex 132-Microglobulinuria equation ~ (%) intake (mg) b
Male ->1000 ~g/liter Y = 0.0076X - 10.33 5.3 2057 ->1000 ~Lg/g cr. Y = 0.0083X - 7.93 6.0 1678
Female >=1000 ~g/liter Y = 0.011X - 19.61 3.1 2065 ->_1000 p~g/g cr. Y = 0.012X - 16.16 5.0 1763
Y, prevalence of 132-microglobulinnria (%); X, total Cd intake (mg). b Total Cd intake yielding a B2-microglobulinuria prevalence equivalent to that of the control group.
Intakes giving rise to 20, 10, and 5% response rates would be 180, 120, and 110 p~g/day, respectively.
According to the linear regression lines obtained in the present study, average daily doses of about 440 txg/day in men and 350 ~g/day in women are expected to cause a 50% response rate when 1000 ~g [32-m/liter of urine is used as the cut-off value marking the advent of adverse effects on health. The intakes leading to a 20, 10, and 5% response rate are 220, 150, and 110 ~g/day, respectively, for men and 200, 150, and 120 ~g/day for women. It should be noted that different studies in various Cd-polluted areas have presented similar findings as to recommended total Cd intake limit.
REFERENCES
Bonnes, R. W., and Taussky, M. H. (1945). On the calorimetric determination of creatinine by the Jaff6 reaction. J. Biol. Chem. 158, 581-591.
Friberg, L., Elinder, C. G., Kjellstr6m, T., and Nordberg, G. F. (1985). "Cadmium and Health," Vol. 1, pp. 49. CRC Press, Boca Raton, FL.
Fukushima, M., Ishizaki, A., Sakamoto, M., and Kobayashi, E. (1973). Cadmium concentration in rice eaten by farmers in the Jinzu River basin. Japan. J. Hyg. 28, 406--415 (in Japanese).
Ishikawa Prefecture, Department of Health (1976). "Report of the Health Examination on the Inhab- itants in the Kakehashi River Basin," pp. 79--84. Kanazawa (in Japanese).
Ishikawa Prefecture, Department of Environment (1978). "White Paper of the Environment in Ishikawa Prefecture," pp. 275-276. Kanazawa (in Japanese).
Iwahara, S. (1974). "None-Parametric Method," pp. 84-86. Nippon Bunka Kagaku Co., Tokyo (in Japanese).
Kawano, S. (1976). A study on the relationships between rice-cadmium concentrations and health effects. In "Report of the Health Examination on the Inhabitants in the Kakehashi River Basin," pp. 94-99. Ishikawa Prefecture, Department of Health, Kanazawa (in Japanese).
Kjellstr6m, T., Shiroishi, K., and Evrin, D.-E. (1977). Urinary 132-microglobulin excretion among people exposed to cadmium in the general environment. An epidemiological study in cooperation between Japan and Sweden. Environ. Res. 13, 318-344.
Kjellstrrm, T. (1985a). Kinetic model of cadmium metabolism. In "Cadmium and Health" (L. Friberg, C. G. Elinder, T. Kjellstrrm, and G. F. Nordberg, Eds.), Vol. 1, pp. 179-197. CRC Press, Boca Raton, FL.
Kjellstrrm, T. (1985b). Critical organ, critical concentrations and whole body dose-response relation-
16 NOGAWA ET AL.
ships. In "Cadmium and Health" (L. Friberg, C. G. Elinder, T. Kjellstrrm, and G. F. Nordberg, Eds.), Vol. 1, pp. 231-246. CRC Press, Boca Raton, FL.
Kojima, S., Haga, Y., Kurihara, T., and Yamawaki, T. (1977). A comparison between fecal cadmium and urinary [32-microglobulin, total protein, and cadmium among Japanese farmers. An epidemi- ological study in cooperation between Japan and Sweden. Environ. Res. 14, 436-451.
Nogawa, K., and Ishizaki, A. (1979). A comparison between cadmium in rice and renal effects among inhabitants of the Jinzu River basin. Environ. Res. 18, 410--420.
Nogawa, K., Ishizaki, A., and Kawano, S. (1978). Statistical observation of the dose-response rela- tionship of cadmium based on epidemiological studies in the Kakehashi River basin. Environ. Res. 15, 185-198.
Saito, H., Nagai, K., Shioji, R., Furukawa, Y., Arikawa, T., Saito, T., and Furuyama, T. (1976). "Dose-Response Relationships between Total Burden of Cadmium and 132-Microglobulin Con- centrations in Urine of the Inhabitants in the Cadmium-Polluted Area." Kankyo Hoken Report No. 38, 78--81 (in Japanese).
Shitomi, K., Saito, H., Nakano, A., Unakami, H., Takada, K., Sato, T., Furuyama, T., Yoshinaga, K., Arikawa, T., and Nagai, K. (1981). Urinary 132-microglobulin for residents in an environmen- tally cadmium-polluted area--Studies of generational and sexual differences, and a comparison with the results of proximal renal tubular function tests. Japan. J. Nephrol. 23, 45-62 (in Japa- nese).
Sugihira, N., Saito, H., and Nakano, A. (1984). Cadmium concentration of rice produced in a cad- mium-polluted area. In "Research Report from the National Institute for Environmental Studies," No. 67, pp. 219-225. The National Institute for Environmental Studies, Tokyo (in Japanese).
Tsuchiya, K., and lwao, S. (1978). "Results and Evaluation on Cadmium Intake of Cd-Exposed Inhabitants in Akita, Ishikawa, and Nagasaki Prefectures." Kankyo Hoken Report No. 44, 86-115 (in Japanese).
Yanlagata, N. (1978). Cadmium in the environment and in humans. In "Cadmium Studies in Japan--A Review" (K. Tsuchiya, Ed.), pp. 19-37. Kodansha Ltd., Elsevier/North-Holland Biomedical Press, Tokyo/Amsterdam/New York/Oxford.


![[PPT]PowerPoint Presentationc.ymcdn.com/.../Diabetes_lecture_slides_nov.pptx · Web view... urosepsis, trauma, reduced caloric or fluid intake, and reduced insulin dose. Potential](https://img.pdfslide.us/doc/110x75/5acf30e57f8b9ad24f8c2429/pptpowerpoint-view-urosepsis-trauma-reduced-caloric-or-fluid-intake-and.jpg)