Embed Size (px)
Citation preview

© 2
017
Nat
ure
Am
eric
a, In
c., p
art
of
Sp
rin
ger
Nat
ure
. All
rig
hts
res
erve
d.
nature neurOSCIenCe advance online publication
a r t I C l e S
The hippocampus is a medial temporal lobe structure that is critically involved in spatial navigation and formation of declarative memory. Multimodal information from many cortices converges into the hip-pocampus primarily through the EC1–3. The medial part of EC (MEC) contains strongly position-modulated neurons4,5, while the lateral EC (LEC) contains neurons encoding other features, for example, object6–8 and odor9–13. It is generally thought that MEC and LEC transfer spatial5 and nonspatial6, or context- and content-related14 information, respectively, into the hippocampus, through two efferent synaptic pathways: the perforant path (PP), from EC layer 2 stellate cells to hippocampal dentate gyrus (DG), and the temporoammonic path (TA), from EC layer 3 PCs to hippocampal CA1. These two pathways are also known as the indirect and direct paths, respec-tively, relative to the CA11,3. A large body of experimental evidence has revealed the synaptic organization of the indirect path and its critical roles in spatial navigation and declarative memory forma-tion15,16. In contrast, neural functions of the direct TA path are less understood. Lesion studies have suggested that the direct EC TA path to CA1 is important in forming and consolidating long-term spatial memory17,18. Recent studies reported that the direct MEC–CA1 exci-tatory projection is involved in time-related event encoding19 and the formation of temporal association memory20, while correlated neuronal activity in the direct LEC–CA1 circuit underlies olfactory cue–place associative learning11. However, it remains unclear how
these direct synaptic paths from MEC and LEC transfer distinct information streams to hippocampal CA1. In particular, accumulat-ing evidence has revealed a high degree of CA1 PC heterogeneity in gene expression21–24, dendritic morphology25, connectivity with local inhibitory interneurons (INs)26 and CA2 PCs27, in vitro spik-ing patterns28, electrophysiological marks during theta oscillations29 and sharp-wave ripples30 in vivo, and coding dynamics during spatial learning31. The neuronal heterogeneity may imply the potential exist-ence of distinct subcircuits among EC–CA1 connections.
In the present study, using optogenetic approaches, we mapped direct LEC–CA1 and MEC–CA1 connectivity and examined their roles in olfaction-based associative learning in mice. Using channel-rhodopsin-2 (ChR2)-assisted circuit mapping (CRACM)32 and trans-synaptic viral tracing, we found that LEC neurons selectively formed direct excitatory synapses onto a distinct subpopulation of morpho-logically complex, calbindin (Calb)-expressing PCs in the dorsal CA1 (dCA1), while MEC neurons homogenously innervated all dCA1 PCs. Optogenetic inactivation of the LEC–dCA1 Calb+ PC circuit ham-pered associative learning in a simple olfaction-based Go–No-go task. Moreover, in vivo optetrode recording in the dCA1 of behaving mice further demonstrated that Calb+ PCs developed more selective odor representations in spike responses than their neighboring PCs during learning. Thus, our findings reveal a distinct direct LEC–dCA1 path that is required for olfactory associative learning.
1Institute of Neuroscience, Shanghai Institutes for Biological Sciences, Chinese Academy of Sciences, Shanghai, China. 2State Key Laboratory of Cognitive Neuroscience & Learning and IDG/McGovern Institute for Brain Research, Beijing Normal University, Beijing, China. 3University of Chinese Academy of Sciences, Shanghai, China. 4Key Laboratory of Brain Functional Genomics-Ministry of Education, School of Life Science, East China Normal University, Shanghai, China. 5Britton Chance Center for Biomedical Photonics and Department of Biomedical Engineering, Wuhan National Laboratory for Optoelectronics–Huazhong University of Science and Technology, Wuhan, China. 6State Key Laboratory of Virology, CAS Center for Excellence in Brain Science and Intelligence Technology, Wuhan Institute of Virology, Chinese Academy of Sciences, Wuhan, China. 7Key Laboratory of Cell Proliferation and Differentiation of the Ministry of Education and State Key Laboratory of Membrane Biology, College of Life Sciences, Peking University, Beijing, China. 8These authors contributed equally to this work. Correspondence should be addressed to X.Z. ([email protected]).
Received 6 September 2016; accepted 24 January 2017; published online 6 March 2017; doi:10.1038/nn.4517
A distinct entorhinal cortex to hippocampal CA1 direct circuit for olfactory associative learningYiding Li1–3,8, Jiamin Xu4,8, Yafeng Liu5, Jia Zhu1,3, Nan Liu2, Wenbo Zeng6, Ning Huang7, Malte J Rasch2, Haifei Jiang6, Xiang Gu2, Xiang Li2, Minhua Luo6, Chengyu Li1, Junlin Teng7, Jianguo Chen7, Shaoqun Zeng5, Longnian Lin4 & Xiaohui Zhang2
Lateral and medial parts of entorhinal cortex (EC) convey nonspatial ‘what’ and spatial ‘where’ information, respectively, into hippocampal CA1, via both the indirect EC layer 2→ hippocampal dentate gyrus→CA3→CA1 and the direct EC layer 3→CA1 paths. However, it remains elusive how the direct path transfers distinct information and contributes to hippocampal learning functions. Here we report that lateral EC projection neurons selectively form direct excitatory synapses onto a subpopulation of morphologically complex, calbindin-expressing pyramidal cells (PCs) in the dorsal CA1 (dCA1), while medial EC neurons uniformly innervate all dCA1 PCs. Optogenetically inactivating the distinct lateral EC–dCA1 connections or the postsynaptic dCA1 calbindin-expressing PC activity slows olfactory associative learning. Moreover, optetrode recordings reveal that dCA1 calbindin-expressing PCs develop more selective spiking responses to odor cues during learning. Thus, our results identify a direct lateral EC→dCA1 circuit that is required for olfactory associative learning.

© 2
017
Nat
ure
Am
eric
a, In
c., p
art
of
Sp
rin
ger
Nat
ure
. All
rig
hts
res
erve
d.
advance online publication nature neurOSCIenCe
a r t I C l e S
RESULTSMorphological and molecular characterization of two PC subclasses in the dCA1We first verified the existence of morphologically different subtypes of dCA1 PCs by quantitatively measuring neuronal morphologies reconstructed from 354 whole-cell recorded PCs in acute hippocam-pal slices. Consistent with a previous result25, we observed two sub-classes of reconstructed dCA1 PCs based on the apparent differences in the apical dendritic arborization: one subtype with a single apical dendritic trunk and another with twin apical trunks that branched out near the soma (Fig. 1a). To classify these morphologically dis-tinct subtypes without subjective bias, we developed two quantitative indices, the length ratio index (LRI) and the branch-order ratio index (ORI) to measure the dendritic length- and order-weighted similarity, respectively, of two subtrees bifurcated at any branch point in the api-cal dendrite (see Online Methods for equations), and higher weight values were found at those dendritic branch-points that had larger subtrees of roughly equal size. As a result, the branch-point with the maximum value of LRI (LRImax) or ORI (ORImax) was regarded as the indicative value for a given cell (Fig. 1a and Online Methods). The LRImax and ORImax values from PCs with twin apical trunks were significantly higher than those from PCs with a single apical trunk.
The k-means cluster analysis of the two-dimensional matrix, con-sisting of LRImax and ORImax values of 354 reconstructed dCA1 PCs, suggested the existence of two morphologically different PC sub-groups (Fig. 1b), supported by the Jump analysis to evaluate the opti-mal number of clusters33 (Supplementary Fig. 1a–c). Sholl analysis on dendritic trees further showed that these two subgroups exhibited significant differences in the complexity of apical dendrites within the stratum radiatum (SR) layer, but not in basal dendrites (P < 0.01, unpaired t-test; Fig. 1c and Supplementary Fig. 1d,e), and that the PCs with twin apical trunks had longer apical dendrites with more branch points (Supplementary Table 1). We hereafter refer to these two morphologically distinct groups as simple PCs (sPC) and complex PCs (cPC). This classification was nearly identical to that based on principal component analysis of LRImax and ORImax (Supplementary Fig. 1f–h and Supplementary Table 2). On the other hand, these two subgroups showed little difference in most electrophysiological properties (Supplementary Table 3). Both were intrinsically regular-spiking cells, with similar extents of intrinsic excitability and accom-modated spiking (Supplementary Fig. 2).
We also noted that in the dCA1 stratum pyramidale (SP), cell bodies of cPCs and sPCs tended to reside preferentially in the superficial and deep (close to stratum oriens) sub-layers, respectively (Fig. 1d). Such distribution gradient is reminiscent of the reported expression pattern of the calcium-binding protein calbindin (Calb) among dCA1 PCs22. Indeed, we observed that 52.4% of cPCs (n = 103) but only 4.4% of sPCs (n = 68) were immunolabeled by monoclonal antibodies against Calb-D28K after whole-cell recordings (P = 2.1 × 10⁻¹⁰, Pearson’s chi-squared test; Fig. 1e,f). As washout of cytoplasmic Calb during whole-cell recording could cause antibody staining to fail, we further performed single-cell reverse-transcription (RT)-PCR, a more sensi-tive method, to detect Calb transcripts in morphologically identified cPCs and sPCs (Fig. 1g). Calb transcripts were detected in nearly all examined cPCs (13 of 14 cells) but only in 3 of 17 sPCs (P = 3.9 × 10⁻⁵, Fisher’s exact test; Fig. 1h). These results consistently suggested that in the dCA1 SP layer, most superficial cPCs expressed Calb, while deep sPCs less often expressed Calb. Notably, the NEURON simulation (http://www.neuron.yale.edu/neuron) using these two PC morphol-ogy models showed that introducing tonic or phasic excitatory con-ductance in the distal tuft dendrite resulted in larger somatic excitation
in sPCs than in cPCs, despite similar local dendritic excitations in both types (Supplementary Fig. 3). Such effect could be partially attributed to relatively longer (Supplementary Table 1) and thinner apical dendrites after bifurcating in cPCs than in sPCs25.
Heterogeneity of direct EC TA projections to sPCs and cPCsWe next compared the excitatory synaptic connections onto dCA1 sPCs and cPCs formed by projection axons of the EC TA and hip-pocampal CA3 Shaffer collaterals (SC) paths, which correspond to the direct and indirect paths, respectively. To map the long-range targeting of EC TA projections, we used CRACM32 with a custom-built acousto-optic deflector-based rapid laser stimulation system34. Adeno-associated virus (AAV) AAV-hSyn-ChR2-mCherry was stere-otaxically injected into either LEC or MEC to achieve selective neu-ronal expression of ChR2 within the targeted EC areas (Fig. 2a and Supplementary Fig. 4a). Fluorescent PP and TA axons were present in the DG moleculare (MO) and CA1 stratum lacunosum (SLM) layers in the hippocampus, respectively (Fig. 2b). Consistent with previous results3, PP axons from LEC and MEC layer 2 stellate cells were segregated in the outer and middle third of DG MO, respec-tively (Fig. 2b), while TA axons from LEC and MEC layer 3 PCs were intermingled in CA1 SLM, with opposite distal–proximal gradients along the hippocampal transverse axis (Supplementary Fig. 4b). We chose slices prepared from the dorsal part of the hippocampus, −2.0 to −2.6 mm relative to bregma (Supplementary Fig. 4b) for the fol-lowing CRACM assay.
For the CRACM assay, a 10 × 10 grid of 473-nm laser spot stimuli with 40-µm interspot intervals, covering the entire CA1 SLM and DG MO layers, was set to activate ChR2+ EC axons around distal apical dendrites of recorded dCA1 PCs (Fig. 2c). Laser stimuli at 0.5–2 mW were sufficient to activate ChR2+ EC TA axons and evoke postsynaptic currents (PSCCRACM) recorded in the dCA1 PC soma, with average latency of 4.52 ± 0.16 ms (n = 15). Increasing laser power occasion-ally evoked polysynaptic PSCCRACM in only two CA2 inhibitory INs (Supplementary Fig. 5a). Bath application of picrotoxin (50 µM), a specific antagonist of GABAA receptors, did not significantly change amplitudes or spatial maps of discrete PSCCRACM on the distal apical dendrite of dCA1 PCs, although it slightly decreased the latency (Supplementary Fig. 5b,c). This suggests that the direct EC TA inputs were mainly composed of excitatory transmissions to dCA1 PCs and generated excitatory PSCCRACM (EPSCCRACM). Furthermore, we found that when voltage-activated Na+- and K+-channel blockers tetrodotoxin (0.5 µM) and 4-aminopyridine (4-AP, 100 µM) were applied as described previously32, the discrete map of evoked EPSCCRACM remained, although their amplitudes were reduced by 61.5 ± 10.7% (n = 5; P = 0.01, paired t-test; Supplementary Fig. 5d,e), suggesting that EPSCCRACM mainly resulted from activa-tion of monosynaptic connections. All these results indicated that our CRACM method could reliably assay the direct EC excitatory inputs onto the dCA1 PC.
Using CRACM, we first mapped the LEC TA projections onto dCA1 sPCs and cPCs, which were identified by morphological reconstruc-tion after whole-cell recording. With light activation of ChR2+ LEC TA axons, monosynaptic EPSCCRACM and its discrete synaptic map were found in 62.4% of 101 cPCs but only in 8.3% of 96 sPCs in the dCA1 (P = 9.3 × 10⁻¹⁵, Pearson’s chi-squared test; Fig. 2d,e), suggest-ing that cPCs were being specifically targeted. In each hippocampal slice, we also recorded neighboring CA2 PCs, which are known to be heavily innervated by EC layer 2 PP axons16,27, to evaluate the axonal ChR2 expression. We found that 88.9% of recorded 91 CA2 PCs were responsive to the same photoactivation (Fig. 2e). The mean amplitudes

© 2
017
Nat
ure
Am
eric
a, In
c., p
art
of
Sp
rin
ger
Nat
ure
. All
rig
hts
res
erve
d.
nature neurOSCIenCe advance online publication
a r t I C l e S
sPCcPC
cPCsPC0
Cal
b st
aini
ng c
ell (
%)
50
100
65
3
49
54
Whole-cellrecording
Vglut1
Vglut1
Gad1
Gad1
Gad2
Gad2
Gapdh
Gapdh
CalbCalb
Ladder
Reversetranscription
MultiplexPCR
FinalPCR
cPC sPC
cPCsPC0
RT
-PC
R c
ell (
%)
50
100
Calb–
Calb+
14
3 13
1
Per
cent
age
(%)
0
100
50
101
46
37
76
19
70
Bio
cytin
Cal
bind
inD
AP
I
cPCsPCDAPI Calbindin Biocytin
sPC
cPC
CA1 SP
Midd
leDee
p
Super
ficial
LRImax = –0.239 ORImax = 0.229 LRImax = 1.017 ORImax = 1.705
Simple PCa
b c d
e g
f h
Complex PC
–1 0 1 2–1 0 1 2
k-means cluster analysis Sholl analysis
LRImax
sPC, n = 173cPC, n = 181sPC centercPC center
Number of cells
Num
ber
of in
ters
cetio
ns
–2 –1 0 1–2
–1
0
1
2
0
20
Num
ber
of c
ells
40
200 40 –200 0 200 400 6000
4
8
12
Distance from soma (µm)
sPC, n = 173cPC, n = 181
OR
I max
SO
SP
SR
SLM
P = 2.1 × 10⁻¹⁰ P = 3.9 × 10⁻⁵
P < 0.01
P < 0.01
Calb–
Calb+
Figure 1 Morphological and molecular characterization of two distinct types of dCA1 PCs. (a) Representative neuronal morphologies reconstructed from sPCs and cPCs, labeled with values of the LRI and ORI for individual branch-points along apical dendrites. The size and color of circles depict the magnitude of LRI and ORI values. (b) K-means cluster analysis for cataloging sPCs (blue) and cPCs (red) according to their LRImax and ORImax. (c) Sholl analysis of dendritic complexity (60-µm step). Ranges with significant differences between the two subtypes are labeled (P < 0.01, unpaired t-test; exact P-values in the Supplementary Methods Checklist). Error bars show s.e.m. (d) Somata distribution of sPCs and cPCs in the superficial, middle and deep divisions of CA1 stratum pyramidale (SP). SO, stratum oriens. (e) Calb immunostaining in morphologically identified sPCs and cPCs. Arrowhead, principal branch-point. Scale bars, 100 µm (left) and 10 µm (right). (f) Percentages of Calb-immunostained cells in morphologically identified sPCs and cPCs (P = 2.1 × 10⁻¹⁰, Pearson’s chi-squared test). (g) Detection of Calb transcripts in morphologically identified sPC and cPC by single-cell RT-PCR. (h) Percentages of Calb-transcription cells among sPCs and cPCs (P = 3.9 × 10⁻⁵, Fisher’s exact test).

© 2
017
Nat
ure
Am
eric
a, In
c., p
art
of
Sp
rin
ger
Nat
ure
. All
rig
hts
res
erve
d.
advance online publication nature neurOSCIenCe
a r t I C l e S
of the maximum EPSCCRACM values of the sPCs and cPCs in dCA1 and the CA2 PCs were 0, 20 ± 2 and 195 ± 36 pA, respectively (n = 6 mice, at 2-mW laser power; P = 0.031, sPCs versus cPCs, Wilcoxon signed-ranked test; Fig. 2f). Notably, blocking GABAergic transmission with picrotoxin (50 µM) did not significantly affect the differential targeting of LEC TA axons onto the dCA1 sPC and cPC (P = 0.89 for sPC and P = 0.62 for cPC, respectively; Pearson’s chi-squared test; Supplementary Fig. 5h). In contrast, when we applied the same CRACM to map synaptic targets of MEC TA axons, nearly all tested dCA1 sPCs and cPCs showed evoked mono-EPSCCRACM and discrete synaptic maps (87.5 and 93.8% for sPCs and cPCs, respectively; no difference by Pearson’s chi-squared test; Fig. 2g,h). Moreover, little difference was found in the mean amplitude of maxi-mum EPSCCRACM between sPCs and cPCs (sPCs: 20 ± 6 pA, cPCs: 31 ± 9 pA, n = 6 mice; P = 0.063, Wilcoxon signed-rank test; Fig. 2i). Similarly, MEC axons also formed synapses onto nearly all tested CA2 PCs (Fig. 2h). The strengths of direct MEC excitatory synapses onto CA1 and CA2 PCs were similar to those found in recent studies27,35.
Taken together, these mapping results directly suggest that LEC TA axons formed excitatory synapses preferentially targeting cPCs, while MEC TA axons homogeneously innervated all PCs in the dCA1. Such differential projection of LEC and MEC TA axons to CA1 PCs stayed along the proximodistal (CA3 to subiculum) axis of dCA1 (Supplementary Fig. 5i). In agreement with previous studies36,37, we also found direct inhibitory transmission from LEC or MEC to only a small proportion of PCs in both dCA1 and CA2, without dif-ferential targeting onto dCA1 cPCs and sPCs from LEC and MEC (Supplementary Fig. 6).
We also compared the strength of local CA3 SC excitatory syn-apses on dCA1 cPCs and sPCs, by simultaneously recording EPSCs from pairs of neighboring cPC and sPC in response to electrical stimulation to CA3 SC axons (Supplementary Fig. 7a). We found that evoked EPSCs in cPCs were ~2.7-fold larger than those in sPCs (Supplementary Fig. 7b,c), suggesting differential strengths in feed-forward CA3 SC inputs to these two dCA1 PC subgroups when the indirect EC–CA1 circuit was activated.
Anterograde trans-synaptic viral tracing of direct EC–CA1 projectionsWe further verified the differential targeting of EC TA axons onto dCA1 cPCs and sPCs using anterograde trans-synaptic viral trac-ing38,39 with modified herpes simplex virus type 1 H129 (HSV-1-G3; Fig. 3a). Approximately 5.5 d after injecting HSV-1-G3 to LEC in wild-type (WT) mice, trans-synaptic transport of HSV-1-G3(-GFP) could be very initially detected in CA1, CA2 and DG. Notably, labeled dCA1 PCs showed typical twin apical dendrites (Fig. 3b). In contrast, HSV-1-G3 injection to MEC yielded substantially more trans-synapti-cally labeled dCA1 PCs (Fig. 3b). We repeated the HSV-1-G3 injec-tion procedure in Calb2-IRES-Cre::Ai9 mice, in which 83.7 ± 1.2% of Calb+ PCs in dCA1 SP layer but <10% of GABAergic INs across all layers were genetically labeled by the red fluorescence protein tdTo-mato (Supplementary Fig. 8; and see Online Methods for detailed characterization of transgenic mice). At 5–5.5 d after injection to LEC and MEC in transgenic mice, HSV-1-G3(-GFP) was detected in 75 ± 1.2% and 40 ± 1.0% of tdTomato+ Calb+ CA1 PCs, respectively, along the anterior–posterior axis of dorsal hippocampus (P = 5.1 × 10⁻¹², Mann-Whitney U-test; Fig. 3c,d). These trans-synaptic tracing results further supported the hypothesis that LEC TA axons preferentially targeted Calb+ cPCs in the dCA1 while MEC TA axons formed syn-apses unselectively onto both cPCs and sPCs. However, due to severe infection spread and tissue deterioration 5.5 d after the injection to
Per
cent
age
(%)
0
50
100
sPC cPC CA2
63
88 38 9
8 72
sPC cPC CA20.1
10
100
Per
cent
age
(%)
0
50
100
sPC cPC CA2
63 61 42
9 4 4
sPC cPC CA2
10
100
1,000
ResponsiveUnresponsive
1
Am
plitu
de (
pA)
P = 0.031
n = 6
n = 6
P = 0.031
P = 0.031
P = 0.031P = 0.031
P = 9.3 × 10⁻¹⁵
P = 2.2 × 10⁻¹⁶
Am
plitu
de (
pA)
LEC (coronal) MEC (horizontal)
a
h
f
e
i
b cAAV-hSynapsin-ChR2 injection
ChR2-mCherry DAPI
SO
SP
SR
SLM
MO
SGLEC
MEC
PRh
PaSPrS DG
CA1
CA3
CA
1D
G
LEC MEC
Bregma –2.6 mm
PO
50 ms
–7
SR
SP
SO
0 pA
–11
35 p
A
38 p
A
SR
SP
SO
0 pA0 pA
–12
50 ms
MO
SLM
SLM
MO
CA
1D
GC
A1
DG
LEC → CA1
MEC → CA1
sPC cPC
sPC cPC
d
g
LEC
PRhECT
TeA
CA1
DG
ResponsiveUnresponsive
Figure 2 Heterogeneous targeting of direct excitatory inputs from LEC and MEC to dCA1 PCs. (a,b) Histological verification of ChR2(-mCherry) expression (a) restricted within the LEC (left, coronal section) or the MEC (right, horizontal section) and (b) their projection axons in the dorsal hippocampus. Scale bar, 1 mm in a and 100 µm in b. (c) Diagram of CRACM experiments with the 10 × 10 photo-stimulation grids (with 40-µm interspot distances), covering the entire CA1 SLM and DG MO layers, centered on the meeting point of the layer border line and the cell soma. Magnification as in b. (d) Averaged EPSCCRACM traces and their dendritic maps for the LEC TA inputs (activated by 0.5-mW, 473-nm laser) overlaid on the reconstructed morphology of a recorded sPC (left) and cPC (right). Scale bar, 40 µm. (e) Percentages of morphologically identified sPCs and cPCs that were responsive (with EPSCCRACM, black) or unresponsive (white) to laser-grid activation of LEC TA axons at maximum laser intensity (5 mW). CA2 PCs were examined simultaneously in slices from each mouse (P = 9.3 × 10⁻¹⁵, 2.2 × 10⁻¹⁶ and 1.0 × 10⁻⁴ for sPC vs. cPC, sPC vs. CA2 and cPC vs. CA2, respectively; Pearson’s chi-squared test). (f) Comparison of EPSCCRACM amplitudes from CA1 sPCs, cPCs and CA2 PCs (measured at 2-mW laser intensity). Lines indicate data from the same mouse (P = 0.031 for all two-cell comparisons, Wilcoxon signed-ranked test). Error bars show s.e.m. (g–i) As in d–f but for CRACM assays of MEC TA inputs. Laser power was 0.1 and 2 mW for g and i, respectively. P = 0.031 for CA2 vs. sPC or cPC, Wilcoxon signed-ranked test. Scale bar, 40 µm.

© 2
017
Nat
ure
Am
eric
a, In
c., p
art
of
Sp
rin
ger
Nat
ure
. All
rig
hts
res
erve
d.
nature neurOSCIenCe advance online publication
a r t I C l e S
the dorsal and ventral parts of LEC or MEC, respectively, we failed to detect the reported opposite gradients of labeled PCs along the dorsal–ventral axis of the CA1 between MEC and LEC projections (Supplementary Fig. 9).
We also conducted double immunogold-labeling electron micros-copy (EM) experiments to detect ultrastructures of EC TA synapses on distal dendrites of dCA1 Calb+ cPCs after the AAV-hSyn-ChR2-mCherry injection to LEC or MEC (Online Methods). Under trans-mission EM, typical asymmetric synaptic ultrastructures were detected for both LEC–cPC (Fig. 3e) and MEC–cPC (Fig. 3f) direct connec-tions, in which small mCherry immunogold silver-labeled particles (~25 nm) and bigger Calb-labeled particles (~60 nm) were associ-ated with presynaptic axonal terminals and postsynaptic densities, respectively. This provides direct structural evidence that EC TA axons formed direct excitatory synapses on dCA1 cPCs.
Homogeneity of direct EC TA projections to most dCA1 interneuronsWe further mapped direct EC excitatory projections to parvalbu-min (Pavlb)- or somatostatin (Sst)-expressing inhibitory INs in the dCA1 using the same CRACM assay described above in Pavlb-Cre::Ai9 and SST-IRES-Cre::Ai9 transgenic mice, in which these two INs are genetically labeled by tdTomato. With additional reconstruction of IN morphology, we found that axo-axonic cells and basket cells (both expressing Pavlb) as well as bistratified cells (expressing both Pavlb and Sst; Fig. 4a)1,21 were directly innervated by TA excitatory axons from both LEC and MEC, with similar synaptic strengths (no differences in Pearson’s chi-squared test and Mann-Whitney U-test; Fig. 4b,c). Thus, these CRACM results suggest that unlike the differential pro-jections from LEC and MEC to dCA1 PCs, EC TA excitatory axons homogenously innervated most dCA1 INs.
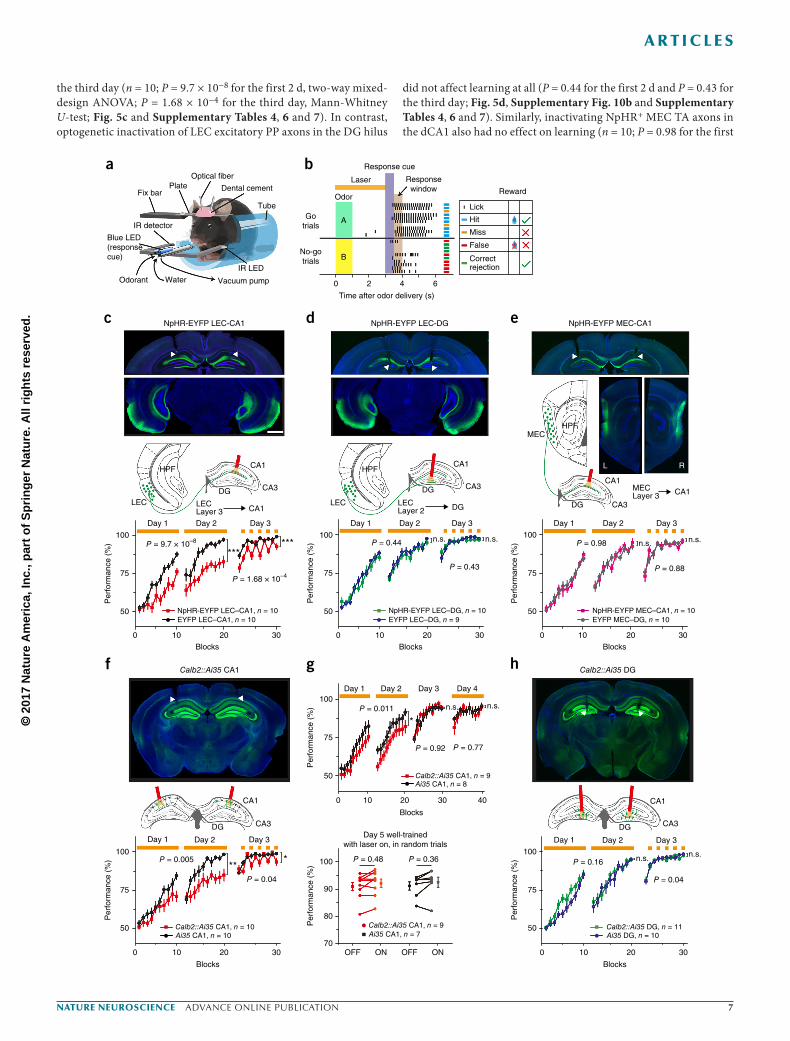
Inactivation of direct LEC–dCA1 cPC circuit slows olfactory associative learningIt has been proposed that the LEC transfers olfaction-9–13, item- and object-related7,8 nonspatial information into the hippocampus6,14. A recent study demonstrated that odor-induced coherent neural activities at 20–40 Hz were elevated between LEC and distal CA1 dur-ing olfactory cue–place associative learning, presumably via the direct pathway11. We thus tested whether the distinct LEC TA–dCA1 cPC direct circuit, which we identified here, is involved in olfactory asso-ciative learning using a simple Go–No-go behavioral task. In the task, headfixed mice (to minimize potential spatial interference4,5) were trained to associate two odorants, ethyl acetate and methyl butyrate, with water licking (go) and nonlicking (no-go) behaviors, respec-tively40 (Fig. 5a). Each training trial consisted of a 1-s odor sampling period and subsequent 2-s delay, followed by a 0.5-s response cue (blue LED light), at which mice had to decide whether to lick or not based on the odor identity (Fig. 5b). The animal was rewarded with 8–10 µL water when licking occurred within a 0.5-s response window after the cue in the Go trials only, and the behavioral performance (index) was calculated as the sum of hit and correct rejection trials divided by the total 20 trials in each block (Fig. 5b).
We first tested whether the direct TA synapses from LEC or MEC contributed to olfaction-based associative learning. To this end, we injected AAV-CaMKIIα-NpHR-EYFP or AAV-CaMKIIα-EYFP (con-trol) into LEC or MEC in both hemispheres, and two optical fibers were bilaterally implanted above the dCA1 SR to deliver yellow light for activating Cl− pump halorhodopsin (NpHR) in EC TA axons (Fig. 5c). Only behavioral results from those animals in which a confined viral expression was seen within LEC or MEC in the histological check after behavioral tests (Supplementary Fig. 10 a–c) were included for data analysis in the following experiments. Laser light at 589nm (3-s duration, 10 mW at the fiber tip) was applied to the odor sampling and delay periods in all blocks during the first 2 d and in interleaved
Contralateral
SO
SP
SR
HSV-1-G3a
b
c
d
e f
UL US
BAC
CMV-p SV40-pGFP GFP CMV-p GFP
5.5 dLEC injection
5 dMEC injection
Ipsilateral
0
25
50
75
100
2 41
A→P section (~300-µm interval)
3 5
Col
ocal
izat
ion
rate
(%
)DAPI
Calb2-tdTomato HSV-1-G3
Merge
Calb2-tdTomato
DAPI
HSV-1-G3
Merge
SO
SP
SR
SO
SP
SR
LEC injection, n = 6MEC injection, n = 7
P = 5.1 × 10⁻¹²
LEC → dCA1 Calb+ PC synapse MEC → dCA1 Calb+ PC synapse
Post
Pre
Post
Pre Pre
Post
LEC → dCA1
MEC → dCA1
Pre
Post
Figure 3 Trans-synaptic virus tracing and EM assay of direct EC–dCA1 PC synapses. (a) Genome structure of HSV-1-G3 recombinant virus: 152 kb with unique long (UL) and unique short (US) segments. HSV-1-G3 contains a GFP driven by an SV40 promoter within the BAC sequence and two GFPs driven by CMV promoter cassettes inserted into the UL and US segments, respectively. (b) Left: Section images of 5.5 and 5 d after HSV-1-G3 was injected in the LEC (top) and MEC (bottom) showing that the anterograde trans-synaptic transport of HSV-1-G3 first infected the ipsilateral hippocampal DG, CA1 and CA2 regions. Scale bar, 1 mm. Right: higher-resolution z-stacked images of the boxed regions in the left panels, showing that HSV-1-G3 injected in the LEC (top) preferentially label the downstream CA1 cPC (arrowheads, principal branch-points of typical bifurcating apical dendrites), while the MEC injection (bottom) trans-synaptically infected most CA1 PCs in the SP layer. Scale bar, 100 µm. (c) Similar anterograde trans-synaptic viral tracing labeled dCA1 cells (GFP, green), 5.5 or 5 d after the HSV-1-G3 injection in the LEC (top) or MEC (bottom) of Calb2-IRES-Cre::Ai9 mice. Scale bar, 100 µm. (d) Colocalization percentage of Calb+tdTomato+ cells labeled by HSV-1-G3 in the dCA1 SP layer across the anterior–posterior axis following the HSV-1-G3 injection in LEC or MEC (n = 6 and 7 for LEC and MEC injections, respectively, P = 5.1 × 10⁻¹²; Mann-Whitney U-test). Error bars show s.e.m. (e,f) Electron micrographs showing the double immunogold-labeled direct (e) LEC–cPC or (f) MEC–cPC asymmetric synapses. Presynaptic axonal terminals and postsynaptic dendrites are identified by mCherry immunogold silver-labeled particles (~25 nm) and Calb immunogold silver-labeled particles (~60 nm), respectively. Scale bars, 0.1 µm.

© 2
017
Nat
ure
Am
eric
a, In
c., p
art
of
Sp
rin
ger
Nat
ure
. All
rig
hts
res
erve
d.
advance online publication nature neurOSCIenCe
a r t I C l e S
blocks on the third day. Control mice, which expressed EYFP only, steadily improved their behavioral performance over 2 training days and maintained over 90% performance ratings on the third day under laser illumination in the dCA1 (Fig. 5c). However, in mice expressing
NpHR in LEC, similar laser illumination combined with optogenetic inactivation of LEC excitatory TA axons in the dCA1 significantly slowed the learning process in the first 2 d, and interleaved inactiva-tion in every other block transiently decreased the performance on
0 pA
–17.5a
b c
0 pA
–22 –13
MO
SLM
SR
SP
SO
100
50
0LEC MEC
Per
cent
age
(%)
LEC MEC LEC MECAxo-axonic Basket Bistratified
ResponsiveUnresponsive
6 5
1 7 8 11 18
25 20 22 29
MEC → axo-axonic cell LEC → basket cell LEC → bistratified cell
0 pA
10
100
1,000
Am
plitu
de (
pA)
LEC MEC LEC MEC LEC MECAxo-axonic Basket Bistratified
P = 0.43 P = 0.50 P = 0.59
Figure 4 Homogenous targeting of EC direct TA inputs onto most dCA1 inhibitory INs. (a) CRACM maps of LEC or MEC TA inputs (stimulated at 1-mW laser power) overlaid on reconstructed morphologies of recorded Pavlb+ axo-axonic cells and basket cells, as well as bistratified Pvalb+Sst+ cells. Black, dendrites; red, axons; scale, 40 µm. (b) Percentages of tested dCA1 INs that were innervated by LEC and MEC axonal projections, measured from the CRACM experiments (under maximum laser intensity; P = 1, 0.57 and 0.81 for comparisons between LEC and MEC innervations on the axo-axonic, basket and bistratified cells, respectively; P = 0.23 and 0.50 for comparisons between different cell types within LEC and MEC, respectively; Fisher’s exact test). (c) EPSPCRACM amplitudes (at 2-mW laser) of the direct LEC or MEC synapses on INs. P-values were calculated by Mann-Whitney U-test. Error bars show s.e.m.
Figure 5 Selective optogenetic inactivation of direct LEC TA axons or of dCA1 Calb+ cPCs slows olfactory associative learning. (a,b) Diagram of behavioral setup (a) and model (b) of the olfactory cue-based associative Go–No-go task. Odor A, ethyl acetate; odor B, methyl butyrate. (c–e) Optogenetic inactivation of the (c) LEC TA–dCA1 path, but not the (d) LEC PP–DG path or the (e) MEC TA–dCA1 path, impaired olfactory associative learning in mice injected with AAV-CaMKIIα-NpHR-EYFP in the LEC or MEC, compared to control mice injected with AAV-CaMKIIα-EYFP. Yellow lines indicate the 589-nm laser illumination (at 10 mW) over trial blocks. Scale bar, 1 mm. Statistical significance was tested by two-way mixed-design ANOVA for the first 2 d and Mann-Whitney U-test for the third day (P = 9.7 × 10⁻⁸, 0.44 and 0.98 for the first 2 d; P = 1.68 × 10⁻⁴, 0.43 and 0.88 on the third day for LEC–dCA1 (n = 10), LEC–DG (n = 9 or 10) and MEC–dCA1 (n = 10), respectively. (f) Optogenetically suppressing activities of postsynaptic dCA1 Calb+ cPCs impaired associative learning in Calb2-IRES-Cre::Ai35 mice (P = 0.005 for the first 2 d, two-way mixed-design ANOVA; P = 0.04 for the third day, Mann-Whitney U-test; n = 10). (g) Similar inactivation of postsynaptic dCA1 cPCs did not affecting behavioral performance of the well-trained mice on days 4 and 5 (without laser stimuli on the third day). P = 0.011 for the first 2 d, two-way mixed-design ANOVA; P = 0.92 and 0.78, Mann-Whitney U-test for the third day and fourth day, respectively, for comparison between Calb2-IRES-Cre::Ai35 (n = 9) and Ai35 (n = 8) mice; P = 0.48 and 0.36 for the laser ON versus OFF in the two types of mice, respectively, on the fifth day; Mann-Whitney U-test. (h) Optogenetically suppressing activities of Calb+ granule cells in the DG does not affect learning (P = 0.16 and 0.62 for the first 2 d and the third day; n = 10 or 11).
© 2
017
Nat
ure
Am
eric
a, In
c., p
art
of
Sp
rin
ger
Nat
ure
. All
rig
hts
res
erve
d.
nature neurOSCIenCe advance online publication
a r t I C l e S
the third day (n = 10; P = 9.7 × 10⁻⁸ for the first 2 d, two-way mixed-design ANOVA; P = 1.68 × 10⁻⁴ for the third day, Mann-Whitney U-test; Fig. 5c and Supplementary Tables 4, 6 and 7). In contrast, optogenetic inactivation of LEC excitatory PP axons in the DG hilus
did not affect learning at all (P = 0.44 for the first 2 d and P = 0.43 for the third day; Fig. 5d, Supplementary Fig. 10b and Supplementary Tables 4, 6 and 7). Similarly, inactivating NpHR+ MEC TA axons in the dCA1 also had no effect on learning (n = 10; P = 0.98 for the first
Optical fibera b
c d e
f g h
Dental cement
Tube
PlateFix bar
IR detector
Blue LED(responsecue)
Odorant Water Vacuum pump
NpHR-EYFP LEC-CA1 NpHR-EYFP LEC-DG NpHR-EYFP MEC-CA1
HPF HPF
LEC LECDG DG
CA1
CA3
CA1
MECHPF
CA3
CA3
CA1
LECLayer 3
LECLayer 2
Day 1
100
75
50
100
75
50
0 10 20 30
Blocks
Calb2::Ai35 CA1
CA1
CA3DG
CA1
CA3DG
Calb2::Ai35 DG
0 10 20 30
Blocks
0 10 20 30
Blocks
NpHR-EYFP LEC–CA1, n = 10EYFP LEC–CA1, n = 10
Per
form
ance
(%
)
Per
form
ance
(%
)
100
75
50
Per
form
ance
(%
)Day 2
P = 9.7 × 10⁻⁸
P = 1.68 × 10⁻⁴
P = 0.44
P = 0.43 P = 0.88
P = 0.98n.s.
n.s.
n.s. n.s. n.s.
Day 3 Day 1 Day 2 Day 3 Day 1 Day 2 Day 3
******
CA1
IR LED
Response cue
Laser Responsewindow Reward
Lick
Hit
Miss
False
Correctrejection
Odor
Gotrials
No-gotrials
0 2 4 6
Time after odor delivery (s)
A
B
DG DG
MECLayer 3
L R
CA1
NpHR-EYFP LEC–DG, n = 10EYFP LEC–DG, n = 9
NpHR-EYFP MEC–CA1, n = 10EYFP MEC–DG, n = 10
Day 1
100
75
50
0 10 20 30
Blocks
Calb2::Ai35 CA1, n = 10Ai35 CA1, n = 10
Calb2::Ai35 CA1, n = 9Ai35 CA1, n = 7
Per
form
ance
(%
)
Day 2
P = 0.005
P = 0.04
Day 3
***
Day 1
100
75
50
0 10 20 30
Blocks
Calb2::Ai35 DG, n = 11Ai35 DG, n = 10
Per
form
ance
(%
)
Day 2
P = 0.16
P = 0.04
Day 3
Day 1100
75
50
0 10 20 30 40
Blocks
Day 5 well-trainedwith laser on, in random trials
P = 0.48100
90
80
70OFF ON OFF ON
Per
form
ance
(%
)
P = 0.36
Calb2::Ai35 CA1, n = 9Ai35 CA1, n = 8
Per
form
ance
(%
)
Day 2
P = 0.011
P = 0.92 P = 0.77
Day 3 Day 4
*
n.s.
n.s. n.s.

© 2
017
Nat
ure
Am
eric
a, In
c., p
art
of
Sp
rin
ger
Nat
ure
. All
rig
hts
res
erve
d.
advance online publication nature neurOSCIenCe
a r t I C l e S
–1 0 1 2
100
80
60
40
20
0
≥1
0
≤–1
OS
I
00
10
40
50
0
–2 –1 1 2
0.25
0.5
0.75
1
0 0.5 1.5 2 2.5
0 10 20 30
50
75
100
Per
form
ance
(%
)
Blocks
Calb2-Cre::Ai35, n = 10
Day 1 Day 2 Day 3
Day 1
Cel
l num
ber
Cum
ulat
ive
OSI
Time after odor delivery (s)
0 1 2
Time after odor delivery (s)
OdorDay 2 Day 3
Optetrode
–1 0 1 2
80
60
40
20
0–1 0 1 2
80
60
40
20
0
Odor Odor+− −+ +–
PV
diff
eren
tial i
ndex
Gotrials
No-gotrials
0
200
20
Tria
l no.
Unit_Calb2_15_Day3_tet021b Unit_Calb2_20_Day3_tet025ma b
c e
d
5
Rat
e(H
z)
–1 0 1 2Time after odor delivery (s)
Odor Odor
–1 0 1 2
0
2 5
0Firi
ng r
ate
(Hz)
0 1 2 3–1Time after laser on (min)
Laser Laser
5
0 1 2 3–1
1 ms 0.05
mV
1 ms 0.1
mV
f
0
0.5
1
100Performance (%)
Calb– PC, r = 0.18, P = 0.02, n = 30Calb+ PC, r = 0.29, P = 0.01, n = 21
9050
Calb Calb Calb
0–0.5
0.5
OS
I
00
0
Calb– PC, n = 232Calb+ PC, n = 46
30
P = 0.004
| OSI |
0
0.6
0.8
1
0 1 20
–1–1–1 0 1 2
Calb– PC, n = 85Calb+ PC, n = 15
Calb– PC, n = 73Calb+ PC, n = 13
Calb– PC, n = 74Calb+ PC, n = 18
Day 1 Day 2 Day 3
| OS
I |
0
–0.5
Uni
ts
0.5
807060
1
20
Calb+
Calb–
0
0.4
0.8
Mea
n | O
SI |
Day 1Day 2Day 3
0.4
0.2
0.6
0.8
1
0.4
0.2
0.6
0.8
1
0.4
0.2* * **
***** **
***** *
***** ** *** *
*
********
**
***
*
*** ** ***
*****
*
**** **
******* * * ***
*
r(Calb–) = 0.98r(Calb+) = 0.82
P = 4.2 x 10⁻⁷
Figure 6 Calb+ cPCs develop more selective odor representations during learning. (a) Behavioral performance of Calb2-IRES-Cre::Ai35 mice implanted with optetrodes in dCA1 (insert: scale bar, 1 mm). (b) Top: optogenetically identified units from dCA1 Calb+ PC (red) and Calb− PC (blue) in vivo, based on 589-nm, 10-mW laser-induced suppression of baseline spiking activity (raster and peristimulus time histogram (PSTH) plots). Bottom: spike raster, rate plots and corresponding OSI during odor sampling in Go and No-go trials, respectively. Error bars represent s.e.m. (c) OSIs of all recorded dCA1 PCs on individual learning days. Each row represents a single unit, sorted by values of the 1.5-s OSI. Red and blue bars in the right column label Calb+ and Calb− units, respectively. (d) PV analysis for odor-specific representations of dCA1 Calb+ and Calb− units over 3 d of learning. Black dashed lines, 95% chance level (*P < 0.05 for comparison between original cPC PDI vs. 95% confidence interval of bootstrapped sPC PDIs or vice versa). (e) Histogram distribution of the 1.5-s OSI (top) and cumulative percentage of absolute 1.5-s OSI (bottom) of 46 dCA1 Calb+ and 232 Calb− units (P = 0.004 and 4.2 × 10⁻⁷, two-sample Kolmogorov-Smirnov test and Mann-Whitney U-test, respectively). (f) Correlation between the behavioral performance and the averaged absolute mean OSI of Calb+ (red) and Calb− PCs (blue) between different mice over 3 d of learning. Each dot represents mean values from a mouse on a given day. Lines, linear regression; P = 0.01 and 0.02 for 21 Calb+ PCs and 30 Calb− PCs, respectively, measured from 10 mice over 3 d.

© 2
017
Nat
ure
Am
eric
a, In
c., p
art
of
Sp
rin
ger
Nat
ure
. All
rig
hts
res
erve
d.
nature neurOSCIenCe advance online publication
a r t I C l e S
2 d and P = 0.88 for the third day; Fig. 5e, Supplementary Fig. 10c and Supplementary Tables 4, 6 and 7), despite their homogeneous innervations of nearly all PCs and INs (Figs. 2–4). Thus, these results strongly suggest that the LEC TA–dCA1 direct path, but not the MEC TA–dCA1 direct path or the LEC PP–DG indirect path, was required for the acquisition of olfactory associations in learning.
Next, we examined the role of postsynaptic dCA1 Calb+ cPCs in learning. The Calb2-IRES-Cre mice were crossed with Ai35 (Rosa-CAG-LSL-Arch-GFP-WPRE) mice to achieve specific expression of yellow photoactivated proton pump Archaerhodopsin (Arch) in most Calb+ cells in the hippocampus. Bilaterally suppressing Arch+ cPC activity by 589-nm laser illumination above the dCA1 significantly impaired learning compared with Ai35 control littermates (n = 10; P = 0.005 for the first 2 d and P = 0.04 for the third day; Fig. 5f, Supplementary Fig. 10d and Supplementary Tables 5, 8 and 9).
In another batch of mice, we advanced the optical fibers into the DG hilus to suppress neuronal activity of Arch+Calb+ granule cells and found that it did not affect learning (P = 0.16 for the first 2 d and P = 0.62 for the third day; Fig. 5h and Supplementary Tables 5, 8 and 9). Moreover, when the odor Go–No-go contingencies were reversed in the same tested mice (on days 4–6), the reversed olfac-tory association was again differentially affected by separate inacti-vation of each of these three circuits (n = 9–11 mice; Supplementary Fig. 11 and Supplementary Tables 10–15). Notably, we observed that, in well-trained Calb2-IRES-Cre::Ai35 mice on days 4–5, optoge-netically inactivating postsynaptic Calb+ cPCs in the dCA1 did not affect performance (Fig. 5g). This suggests that, once the associa-tion is well established, activity of hippocampal CA1 cPCs was not required for this simple task, a result that is consistent with the previous findings41,42.
0
50
100
Calb–
Per
cent
age
(%)
Calb+
38
45 111
P = 0.33
c dCalb+ PC Calb– PC
124
e
0 1 2 3 40
0.2
0.4
Rat
io
Spatial information (bits per spike)
0 50 100
Distance (cm)
0 50 100
Distance (cm)
0
5
10
15
20
Tim
e (m
in)
0
10
20
30
Spe
ed (
cm/s
)
0
10
20
30
Spe
ed (
cm/s
)
0 Hz
6.5
0 Hz
21.7
0 Hz
30.2
0 Hz
22.5
0 50 100
Distance (cm)
0 50 100
Distance (cm)
5
10
15
0
20
Tim
e (m
in)
a bCalb2-Cre::Ai35 mice
Camera
U maze
Water port
Platform
Visual cue
Laser illumination
Pyr
amid
al c
ell u
nit
Time (min)
0 10 20 30
LFP0
10
20
30
Fre
quen
cy (
Hz)
Fre
quen
cy (
Hz)
1.5
1
0.5
0
–50 0 50 100Time (s)
150
–50 0 50 100 150
1.5
1
0.5
0
1 ms 0.2
mV
0.2
mV
Unit_19
Unit_27
Nonspatial cellPlace cell
P = 0.28
Calb–, n = 124
Calb+, n = 38
*
*
Figure 7 Similar place field properties of the dCA1 cPCs and sPCs. (a) Diagram of the experimental configuration for characterizing place cells using a U-maze with water ports in either end, with a top camera recording the animal’s trajectory. (b) Yellow 589-nm laser illumination (2-min duration) to identify Calb+Arch+ cells in vivo, with repeated interleaved illumination ON or OFF (yellow bars indicate ON). Each row of raster spike events represents a single unit from an optetrode recorded Calb2-IRES-Cre::Ai35 mouse. Red blocks indicate Calb+ units. PSTHs: representative Calb− (unit 27) and Calb+ (unit 19) dCA1 PCs. (c) Examples of place cells in dCA1 Calb+ and Calb− PCs, respectively. Top: place fields of recorded PCs in the U-maze (clockwise and counterclockwise); middle: animal speed and dots representing spikes of the example PC; bottom: animal trajectory and the firing rate of the example PC (yellow bars indicate laser-ON durations). Scale bars, 10 cm. (d) Percentages of place cells in the identified 83 Calb+ cPCs and 235 Calb− sPCs in the dCA1. P = 0.33, Pearson’s chi-squared test. (e) Comparison of spatial information encoded by place cells in the Calb+ cPC and Calb− sPC groups. P = 0.28, Mann-Whitney U-test.

© 2
017
Nat
ure
Am
eric
a, In
c., p
art
of
Sp
rin
ger
Nat
ure
. All
rig
hts
res
erve
d.
0 advance online publication nature neurOSCIenCe
a r t I C l e S
Taken together, the above behavioral results from inactivating dif-ferent EC–hippocampus circuits support a critical role for the direct LEC–dCA1 cPC circuit in the acquisition of olfactory associations.
Neuronal-activity correlates of learning in dCA1 PCsSince odor-induced neuronal activities have been recorded in the LEC9–11,13 and hippocampal CA1 neurons11,43, we conducted in vivo recording in the dCA1 to elucidate how cPCs and sPCs were differentially involved in olfactory associative learning. For this purpose, we implanted optetrodes in the dCA1 of Calb2-IRES-Cre::Ai35 mice (n = 10, Supplementary Fig. 10e), which exhibited the same learning ability (Fig. 6a). Because photosensitive Arch was selectively expressed in most Calb+ cPCs and in few INs in the dCA1 (Supplementary Fig. 8e,g,h), we were able to optogenetically identify this PC subpopulation based on their inhibitory response (relative to the baseline spiking activity) to the repeated 589-nm laser illumina-tion (2-min duration,10 mW; Fig. 6b; and see Online Methods and Supplementary Fig. 12 for optogenetic tagging methods with Arch versus ChR2). In total, we recorded 278 single dCA1 PCs in the three consecutive days of training, of which 198 showed increased or decreased spiking rates in response to the two task-related odors, with varied amplitudes and selectivity (Supplementary Fig. 13 and Supplementary Table 16). The other 80 units were not responsive to either odor; notably, 75 of these nonresponsive units did not show inhibitory responses to the 589-nm laser illumination and thus likely were Arch−Calb− sPCs (Supplementary Table 16). As shown in Figure 6b, odor-evoked responses from optogenetically identified Calb+ cPCs and Calb− sPCs exhibited different magnitudes of odor selectivity index (OSI; Online Methods).
By pooling OSIs of all 278 units according to individual learning days (Fig. 6c) for population vector (PV) analysis, we found that the cPC population showed substantially larger changes in the PV dif-ferential index for their odor-evoked spike responses in the first 2 d in comparison with the sPC population (bootstrapped 100 times, P < 0.05; Fig. 6d). However, PV differential indexes for both popula-tions decreased to similar extents on the third day (Fig. 6d). Over 3 d, the OSIs of all sPC units showed a single Gaussian distribution (R2 = 0.98, median: −0.15), while that of all cPCs apparently had two discrete Gaussian distributions (R2 = 0.82, medians: −0.47 and 0.58 for Calb+; P = 0.004 for Calb+ versus Calb− PCs, two-sample Kolmogorov-Smirnov test; Fig. 6e). Cumulative distributions of abso-lute values of OSI further indicated that Calb+ cPCs showed much greater odor selectivity than sPCs (P = 4.2 × 10⁻⁷, Mann-Whitney U-test; Fig. 6e). Moreover, separated analysis of neuronal correlates from the correct and error trials in the task suggested that the mean firing rate and specificity of odor responses in the cPCs were higher than those of the sPCs when animals made correct responses (hit or correct rejection; Supplementary Fig. 14). This implies that cPCs could play more important roles relevant to the behavioral perform-ance. Consistent with this idea, we indeed observed that the mean OSI of cPCs was better correlated with behavioral performance than that of sPCs in individual mice (Fig. 6f). Thus, these in vivo recording results suggest that Calb+ cPCs in the dCA1 play more pivotal roles in the representation of odor association during olfactory learning.
Comparison of place-field properties between dCA1 sPCs and cPCsThe observed homogeneous projection of MEC TA axons to dCA1 sPCs and cPCs (Fig. 2g–i) may suggest that the two PC groups receive equivalent amounts of spatial information from the MEC and thus have similar spatial properties. To test this idea, we used a U-maze to examine the place fields44 of dCA1 sPCs and cPCs in n = 5 Calb2-
IRES-Cre::Ai35 mice after the associative learning task (Fig. 7a and Online Methods). We used same 589-nm laser illumination, applied before or during the maze exploration, to optogenetically tag single units recorded from Calb+ cPCs or Calb− sPCs (Fig. 7b,c). As shown by example PCs in Figure 7c, the cPCs and sPCs recorded by an optetrode were both place cells, displaying robust spike discharges at their distinctive place fields when the mice shuttled through the U-shaped path in either direction. In total we recorded 83 Calb+ cPC and 235 Calb− sPC units, of which 45.8% and 52.8%, respectively, were clearly characterized as place cells, indicating no difference in the ratio between these two cell populations (P = 0.33, Pearson’s chi-squared test; Fig. 7d). Moreover, place cells in the two populations could encode equivalent amounts of spatial information (P = 0.28, Mann-Whitney U-test; Fig. 7e). Thus, these results suggest that dCA1 cPCs and sPCs can equally encode spatial information.
DISCUSSIONIn this study, we delineated detailed synaptic targets of direct MEC and LEC excitatory TA axons onto CA1 neurons in the dorsal hippoc-ampus and their differential roles in the olfactory associative learn-ing. More importantly, we revealed a distinct LEC–dCA1 cPC direct circuit that is critically involved in olfactory associative learning.
Accumulating evidence indicates that excitatory PCs in the hip-pocampal CA1 region have highly variable molecular, morphological and electrophysiological characteristics along the dorso–ventral23,24, proximal–distal24,28,45 and radial (superficial–deep) axes22–24,26,29–31. Particularly along the radial axis, subdivisions of deep and superficial PCs in the CA1 have been long recognized. Deep and superficial PCs are generated at different times and express different genes22–24,46. Recent in vivo recording studies reported different spiking patterns between these two sublayers: deep cells were more likely to burst and exhibited more spatially tuned firing than superficial cells29, and they spiked differentially in the hippocampal theta rhythm and sharp-wave ripple activity30. In many studies, Calb has been used as a prominent neurochemical marker for roughly differentiating the superficial and deep CA1 PCs26,27,30. Here we demonstrated that these superficial Calb+ PCs have more complex dendritic arborizations with twin api-cal trunks (cPCs), while deep Calb− PCs display simple arborizations with a single apical trunk (sPCs; Fig. 1). Moreover, unlike the two morphologically distinct PC subgroups in the subiculum border28, dCA1 cPCs and sPCs have nearly identical intrinsic spiking patterns and properties (Supplementary Fig. 2 and Supplementary Table 3). However, they behaved differentially in a brain-state-dependent man-ner in vivo (Supplementary Fig. 15), in agreement with previous observations29. Thus, our characterization of dCA1 PCs on mor-phological, molecular and electrophysiological aspects provides an integrated view of the previously reported individual heterogeneous properties of PCs21–31, endorsing the existence of two distinct types of Calb-profiled PCs.
Our CRACM assay further elucidated detailed synaptic maps of the direct TA path from LEC and MEC to different types or layers of dCA1 neurons. This path constitutes at least three major projections. First, LEC excitatory TA axons formed synapses selectively onto dCA1 cPCs, whereas MEC excitatory axons targeted all dCA1 PCs. Second, excitatory TA axons from both LEC and MEC homogene-ously innervated most Pavlb+ and Sst+ CA1 INs. Third, LEC and MEC both sent direct inhibitory axons to dCA1 but only innervated small proportions of cPCs and sPCs there. Direct EC inhibitory pro-jections were also found to differentially target different subtypes of CA1 INs36,37, providing a disinhibitory regulation on CA1 activity. Functionally, the direct EC inhibitory transmission to dCA1 was

© 2
017
Nat
ure
Am
eric
a, In
c., p
art
of
Sp
rin
ger
Nat
ure
. All
rig
hts
res
erve
d.
nature neurOSCIenCe advance online publication
a r t I C l e S
shown to play roles in regulating CA1 network activity36 and gating the induction of an input-timing-dependent long-term potentiation of SC–CA1 synapses37. Among the abovementioned direct EC–CA1 circuits, the last two produced feedforward and direct inhibitions to dCA1 PCs, respectively. These two forms of inhibition may modulate the direct EC excitatory inputs directly. However, we observed that applying picrotoxin had little effect on direct EC excitatory synapses on dCA1 PCs (Supplementary Fig. 5b,c,h) when we optogenetically activated both inhibitory and excitatory EC axons (ChR2 expression driven by the hSynapsin promoter). We are aware that picrotoxin can eliminate both long-range EC and local CA1 inhibitory trans-mission to PCs and INs in CA1 circuits, which may cancel out the effect of direct EC inhibitory transmission on EC excitatory inputs on CA1 PC dendrites. Thus, future experiments using optogenetic proteins exclusive to the EC inhibitory or excitatory neurons are required to examine how direct EC excitatory and inhibitory inputs are integrated in the CA1 PC.
The MEC and LEC have been proposed as transferring spatial context4,5 and nonspatial object6–8 or odor9–11,13 information to the hippocampus, respectively. Accordingly, our findings suggest that in the context of direct EC–CA1 circuits, nonspatial information from LEC may be transferred to a discrete group of dCA1 Calb+ cPCs, while spatial information from MEC could be widely and evenly distributed to most dCA1 cells. This notion is further supported by our observa-tion that the proportions of place cells and the amount of encoded spatial information in the two PC subgroups were comparable (Fig. 7). Moreover, an indirect circuit via CA2, EC layer 2→CA2→CA1 or EC layer 2→DG→CA2→CA1, may transfer EC inputs pref-erentially to the deep Calb− PCs in the CA127. Thus, we postulate that superficial CA1 cPCs could function as connection nodes, integrating spatial and nonspatial information47, and may exert more prominent or unique functions in the process of associating and storing dif-ferent information in the cortico-hippocampal network. Notably, a proportion of dCA1 sPCs showed both odor-evoked spiking responses and small increases of specificity to presentation of odors during olfactory learning (Fig. 6d). Thus, their potential contributions to learning cannot be ignored.
Our study also found that the distinct LEC–dCA1 cPC direct circuit underlies olfactory associative learning. This underscores the notion that the direct EC–CA1 network is crucial for acquisition or recol-lection of cue-based associative recognition memory11,17,35. We note that in both initial and reversed learning tasks, slopes of the learning curve in the first 2 d and the baseline performance rate on the third day (first block without laser stimulation) did not differ between the experimental and control groups, while on the third day, interleaved inactivation of the direct LEC–dCA1circuit only transiently decreased the performance (Fig. 5). These two results support the idea that the direct path is more likely to contribute to the recollection of olfactory association41. However, in well-trained mice during days 4 and 5, inactivation of postsynaptic dCA1 Calb+ cPCs no longer affected performance (Fig. 5g). This is consistent with previous findings that memory may be transferred41 or mice may employ familiarity rather than recollection to resolve ambiguities42. However, other previous studies showed that removing LEC inputs in well-trained rats, by local muscimol infusion12 or by lesioning the hippocampal fornix48, dramatically impaired the animal’s performance in a complex multi-odor cue-discrimination Go–No-go task, but not in a simple two-cue discrimination task. These results are inconsistent with our finding that the LEC–dCA1direct circuit was required for simple two-cue discrimination (Fig. 5c,f). This discrepancy may be due to the use of different inactivation methods. Chemical or surgical lesions often
confound a circuit with unspecific perturbations and overcompensatory functions, in comparison with more precise optogenetic methods49. Finally, our behavioral results (Fig. 5g) also support the conjunctive representation theory50, in which the strength of an association begins and accumulates in the hippocampus and the formed association is then transferred to other cortical regions for long-term storage.
In conclusion, our study has elucidated the selective targeting of direct LEC excitatory projections to superficial Calb+ cPCs in the dCA1, forming a distinct LEC–dCA1 direct circuit that is critically involved in hippocampal-dependent olfactory associative learning. Given that many other distinct direct or indirect EC–hippocampal circuits exist, more studies will be needed to understand how these distinct circuits differentially or synergistically control various aspects of learning and memory.
METHODSMethods, including statements of data availability and any associated accession codes and references, are available in the online version of the paper.
Note: Any Supplementary Information and Source Data files are available in the online version of the paper.
AcknowledgmenTSWe thank R. Hou (ION) for her help with the behavioral test; B. Wang and Y.Shu (BNU) for their help with single-cell RT-PCR; J.Z. Huang (CSHL) for providing the Calb2-IRES-Cre mice; Z. Qiu (ION) for providing AAV-hSyn-ChR2-mCherry vectors; and J.J. Knierim (JHU), L. Zhang and H. Tao (USC), Y.X. Lin (MIT) and B. Li (CSHL) for their critical comments on the manuscript. This work was supported by grants from the State Key Research Program of China (2011CBA00404 to X.Z.), the Basic Research Project of Shanghai Science and Technology Commission (No. 15JC1400102 to L.L.) and the Natural Science Foundation of China (NSFC 81327802 to S.Z. and Y. Liu).
AUTHoR conTRIBUTIIonSX.Z. conceived and supervised the project, and X.Z. and Y. Li designed the experiments. Y. Li performed the virus injection, in vitro electrophysiology, immunostaining, single-cell RT-PCR, cellular imaging, morphological reconstruction and behavioral tests. J.X. performed the in vivo optetrode recording, spike sorting and place field analysis. N.L. and M.J.R. performed the TREE analysis, cluster analysis and computational simulation. W.Z., H.J. and M.L. designed and prepared the HSV virus. N.H., J.T. and J.C. designed and conducted the EM experiment. Y. Liu and S.Z. designed and built the AOD-based rapid laser stimulation system. J.Z. and C.L. participated in the behavioral experiment. X.G. and X.L. prepared and genotyped all transgenic mice. Y. Li, L.L. and X.Z. analyzed the data. X.Z. and Y. Li wrote the manuscript.
comPeTIng FInAncIAl InTeReSTSThe authors declare no competing financial interests.
Reprints and permissions information is available online at http://www.nature.com/reprints/index.html.
1. Andersen, P., Morris, R., Amaral, D., Bliss, T.V.P. & O’keefe, J. The Hippocampus Book (Oxford University Press, 2007).
2. Buzsáki, G. & Moser, E.I. Memory, navigation and theta rhythm in the hippocampal-entorhinal system. Nat. Neurosci. 16, 130–138 (2013).
3. van Strien, N.M., Cappaert, N.L.M. & Witter, M.P. The anatomy of memory: an interactive overview of the parahippocampal-hippocampal network. Nat. Rev. Neurosci. 10, 272–282 (2009).
4. Hafting, T., Fyhn, M., Molden, S., Moser, M.B. & Moser, E.I. Microstructure of a spatial map in the entorhinal cortex. Nature 436, 801–806 (2005).
5. Zhang, S.-J. et al. Optogenetic dissection of entorhinal-hippocampal functional connectivity. Science 340, 1232627 (2013).
6. Hargreaves, E.L., Rao, G., Lee, I. & Knierim, J.J. Major dissociation between medial and lateral entorhinal input to dorsal hippocampus. Science 308, 1792–1794 (2005).
7. Deshmukh, S.S. & Knierim, J.J. Representation of non-spatial and spatial information in the lateral entorhinal cortex. Front. Behav. Neurosci. 5, 69 (2011).
8. Tsao, A., Moser, M.-B. & Moser, E.I. Traces of experience in the lateral entorhinal cortex. Curr. Biol. 23, 399–405 (2013).
9. Young, B.J., Otto, T., Fox, G.D. & Eichenbaum, H. Memory representation within the parahippocampal region. J. Neurosci. 17, 5183–5195 (1997).

© 2
017
Nat
ure
Am
eric
a, In
c., p
art
of
Sp
rin
ger
Nat
ure
. All
rig
hts
res
erve
d.
advance online publication nature neurOSCIenCe
a r t I C l e S
10. Xu, W. & Wilson, D.A. Odor-evoked activity in the mouse lateral entorhinal cortex. Neuroscience 223, 12–20 (2012).
11. Igarashi, K.M., Lu, L., Colgin, L.L., Moser, M.B. & Moser, E.I. Coordination of entorhinal-hippocampal ensemble activity during associative learning. Nature 510, 143–147 (2014).
12. Chapuis, J. et al. Lateral entorhinal modulation of piriform cortical activity and fine odor discrimination. J. Neurosci. 33, 13449–13459 (2013).
13. Leitner, F.C. et al. Spatially segregated feedforward and feedback neurons support differential odor processing in the lateral entorhinal cortex. Nat. Neurosci. 19, 935–944 (2016).
14. Knierim, J.J., Neunuebel, J.P. & Deshmukh, S.S. Functional correlates of the lateral and medial entorhinal cortex: objects, path integration and local-global reference frames. Phil Trans R Soc B 369, 20130369 (2013).
15. Yassa, M.A. & Stark, C.E. Pattern separation in the hippocampus. Trends Neurosci. 34, 515–525 (2011).
16. Basu, J. & Siegelbaum, S.A. The corticohippocampal circuit, synaptic plasticity, and memory. Cold Spring Harb. Perspect. Biol. 7, a021733 (2015).
17. Brun, V.H. et al. Place cells and place recognition maintained by direct entorhinal-hippocampal circuitry. Science 296, 2243–2246 (2002).
18. Remondes, M. & Schuman, E.M. Role for a cortical input to hippocampal area CA1 in the consolidation of a long-term memory. Nature 431, 699–703 (2004).
19. MacDonald, C.J., Lepage, K.Q., Eden, U.T. & Eichenbaum, H. Hippocampal “time cells” bridge the gap in memory for discontiguous events. Neuron 71, 737–749 (2011).
20. Suh, J., Rivest, A.J., Nakashiba, T., Tominaga, T. & Tonegawa, S. Entorhinal cortex layer III input to the hippocampus is crucial for temporal association memory. Science 334, 1415–1420 (2011).
21. Klausberger, T. & Somogyi, P. Neuronal diversity and temporal dynamics: the unity of hippocampal circuit operations. Science 321, 53–57 (2008).
22. Baimbridge, K.G., Peet, M.J., McLennan, H. & Church, J. Bursting response to current-evoked depolarization in rat CA1 pyramidal neurons is correlated with lucifer yellow dye coupling but not with the presence of calbindin-D28k. Synapse 7, 269–277 (1991).
23. Dong, H.-W., Swanson, L.W., Chen, L., Fanselow, M.S. & Toga, A.W. Genomic-anatomic evidence for distinct functional domains in hippocampal field CA1. Proc. Natl. Acad. Sci. USA 106, 11794–11799 (2009).
24. Cembrowski, M.S. et al. Spatial gene-expression gradients underlie prominent heterogeneity of CA1 pyramidal neurons. Neuron 89, 351–368 (2016).
25. Bannister, N.J. & Larkman, A.U. Dendritic morphology of CA1 pyramidal neurones from the rat hippocampus: I. Branching patterns. J. Comp. Neurol. 360, 150–160 (1995).
26. Lee, S.-H. et al. Parvalbumin-positive basket cells differentiate among hippocampal pyramidal cells. Neuron 82, 1129–1144 (2014).
27. Kohara, K. et al. Cell type-specific genetic and optogenetic tools reveal hippocampal CA2 circuits. Nat. Neurosci. 17, 269–279 (2014).
28. Graves, A.R. et al. Hippocampal pyramidal neurons comprise two distinct cell types that are countermodulated by metabotropic receptors. Neuron 76, 776–789 (2012).
29. Mizuseki, K., Diba, K., Pastalkova, E. & Buzsáki, G. Hippocampal CA1 pyramidal cells form functionally distinct sublayers. Nat. Neurosci. 14, 1174–1181 (2011).
30. Valero, M. et al. Determinants of different deep and superficial CA1 pyramidal cell dynamics during sharp-wave ripples. Nat. Neurosci. 18, 1281–1290 (2015).
31. Danielson, N.B. et al. Sublayer-specific coding dynamics during spatial navigation and learning in hippocampal area CA1. Neuron 91, 652–665 (2016).
32. Petreanu, L., Mao, T., Sternson, S.M. & Svoboda, K. The subcellular organization of neocortical excitatory connections. Nature 457, 1142–1145 (2009).
33. Sugar, C.A. & James, G.M. Finding the number of clusters in a dataset: An information-theoretic approach. J. Am. Stat. Assoc. 98, 750–763 (2003).
34. Liu, Y. et al. Instrumentation of a compact random-access photostimulator based on acousto-optic deflectors. Rev. Sci. Instrum. 83, 025116 (2012).
35. Kitamura, T. et al. Island cells control temporal association memory. Science 343, 896–901 (2014).
36. Melzer, S. et al. Long-range-projecting GABAergic neurons modulate inhibition in hippocampus and entorhinal cortex. Science 335, 1506–1510 (2012).
37. Basu, J. et al. Gating of hippocampal activity, plasticity, and memory by entorhinal cortex long-range inhibition. Science 351, aaa5694 (2016).
38. Lo, L. & Anderson, D.J.A. A Cre-dependent, anterograde transsynaptic viral tracer for mapping output pathways of genetically marked neurons. Neuron 72, 938–950 (2011).
39. McGovern, A.E. et al. Anterograde neuronal circuit tracing using a genetically modified herpes simplex virus expressing EGFP. J. Neurosci. Methods 209, 158–167 (2012).
40. Liu, D. et al. Medial prefrontal activity during delay period contributes to learning of a working memory task. Science 346, 458–463 (2014).
41. Day, M., Langston, R. & Morris, R.G. Glutamate-receptor-mediated encoding and retrieval of paired-associate learning. Nature 424, 205–209 (2003).
42. Fortin, N.J., Wright, S.P. & Eichenbaum, H. Recollection-like memory retrieval in rats is dependent on the hippocampus. Nature 431, 188–191 (2004).
43. Eichenbaum, H., Kuperstein, M., Fagan, A. & Nagode, J. Cue-sampling and goal-approach correlates of hippocampal unit activity in rats performing an odor-discrimination task. J. Neurosci. 7, 716–732 (1987).
44. Huxter, J., Burgess, N. & O’Keefe, J. Independent rate and temporal coding in hippocampal pyramidal cells. Nature 425, 828–832 (2003).
45. Henriksen, E.J. et al. Spatial representation along the proximodistal axis of CA1. Neuron 68, 127–137 (2010).
46. Slomianka, L., Amrein, I., Knuesel, I., Sørensen, J.C. & Wolfer, D.P. Hippocampal pyramidal cells: the reemergence of cortical lamination. Brain Struct. Funct. 216, 301–317 (2011).
47. Sanders, H., Rennó-Costa, C., Idiart, M. & Lisman, J. Grid cells and place cells: an integrated view of their navigational and memory function. Trends Neurosci. 38, 763–775 (2015).
48. Eichenbaum, H., Fagan, A., Mathews, P. & Cohen, N.J. Hippocampal system dysfunction and odor discrimination learning in rats: impairment or facilitation depending on representational demands. Behav. Neurosci. 102, 331–339 (1988).
49. Zhang, F., Aravanis, A.M., Adamantidis, A., de Lecea, L. & Deisseroth, K. Circuit-breakers: optical technologies for probing neural signals and systems. Nat. Rev. Neurosci. 8, 577–581 (2007).
50. O’Reilly, R.C. & Rudy, J.W. Conjunctive representations in learning and memory: principles of cortical and hippocampal function. Psychol. Rev. 108, 311–345 (2001).

© 2
017
Nat
ure
Am
eric
a, In
c., p
art
of
Sp
rin
ger
Nat
ure
. All
rig
hts
res
erve
d.
nature neurOSCIenCedoi:10.1038/nn.4517
ONLINE METHODSAnimals. Wild type C57BL/6 (WT) mice and six different lines of transgenic mice were used in the present study and were obtained from Shanghai Laboratory Animal Center (SLAC, China) and Jackson Laboratory (USA), respectively. The Calb2-IRES-Cre (Jax No.010774) and Calb1-2A-dgCre (Jax. No. 023531) knock-in mice were crossed with the tdTomato reporter Ai951 (Jax No. 007905) to fluorescently label Calb+ neurons. Cre stabilization in the Calb1-2A-dgCre was inducted by intraperitoneal (i.p.) injection of trimethoprim52 (TMP; Sangon, China) with a 29-gauge needle (250 µg/g body weight, b.w.). A single injec-tion or 7 consecutive single injections per d were made. In Calb2-IRES-Cre::Ai9 mice, 83.7 ± 1.2% of tdTomato-labeled PCs in the CA1 SP layer and 99.7 ± 0.1% of tdTomato-labeled granule cells in the DG granule layer genetically expressed calbindin (Calb) along the anterior-to-posterior parts of dorsal hip-pocampus (Supplementary Fig. 8a,c,e,f). However, in the dorsal hippocampus less than 10% of GABA-staining inhibitory interneurons (INs) across all CA1 layers were colabeled (Supplementary Fig. 8g,h). A similar pattern of genetic labeling was also observed using a Cre-immunostaining assay in Calb2-IRES-Cre::Ai9 mice (Supplementary Fig. 8i,j). In contrast, in Calb1-2A-dgCre::Ai9 mice (after the 7-d TMP induction) only 11.1 ± 1.2% and 55.4 ± 4.4% of Calb-staining excitatory neurons were genetically labeled in the CA1 and DG areas, respectively (Supplementary Fig. 8b,d,e,f). These histological characterization results are largely consistent with that done by the Allen Brain Institute (http:// connectivity.brain-map.org/transgenic). Thus, the Calb2-IRES-Cre line displays better efficiency in genetic labeling and manipulating Calb+ PCs in the dCA1, and we therefore used this line rather than the Calb1-2A-dgCre line for this study.
Calb2-IRES-Cre mice also were crossed with Ai35 mice (Rosa-CAG-LSL-Arch-GFP-WPRE, Jax. No. 012735) to selectively express Arch (ref. 53) in Calb+ neurons. Sst-IRES-Cre (Jax. No. 013044) and Pavlb-Cre (Jax. No. 008069) knock-in mice were crossed with Ai9 mice to fluorescently label Sst+ and Pavlb+ INs, respectively (Fig. 4).
Only adult male mice were used in the behavioral test and optetrode recording experiments. Prior to behavioral training, mice were housed in stable condition, with food and water supplied ad libitum. Once training started, water was given only during and after the training. During the experiment, specific care was taken to keep the animals’ b.w. above 80% of normal level. All mice were reared on a 12/12-h light/dark cycle. WT and transgenic mice were randomly assigned for each experiment, except that only male mice were assigned for behavioral tests. Surgical and experimental procedures were approved by the Animal Care and Use Committee of Shanghai Institute for Biological Sciences, Chinese Academy of Sciences (CAS, Ref. No. NA-100418) and the State Key Laboratory of Cognitive Neuroscience & Learning at Beijing Normal University (Ref. No.: IACUC-BNU-NKLCNL-2013-10).
Virus construction and packaging. Viral vectors were obtained from the AddGene (USA). Viral titers were 2.5 × 10¹² particles/mL for AAV-hSynapsin-ChR2-mCherry, 2 × 10¹² particles/mL for AAV-CaMKIIα-eNpHR3.0-EYFP, 7 × 10¹² particles/mL for AAV-CaMKIIα-EYFP (control), provided by Obio Technology Co. Ltd. (China). The use of AAV virus were approved by the above two institutional committees.
The HSV-1-G3 virus was constructed from the H129 strain of herpes sim-plex virus type 1 by homologous recombination and applied as an anterograde trans-synaptic viral tracer (Fig. 3). HSV-1-G3 contains a GFP driven by an SV40 promoter within the BAC (bacterial artificial chromosome) sequence and an additional two CMV promoter-controlled GFP sets in the UL and US segments, respectively54,55. The recombinant virus was propagated in Vero 6 cells and har-vested when over 85% cells presented typical cytopathic effects (CPEs), then condensed by centrifugation56 (100,000g for 3 h, at 4 °C). Virus titer was adjusted to 1.5 × 10⁹ PFU (plaque forming unit)/mL before the injection. All HSV-1-G3 experiments were conducted in a biosafety Level 2 facility, and all protocols were approved by the Institutional Review Board of Wuhan Institute of Virology, CAS (Approval No.: WIVA10201502).
Stereotaxic injection of virus. WT or transgenic mice were injected with AAVs or HSVs to the LEC and MEC at postnatal days 14–16 (P14–P16, juvenile) or ~P60 (adult). The positions were (in mm): (i) −3.0 AP, 4.3 ML, 2.8 DV for the injection in juvenile LEC; (ii) −4.0 AP, 3.7 ML, 1.3 DV for the juvenile MEC;
(iii) −3.65 AP, 4.5 ML, 2.65 DV for the adult LEC (anterior LEC); (iv) −4.8 AP, 3.4 ML, 1.5 DV for the adult MEC; (v) −4.15 AP, 4.25 ML, 2.15 DV for the adult posterior LEC; and (vi) −4.8 AP, 3.4 ML, 1.2 and 2.0 DV for the adult dorsal and ventral MEC, respectively. A Pico-spritzer (Parker Instruments, USA) gener-ated air pulse puffs to a borosilicate glass micropipette filled with 1 µL AAV (tip size of 10 µm) at a delivery rate <0.1 µL/min during the injection. For the HSV delivery, 300 nL virus were injected using an electronic stereotaxic injector and microliter syringe (Stoelting, USA) coupled with a glass micropipette. At the end of the injection, the micropipette was held in place for 10 min before retraction. After recovery from anesthesia in a stable-temperature incubator, the mice were returned to their home cages. Due to its viral nature, HSV can cause severe dam-age or deterioration to a large area of the EC over 3 d after the injection in LEC or MEC (Supplementary Fig. 9). However, trans-synaptic transport of HSV to the dCA1 can only be observed at 5–5.5 d post-injection. We thus did not try to use HSV to map the topography of EC–dCA1 projections along the dorsoventral axis in this study.
Preparation of acute hippocampal slices. The mice at P50–P55 were anesthetized by i.p. injection of sodium pentobarbital (120 mg/kg of b.w.) and then perfused with ice-cold oxygenated sucrose-substituted aCSF (20 ml) consisting of (in mM) 125 sucrose, 1.25 NaH2PO4, 2 CaCl2, 3 KCl, 2 MgSO4, 26 NaHCO3, 11 dextrose, 1.3 sodium ascorbate and 0.6 sodium pyruvate (pH 7.30, 300 mOsm; Sigma). After decapitation, the animal’s brain was rapidly dissected and transferred to ice-cold oxygenated sucrose-substituted aCSF. Coronal brain slices 350-µm thick were prepared with a Vibratome 3000 (Vibratome, USA) in oxygenated sucrose-substituted aCSF at 0 °C. The slices were transferred into an incubation chamber with normal aCSF, composed of (in mM) 125 NaCl, 1.25 NaH2PO4, 2 CaCl2, 3 KCl, 2 MgSO4, 26 NaHCO3, 11 dextrose, 1.3 sodium ascorbate and 0.6 sodium pyruvate (pH 7.30, 300 mOsm, oxygenated at 95% O2/5% CO2; Sigma), for 30 min at 34 °C and then at room temperature (25 ± 2 °C) for > 30 min before use.
Slice electrophysiology and cRAcm. Whole-cell recordings from hippocam-pal neurons in the acute slices were done with an Axonpatch 700B amplifier (Molecular Devices, USA), using an upright microscope (FN1, Nikon, Japan) equipped with infrared differential interference contrast (DIC) optics. Recording micropipettes were made from borosilicate glass capillaries (B-120-69-15, Sutter Instruments, USA) with a Sutter P97 puller and filled with the internal solution contained (in mM) 133 potassium-gluconate, 9 KCl, 10 HEPES, 10 Na2HPO4, 4 Mg2ATP, 0.3 Na2GTP, 0.3 mM EGTA (pH 7.25–7.35 adjusted with KOH, 300 mOsm; (Sigma). Micropipette resistances were 4–6 MΩ. The recorded cells mainly resided in the intermedial dCA1 (Supplementary Fig. 3). Only cells with resting membrane potentials < −62 mV when broken-in were further examined. Stable whole-cell recordings were maintained for 20–40 min and those with series resistance exceeding 30 MΩ were discarded. Biocytin (0.2%, Sigma) was added to the internal solution for neuronal morphology reconstruction. After record-ing, the micropipette was gently retracted from the cell to achieve an outside-out patch for a better morphological reconstruction of biocytin-filled neurons. Only neurons whose complete arborizations of the apical dendrite were nearly recon-structed were further analyzed.
In experiments examining membrane properties and neuronal excitability (Supplementary Fig. 2 and Supplementary Table 3), intracellular injections of step currents (from −20 to 360 pA, with steps of 20 pA, 500-ms duration) were applied to evoke action potentials (APs). AP properties were measured from the very first AP. Currents (Ih) were measured as previous described57. Input–output slopes were calculated by the linear fit of firing rates versus current amplitudes. Spike accommodations were quantified by measuring the ratios of the first interspike interval (ISI) to the last ISI in the evoked spike trains. Regular or burst spiking hippocampal pyramidal cells (PCs) were characterized following a method previously described28. In the experiments shown in Supplementary Figure 12e–h, depolarizing current pulses (5-ms duration, 0.5 Hz) were injected intracellularly into recorded PCs to induce regular spiking activity under the cur-rent-clamp configuration, while spontaneous inhibitory postsynaptic currents (sIPSCs) were recorded when membrane potentials of PCs were clamped at 0 mV (the reserved potential of excitatory glutamatergic postsynaptic currents) under the voltage-clamp mode. The interevent intervals and amplitudes of individual sIPSCs were measured with a MiniAnalysis 6.03 (SynaptoSoft Inc., NJ, USA), and the mean values of frequency and amplitude were calculated for individual PCs.
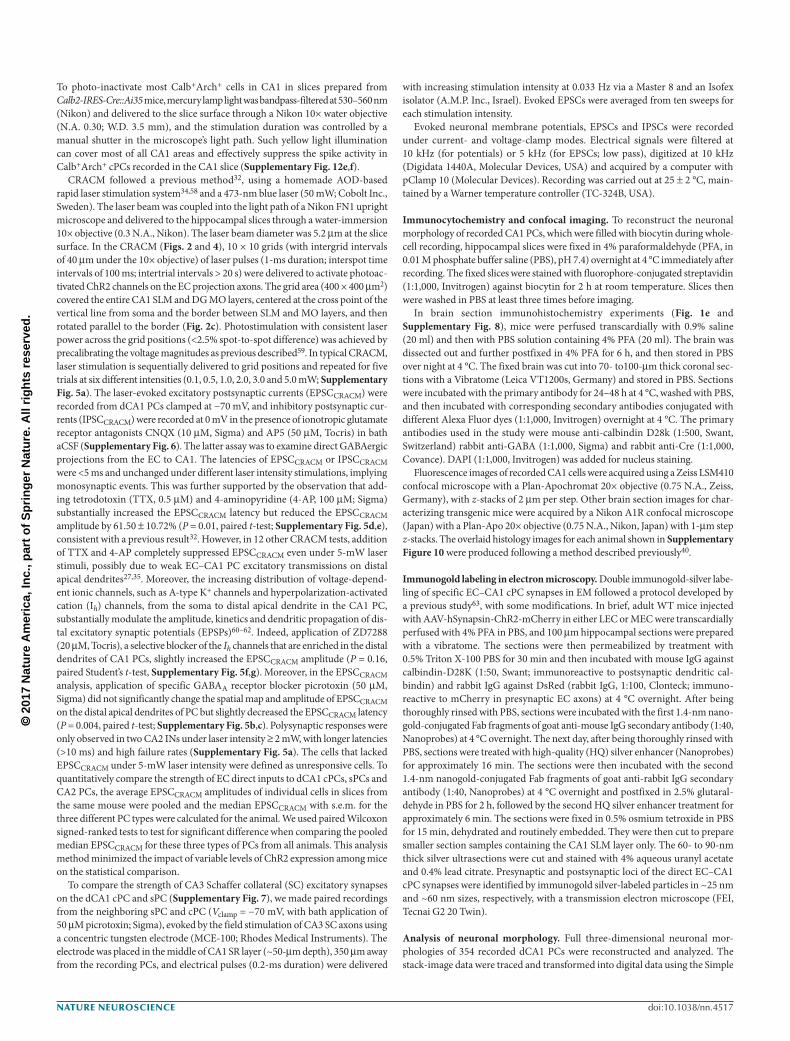
© 2
017
Nat
ure
Am
eric
a, In
c., p
art
of
Sp
rin
ger
Nat
ure
. All
rig
hts
res
erve
d.
nature neurOSCIenCe doi:10.1038/nn.4517
To photo-inactivate most Calb+Arch+ cells in CA1 in slices prepared from Calb2-IRES-Cre::Ai35 mice, mercury lamp light was bandpass-filtered at 530–560 nm (Nikon) and delivered to the slice surface through a Nikon 10× water objective (N.A. 0.30; W.D. 3.5 mm), and the stimulation duration was controlled by a manual shutter in the microscope’s light path. Such yellow light illumination can cover most of all CA1 areas and effectively suppress the spike activity in Calb+Arch+ cPCs recorded in the CA1 slice (Supplementary Fig. 12e,f).
CRACM followed a previous method32, using a homemade AOD-based rapid laser stimulation system34,58 and a 473-nm blue laser (50 mW; Cobolt Inc., Sweden). The laser beam was coupled into the light path of a Nikon FN1 upright microscope and delivered to the hippocampal slices through a water-immersion 10× objective (0.3 N.A., Nikon). The laser beam diameter was 5.2 µm at the slice surface. In the CRACM (Figs. 2 and 4), 10 × 10 grids (with intergrid intervals of 40 µm under the 10× objective) of laser pulses (1-ms duration; interspot time intervals of 100 ms; intertrial intervals > 20 s) were delivered to activate photoac-tivated ChR2 channels on the EC projection axons. The grid area (400 × 400 µm2) covered the entire CA1 SLM and DG MO layers, centered at the cross point of the vertical line from soma and the border between SLM and MO layers, and then rotated parallel to the border (Fig. 2c). Photostimulation with consistent laser power across the grid positions (<2.5% spot-to-spot difference) was achieved by precalibrating the voltage magnitudes as previous described59. In typical CRACM, laser stimulation is sequentially delivered to grid positions and repeated for five trials at six different intensities (0.1, 0.5, 1.0, 2.0, 3.0 and 5.0 mW; Supplementary Fig. 5a). The laser-evoked excitatory postsynaptic currents (EPSCCRACM) were recorded from dCA1 PCs clamped at −70 mV, and inhibitory postsynaptic cur-rents (IPSCCRACM) were recorded at 0 mV in the presence of ionotropic glutamate receptor antagonists CNQX (10 µM, Sigma) and AP5 (50 µM, Tocris) in bath aCSF (Supplementary Fig. 6). The latter assay was to examine direct GABAergic projections from the EC to CA1. The latencies of EPSCCRACM or IPSCCRACM were <5 ms and unchanged under different laser intensity stimulations, implying monosynaptic events. This was further supported by the observation that add-ing tetrodotoxin (TTX, 0.5 µM) and 4-aminopyridine (4-AP, 100 µM; Sigma) substantially increased the EPSCCRACM latency but reduced the EPSCCRACM amplitude by 61.50 ± 10.72% (P = 0.01, paired t-test; Supplementary Fig. 5d,e), consistent with a previous result32. However, in 12 other CRACM tests, addition of TTX and 4-AP completely suppressed EPSCCRACM even under 5-mW laser stimuli, possibly due to weak EC–CA1 PC excitatory transmissions on distal apical dendrites27,35. Moreover, the increasing distribution of voltage-depend-ent ionic channels, such as A-type K+ channels and hyperpolarization-activated cation (Ih) channels, from the soma to distal apical dendrite in the CA1 PC, substantially modulate the amplitude, kinetics and dendritic propagation of dis-tal excitatory synaptic potentials (EPSPs)60–62. Indeed, application of ZD7288 (20 µM, Tocris), a selective blocker of the Ih channels that are enriched in the distal dendrites of CA1 PCs, slightly increased the EPSCCRACM amplitude (P = 0.16, paired Student’s t-test, Supplementary Fig. 5f,g). Moreover, in the EPSCCRACM analysis, application of specific GABAA receptor blocker picrotoxin (50 µM, Sigma) did not significantly change the spatial map and amplitude of EPSCCRACM on the distal apical dendrites of PC but slightly decreased the EPSCCRACM latency (P = 0.004, paired t-test; Supplementary Fig. 5b,c). Polysynaptic responses were only observed in two CA2 INs under laser intensity ≥ 2 mW, with longer latencies (>10 ms) and high failure rates (Supplementary Fig. 5a). The cells that lacked EPSCCRACM under 5-mW laser intensity were defined as unresponsive cells. To quantitatively compare the strength of EC direct inputs to dCA1 cPCs, sPCs and CA2 PCs, the average EPSCCRACM amplitudes of individual cells in slices from the same mouse were pooled and the median EPSCCRACM with s.e.m. for the three different PC types were calculated for the animal. We used paired Wilcoxon signed-ranked tests to test for significant difference when comparing the pooled median EPSCCRACM for these three types of PCs from all animals. This analysis method minimized the impact of variable levels of ChR2 expression among mice on the statistical comparison.
To compare the strength of CA3 Schaffer collateral (SC) excitatory synapses on the dCA1 cPC and sPC (Supplementary Fig. 7), we made paired recordings from the neighboring sPC and cPC (Vclamp = −70 mV, with bath application of 50 µM picrotoxin; Sigma), evoked by the field stimulation of CA3 SC axons using a concentric tungsten electrode (MCE-100; Rhodes Medical Instruments). The electrode was placed in the middle of CA1 SR layer (~50-µm depth), 350 µm away from the recording PCs, and electrical pulses (0.2-ms duration) were delivered
with increasing stimulation intensity at 0.033 Hz via a Master 8 and an Isofex isolator (A.M.P. Inc., Israel). Evoked EPSCs were averaged from ten sweeps for each stimulation intensity.
Evoked neuronal membrane potentials, EPSCs and IPSCs were recorded under current- and voltage-clamp modes. Electrical signals were filtered at 10 kHz (for potentials) or 5 kHz (for EPSCs; low pass), digitized at 10 kHz (Digidata 1440A, Molecular Devices, USA) and acquired by a computer with pClamp 10 (Molecular Devices). Recording was carried out at 25 ± 2 °C, main-tained by a Warner temperature controller (TC-324B, USA).
Immunocytochemistry and confocal imaging. To reconstruct the neuronal morphology of recorded CA1 PCs, which were filled with biocytin during whole-cell recording, hippocampal slices were fixed in 4% paraformaldehyde (PFA, in 0.01 M phosphate buffer saline (PBS), pH 7.4) overnight at 4 °C immediately after recording. The fixed slices were stained with fluorophore-conjugated streptavidin (1:1,000, Invitrogen) against biocytin for 2 h at room temperature. Slices then were washed in PBS at least three times before imaging.
In brain section immunohistochemistry experiments (Fig. 1e and Supplementary Fig. 8), mice were perfused transcardially with 0.9% saline (20 ml) and then with PBS solution containing 4% PFA (20 ml). The brain was dissected out and further postfixed in 4% PFA for 6 h, and then stored in PBS over night at 4 °C. The fixed brain was cut into 70- to100-µm thick coronal sec-tions with a Vibratome (Leica VT1200s, Germany) and stored in PBS. Sections were incubated with the primary antibody for 24–48 h at 4 °C, washed with PBS, and then incubated with corresponding secondary antibodies conjugated with different Alexa Fluor dyes (1:1,000, Invitrogen) overnight at 4 °C. The primary antibodies used in the study were mouse anti-calbindin D28k (1:500, Swant, Switzerland) rabbit anti-GABA (1:1,000, Sigma) and rabbit anti-Cre (1:1,000, Covance). DAPI (1:1,000, Invitrogen) was added for nucleus staining.
Fluorescence images of recorded CA1 cells were acquired using a Zeiss LSM410 confocal microscope with a Plan-Apochromat 20× objective (0.75 N.A., Zeiss, Germany), with z-stacks of 2 µm per step. Other brain section images for char-acterizing transgenic mice were acquired by a Nikon A1R confocal microscope (Japan) with a Plan-Apo 20× objective (0.75 N.A., Nikon, Japan) with 1-µm step z-stacks. The overlaid histology images for each animal shown in Supplementary Figure 10 were produced following a method described previously40.
Immunogold labeling in electron microscopy. Double immunogold-silver labe-ling of specific EC–CA1 cPC synapses in EM followed a protocol developed by a previous study63, with some modifications. In brief, adult WT mice injected with AAV-hSynapsin-ChR2-mCherry in either LEC or MEC were transcardially perfused with 4% PFA in PBS, and 100 µm hippocampal sections were prepared with a vibratome. The sections were then permeabilized by treatment with 0.5% Triton X-100 PBS for 30 min and then incubated with mouse IgG against calbindin-D28K (1:50, Swant; immunoreactive to postsynaptic dendritic cal-bindin) and rabbit IgG against DsRed (rabbit IgG, 1:100, Clonteck; immuno-reactive to mCherry in presynaptic EC axons) at 4 °C overnight. After being thoroughly rinsed with PBS, sections were incubated with the first 1.4-nm nano-gold-conjugated Fab fragments of goat anti-mouse IgG secondary antibody (1:40, Nanoprobes) at 4 °C overnight. The next day, after being thoroughly rinsed with PBS, sections were treated with high-quality (HQ) silver enhancer (Nanoprobes) for approximately 16 min. The sections were then incubated with the second 1.4-nm nanogold-conjugated Fab fragments of goat anti-rabbit IgG secondary antibody (1:40, Nanoprobes) at 4 °C overnight and postfixed in 2.5% glutaral-dehyde in PBS for 2 h, followed by the second HQ silver enhancer treatment for approximately 6 min. The sections were fixed in 0.5% osmium tetroxide in PBS for 15 min, dehydrated and routinely embedded. They were then cut to prepare smaller section samples containing the CA1 SLM layer only. The 60- to 90-nm thick silver ultrasections were cut and stained with 4% aqueous uranyl acetate and 0.4% lead citrate. Presynaptic and postsynaptic loci of the direct EC–CA1 cPC synapses were identified by immunogold silver-labeled particles in ~25 nm and ~60 nm sizes, respectively, with a transmission electron microscope (FEI, Tecnai G2 20 Twin).
Analysis of neuronal morphology. Full three-dimensional neuronal mor-phologies of 354 recorded dCA1 PCs were reconstructed and analyzed. The stack-image data were traced and transformed into digital data using the Simple

© 2
017
Nat
ure
Am
eric
a, In
c., p
art
of
Sp
rin
ger
Nat
ure
. All
rig
hts
res
erve
d.
nature neurOSCIenCedoi:10.1038/nn.4517
Neurite Tracer plug-in in Fiji (https://imagej.net/Simple_Neurite_Tracer) and Neurolucida (MicroBrightField, VT, USA), respectively. The morphological parameters and Sholl analysis were measured using the TREES Toolbox64 in Matlab (MathWorks).
To quantitatively classify these morphologically distinct PCs, we developed two indices, Length Ratio Index (LRI) and Order Ratio Index (ORI) to measure the proportional difference of any two bifurcated subtrees from a branching point in the apical dendrite of a given PC. The two measures compare the two bifurcated subtrees at any branch point in the apical dendrite and compute a weight value for each branch-point:
LRI = + ×log[( ) ( / )]L L L L1 2 1 2
where L1 and L2 are the total lengths of the two bifurcated subtrees and L1 < L2;
ORI = × + ×log[ ( ) ( / )]c O O O O1 2 1 2
where O1 and O2 are the branching orders of the two bifurcated subtrees and O1 < O2, and c is a scaling constant (set to 0.1).
Specifically, for LRI, both total length (L1 + L2) and the length ratio (L1/L2) affect the final score; the longer and more equal these two subtrees are, the larger the final LRI score would be. The same is true for ORI. As a result, the branch point showing the maximum values of LRI (LRImax) and ORI (ORImax) along the apical dendrite represented the principal branching point and its two subtrees possessed the maximal extent of morphology similarity. With the LRImax and ORImax of each PC, the 354 total reconstructed dCA1 PCs constituted a two-dimensional matrix for the cluster analysis. The k-means cluster algorithm (in Matlab) randomly selected k points (ranging from 2 to 10) as the initial cluster centers of the k clusters. The Euclidian distances from all the remaining points to these k centers were calculated, and each point was coupled with its closest center, which resulted in k initial groups. The cluster centers were then recalculated based on these prior k groups and each point was recoupled to these new centers. The same process was iteratively looped until the cluster centers remain unchanged (Fig. 1a,b). To determine a reasonable number of clusters within the data matrix, we adopted the Jump method33 to evaluate the quality of clustering process under each k and showed that k = 2, under which the value of Jump peaked, was the optimal number of clusters (Supplementary Fig. 1a–c).
We also performed an additional clustering method using principal com-ponent analysis (PCA) with the measured dendritic morphology parameters (including LRImax and ORImax). The first two principal components from three different combinations of these parameters were chosen for the following k-means cluster analysis to evaluate the clustering quality and determine the better data source to make the morphological classification (Supplementary Fig. 1f–h and Supplementary Table 2).
To quantify arborizations of both apical and basal dendrites, the total den-dritic length, branch order and total branch points of both apical and basal dendrites were measured for the cPC and sPC groups, respectively. Sholl analysis, with 60-µm step-diameter concentric rings, was used to quantify the complexity of dendrites.
computational simulation. The full morphology of 354 experimentally recon-structed dCA1 PCs was used in the computational simulation of the passive propagation of distal dendritic excitation to the soma with the TREES Toolbox64 in Matlab (MathWorks). Compartmentalized neuronal models were built with passive biophysical properties only and the membrane parameters were set as Cm = 1 µF cm−2, Rm = 30 kΩ cm2, Ri = 150 Ω cm and Vrest = −70 mV. For each neuronal model, a depolarizing step current (30 pA) was delivered to each distal apical dendritic compartment to evaluate its electronic propagation property. The mean amplitudes of equilibrium somatic voltage change were calculated for all distal dendritic current injection (into all compartments with a path length to the soma in the range of 300–600 µm) for each neuron model. Cumulative distributions of somatic depolarization amplitudes from 354 neuron models were used to statistically compare the difference of dendritic propagation between the cPC and sPC groups.
In addition, morphologically realistic CA1 sPC and cPC NEURON models, adopted from two previous published works65,66, were used to further simulate the distal synaptic inputs and their dendritic propagation67. All active conduct-ances were removed and only passive properties were kept. Basic membrane
parameters for both neurons were set as Cm = 1 µF cm−2, Rm = 30 kΩ cm2, Ri = 150 Ω cm and Vrest = −70 mV. Dendritic lengths and diameters for the CA1 cPC and sPC NEURON model were modestly adjusted on the basis of morphological and electrophysiological data obtained in the experiments. Excitatory synaptic AMPA conductance (gmax = 1 nS, EAMPA = 0 mV, τr = 0.1 ms, τd = 3.6 ms) was delivered to each section of the distal apical dendrites (300 to 600 µm) to mimic synaptic excitation. Member depolarization ampli-tudes at the local dendrite and at the soma were measured and then compared between the sPC and cPC groups. All simulations were run with 0.1-ms time-steps and the nominal temperature was 37 °C.
Single-cell RT-PcR. Single-cell RT-PCR was performed as previously described68, with some modifications. Cytoplasm from individual PCs was obtained from 10-min whole-cell recording, plus 1-min negative pressure applied by mouth. Harvested mRNA was first reverse-transcribed to cDNA using a Super Script III kit (Invitrogen), incubated at 50 °C for 50 min and then terminated at 65 °C for 20 min. The entire cDNA was then amplified by multi-plex PCR for 25 cycles (94 °C for 40 s, 57 °C for 90 s, 72 °C for 60 s and a final extension at 72 °C for 10 min), using QIAGEN Multiplex PCR Master Mix kit (Qiagen, Germany) in a volume of 100 µL. The transcripts of each tested gene were detected by a second round of PCR using an individual primer set: 1 µL of the multiplex PCR mixture was applied as a template in a 10-µL reaction with HotStarTaq polymerase (TianGen, China) and cycled again (35 cycles of 94 °C for 40 s, 57 °C for 40 s, 72 °C for 60 s and a final extension at 72 °C for 10 min). PCR products were run on a 2% agarose gel stained with GelRed (Invitrogen) and visualized with ultraviolet light. The identities of the amplicons were con-firmed by DNA sequencing (Sangon Biotech, China). Primers were designed to span at least one exon–intron boundary with an amplification product length within 350 bp. Primers for Calb were designed according to NCBI published sequence 12307: forward 5′-TTCATTTCGACGCTGACGGA-3′ and reverse 3′-GCCGCTGTGGTCAGTATCAT-5′. Primers for Vglut1, Gad1, Gad2 and Gapdh were used as in a previous work69. To avoid false negatives, only cells showing PCR detection of both Vglut1 and Gapdh were counted; and to avoid false posi-tives, cells with both Vglut1 and Gad1/2 were discarded (Fig. 1g).
optical fiber implantation and optogenetic inactivation in vivo. Optical fibers (200 µm in diameter, 0.37 N.A., Thorlabs) were implanted in the targeted regions of the bilateral dorsal hippocampus at 10° angles (to leave space for connecting cables). The positions were (in mm): −2.1 AP, 2.0 ML and 1.2 or 0.8 DV for EC–CA1 axon or CA1 PC silencing, respectively (Fig. 5c,e,f and Supplementary Fig. 10a,c,d), and −2.1 AP, 1.6 ML and 1.75 or 1.5 DV for LEC–DG axon or DG granule cell silencing, respectively (Fig. 5d,h and Supplementary Fig. 10b,d). In behavioral experiments, fibers were coupled to an external fiber using standard FC connectors via the ceramic sleeve and then connected to a 589-nm laser (50 mW; Dreamlaser Tech. Co., China).
olfactory cue-based associative go–no-go task. The olfaction-based Go–No-go task (GNG) was modified for headfixed mice. A pair of odorants was used: ethyl acetate (odor A; boiling point 77.1 °C) and methyl butyrate (odor B; boiling point 102.8 °C; both from Sigma). Odors A and B were diluted in mineral oil (Sigma) at 1:500 and 1:1,000 (v/v), respectively. Three-way solenoid valves were used to control the odorized air flow (1.5 L/min), while two-way solenoid valves were used to control the water flow (1 mL/min) at millisecond resolution. The length of odor delivery Teflon tubes (2.5 mm i.d.) was minimized to decrease the odor turnover. An exhaust tube, connected to a vacuum pump, was used to deplete the residual odor and water. An infrared light beam was set beside the water port to detect animals’ licking behaviors, and a blue LED above the odor delivery port provided the response cue. The setup was controlled by a custom-designed microprocessor-based digital input–output interface40. The behavioral training and tests were conducted on the same setup in a dark environment (Fig. 5a).
In the GNG task, odors A and B were set to associate with the water reward and lack of reward, respectively. In each trial, an odorant was delivered for 1 s, followed by a 2-s delay and subsequently a 0.5-s LED response cue (Fig. 5b). In the Go trial, the water valve switched on for 0.5 s immediately after the detection of animal’s licking behaviors within the 0.5-s response window, which we defined as a hit (H), and the mouse was rewarded with 8–10 µL water. If the mouse failed to lick within the response window (either licking before or after the response

© 2
017
Nat
ure
Am
eric
a, In
c., p
art
of
Sp
rin
ger
Nat
ure
. All
rig
hts
res
erve
d.
nature neurOSCIenCe doi:10.1038/nn.4517
window or not licking at all), the response was defined as miss (M) and the valve did not switch on. In the No-go trial, the animal’s licking was defined as a false alarm (FA), while no licking was defined as a correct rejection (CR; Fig. 5b). Mice were not given rewards or disincentives in No-go trials. The intertrial intervals were 6 s, and the total length of a trial was 10 s.
Prior to the training, mice were restricted from drinking water and habitu-ated to the holding tube in their home-cage for 1–2 d. The training included three phases: a habituation phase (3 d, 10 min/round, 2 rounds per d with a 10-h interval), a cue-conditioning phase (1–2 d, 100 trials/round, 2 rounds per d with a 10-h interval) and the GNG task (6–12 d, 200 trials per d). In the habituation phase, mice were head-fixed in the behavioral setup and trained to lick water from a polished 27G syringe positioned in front of its mouth, and the water valve opened for 0.5 s immediately after detecting the mouse licking. Typically after 3 d of habituation, mice learned to lick up to 2,000 times within 10 min. In the subsequent cue-conditioning phase, at the initial training, water was delivered manually through the syringe to encourage mice to lick within the response window after the response cue. Every 10 trials, manual water delivery was temporally withheld to check whether mice would lick for water spontaneously. Typically mice developed spontaneous licking behavior in the second round, and cue-conditioning training ended when mice succeeded in consecutive 50 trials. Finally, the olfactory GNG task started the very next day, referred to as Day 1 and consisting of 100 Go and 100 No-go trials. The 200 trials were arbitrarily divided into 10 blocks (20 trials per block), and in each block 10 Go and 10 No-go trials were introduced pseudorandomly. After the GNG task, mice were supplied with free water until satiety. No human was present or intervened during the tasks.
Behavioral performance was quantified by an index (‘performance’ in the Figures) in each block as follows:
Performance = (H + CR) / Total trialsThe rates of H and CR were calculated as:RateH = H/(H + M)RateCR = CR/(CR + FA)Photoillumination was delivered for 3 s, which included the 1-s odor-deliv-
ery and 2-s delay periods (Fig. 5b). Notably, we observed that on Days 4 and 5, optogenetic inactivation of Calb+ cPCs in dCA1 did not affect the performance in Calb2-IRES-Cre::Ai35 mice (Fig. 5g). This result implied that the expression or retrieval of a learned association may not require dCA1 cPCs and suggested that optogenetic interference did not affect the behavioral output. Thus, starting from Day 4 we set a reversed-learning task, in which the initial odor of Go or No-go contingencies were reversed to further test the role of EC–CA1 circuitry. One extra nonreversed block was presented before the odor-association reverse trials, without the laser (Day 4). To minimize variation in the odor-reverse period (Day 4), when mice stopped licking for 20 trials in the last given block, water was automatically delivered in the next 10 trials (5 Go and 5 No-go trials) to encour-age them to lick. Note that on the training Days 3 and 6, laser illumination was delivered in interleaved blocks (Fig. 5c–h and Supplementary Fig. 11). We also tested another pair of odorants, 1-butanol (Odor C; boiling point 117.7 °C) and ethyl propionate (Odor D; boiling point 99.1 °C; both from Sigma), in the olfac-tory association learning on Days 7–9 in the same set of Calb2-IRES-Cre::Ai35 and Ai35 mice; odor C was used as the Go cue and D as the No-go cue. The mice were able to acquire the associations with new odors similarly to their acquisition of the odors A and B associations (data not shown), demonstrating that the mice had no preference for different odor pairs.
Blinding was applied for all behavioral tests. Labels of different virus and mouse genotypes prior to experiments were handled by lab members who were blind to experimental designs and goals. The experimenters were blind to the above identity information before and during the behavioral experiments, as well as during data analysis.
optetrode recording in vivo. The optetrode assembly was described previously70. Each tetrode was constructed by twisting a folded piece of four nickel-cadmium wires (13 µm, California Fine Wire). The tetrode wire tips were plated with gold (Cyanida Gold solution, SIFCO Selective Plating) to adjust the impedance to 500–800 kΩ. An optical fiber (200 µm in diameter, 0.37 N.A., Thorlabs) was surrounded by eight tetrodes to make a 32-channel optetrode. Note that wire tips were 0.5 mm longer than the optical fiber end to achieve efficient photostimula-tion of recorded neurons in vivo.
All data shown in Figure 6 were collected from n = 10 Calb2-IRES-Cre::Ai35 transgenic mice in dCA1 during 3 d of learning (Supplementary Fig. 10e), with a 96-channel multielectrode recording system (Plexon Inc., USA). After optetrode implantation, mice were allowed to recover for at least 1 week. The optetrode position in CA1 sublayers was estimated on the basis of local field potential oscil-lation profiles71. We advanced the optetrode by approximately 35 µm every other day until the electrode reached the SP layer. A helium-filled Mylar balloon was attached to relieve mice of the weight of the implanted optetrode and cables. After the optetrode reached the SP layer, we started to record spikes and local field potentials when signals were stable for at least 2 d. Neuronal signals were referenced to two connected skull screws (above prefrontal cortex and cerebel-lum respectively) and filtered at 0.4–7 kHz. The spike activity was digitized at 40 kHz and isolated using the time-amplitude window discrimination and template matching methods provided in the Plexon Multichannel Acquisition Processor (MAP) system.
Spike sorting was carried out using the built-in principal component analysis in Offline Sorter software (Plexon, USA) as described previously70. The optetrodes were not moved during recording, suggesting the recordings were very likely from the same cell population. However, occasionally some units disappeared or new units appeared during the recording. A rough separation of units from PCs and interneurons in dCA1 was done mainly based on their differences in spike width and mean baseline firing rates (FR)72–76. Putative CA1 PCs with a mean FR > 0.75 Hz during the task were included in the data presented. In our recording from 10 mice over consecutive 5 d (3 d for initial learning + 2 d for reversal learning), we recorded 576 single units in the dCA1. Of 91 Calb+ cell, 98% were excitatory complex spike cells (excitatory PCs) and 2% were inhibitory theta cells, while in 485 units of Calb− cells, 88% were excitatory and 12% were inhibitory. Thus, a majority of recorded cells were excitatory complex spike cells.
Previous studies have successfully optogenetically tagged dopaminergic neu-rons or different subtypes of GABAergic interneuron with laser pulse-induced ChR2 excitation in the ventral tegmental area (VTA) and medial prefrontal cortex (mPFC)77–79. However, in Calb2-IRES-Cre::Ai27 mice, we found that the ChR2 excitation method had a strong tendency to profoundly alter spike waveforms, which hampered reliable spike sorting (Supplementary Fig. 12a,b) when 5-ms blue-laser pulse stimulation was used (0.5 mW). The value of cross-correlation (CC) between waveforms of the averaged spontaneous spikes and ChR2 excita-tion-induced spikes was usually <0.9 (Supplementary Fig. 12a,b). Unexpectedly, in Pavlb-Cre::Ai27 mice, this ChR2 excitation method was efficiently useful to tag inhibitory PV+ cells in the CA1, showing induced spikes precisely time-locked to laser pulse stimulation and with high CC values in waveforms (>0.9; Supplementary Fig. 12a,c). The exact reason why tagging Calb+ cells with ChR2 did not work well in the dCA1 of Calb2-IRES-Cre::Ai27 mice is not known. We suspect that it might be due to the fact that Calb+ PCs are so dense in the thin CA1 SP layer that laser stimulation using our implanted optical fiber (200 µm) caused highly synchronized spiking among them, which, in turn, interrupted the spike waveforms of recorded units in optetrode recording in vivo. It is possible that optical stimulation with lower power and smaller area may avoid this prob-lem. Indeed, we note that a recent study from the Buzsáki lab reports successful optogenetic tagging of CA1 PCs with ChR2 using specialized µLEDs on silicon probes with very low light intensity80. Optogenetic tagging with inhibitory Arch was also used successfully in two recent optetrode recording studies81,82. We therefore tested repeated 2-min yellow-laser illumination to identify spike units record from the dCA1 Calb+Arch+ and Calb− cells, respectively, in Calb2-IRES-Cre::Ai35 mice. Single units showing laser-induced suppression of their baseline firing rate (FRbaseline) and CC > 0.9 in the waveform comparison were regarded as Calb+Arch+ cPCs, and others were Calb− sPCs (Fig. 6b and Supplementary Fig. 12d). Furthermore in slice recording we found that optogenetic silencing of Calb+Arch+ cells with 2 min of yellow laser illumination in the CA1 did not cause elevated inhibition of Calb− sPC (Supplementary Fig. 12e–g), although there are Calb+ INs and their disinhibitory circuit exists in the local CA1 circuit3,83,84. Thus, the above comparison clearly suggests that optogenetic tagging with Arch was more suitable and valid for in vivo separation of Calb+ and Calb− dCA1 cells in this study. However, this simple classification method has a pitfall in that some of those units that were not suppressed by light could still be Calb+ cPCs, due to false-negative responses caused by potential illumination issues or weak Arch expression. Nevertheless, we noted significant differences in spontaneous FR between the optogenetically identified cPC and sPC groups at different brain

© 2
017
Nat
ure
Am
eric
a, In
c., p
art
of
Sp
rin
ger
Nat
ure
. All
rig
hts
res
erve
d.
nature neurOSCIenCedoi:10.1038/nn.4517
states (Supplementary Fig. 15), consistent with the reported results for superfi-cial and deep PCs in CA1 SP layer29.
characterization of place cells. All place cell data were recorded from n =5 Calb2-IRES-Cre::Ai35 mice (Fig. 7). We used a U-shaped maze, 5 cm wide with a 112-cm long track. There were different visual cues along the track and a water port at either end of the track. An overhead camera (CinePlex System, Plexon) was used to record animals’ running trajectories. Mice were trained to shuttle between the two ends for a water reward. Maze training and recording were car-ried out in a dim environment surrounded by black curtains.
To characterize place fields of recorded CA1 PCs, the animal’s position data were sorted into 50 × 50 pixel bins. For a given PC, its firing rates in each bin were calculated by dividing the total spike number by the occupancy time in the bin and then convolved with a Gaussian function. The place field of a cell was the bin(s) where the cell displayed the highest FR and all contiguous bins exceeded 10% of this peak FR. Cells showing a peak FR > 1.5 Hz and with a clear place field preference were defined as place cells, while those with no specific place fields were defined as nonspatial cells (Fig. 7)44,85.
The spatial-information content of recorded place cells in the dCA1 was cal-culated using Skaggs’ formula86,87. This index in the unit of bits per spike cal-culates the amount of information carried by a single spike about the location of the animal:
Spatial information content =
∑p
RR
RRi
i ilog2
where i is the bin number, Pi is the probability for occupancy of bin i, Riis the mean firing rate for bin i and R is the mean firing rate.
data analysis. Odor responses and selectivity. Spike responses to odors were meas-ured by comparing the mean FR within a 1.5-s time window after the odor onset with the baseline FR for the 2 s before the odor onset (one-way ANOVA). Values of P < 0.01 were taken to indicate significant increases or decreases in the FR evoked by odors (Supplementary Fig. 13). The odor response selectivity index (OSI) was calculated using the d′ method (based on signal detection theory) on successive 100-ms bins (Fig. 6b,c):
OSI A B
A B
=−
+
FR FR12
2 2( )s s
where FRA and FRB are the mean FR across 100 trials, while σA and σB are the s.d. The 1.5-s OSI was calculated using the FR of a 1.5-s time window during odor sampling (1.5 s after odor delivery). Positive values of OSI denote a neuronal FR bias to odor A, while negative values indicate a neuronal FR bias to odor B.
Population vector analysis was used to estimate the development of odor repre-sentations (Fig. 6d). Mean FR were pooled for the cPC and sPC groups separately to construct vectors for Go- and No-go-associated odors. A correlation coefficient (CC) for the two vectors was calculated and then rescaled as a PV differential index (PDI)11, PDI = 1 − CC.
PDI = 0 indicates that the population vectors were identical, whereas PDI = 1 denotes activity uncorrelated and different between Go- and No-go-associated trials.
The chance level of PDI was calculated as in a previous study11. Briefly, the chance level was determined by random permutation procedure using all 278 PCs. We performed 100 permutations for each cell in the sample. For each per-mutation trial, individual odor-sampling trials were randomly reassigned to odors A/Go or B/No-go trials but maintained the original numbers. Population vectors were then computed from the same ensemble as the original data for each of the 100 permutations, resulting in 100 sets of PDI. The PDI distribution across all 100 permutations in the sample was calculated and the 95th percentile was determined as the significance level.
Statistical differences in PDI between cPCs and sPCs was measured using bootstrap resampling88. Bootstrapped PDIs for cPCs and sPCs were computed by first resampling 100 repetitions with replacement from the original 200 tri-als (100 A/Go and 100 B/No-go trials) for a given PC, and then this resampling method was applied to all sPCs and cPCs recorded in each training day to gener-ate a bootstrapped ensemble for a given day. Finally the population vector was computed from the ensemble. This bootstrap procedure was repeated 100 times,
resulting in 100 sets of PDI. The 95% confidence interval (P < 0.05) was calculated and is shown in Figure 6d from the distribution of the bootstrapped PDIs for each day. The correlation between performance and dCA1 PC odor selectivity was also estimated by plotting the performance of a mouse for each day against the mean OSI of all cPCs or sPCs, respectively, in the same mouse, with linear regression (Fig. 6f).
Statistical analysis. Data are presented as mean ± s.e.m. unless stated otherwise. The normal distribution of data was tested, and for normally distributed data, statistical significance was tested by unpaired t-tests; otherwise, data was tested by nonparametric tests. Details of the statistical tests and the resultant P-values for behavioral performance results are listed in the main text, figure legends and Supplementary Tables 4–15, and others are presented in the text, figures or figure legends. No statistical methods were used to predetermine sample sizes, but our sample sizes are similar to those reported in previous publica-tions5,6,11,13,20,27,36,37.
data availability. The data that support the findings of this study are available from the corresponding author upon reasonable request.
51. Madisen, L. et al. A robust and high-throughput Cre reporting and characterization system for the whole mouse brain. Nat. Neurosci. 13, 133–140 (2010).
52. Sando, R. III et al. Inducible control of gene expression with destabilized Cre. Nat. Methods 10, 1085–1088 (2013).
53. Chow, B.Y. et al. High-performance genetically targetable optical neural silencing by light-driven proton pumps. Nature 463, 98–102 (2010).
54. Warden, C., Tang, Q. & Zhu, H. Herpesvirus BACs: past, present, and future. J. Biomed. Biotechnol. 2011, 124595 (2011).
55. Zhang, Z. et al. Genetic analysis of varicella-zoster virus ORF0 to ORF4 by use of a novel luciferase bacterial artificial chromosome system. J. Virol. 81, 9024–9033 (2007).
56. Henaff, D., Rémillard-Labrosse, G., Loret, S. & Lippé, R. Analysis of the early steps of herpes simplex virus 1 capsid tegumentation. J. Virol. 87, 4895–4906 (2013).
57. Maccaferri, G. & McBain, C.J. The hyperpolarization-activated current (Ih) and its contribution to pacemaker activity in rat CA1 hippocampal stratum oriens-alveus interneurones. J. Physiol. (Lond.) 497, 119–130 (1996).
58. Wang, K. et al. Precise spatiotemporal control of optogenetic activation using an acousto-optic device. PLoS One 6, e28468 (2011).
59. Shoham, S., O’Connor, D.H., Sarkisov, D.V. & Wang, S.S. Rapid neurotransmitter uncaging in spatially defined patterns. Nat. Methods 2, 837–843 (2005).
60. Migliore, M. & Shepherd, G.M. Emerging rules for the distributions of active dendritic conductances. Nat. Rev. Neurosci. 3, 362–370 (2002).
61. Lörincz, A., Notomi, T., Tamás, G., Shigemoto, R. & Nusser, Z. Polarized and compartment-dependent distribution of HCN1 in pyramidal cell dendrites. Nat. Neurosci. 5, 1185–1193 (2002).
62. Magee, J.C. Dendritic hyperpolarization-activated currents modify the integrative properties of hippocampal CA1 pyramidal neurons. J. Neurosci. 18, 7613–7624 (1998).
63. Yi, H., Leunissen, J., Shi, G., Gutekunst, C. & Hersch, S. A novel procedure for pre-embedding double immunogold-silver labeling at the ultrastructural level. J. Histochem. Cytochem. 49, 279–284 (2001).
64. Cuntz, H., Forstner, F., Borst, A. & Häusser, M. The TREES toolbox--probing the basis of axonal and dendritic branching. Neuroinformatics 9, 91–96 (2011).
65. Hao, J., Wang, X.D., Dan, Y., Poo, M.M. & Zhang, X.H. An arithmetic rule for spatial summation of excitatory and inhibitory inputs in pyramidal neurons. Proc. Natl. Acad. Sci. USA 106, 21906–21911 (2009).
66. Graham, B.P., Saudargiene, A. & Cobb, S. Spine head calcium as a measure of summed postsynaptic activity for driving synaptic plasticity. Neural Comput. 26, 2194–2222 (2014).
67. Carnevale, N. & Hines, M. The Neuron Book (Cambridge University Press, 2006).68. Toledo-Rodriguez, M. & Markram, H. Single-cell RT-PCR, a technique to decipher
the electrical, anatomical, and genetic determinants of neuronal diversity. Methods Mol. Biol. 403, 123–139 (2007).
69. Pfeffer, C.K., Xue, M., He, M., Huang, Z.J. & Scanziani, M. Inhibition of inhibition in visual cortex: the logic of connections between molecularly distinct interneurons. Nat. Neurosci. 16, 1068–1076 (2013).
70. Lin, L. et al. Large-scale neural ensemble recording in the brains of freely behaving mice. J. Neurosci. Methods 155, 28–38 (2006).
71. Sik, A., Penttonen, M., Ylinen, A. & Buzsáki, G. Hippocampal CA1 interneurons: an in vivo intracellular labeling study. J. Neurosci. 15, 6651–6665 (1995).
72. Csicsvari, J., Hirase, H., Czurkó, A., Mamiya, A. & Buzsáki, G. Oscillatory coupling of hippocampal pyramidal cells and interneurons in the behaving Rat. J. Neurosci. 19, 274–287 (1999).
73. Barthó, P. et al. Characterization of neocortical principal cells and interneurons by network interactions and extracellular features. J. Neurophysiol. 92, 600–608 (2004).
© 2
017
Nat
ure
Am
eric
a, In
c., p
art
of
Sp
rin
ger
Nat
ure
. All
rig
hts
res
erve
d.
nature neurOSCIenCe doi:10.1038/nn.4517
74. Fox, S.E. & Ranck, J.B. Jr. Electrophysiological characteristics of hippocampal complex-spike cells and theta cells. Exp. Brain Res. 41, 399–410 (1981).
75. Wiebe, S.P. & Stäubli, U.V. Dynamic filtering of recognition memory codes in the hippocampus. J. Neurosci. 19, 10562–10574 (1999).
76. Wiebe, S.P. & Staubli, U.V. Recognition memory correlates of hippocampal theta cells. J. Neurosci. 21, 3955–3967 (2001).
77. Cohen, J.Y., Haesler, S., Vong, L., Lowell, B.B. & Uchida, N. Neuron-type-specific signals for reward and punishment in the ventral tegmental area. Nature 482, 85–88 (2012).
78. Kvitsiani, D. et al. Distinct behavioural and network correlates of two interneuron types in prefrontal cortex. Nature 498, 363–366 (2013).
79. Pi, H.J. et al. Cortical interneurons that specialize in disinhibitory control. Nature 503, 521–524 (2013).
80. Buzsáki, G. et al. Tools for probing local circuits: high-density silicon probes combined with optogenetics. Neuron 86, 92–105 (2015).
81. Courtin, J. et al. Prefrontal parvalbumin interneurons shape neuronal activity to drive fear expression. Nature 505, 92–96 (2014).
82. Stephenson-Jones, M. et al. A basal ganglia circuit for evaluating action outcomes. Nature 539, 289–293 (2016).
83. Gulyás, A.I., Hájos, N., Katona, I. & Freund, T.F. Interneurons are the local targets of hippocampal inhibitory cells which project to the medial septum. Eur. J. Neurosci. 17, 1861–1872 (2003).
84. Somogyi, P. & Klausberger, T. Defined types of cortical interneurone structure space and spike timing in the hippocampus. J. Physiol. (Lond.) 562, 9–26 (2005).
85. Cacucci, F., Lever, C., Wills, T.J., Burgess, N. & O’Keefe, J. Theta-modulated place-by-direction cells in the hippocampal formation in the rat. J. Neurosci. 24, 8265–8277 (2004).
86. Skaggs, W.E., McNaughton, B.L. & Gothard, K.M. An information-theoretic approach to deciphering the hippocampal code. in Advances In Neural Information Processing Systems (NIPS Conference) 5, 1030–1037 (1993).
87. Skaggs, W.E., McNaughton, B.L., Wilson, M.A. & Barnes, C.A. Theta phase precession in hippocampal neuronal populations and the compression of temporal sequences. Hippocampus 6, 149–172 (1996).
88. Meister, M.L., Hennig, J.A. & Huk, A.C. Signal multiplexing and single-neuron computations in lateral intraparietal area during decision-making. J. Neurosci. 33, 2254–2267 (2013).