Embed Size (px)
Citation preview

A discussion paper for the Absorber Review pre-meeting on February 11th 2003
On
3-D Fluid Flow calculations on the 22cm Absorber Window
By
Stephanie Yang & Wing Lau
Oxford University

Force-flow simulations
The aim of this analysis is to establish if there are sufficient flow coverage on the entire window surface at a low flow rate of only 2 m/s.
There is a need to keep the flow rate as low as possible so as to minimise the pressure drop inside the absorber, thereby allowing a low pressure head across the entire cryogenic system which is economical and preferable as far as safety is concerned.
2 models were set up, Model A with 11 inlets and 15 outlets, and Model B with 8 inlets and 12 outlets. The latest manifold design had additional straight nozzles at each inlet & outlet ends. These are not included in this analysis as they do not contribute significantly to the flow coverage across the window surfaces.
Both models are built on a 22cm diameter absorber window.
Nozzle dimensions are described in the individual case study files.
All inlet flow speeds are set at 2 m/s.
Figures 1 to 17 refer to the flow results on Model A, and likewise figures 18 to 22 refer to those of Model B.

The model of 22cm diameter Absorber Window with 11 inlet and 15 outlet nozzles (diameter of nozzle is 0.43 in)
Fig. 1

Fig.2 LH2 inlet speed at 2m/s

The following figures show the flow path of each individual inlet nozzle, or a group of inlet nozzles. It must be emphasized that all the 11 inlet nozzles are activated simultaneously. Flow paths from the other nozzles have been switched off to provide visual clarity of the flow paths in concern.

Figure 3 - flow path showing the swirling effect from the inlet nozzle 1 (nearest to the outlet nozzle)

Fig 4 – flow path from inlet nozzle 2

Fig 5 – flow path from inlet nozzle 3

Fig 6 – flow path from inlet nozzle 4

Fig 7 – flow path from inlet nozzle 5

Fig 8 – flow path from the central inlet nozzle

Fig 9 – flow path from inlet nozzle 7

Fig 10 – flow path from inlet nozzle 8

Fig 11 – flow path from inlet nozzle 9

Fig 12 – flow path from inlet nozzle 10

Fig 13 – flow path from inlet nozzle 11

Fig. 14 – interactive flow path for all inlet nozzles

Fig. 15 – image of the combined flow pattern

Fig. 16 – A plane view of the flow across the window

Fig. 17 – Another view of the multi-nozzle flow across the window

The following slides show the flow path and flow pattern of Model B which has 8 inlet and 12 outlet nozzles, each at 0.63” diameter

Fig 18 – Flow Path of the first two nozzles in Model B

Fig 19 – Flow Path of the 3rd & 4th nozzles in Model B
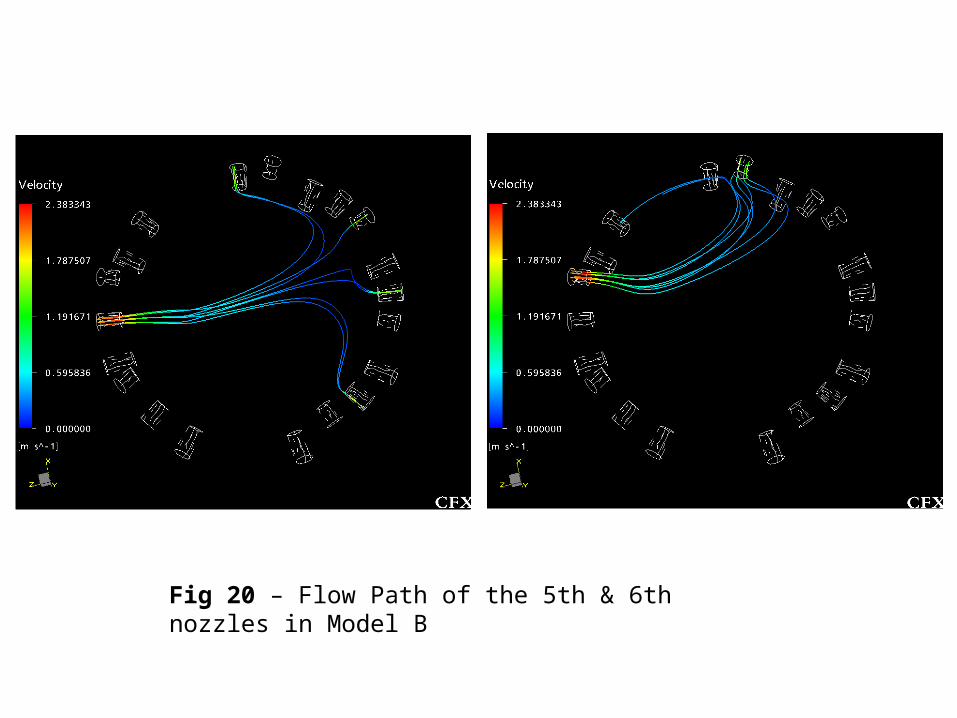
Fig 20 – Flow Path of the 5th & 6th nozzles in Model B

Fig 21 – Flow Path of the 7th & 8th nozzles in Model B

Fig.22 – Multi-flow Paths of all nozzles

Fig.22 – Multi-flow Paths and flow pattern of all nozzles

Observations of the Flow analysis results:
The above results demonstrate the adequacy of the existing nozzle arrangement, especially the off-centred inclined nozzles which provide good flow path to the window surfaces.
At 2 m/s, the Reynolds number of the flow anywhere inside the absorber remains low – below turbulence point, therefore avoiding any “dead zone” which is stagnated by the high swirling effect of a turbulent flow and which is bad for heat transfer.
It remains to be seen if this flow pattern is good enough to remove the amount of heat generated by the Muon beam
Although the relatively low speed seems to have provided a good flow coverage to the windows, the Cryogenic Group continues to seek an even lower flow rate so as to reduce the pressure drop across the system which is essential to improve the efficiency of the overall system.
Pending on the outcome of the Heat Transfer calculations, we will repeat our analyses with different flow speeds at, say, 0.5 m/s, 1 m/s & 4 m/s

Heat Analysis:
The Beam is represented by a tube of 10mm radius across the absorber centre from one Window to the other.
Beam Power is assumed to be 150W at steady state.
The beam as a fluid sub-domain

Flow pattern on the combined fluid / heat model – unaffected by the presence of the heat source
Temperature distribution inside the Absorber

Heat trace of the flow path from the first two nozzles
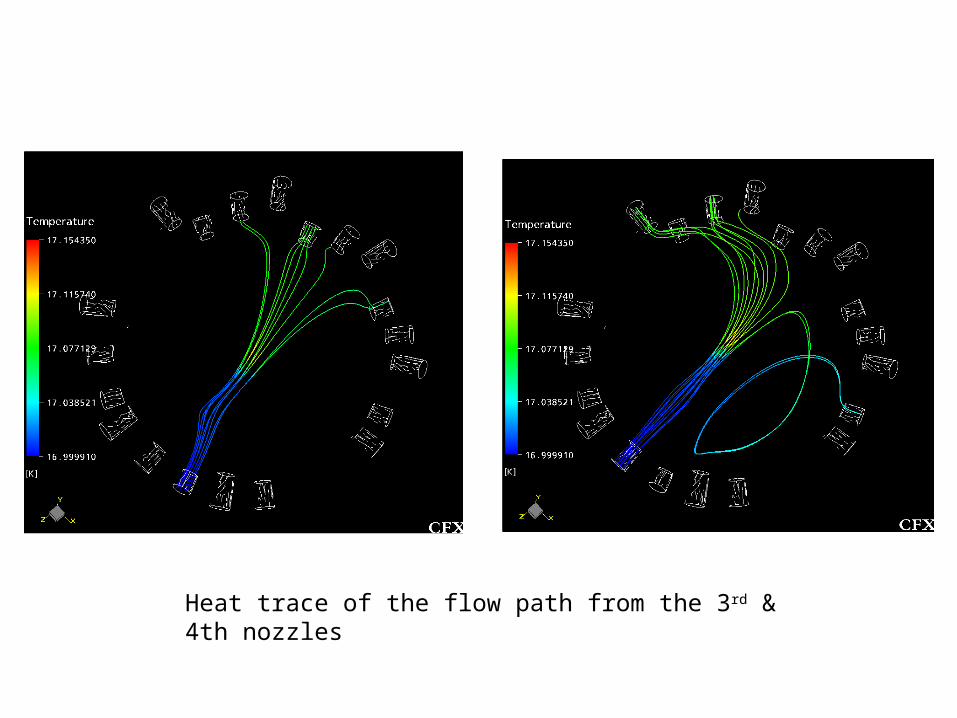
Heat trace of the flow path from the 3rd & 4th nozzles

Heat trace of the flow path from the 5th & 6th nozzles

Heat trace of the flow path from the 5rd & 6th nozzles
Heat trace of the flow path from the 7th & 8th nozzles

Mini conclusion:
The above shows the temperature of the fluid was only raised by 0.25 K at steady state condition. This is credible as it agrees with the ball-park hand calculations using the thermal properties of LH2.
It also shows that the temperature at the Window surfaces are evenly cooled.
Notice that the CFX model does not have any metal casing included at present. This will be added on as we progress further.
Our next step would be to look at the temperature distribution during the transient period. However it provides a good confidence that the nozzle is corrected orientated and that there should still be rooms to reduce the flow rate should there be a need.