Embed Size (px)
Citation preview

Stronger evidence,better decisions,improved health and welfare
Stronger evidence, better decisions, improved health and welfare
This report presents data at a state and territory level for the first 4 years (2013–14 to 2016–17) of the Public Dental Waiting Times National Minimum Data Set. This data set covers adults who were placed on selected public dental waiting lists to enable monitoring of in-scope waiting times. No national-level data are presented due to concerns about data comparability. This report examines factors that contribute to this lack of comparability, ahead of a planned redevelopment of the data set.
aihw.gov.au
A discussion of public dental waiting times information in Australia 2013–14 to 2016–17


Australian Institute of Health and Welfare Canberra
Cat. no. DEN 230
A discussion of public dental waiting times information in Australia
2013–14 to 2016–17

The Australian Institute of Health and Welfare is a major national agency whose purpose is to create authoritative and accessible information and statistics that inform decisions and improve the health and welfare of all Australians.
© Australian Institute of Health and Welfare 2018
This product, excluding the AIHW logo, Commonwealth Coat of Arms and any material owned by a third party or protected by a trademark, has been released under a Creative Commons BY 3.0 (CC-BY 3.0) licence. Excluded material owned by third parties may include, for example, design and layout, images obtained under licence from third parties and signatures. We have made all reasonable efforts to identify and label material owned by third parties.
You may distribute, remix and build upon this work. However, you must attribute the AIHW as the copyright holder of the work in compliance with our attribution policy available at <www.aihw.gov.au/copyright/>. The full terms and conditions of this licence are available at <http://creativecommons.org/licenses/by/3.0/au/>.
A complete list of the Institute’s publications is available from the Institute’s website <www.aihw.gov.au>.
ISBN 978-1-76054-298-6 (PDF) ISBN 978-1-76054-299-3 (Print)
Suggested citation Australian Institute of Health and Welfare 2018. A discussion of public dental waiting times information in Australia: 2013–14 to 2016–17. Cat. no. DEN 230. Canberra: AIHW.
Australian Institute of Health and Welfare Board Chair Director Mrs Louise Markus Mr Barry Sandison
Any enquiries relating to copyright or comments on this publication should be directed to: Australian Institute of Health and Welfare GPO Box 570 Canberra ACT 2601 Tel: (02) 6244 1000 Email: [email protected]
Published by the Australian Institute of Health and Welfare
This publication is printed in accordance with ISO 14001 (Environmental Management Systems) and ISO 9001 (Quality Management Systems). The paper is sourced from sustainably managed certified forests.
Please note that there is the potential for minor revisions of data in this report. Please check the online version at <www.aihw.gov.au> for any amendments.

iii
Contents Acknowledgments ............................................................................................................... iv
Abbreviations ....................................................................................................................... v
Symbol .................................................................................................................................. v
Summary .............................................................................................................................. vi 1 Introduction ................................................................................................................... 1
1.1 Dental care in Australia ............................................................................................. 1
1.2 PDWT data collection ............................................................................................... 2
1.3 Performance indicator calculation ............................................................................. 6
1.4 Ethics approval ......................................................................................................... 7
2 Characteristics of public dental programs that affect PDWT NMDS data ................. 8
2.1 Major factors known to affect PDWT NMDS comparability ........................................ 8
2.2 Other characteristics with a potential impact on public dental waiting times information .............................................................................................................. 12
3 Public dental services and waiting times data 2013–14 to 2016–2017 .................... 14
3.1 Interpreting the data ................................................................................................ 14
3.2 New South Wales ................................................................................................... 16
3.3 Victoria ................................................................................................................... 16
3.4 Queensland ............................................................................................................ 17
3.5 Western Australia ................................................................................................... 19
3.6 South Australia ....................................................................................................... 20
3.7 Tasmania ................................................................................................................ 22
3.8 Australian Capital Territory ..................................................................................... 23
3.9 Northern Territory ................................................................................................... 25
Appendix A: Data quality summary ................................................................................. 26
PDWT NMDS 2013–14 to 2016–17 ............................................................................... 26
Appendix B: Performance indicator specification .......................................................... 30
National Healthcare Agreement: PI 13–Waiting times for public dentistry, 2018 ............ 30
Appendix C: Supplementary information on waiting list management ......................... 32
Glossary .............................................................................................................................. 35
References .......................................................................................................................... 36
List of tables ....................................................................................................................... 37
List of boxes ....................................................................................................................... 38

iv
Acknowledgments This report was prepared by the Australian Institute of Health and Welfare (AIHW), with substantial input from members of the Public Dental Data Working Group and other staff in state and territory health departments and dental services, who provided data and clinical, program and other advice. The authors specifically thank:
• Norin Alam (Tasmanian Health Service) • Loretta Bettiens (ACT Health) • Andrew Chartier (SA Dental Service) • Kerryn De Jussing and Lachlan Shield (Department of Health and Human Services
Victoria) • John Skinner (NSW Health) • Ben Stute (Queensland Health) • Martine Tulloch (Department of Health, Northern Territory) • Glen Walker (Dental Health Services, Western Australia).
The Australian Health Ministers’ Advisory Council’s National Health Information Standards and Statistics Committee (the parent committee of the Working Group) also provided valuable advice and guidance.
The AIHW authors of this report were Rachel Muntz, Melanie Grimmond and Karen Malam, assisted by Clara Jellie and Jenny Hargreaves.

v
Abbreviations AIHW Australian Institute of Health and Welfare
IRSD Index of Relative Socioeconomic Disadvantage
METeOR metadata registry of the Australian Institute of Health and Welfare
NHA National Healthcare Agreement
NMDS National Minimum Data Set
PDWT Public Dental Waiting Times
PI performance indicator
RoGS Report on government services (annual report)
SEIFA Socio-Economic Indexes for Areas
Symbol n.a. not available

vi
Summary Since 2013–14, states and territories have collected data on public dental waiting times and reported them to the Australian Institute of Health and Welfare (AIHW). These data requirements are defined in the Public Dental Waiting Times (PDWT) National Minimum Data Set (NMDS) specification, which covers adults placed on the main public dental waiting lists used in Australia for dental services.
This report presents waiting times data—the number of days waited at the 50th and 90th percentiles—for the first 4 years of the collection (2013–14 to 2016–17). The data show that some people wait a considerable time before receiving care (or an offer of care).
The data reported for participating states and territories vary considerably over time. This may, in part, relate to changes over the relevant period in the availability of funding for public dental services.
The services (and waiting times) represented in the PDWT NMDS relate to a minority of public dental care patients—the majority receive care through priority or emergency care arrangements not necessarily managed using waiting lists. Also, administrative processes differ among the states and territories and subsets of patients and treatments included in the collection vary.
These differences in administration and management arrangements of public dental services affect the comparability and availability of data. The report therefore presents the data for each jurisdiction separately; national data tables are not presented.
This report is, in part, a response to calls by stakeholders to examine the factors underlying the lack of data comparability and availability (primarily related to the different organisation and administration of public dental waiting lists across jurisdictions) ahead of a planned redevelopment of the data set.

A discussion of public dental waiting times information in Australia: 2013–14 to 2016–17 1
1 Introduction States and territories have collected data on public dental waiting times and reported them to the Australian Institute of Health and Welfare (AIHW) since 2013–14. The data reported are based on the Public dental waiting times (PDWT) national minimum data set (NMDS) specification, which covers people who were placed on a waiting list for care, were offered care and/or attended their first visit in the relevant reporting period.
The purpose of this report is to present the data from the first 4 years of the collection (2013–14 to 2016–17). Due to concerns about the comparability and availability of data for some jurisdictions, the report presents the data for each jurisdiction separately, with no national data tables or comparisons between jurisdictions. This report also examines the factors underlying the lack of comparability and availability (primarily related to the different organisation and administration of public dental waiting lists across jurisdictions) ahead of a planned redevelopment of the data set.
Chapter 1 provides a brief introduction to dental service provision in Australia and describes the origins, scope and data elements of the PDWT NMDS. Chapter 2 explains the differences among the states and territories in administrative structures and eligibility criteria for being placed on one of the selected waiting lists within the scope of the PDWT NMDS. The contextual detail presented in chapters 1 and 2 can then be used to interpret the 4 years of PDWT NMDS data (2013–14 to 2016–17) presented in Chapter 3.
1.1 Dental care in Australia In Australia, oral and dental care is provided by private and public dental services in the community, and in public and private hospitals, to both admitted and non-admitted patients. Although there are no comprehensive national data sources available, most dental care is provided in the private sector to people with or without private health insurance that includes some dental cover. Alongside these services, publicly funded oral and dental health services play a role in helping eligible Australians who might find it difficult to access dental health care in the private sector to receive such care, either free of charge or at a subsidised cost. Public dental programs are operated by states and territories, with eligibility for services and the organisation of services varying greatly across the jurisdictions.
As well as the services provided by states and territories, the Australian Government provides benefits for basic dental services for eligible children under the Child Dental Benefits Schedule—some of which is delivered through public sector services (DoH 2017a). In 2014, an estimated 36% of the Australian population were eligible to receive public dental care—with a higher proportion of children eligible than adults because of broader eligibility requirements that generally apply to children (PC 2017). Despite the availability of these services, the COAG Health Council (2015:78) estimates that:
Current funding for public oral health services allows for treatment of only about 20% of the eligible group, leaving some 80% without public treatment. Some seek care in the private sector, generally for relief of pain, which means that they receive only limited and compromised oral health care; some do not access any care.
Due to concerns such as these, there is a strong interest in monitoring the accessibility of public dental services nationally. Initial efforts to monitor access have focused on waiting times for adults who were placed on a waiting list to receive dental care from state/territory public dental services.

2 A discussion of public dental waiting times information in Australia: 2013–14 to 2016–17
Monitoring waiting times for public dental care Waiting lists are an important way in which public dental services manage the demand for services—by placing people needing non-emergency treatment, or who do not otherwise qualify for priority dental care, on waiting lists for care. These patients are then contacted when capacity becomes available at the service at which they are registered.
Because waiting too long can result in more ill health for patients, including potentially preventable hospitalisations (COAG 2015), the Australian Government and the states and territories agreed in 2012 to monitor waiting times through a National Healthcare Agreement (NHA) performance indicator (PI). This indicator—Public dentistry waiting times (NHA PI 13)—was developed under the auspices of the National Health Information Standards and Statistics Committee (a subcommittee under one of the 6 principal committees of the Australian Health Ministers’ Advisory Council) and is reported in the annual Report on government services (RoGS) (see, for example, SCRGSP 2018).
Since RoGS 2016 (SCRGSP 2016), the data have been sourced from the PDWT NMDS. This data collection enables the calculation of two waiting time periods that patients experience and collects some information about patient characteristics.
Importantly, the indicator based on PDWT NMDS data measures waiting times for people who receive (or are offered) care after being placed on a waiting list; this does not represent the experience of everyone who accesses (or seeks to access) public dental care. Based on information provided by selected states and territories, it is estimated that the PDWT NMDS may capture information on only 15%–26% of public dental service provision in their jurisdiction. The indicator can, nevertheless, provide important information about the timeliness of services provided to people who are not treated under priority arrangements.
1.2 PDWT data collection PDWT NMDS data are provided annually to the AIHW by state and territory health authorities based on specifications agreed by all states and territories and endorsed by the Australian Health Ministers’ Advisory Council.
The full specification for the collection is available online in the AIHW’s metadata registry METeOR <meteor.aihw.gov.au>, (METeOR identifier: 494562); however, the following section outlines the currently agreed scope and content of the collection.
Scope of the current collection The scope of the collection is to capture some basic data about adults who either did not qualify for priority care based on urgency or other criteria, who are placed on general dental care, denture care (also known as prosthetic) or assessment public dental waiting lists (see Appendix C, Table C1 for more information on the use of the assessment waiting list type) in a specific collection year, or who were placed on a waiting list at any time and were offered care (or received care) in the collection year. Data about services (and associated waiting times) provided to children and young people aged under 18 are not captured in this collection. (See Box 1.1 for the collection’s agreed scope statement.)

A discussion of public dental waiting times information in Australia: 2013–14 to 2016–17 3
Box 1.1: Scope statement for the PDWT NMDS The purpose of the Public dental waiting times national minimum data set is to describe the information that must be collected to calculate the waiting times for two time periods in the treatment pathway for public dental services in Australia:
• The time between the date a person is placed on a waiting list and the date they are offered dental care; and
• The time between the date a person is placed on a waiting list and the date they receive dental care.
In this data collection, person includes all persons eligible for their state or territory public dental scheme, who were aged 18 years or over when they were placed on a general or prosthetic public dentistry waiting list for the purpose of receiving treatment.
The data collection includes:
• all people specified above with a listing date for dental care within the collection period
• all people specified above with a date of offer of dental care within the collection period
• all people specified above with a date of first dental visit within the collection period.
The data collection excludes:
• people who access their local public clinic but pay full price and are not eligible for their state or territory's public dental service
• people who are treated under state/territory priority client schemes. In this data collection, treatment means any event consisting of the provision of dental care resulting from a person being placed on a public dental waiting list and funded under a public dental scheme of their state or territory. Only treatments received after a person is placed on a public dental waiting list should be recorded. Excluded treatments are:
• treatment paid for in full by the person receiving the treatment
• treatment provided by practitioners funded from outside of the public dental health sector, for example, treatment provided by General Medical Practitioners (GPs)
• treatments which do not result in removal from a waiting list, such as: – relief of pain that does not satisfy other dental treatment needs
– emergency treatment that does not satisfy other dental treatment needs – where a person is on a general care or denture care waiting list, consultations to
determine future care that do not result in the removal from the list.
A public dental waiting list episode ends:
• at the date of offer of dental care, if this is the last recorded date; or
• at the date of first dental visit. All dental services funded (entirely or in part) by the state or territory government are included unless otherwise noted.
Source: METeOR identifier: 494562.

4 A discussion of public dental waiting times information in Australia: 2013–14 to 2016–17
The scope statement describes one of several possible patient pathways through the public dental system, which typically involves:
• a patient contacting the public dental service either by telephone or in person, or by the service receiving a referral for the patient from another care provider
• a clinical assessment (or review of a previous assessment for referrals) to determine whether the patient requires: – emergency treatment (where the patient is offered urgent treatment as soon as
possible) – treatment as a priority patient (where the patient is treated through methods other
than being placed on a general dental care or denture care waiting list, including, in some states and territories, being placed on other types of waiting lists)
– treatment via a general dental care or denture care waiting list—the main waiting lists used in Australia for dental services (where the patient waits to be offered treatment, and thus an appointment for a future consultation date, at which time treatment starts). This is the part of the pathway captured in the PDWT NMDS.
Also, note that the scope includes records associated with all listing, offer and first visit dates in the collection period. This means that some records will be submitted in more than one collection period. However, the data are reported in such a way that there is no double counting. For instance, the number of offers will be reported for all offers of care in the reporting period, not all offers in the submitted data.
Data elements in the collection The data elements included in the PDWT NMDS are summarised in Table 1.1. Full specifications for these data elements are available in the AIHW’s metadata registry, METeOR <meteor.aihw.gov.au>.
Note that the collection does not include any information about the treatment the person receives (apart from the very basic information that can be inferred by their placement on a general dental care or denture care waiting list), or the comparative urgency of the care needed (other than that it was not emergency care). Treatments may consist of one or more service events.

A discussion of public dental waiting times information in Australia: 2013–14 to 2016–17 5
Table 1.1: PDWT NMDS data elements
Data element name Description METeOR identifier
Person characteristics
Sex The biological distinction between male and female 287316
Date of birth The date of birth of the person 287007
Country of birth The country in which the person was born, as per the Standard Australian Classification of Countries 2011
459973
Preferred language The language (including sign language) most preferred by the person for communication, as per the Australian Standard Classification of Languages 2011
460123
Indigenous status Whether a person identifies as being of Aboriginal or Torres Strait Islander origin
291036
Area of usual residence The geographical region in which the person usually resides 469909
Australian postcode (address) The postcode of a person’s usual residence 429894
Australian state/territory identifier (person)
The state or territory of a person’s usual residence 286919
Waiting list characteristics
Public dental waiting list type The type of public dental waiting list upon which a person is placed: general dental care, denture care or assessment (see Glossary)
429615
Public dental listing date The date a person is placed on a public dental waiting list 428485
Offer of dental care date The date on which a formal offer of dental care is made to a person on a public dental waiting list
428965
Date of first dental visit The date on which a person on a public dental waiting list attends their first dental visit
446601
Data quality and limitations Data providers are primarily responsible for the quality of the data they provide to the AIHW in terms of compliance with the PDWT NMDS specification. The AIHW does undertake basic validation of the data, though it does not adjust data to account for possible data errors or missing or incorrect values.
The main issue in respect to the quality of reported data is the completeness of the data that have been collated for the 4 reporting cycles. In particular:
• New South Wales has not reported PDWT NMDS data in any of the collection years. It advised the AIHW that it did not provide the data because its public dental services are not comparable with other state/territory schemes due to the way in which it prioritises patients for care.
• Victoria did not provide data for 2016–17 due to data quality concerns. • The Australian Capital Territory did not submit data for 2013–14 and 2014–15 due to
data quality and resourcing issues. • The Northern Territory did not submit data for 2013–14, 2014–15 and 2015–16 due to
data quality and resourcing issues; as well, data were not published in 2016–17 due to data quality concerns.

6 A discussion of public dental waiting times information in Australia: 2013–14 to 2016–17
• Data reported for Western Australia are not complete, as they are based on services provided by some public dental providers only and do not cover all public dental services in that state.
However, the main limitation of PDWT NMDS data is that they relate to public dental programs that are arranged and delivered differently in each state and territory. As a result, the extent to which data can be used to compare jurisdictions or present a national picture of public dental waiting times is limited. For this reason, national data are not presented in this report. The data do, however, enable monitoring of waiting times for in-scope patients within jurisdictions (including over time).
Chapter 2 of this report describes the ways in which states and territories deliver public dental services. Some extra information (provided by states and territories) is included to provide context to the data presented. This can help to interpret the data for individual jurisdictions and to see how this interpretation differs between jurisdictions.
Interpretation issues relate mainly to different administrative processes and to variance in the subsets of patients and treatments; these differences reflect the scope of the data collection which limits the PDWT NMDS to non-priority adult patients who are placed on a waiting list. Care provided to emergency patients or priority groups and target populations (which can be the majority of care in most jurisdictions, and which differ by state and territory) is not in-scope. Based on information received from five of the eight jurisdictions, the AIHW estimates that between 15%–26% of the total service activity undertaken in the states and territories is in-scope of the PDWT NMDS. The remaining portion of services are delivered outside the scope of the collection (for example, to children, emergency and priority group patients).
Note that these estimates use various counting units. For example, some states and territories based these estimates on the number of courses of care delivered; others based them on the number of service events or contacts. One jurisdiction noted that its estimated percentage of services was likely to underestimate the actual proportion of total service provision because its course-of-care estimates included both emergency (excluded from the scope of the PDWT NMDS) and general care and that, on average, there is 3–4 times the amount of resources required in a general course-of-care compared with an emergency course of care. Despite these limitations, these estimates provide a preliminary impression of how much total public dental service provision is captured by the PDWT NMDS.
Because of these limitations, this report presents data separately for each state and territory and does not compile data at the national level. This is consistent with how these data are reported in RoGS.
See Appendix B for more details on data quality of the PDWT data presented in this report.
1.3 Performance indicator calculation As outlined previously, the PDWT NMDS was established to enable reporting against the NHA PI Waiting times for public dentistry. The PI presents information about waiting times between being placed on a public dentistry waiting list and:
• being offered dental care, and • receiving dental care. The indicator comprises these two related measures as some jurisdictions report that the time taken to receive dental care is subject to several factors, and hence waiting time to the offer of dental care may be a more relevant measure. However, as it does not include the period from the offer of care to the first visit, it does not reflect the full waiting time

A discussion of public dental waiting times information in Australia: 2013–14 to 2016–17 7
experienced by the patient. As a result, both measures are reported where data are available. Waiting times are presented as the number of days within which 50% and 90% of all patients began treatment or were offered care (that is, waiting times at the 50th and 90th percentiles) and are reported separately by waiting list type. The types specified are general dental care, denture care and assessment (see Appendix C, Table C1 for more information on the use of the assessment waiting list type). These data are also reported to RoGS (see, for example, SCRGSP 2018), where the data have also been disaggregated by Indigenous status, remoteness category and socioeconomic position of the person receiving services.
See Appendix B for the full PI specification.
Note that waiting times data provide information on access to health services—an important aspect of the performance of services. Waiting times can be viewed as part of the performance of the health system as a whole, rather than necessarily being wholly attributable to the performance of a specific service provider.
Box 1.2: Calculating waiting times Waiting times are calculated in days by subtracting the date placed on a public dentistry waiting list (public dental listing date) from:
• the date dental care was offered (offer of dental care date), and
• the date dental care was received (date of first dental visit).
Waiting times until the offer of dental care are calculated for all records where the offer of dental care date occurred within the collection period (regardless of when the listing date occurred); offer dates that did not occur in the collection period are excluded from waiting time calculations for this measure.
Similarly, waiting times until the first dental visit are calculated for all records where the date of first dental visit occurred within the collection period (regardless of when the listing date occurred); visit dates that did not occur in the collection period are excluded from waiting time calculations for this measure.
Note that:
• records reporting dates that resulted in negative waiting times are not permitted
• records with waiting times of zero days are included for calculations of waiting times from listing date to date of offer but are excluded from waiting times calculations for listing date to date of first dental visit
• records that had no date of offer or date of first dental visit are excluded from the relevant calculation as a waiting time could not be calculated.
1.4 Ethics approval The PDWT NMDS was approved by the AIHW Ethics Committee in November 2015, confirming that the project conforms with the Information Privacy Principles set out in the Privacy Act 1988, and with requirements outlined in the National Statement on Ethical Conduct in Human Research (2007), the Australian Code for the Responsible Conduct of Research (2007), and the strict data confidentiality requirements set out in the Australian Institute of Health and Welfare Act 1987.

8 A discussion of public dental waiting times information in Australia: 2013–14 to 2016–17
2 Characteristics of public dental programs that affect PDWT NMDS data
This chapter describes in broad terms the main differences in the organisation and administration of public dental services across Australia, and the features of these services that determine which data are reported to the PDWT NMDS. These differences contribute to the reasons why data are not considered to be nationally comparable.
The main areas of difference described in this report relate to:
• patient eligibility • patient prioritisation for care, including identification of priority population groups and
emergency cases for priority care. These people are not placed on waiting lists, and are therefore not in scope for the collection
• administration and management arrangements related to waiting lists in jurisdictions, which can determine the type of waiting list on which a person is placed and, therefore, whether they are in scope for the collection.
As well, other characteristics of the service provision and service provision models, which can influence the settings in which care is delivered (and the profile of patients who access care) are discussed. This includes the types of dental care provided, the settings in which services are delivered, and costs borne by patients to access services.
2.1 Major factors known to affect PDWT NMDS comparability
Eligibility for adult public dental care Adults on public dental waiting lists are generally on low incomes and need to meet certain conditions to be eligible for public dental care. Some conditions are the same in all states and territories in Australia, such as if the person holds one or more of the following:
• Australian Government Health Care Card • Australian Government Pensioner Concession Card issued by Centrelink.
These cards are issued if a person meets the conditions to receive one or more government benefit payments designed to assist those reaching aged pension age; job seekers; students; carers; widows or widowers; people experiencing illness, injury, mobility problems or financial hardship; and people raising children.
Other eligibility criteria are specific to certain states and territories:
• Victoria, Queensland, South Australia, Tasmania and the Northern Territory offer public dental care to holders of a Pensioner Concession Card issued by the Department of Veterans’ Affairs.
• New South Wales, Victoria and Queensland offer public dental care to holders of a Commonwealth Seniors Health Card.
• Queensland also offers public dental care to holders of a Queensland Seniors Card. As can be seen, the population that is eligible to receive public dental services (and therefore potentially in-scope for the PDWT NMDS collection) varies between states and territories.

A discussion of public dental waiting times information in Australia: 2013–14 to 2016–17 9
Priority groups and target populations Within the population eligible for public dental care, states and territories identify certain priority groups and target populations to receive priority care. These patients are not placed on waiting lists for care, but instead would usually have an appointment scheduled for their care. While there may still be a waiting time for that appointment (due to availability of appointment times and/or patient choice), the waiting times for care provided to these groups are not captured within the PDWT NMDS.
These groups are prioritised because people within them may either experience substantial socioeconomic disadvantage (and it is beneficial for the health and welfare system as a whole to treat them as soon as possible) or have difficulty in accessing services (in which case, waiting lists can be impractical as care is often provided at a specific point in time to a specific population group, such as via a mobile clinic in a remote area). Priority groups may include:
• people who are socially disadvantaged (for example, people experiencing homelessness)
• Aboriginal and Torres Strait Islander people • people living in regional and remote areas • people with additional and/or specialised health-care needs (for example, people living
with a mental illness; people with physical, intellectual or developmental disabilities; people with complex medical needs; and frail older people)
• prisoners.
The priority status of specific population groups varies by state and territory, as outlined in Table 2.1.
Table 2.1: Programs for priority groups and target populations
NSW(a)(b) Vic Qld(a) WA(a) SA Tas ACT NT
Some residents of aged care facilities ● ● ● ● ● n.a. n.a.
Prisoners ● ● ● ● ● n.a. n.a.
Refugees ● ● ● ● n.a. n.a.
Asylum seekers ● ● ● ● n.a. n.a.
Residents of some remote areas ● ● ● n.a. n.a.
Indigenous people ● ● ● ● ● ● n.a. n.a.
Pregnant women ● ● ●(a) n.a. n.a.
Homeless people ● ● ● n.a. n.a.
Registered clients of some mental health and disability services ● ● ● ● ● n.a. n.a.
●—Program exists.
n.a.—No information was provided by these territories.
Blue shading—Services fall (fully or partially) within the scope of the PDWT NMDS. For example, in Western Australia residents of aged care facilities are entitled to a free annual examination only. Further treatment is then referred to a public dental clinic (if eligibility criteria are met) or a private dentist (full fee paying).
Green shading—Priority patients (excluded from the PDWT NMDS).
(a) Not all programs for priority/target groups are state wide.
(b) No information on whether programs fall within or outside the scope of the PDWT NMDS was provided by for New South Wales.

10 A discussion of public dental waiting times information in Australia: 2013–14 to 2016–17
Emergency dental care All states and territories prioritise care for people who need emergency dental care, though the care provided may address immediate needs (for example, pain relief or control of infection) and not necessarily the full treatment required. People who receive emergency care may, or may not, already be on a waiting list for treatment.
The prioritisation of care needed (including the identification of emergency cases) in all states and territories is done systematically via a variety of triaging systems. On first contact (by phone, in person or based on referral information), the urgency of a patient’s need for dental care is assessed using a questionnaire about the severity of the person’s illness, injury or pain. If the need for care is considered an emergency, people are treated according to different clinical benchmark time frames and may not be included in the waiting list system. Examples of illness, injury or pain that may be considered an emergency in some or all states and territories include:
• acute dental and/or facial trauma resulting in tooth, jaw or soft tissue damage • acute infection • facial swelling • uncontrolled bleeding from an oral wound • acute oral pain.
Triaging systems are a common feature of all state/territory public dental services, but the questions and criteria used to assess patients, and the urgency categories that are allocated, are not standardised across the country. They may also vary within states and territories. These different practices may explain some of the variation in the estimated proportion of services delivered that is emergency care across Australia. Estimates of the proportion of emergency care delivered range from 6%–43% of services for adult clients.
This difference affects the interpretation of PDWT NMDS data. In states and territories where there is a lower percentage of caseload deemed to be emergency care, a greater proportion of that state and territory’s patients will be put on waiting lists and will be within the scope of the PDWT NMDS, and vice versa.
Waiting list management The PDWT NMDS defines three types of waiting list for which waiting times are calculated for the NHA PI: general dental care, denture care and assessment. There are, however, inherent limitations in using waiting times to measure public dental service performance where:
• states and territories define and use these waiting lists differently • only New South Wales and the Northern Territory have assessment waiting lists, see
Appendix C:Table C1 for further details • most states and territories manage other waiting lists (for example, general anaesthetic,
oral surgery, prosthodontic, orthodontic, periodontic and undergraduate teaching clinic waiting lists).
These differences may have an impact on the comparability of PDWT NMDS data across Australia. Further, measured waiting times may not reflect the waiting times experienced by people placed on other types of waiting lists that are not captured through this collection.
Table C2 in Appendix C outlines some of the complexities with which waiting lists are managed across Australia and how people who are placed on waiting lists may be prioritised. In most (but not all) states and territories, general dental care and denture care waiting lists

A discussion of public dental waiting times information in Australia: 2013–14 to 2016–17 11
are managed separately. In most cases, people on general dental care and denture care waiting lists are placed on (and taken off) the waiting list in chronological order. Some states and territories also have recommended maximum waiting times (based on their triage category) and these may influence the management of waiting lists to ensure that, to the extent possible, people are treated within recommended treatment time frames.
Also, specific waiting list management practices may affect the waiting times data that are reported. For example, in Tasmania, clients who are offered care but do not respond are suspended from the waiting list. If they later present for care, they will be restored to the waiting list in their original position (that is, based on the original listing date). Waiting times calculated for these clients will not take into account the period of ‘suspension’ and so will be artificially inflated under the current methodology for calculating waiting times.
Recall patients Another aspect of waiting list management is how some states and territories provide care to people who have already received dental care and are then recalled for re-examination or further related care or, in some states, re-present with problems relating to a previous course of care. Most states and territories consider a recall patient to be someone who has already received dental care and presents again within 12 months of that course of care (or as determined to be clinically appropriate). Most states and territories, but not all, manage separate systems for recalled patients. Therefore, care provided to people under recall arrangements in most states and territories is not included in the PDWT NMDS collection, but it is included for at least one state/territory.
Further details on how states and territories manage recall patients is provided in Table C3 in Appendix C. These differences have implications for the national comparability of the PDWT NMDS.
Outsourcing and vouchers As well as providing public dental services directly to patients, a number of states and territories enable dental care to be provided (under special arrangements) by private dental practitioners. This may be through contractual arrangements the state or territory has with certain providers, or by a voucher scheme where a patient is given a voucher which they can redeem by making an appointment with a private provider of their choice (this may be a limited choice). The voucher may cover the full cost of the treatment or part of the cost (in which case, the patient pays the remaining cost). Once the dental care is complete, the private provider then bills the state or territory.
While all states and territories use vouchers to some extent, the proportion and types of services outsourced in this way vary considerably between jurisdictions and can change over time. These kinds of arrangements may be put in place in circumstances where a client may have special care needs or may face difficulty accessing a public dental clinic (for example, for people living in remote areas). They may also be used to temporarily expand the capacity of care that can be delivered by the public dental service; for example, when further funding becomes available.
Additional information provided by six of the states and territories for the 3 years 2013–14 to 2015–16 shows that:
• the percentage of all public dental services (services both in- and out-of-scope of the PDWT NMDS) provided under voucher arrangements ranges across states and territories between 3%–22%, with one state/territory’s use of vouchers varying between 5% in one year and 16% in another

12 A discussion of public dental waiting times information in Australia: 2013–14 to 2016–17
• for care that is within scope of the PDWT NMDS, the use of vouchers ranged between 4%–51% across states and territories.
Note that dental services provided in the private sector on behalf of a state/territory public dental services are in scope for the PDWT NMDS and data about these services are reported by states and territories; however:
• the data required to be recorded by private dental services and submitted to state and territory public dental services vary across states and territories. For example, data on the date of first dental visit may, in some cases, be recorded as the date a treatment course (which may comprise several visits) ends, not the date the course started
• the date of first dental visit also does not take into account any delay the patient may experience between receiving a voucher and making an appointment with a private dental service, which may be different for care provided in public and private settings. Delays of this kind (which can be associated with patient choice) are included in the waiting time to first visit in the PDWT NMDS, which do, therefore, reflect the waiting time experienced by the patient.
For these reasons, the extent to which voucher systems or subcontracted care arrangements are used within states and territories may affect the data (and quality of data) reported.
2.2 Other characteristics with a potential impact on public dental waiting times information
To interpret the data in the PDWT NMDS, it is useful to understand the variety of ways in which public dental services are delivered across states and territories—in terms of where patients receive services, the types of services provided, and the cost for patients of some public dental care. These characteristics may also affect the comparability of PDWT NMDS data across states and territories; however, there is less information currently available to assess the extent to which these characteristics vary among the jurisdictions and therefore affect the interpretation of waiting times data.
Service settings States and territories provide public dental services in a variety of different locations and in different types of facilities. The following is a list of service settings in which public dental services may be delivered:
• public dental clinics • private dental clinics (for outsourced care) • mobile public dental clinics • hospitals (admitted patient care settings and outpatient clinics), including specialist
dental hospitals • remote dental clinics (staffed intermittently) • domiciliary service to homes • correctional services clinics • aged care facilities • Aboriginal and Torres Strait Islander health clinics. It should be noted that not all states or territories provide services in all these settings. Also, not all these service settings would be considered in-scope for the PDWT NMDS.

A discussion of public dental waiting times information in Australia: 2013–14 to 2016–17 13
For example, it can be complicated to decide whether care given in hospital settings is in-scope: care delivered in hospitals that are not specialist dental hospitals (to either non-admitted or admitted patients) is not administered through the in-scope waiting lists and is therefore excluded from the PDWT NMDS. But some care delivered in specialist dental hospitals could be administered via the in-scope waiting lists and therefore may fall within the scope of the data collection. Care provided at public dental clinics which are co-located with hospitals is within scope if it meets the other parameters of the scope statement. Similarly, whether or not care delivered in other settings (for example, Aboriginal and Torres Strait Islander health clinics) would be considered to be in-scope depends on the specific arrangements for providing that care. These may differ between states and territories. As well, the range of settings in which services are provided may indirectly affect the number and types of patients who are treated, and which patients’ data are in- and out-of-scope of the PDWT NMDS, as the service settings have some overlap with the agreed priority groups and target populations within a state or territory.
Types of dental care Public dental services deliver a wide variety of clinical services. These include diagnostic services; preventive, prophylactic and bleaching services; periodontics; oral surgery; endodontics; and restorative services. State and territory dental services may emphasise and/or manage different types of care differently in terms of whether they might be considered emergencies.
There may also be differences across states and territories in how these clinical services are managed in relation to the specific waiting lists operated within the jurisdiction, which may affect the data reported under the collection, and the interpretation of the waiting times data.
Payment arrangements for services While public dental services are provided with the aim of improving the accessibility of dental services, patients may be required to contribute towards the costs of their treatment. In Victoria, Western Australia, South Australia, Tasmania and the Australian Capital Territory, treatment provided in public facilities may require a co-payment from patients. Minimum and maximum limits can apply, and exemptions may be given to selected populations groups of patients.
The level of co-payment does not affect whether the service is in-scope of the PDWT NMDS, but it may affect the number of people who access treatment through public dental services.

14 A discussion of public dental waiting times information in Australia: 2013–14 to 2016–17
3 Public dental services and waiting times data 2013–14 to 2016–2017
This chapter presents data submitted to the PDWT NMDS for the 4 years 2013–14 to 2016–17. Data are presented separately for each state and territory because they are not considered to be comparable across states and territories for the reasons outlined in this report.
The data reported here are:
• number of offers of care, first visits and new listings in the collection periods • number of days within which 50% and 90% of people received an offer of care, by
waiting list type (general dental care and denture care) • number of days within which 50% and 90% of people attended their first visit, by waiting
list type (general dental care and denture care).
Note that ‘first visits’ can denote the only dental visit undertaken or it can mean the first in a series of visits required for a course of care.
3.1 Interpreting the data The data on the number of records and waiting times presented in this chapter should be interpreted with caution for the reasons outlined elsewhere in this report—namely, that the different organisation and structure of programs may mean that there is variation in the services and patients represented in the data, based on the PDWT NMDS.
Some care should also be taken when comparing waiting times data for jurisdictions over time. The methodology used to measure waiting times in the NHA PI (and in this report) may show a change in waiting times experienced by patients at the 50th and 90th percentiles when different levels of clinical resources are mobilised and different numbers of offers of care and first visits are made in a specific reporting period. This happened, for example, when the funding available to services changed with the National Partnership Agreement on Treating More Public Dental Patients (2012–13 to 2014–15) and the National Partnership Agreement on Adult Public Dental Services (2015–16) (DoH 2017b; Lalloo & Kroon 2016). Increased funding may result in longer waiting times being reported for a period because patients who have been waiting the longest will generally be the first to come off the list; this ‘catching up’ (which results in more people receiving care) may result in an increase in the waiting times reported in that period. Increased funding and/or waiting time reductions can also have an impact on demand for public care.
Thus, there is a risk of misinterpreting the performance of a service if judged solely on waiting times for offers or first visits; considering the service volumes being delivered (alongside waiting times data), for example, provides useful additional information when considering the performance of the services. However, the PDWT NMDS does not include detailed information on service delivery, nor take account of the complexity of the types of services being delivered (for example, by using a weighted counting unit such as a dental weighted activity unit, which is used by states and territories for National Partnership Agreement reporting). Hence, the number-of-records data presented in this report may not be a particularly robust measure of service volumes—as noted, one ‘first visit’ relates to a course of care that may comprise a one-off short appointment, or a treatment course that may span several appointments.

A discussion of public dental waiting times information in Australia: 2013–14 to 2016–17 15
Data suppression In this report, waiting times have been suppressed for the 50th and 90th percentiles where the number of contributing records is fewer than 20.
RoGS reporting More detailed PDWT NMDS data are available on the RoGS website at:
• for 2013–14 to 2015–16 data: <http://www.pc.gov.au/research/ongoing/report-on-government-services/2017/health/primary-and-community-health> (SCRGSP 2017)
• for 2016–17 data: <http://www.pc.gov.au/research/ongoing/report-on-government-services/2018/health/primary-and-community-health> (SCRGSP 2018).
The RoGS tables present waiting times and number of episodes by waiting list type and by Indigenous status, remoteness and socioeconomic status. Caution should be exercised when interpreting these disaggregated data because people who are Indigenous, living in a remote area or within a low socioeconomic population group may be recognised as a priority population within a state/territory, and therefore may be outside the scope of the PDWT NMDS. Hence, the extent to which public dental patients with these characteristics are represented in the data will vary.
Number of records in the PDWT data collection Table 3.1 presents the total number of records reported to the PDWT data collection across Australia and the number of records within that total that contain dates of offers, first visits and listings that occurred within each collection period, noting that records may contain data on:
• a listing only • a listing and an offer • a listing and a first visit • a listing, an offer and a first visit.
Therefore, the data reported in the tables for each reporting period are not mutually exclusive and the total records reported is not the sum of the other rows. These data do not indicate the number of people on a waiting list at any point in time.
Table 3.1: Number of records reported to the PDWT NMDS, Australia, 2013–14 to 2016–17(a)
2013–14 2014–15 2015–16 2016–17
Total records reported(b) 442,344 447,537 492,240 374,154
Records with offers in the collection period(c) 242,840 194,943 252,897 209,726
Records with first visits in the collection period(c) 158,579 137,016 165,526 137,575
Records with listings in the collection period(c) 299,388 312,843 305,572 210,815
(a) Excludes New South Wales and the Northern Territory for all collection periods, and the Australian Capital Territory for 2013–14 and 2014–15.
(b) Number of records does not equal the total of the number of offers, first visits and listings in the collection period due to those categories not being mutually exclusive.
(c) These categories are not mutually exclusive.

16 A discussion of public dental waiting times information in Australia: 2013–14 to 2016–17
3.2 New South Wales New South Wales has not provided data to the PDWT NMDS due to concerns about data comparability at a national level.
3.3 Victoria Victoria did not provide data for 2016–17 due to data quality concerns.
Offers of care, first dental visits and new listings on waiting lists reported to the PDWT NMDS Table 3.3.1 shows how many offers of care, first visits and new listings (regardless of whether these listings had an offer of care or a first visit in the same collection period) occurred on general dental care and denture care waiting lists during three collection periods in Victoria.
Table 3.3.1: Number of offers of care, first dental visits and new listings on waiting lists reported to the PDWT NMDS, Victoria, 2013–14 to 2016–17
2013–14 2014–15 2015–16 2016–17
General dental care
Offers in the collection period(a) 80,312 65,703 80,593 n.a.
First visits in the collection period(a) 40,159 35,801 43,727 n.a.
Listings in the collection period(a) 116,453 117,140 101,990 n.a.
Number of records submitted(b) 150,018 161,565 163,977 n.a.
Denture care
Offers in the collection period(a) 13,817 9,271 10,809 n.a.
First visits in the collection period(a) 8,933 5,820 7,067 n.a.
Listings in the collection period(a) 18,097 12,762 10,704 n.a.
Number of records submitted(b) 23,386 18,073 18,548 n.a.
(a) These categories are not mutually exclusive.
(b) Number of records does not equal the total of the number of offers, first visits and listings in the collection period due to those categories not being mutually exclusive.
Public dental waiting times This section presents data on the number of days waited in Victoria at the 50th (median) and 90th percentiles from listing date to an offer of care and from listing date to a first visit. Table 3.3.2 presents data for those who were on a general dental care waiting list and Table 3.3.3 presents data for those who were on a denture care waiting list.

A discussion of public dental waiting times information in Australia: 2013–14 to 2016–17 17
Table 3.3.2: Waiting times (days) at the 50th and 90th percentiles for general dental care, Victoria, 2013–14 to 2016–17
2013–14 2014–15 2015–16 2016–17
Wait from listing date to offer of care
50th percentile 151 265 383 n.a.
90th percentile 364 612 672 n.a.
Wait from listing date to first visit
50th percentile 161 252 364 n.a.
90th percentile 420 625 704 n.a.
Table 3.3.3: Waiting times (days) at the 50th and 90th percentiles for denture care, Victoria, 2013–14, 2014–15, 2015–16 and 2016–17
2013–14 2014–15 2015–16 2016–17
Wait from listing date to offer of care
50th percentile 37 165 337 n.a.
90th percentile 638 625 709 n.a.
Wait from listing date to first visit
50th percentile 116 183 366 n.a.
90th percentile 756 677 774 n.a.
3.4 Queensland Offers of care, first dental visits and new listings on waiting lists reported to the PDWT NMDS Table 3.4.1 shows how many offers of care, first visits and new listings (regardless of whether these listings had an offer of care or a first visit in the same collection period) occurred on general dental care and denture care waiting lists during the four collection periods in Queensland.
Note that Queensland uses the waiting list record history and a date-of-offer algorithm to calculate the date of offer as there is not a direct date of offer variable. The first date of an appointment made in a course of care is generally used as the date of offer. Where this is not recorded, the date that the patient was contacted may be used.

18 A discussion of public dental waiting times information in Australia: 2013–14 to 2016–17
Table 3.4.1: Number of offers of care, first dental visits and new listings on waiting lists reported to the PDWT NMDS, Queensland, 2013–14, 2014–15, 2015–16 and 2016–17
2013–14 2014–15 2015–16 2016–17
General dental care
Offers in the collection period(a) 50,941 47,014 59,691 44,523
First visits in the collection period(a) 52,711 45,956 52,592 39,626
Listings in the collection period(a) 85,964 102,444 96,234 92,910
Number of records submitted to PDWT NMDS(b) 127,618 138,520 145,161 137,618
Denture care
Offers in the collection period(a) 14,697 16,544 14,568 15,607
First visits in the collection period(a) 14,183 16,019 13,496 13,922
Listings in the collection period(a) 19,087 18,375 17,772 17,809
Number of records submitted to PDWT NMDS(b) 23,620 24,487 23,531 25,562
(a) These categories are not mutually exclusive.
(b) Number of records does not equal the total of the number of offers, first visits and listings in the collection period due to those categories not being mutually exclusive.
Public dental waiting times This section presents data on the number of days waited in Queensland at the 50th (median) and 90th percentiles from listing date to an offer of care and from listing date to a first visit. Table 3.4.2 presents data for those who were on a general dental care waiting list and Table 3.4.3 presents data for those who were on a denture care waiting list.
Table 3.4.2: Waiting times (days) at the 50th and 90th percentiles for general dental care, Queensland, 2013–14, 2014–15, 2015–16 and 2016–17
2013–14 2014–15 2015–16 2016–17
Wait from listing date to offer of care
50th percentile 444 309 339 445
90th percentile 1,968 502 560 667
Wait from listing date to first visit
50th percentile 585 344 365 434
90th percentile 2,043 536 580 688
A discussion of public dental waiting times information in Australia: 2013–14 to 2016–17 19
Table 3.4.3: Waiting times (days) at the 50th and 90th percentiles for denture care, Queensland, 2013–14, 2014–15, 2015–16 and 2016–17
2013–14 2014–15 2015–16 2016–17
Wait from listing date to offer of care
50th percentile 81 76 78 127
90th percentile 302 330 391 517
Wait from listing date to first visit
50th percentile 102 113 105 156
90th percentile 358 373 411 602
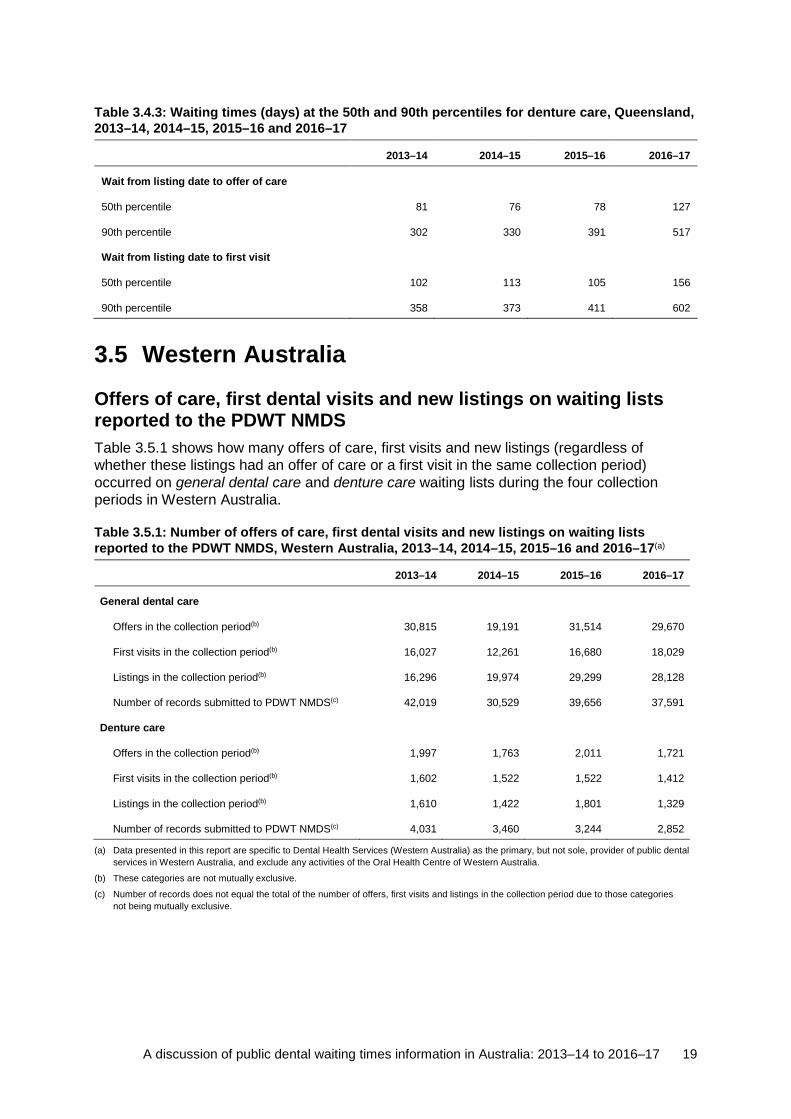
3.5 Western Australia Offers of care, first dental visits and new listings on waiting lists reported to the PDWT NMDS Table 3.5.1 shows how many offers of care, first visits and new listings (regardless of whether these listings had an offer of care or a first visit in the same collection period) occurred on general dental care and denture care waiting lists during the four collection periods in Western Australia.
Table 3.5.1: Number of offers of care, first dental visits and new listings on waiting lists reported to the PDWT NMDS, Western Australia, 2013–14, 2014–15, 2015–16 and 2016–17(a)
2013–14 2014–15 2015–16 2016–17
General dental care
Offers in the collection period(b) 30,815 19,191 31,514 29,670
First visits in the collection period(b) 16,027 12,261 16,680 18,029
Listings in the collection period(b) 16,296 19,974 29,299 28,128
Number of records submitted to PDWT NMDS(c) 42,019 30,529 39,656 37,591
Denture care
Offers in the collection period(b) 1,997 1,763 2,011 1,721
First visits in the collection period(b) 1,602 1,522 1,522 1,412
Listings in the collection period(b) 1,610 1,422 1,801 1,329
Number of records submitted to PDWT NMDS(c) 4,031 3,460 3,244 2,852
(a) Data presented in this report are specific to Dental Health Services (Western Australia) as the primary, but not sole, provider of public dental services in Western Australia, and exclude any activities of the Oral Health Centre of Western Australia.
(b) These categories are not mutually exclusive.
(c) Number of records does not equal the total of the number of offers, first visits and listings in the collection period due to those categories not being mutually exclusive.

20 A discussion of public dental waiting times information in Australia: 2013–14 to 2016–17
Public dental waiting times This section presents data on the number of days waited in Western Australia at the 50th (median) and 90th percentiles from listing date to an offer of care and from listing date to a first visit. Table 3.5.2 presents data for those who were on a general dental care waiting list and Table 3.5.3 presents data for those who were on a denture care waiting list.
Table 3.5.2: Waiting times (days) at the 50th and 90th percentiles for general dental care, Western Australia, 2013–14, 2014–15, 2015–16 and 2016–17(a)(b)
2013–14 2014–15 2015–16 2016–17
Wait from listing date to offer of care
50th percentile 349 98 44 35
90th percentile 663 350 299 187
Wait from listing date to first visit
50th percentile 444 169 87 83
90th percentile 758 435 360 372
(a) Data presented in this report are specific to Dental Health Services (Western Australia) as the primary, but not sole, provider of public dental services in Western Australia, and exclude any activities of the Oral Health Centre of Western Australia.
(b) As the time waited from listing date to first visit is subject to a range of factors, Western Australia considers that the wait from listing date to offer of care is the more salient measure.
Table 3.5.3: Waiting times (days) at the 50th and 90th percentiles for denture care, Western Australia, 2013–14, 2014–15, 2015–16 and 2016–17(a)(b)
2013–14 2014–15 2015–16 2016–17
Wait from listing date to offer of care
50th percentile 498 371 287 339
90th percentile 895 738 627 671
Wait from listing date to first visit
50th percentile 626 435 331 375
90th percentile 983 829 675 742
(a) Data presented in this report are specific to Dental Health Services (Western Australia) as the primary, but not sole, provider of public dental services in Western Australia, and exclude any activities of the Oral Health Centre of Western Australia.
(b) As the time waited from listing date to first visit is subject to a range of factors, Western Australia considers that the wait from listing date to offer of care is the more salient measure.
3.6 South Australia Offers of care, first dental visits and new listings on waiting lists reported to the PDWT NMDS Table 3.6.1 shows how many offers of care, first visits and new listings (regardless of whether these listings had an offer of care or a first visit in the same collection period) occurred on general dental care and denture care waiting lists during the four collection periods in South Australia.

A discussion of public dental waiting times information in Australia: 2013–14 to 2016–17 21
Table 3.6.1: Number of offers of care, first dental visits and new listings on waiting lists reported to the PDWT NMDS, South Australia, 2013–14, 2014–15, 2015–16 and 2016–17
2013–14 2014–15 2015–16 2016–17
General dental care
Offers in the collection period(a) 40,994 23,643 38,626 26,451
First visits in the collection period(a) 20,148 12,315 19,011 13,539
Listings in the collection period(a) 32,177 31,803 32,971 34,015
Number of records submitted to PDWT NMDS(b) 53,561 49,785 68,037 59,095
Denture care
Offers in the collection period(a) 1,975 1,448 2,154 1,715
First visits in the collection period(a) 416 321 261 100(c)
Listings in the collection period(a) 2,403 1,988 1,675 1,032
Number of records submitted to PDWT NMDS(b) 3,484 3,146 3,523 2,643
(a) These categories are not mutually exclusive.
(b) Number of records does not equal the total of the number of offers, first visits and listings in the collection period due to those categories not being mutually exclusive.
(c) No data are reported for ‘First visit’ dates under the Pensioner Denture Scheme in South Australia, and therefore excludes most cases.
Public dental waiting times This section presents data on the number of days waited in South Australia at the 50th (median) and 90th percentiles from listing date to an offer of care and from listing date to a first visit. Table 3.6.2 presents data for those who were on a general dental care waiting list and Table 3.6.3 presents data for those who were on a denture care waiting list.
Table 3.6.2: Waiting times (days) at the 50th and 90th percentiles for general dental care, South Australia, 2013–14, 2014–15, 2015–16 and 2016–17(a)
2013–14 2014–15 2015–16 2016–17
Wait from listing date to offer of care
50th percentile 105 287 359 405
90th percentile 510 506 495 593
Wait from listing date to first visit
50th percentile 139 267 388 430
90th percentile 528 526 539 610
(a) As the time waited from listing date to first visit is subject to a range of factors, South Australia considers that the wait from listing date to offer of care is the more salient measure.

22 A discussion of public dental waiting times information in Australia: 2013–14 to 2016–17
Table 3.6.3: Waiting times (days) at the 50th and 90th percentiles for denture care, South Australia, 2013–14, 2014–15, 2015–16 and 2016–17(a)
2013–14 2014–15 2015–16 2016–17
Wait from listing date to offer of care
50th percentile 120 350 467 583
90th percentile 636 638 629 729
Wait from listing date to first visit(b)
50th percentile 72 56 36 39
90th percentile 397 290 153 223
(a) As the time waited from listing date to first visit is subject to a range of factors, South Australia considers that the wait from listing date to offer of care is the more salient measure.
(b) Caution should be exercised in interpreting these median and 90th percentile results, as these figures exclude all Pensioner Denture Scheme records.
3.7 Tasmania Table 3.7.1 shows how many offers of care, first visits and new listings (regardless of whether these listings had an offer of care or a first visit in the same collection period) occurred on general dental care and denture care waiting lists during the four collection periods in Tasmania.
Offers of care, first dental visits and new listings on waiting lists reported to the PDWT NMDS Table 3.7.1: Number of offers of care, first dental visits and new listings on waiting lists reported to the PDWT NMDS, Tasmania, 2013–14, 2014–15, 2015–16 and 2016–17
2013–14 2014–15 2015–16 2016–17
General dental care
Offers in the collection period(a) 4,878 8,031 7,287 4,527
First visits in the collection period(a) 2,433 4,740 5,923 3,171
Listings in the collection period(a) 5,623 5,282 6,465 6,697
Number of records submitted to PDWT NMDS(b) 10,845 14,086 15,167 12,128
Denture care
Offers in the collection period(a) 1,633 1,776 1,697 1,832
First visits in the collection period(a) 1,360 1,836 2,485 1,524
Listings in the collection period(a) 1,589 1,639 1,632 1,375
Number of records submitted to PDWT NMDS(b) 2,800 3,228 3,683 2,354
(a) These categories are not mutually exclusive.
(b) Number of records does not equal the total of the number of offers, first visits and listings in the collection period due to those categories not being mutually exclusive.

A discussion of public dental waiting times information in Australia: 2013–14 to 2016–17 23
Public dental waiting times This section presents data on the number of days waited in Tasmania at the 50th (median) and 90th percentiles from listing date to an offer of care and from listing date to a first visit. Table 3.7.2 presents data for those who were on a general dental care waiting list and Table 3.7.3 presents data for those who were on a denture care waiting list.
Table 3.7.2: Waiting times (days) at the 50th and 90th percentiles for general dental care, Tasmania, 2013–14, 2014–15, 2015–16 and 2016–17
2013–14 2014–15 2015–16 2016–17
Wait from listing date to offer of care
50th percentile 568 958 680 509
90th percentile 1,009 1,575 1,010 621
Wait from listing date to first visit
50th percentile 645 1,002 916 581
90th percentile 1,147 1,934 2,852 896
Table 3.7.3: Waiting times (days) at the 50th and 90th percentiles for denture care, Tasmania, 2013–14, 2014–15, 2015–16 and 2016–17
2013–14 2014–15 2015–16 2016–17
Wait from listing date to offer of care
50th percentile 266 185 129 102
90th percentile 1,035 452 395 345
Wait from listing date to first visit
50th percentile 357 365 450 173
90th percentile 1,237 2,547 3,840 740
3.8 Australian Capital Territory The Australian Capital Territory did not provide data for 2013–14 and 2014–15 due to data quality and resourcing issues.
Offers of care, first dental visits and new listings on waiting lists reported to the PDWT NMDS Table 3.8.1 shows how many offers of care, first visits and new listings (regardless of whether these listings had an offer of care or a first visit in the same collection period) occurred on general dental care and denture care waiting lists during two collection periods in the Australian Capital Territory.

24 A discussion of public dental waiting times information in Australia: 2013–14 to 2016–17
Table 3.8.1: Number of offers of care, first dental visits and new listings on waiting lists reported to the PDWT NMDS, Australian Capital Territory, 2013–14, 2014–15, 2015–16 and 2016–17
2013–14 2014–15 2015–16 2016–17
General dental care
Offers in the collection period(a)(b) n.a. n.a. 3,867 3,516
First visits in the collection period(a)(b) n.a. n.a. 2,702 3,032
Listings in the collection period(a)(b) n.a. n.a. 3,393 2,783
Number of records submitted to PDWT NMDS(c) n.a. n.a. 5,983 5,120
Denture care
Offers in the collection period(a)(b) n.a. n.a. 70 61
First visits in the collection period(a)(b) n.a. n.a. 48 43
Listings in the collection period(a)(b) n.a. n.a. 100 55
Number of records submitted to PDWT NMDS(c) n.a. n.a. 181 140
(a) In the 2016–17 data, the waiting list type of 1,118 records was not stated and the waiting list type of 7 records was assessment, an invalid waiting list type in the Australian Capital Territory. These records are not included in these rows of the table.
(b) These categories are not mutually exclusive.
(c) Number of records does not equal the total of the number of offers, first visits and listings in the collection period due to those categories not being mutually exclusive.
Public dental waiting times This section presents data on the number of days waited in the Australian Capital Territory at the 50th (median) and 90th percentiles from listing date to an offer of care and from listing date to a first visit. Table 3.8.2 presents data for those who were on a general dental care waiting list and Table 3.8.3 presents data for those who were on a denture care waiting list.
In the 2016–17 data, the waiting list type of 1,118 records was not stated and the waiting list type of 7 records was assessment, an invalid waiting list type in the Australian Capital Territory. These records are not included in these rows of the table.
Table 3.8.2: Waiting times (days) at the 50th and 90th percentiles for general dental care, Australian Capital Territory, 2013–14, 2014–15, 2015–16 and 2016–17
2013–14 2014–15 2015–16 2016–17
Wait from listing date to offer of care
50th percentile n.a. n.a. 160 158
90th percentile n.a. n.a. 173 203
Wait from listing date to first visit
50th percentile n.a. n.a. 195 213
90th percentile n.a. n.a. 1,176 910

A discussion of public dental waiting times information in Australia: 2013–14 to 2016–17 25
Table 3.8.3: Waiting times (days) at the 50th and 90th percentiles for denture care, Australian Capital Territory, 2013–14, 2014–15, 2015–16 and 2016–17
2013–14 2014–15 2015–16 2016–17
Wait from listing date to offer of care
50th percentile n.a. n.a. 141 185
90th percentile n.a. n.a. 164 215
Wait from listing date to first visit
50th percentile n.a. n.a. 867 934
90th percentile n.a. n.a. 2,889 2,786
3.9 Northern Territory The Northern Territory supplied PDWT NMDS data for 2013–14, 2014–15 and 2016–17, but did not approve these data for publication due to data quality issues; in 2015–16, the Northern Territory did not provide data to the PDWT NMDS due to data quality and resourcing issues.

26 A discussion of public dental waiting times information in Australia: 2013–14 to 2016–17
Appendix A: Data quality summary
PDWT NMDS 2013–14 to 2016–17 This appendix contains the data quality statement published on the METeOR website for the 4 years of data presented in this report, 2013–14, 2014–15, 2015–16 and 2016–17 (METeOR identifier: 687687), from data collated under an agreement to report against the PDWT NMDS.
Summary of key issues • Data are not comparable across jurisdictions due to differences in how services are
arranged and different arrangements that determine which people requiring treatment are placed on a public dental waiting list (including how jurisdictions prioritise certain disadvantaged population groups). Therefore, the calculation of an Australian total is not appropriate.
• Data for jurisdictions are comparable across years. • The collection excludes people who are treated under jurisdictional priority client
schemes. • Waiting times could not be calculated for some records; for instance, where a record had
no date of offer or date of first visit. Records that reported dates resulting in negative waiting times were not permitted.
• Records with waiting times of zero days are included for calculations of waiting times from listing date to date of offer but are excluded from waiting times calculations for listing date to date of first visit.
• Data for 2013–14 and 2014–15 do not include New South Wales, the Australian Capital Territory or the Northern Territory. Data for 2015–16 and 2016–17 do not include New South Wales or the Northern Territory. Data for 2016–17 does not include Victoria.
• Western Australian data include only Dental Health Services information, which is the primary, but not sole, provider of public dental services in Western Australia.
Institutional environment The AIHW is a major national agency set up by the Australian Government under the Australian Institute of Health and Welfare Act 1987 to provide reliable, regular and relevant information and statistics on Australia’s health and welfare. It is an independent corporate Commonwealth entity governed by a management board, and accountable to the Australian Parliament through the Health portfolio.
The AIHW aims to improve the health and wellbeing of Australians through better health and welfare information and statistics. It collects and reports information on a wide range of topics and issues, ranging from health and welfare expenditure, hospitals, disease and injury, and mental health, to ageing, homelessness, disability and child protection.
Timeliness The reference periods for these data are 2013–14, 2014–15, 2015–16 and 2016–17.

A discussion of public dental waiting times information in Australia: 2013–14 to 2016–17 27
Accessibility The AIHW will publish data from this collection on the AIHW website.
Interpretability Metadata information for the PDWT NMDS is published in the AIHW’s Metadata Online Registry (METeOR) at the following AIHW web address: <http://meteor.aihw.gov.au/content/index.phtml/itemId/494562>.
Relevance The purpose of the PDWT NMDS is to collect information about the length of time that patients placed on a public dental waiting list wait for public dental care in Australia. The scope of the NMDS is adults who were placed on selected public dental waiting lists who received or were offered public dental care in the reporting period in Australia.
The time between listing date and date of offer, and listing date and date of first visit, for these reporting periods may not reflect current or future waiting times experienced by patients. The availability of clinical resources, demand for services, and client uptake of care are among the variables that will affect these figures throughout routine operations.
An increase in the number of services provided to people on the waiting list (or offers of care), especially to people who have been waiting longer, may increase overall waiting times reflected in this collection. This might occur, for example, as a result of additional clinical resources being made available.
The data collection excludes people who are treated under jurisdictional priority client schemes, and may also exclude some other people who are not placed on a public dental waiting list for any other reason. Therefore, the waiting times reported are not the median waiting times (and waiting times at the 90th percentile) experienced by all people aged 18 or over who received public dental services.
Data are reported by jurisdiction of receipt of dental care, regardless of the jurisdiction of usual residence.
Accuracy For 2013–14 and 2014–15, data are not published for New South Wales, the Australian Capital Territory and the Northern Territory. For 2015–16 and 2016–17, data are not published for New South Wales and the Northern Territory. For 2016–17 data are not published for Victoria.
Data providers are primarily responsible for the quality of the data they provide, although the AIHW has undertaken basic validation of the data. The AIHW does not adjust data to account for possible data errors or missing or incorrect values; however:
• data provided that resulted in a negative waiting time were not permitted • data were excluded from waiting times calculations where a record had no date of offer
or date of first visit, and so a waiting time could not be calculated.
Waiting times of zero days are included in the analysis of listing date to date of offer but are excluded from waiting times calculations for listing date to date of first visit as these are considered to be errors in the data.

28 A discussion of public dental waiting times information in Australia: 2013–14 to 2016–17
Only treatments that result in a person’s being removed from a public dental waiting list are considered to be ‘first visits’.
As two separate waiting periods are described in this indicator (that is, waiting period from listing date to date of offer, and to date of first visit), the waiting periods calculated may not be based on data relating to the same people. For example, where a record does not record the date of first visit (or the date of offer), the person’s waiting time will be used only in calculating one of the measures. Where a person’s date of offer falls in a different reporting period from their date of first visit, the two separate waiting periods will be reported separately in the relevant reporting periods.
Queensland uses the waiting list record history and a date of offer algorithm to calculate the date of offer as there is not a direct date of offer variable. The first date of an appointment made in a course of care is generally used as the date of offer. Where this is not recorded, the date the patient was contacted may be used.
In South Australia, there is a large variation between the number of denture care offers and reported first visits due to no dates being reported for first visit under the Pensioner Denture Scheme in South Australia; that is, most cases are excluded. Therefore, caution is advised in interpreting the 50th and 90th percentile waiting times for denture care.
In Tasmania, people who do not respond to offers of care are ‘suspended’ from the waiting list. If they later present for care, they are restored to the waiting list in their original position and retain all their previous waiting time, rather than starting a new episode of waiting. Often this places the person immediately at the top of the list, and if the resources are available they will be given an appointment. This policy can result in longer times between listing date and date of first visit and/or date of offer. It may particularly influence the 90th percentile figures.
Waiting times reported for denture care in Tasmania do not reflect the totality of clients provided with denture services for Tasmania as people requiring general dental care before having a denture are treated through the general dental care waiting list, after which they start a course of care for a denture. At no point are they added to the denture waiting list.
In some states, Indigenous people are not included in the scope as they are treated as a priority group.
Waiting times data were suppressed where the number of contributing records was fewer than 20, as waiting times are more likely to be volatile where the records numbers are low.
Coherence The year 2013–14 was the first year of collection of national public dental waiting times data under the agreement to collect PDWT NMDS data.
In relation to the ability to compare data over time, and between jurisdictions:
• data for jurisdictions are comparable across years • data are not comparable across jurisdictions due to differences in how services are
arranged and different arrangements that determine which people requiring treatment are placed on a public dental waiting list (including how jurisdictions prioritise certain disadvantaged population groups). Therefore, the calculation of an Australian total is not appropriate
• New South Wales and the Northern Territory did not provide data for publication for any year
• Victoria did not provide data for publication for 2016–17

A discussion of public dental waiting times information in Australia: 2013–14 to 2016–17 29
• Australian Capital Territory data were not provided for 2013–14 or 2014–15 • Western Australian data includes only Dental Health Services information, which is the
primary, but not sole, provider of public dental services in Western Australia.

30 A discussion of public dental waiting times information in Australia: 2013–14 to 2016–17
Appendix B: Performance indicator specification This appendix contains the most recent PI agreed by states and territories and endorsed by the Australian Health Ministers’ Advisory Council for the calculation of PI 13 in the NHA. This is the specification used to generate the 2016–17 data in this report. It is available online at <http://meteor.aihw.gov.au/content/index.phtml/itemId/658509>.
This specification superseded the one used to generate data for the resupplied 2013–14 to 2015–16 data in this report. That specification is available online at <http://meteor.aihw.gov.au/content/index.phtml/itemId/630017>. There are only minor changes (for example, to update years) between the two versions.
National Healthcare Agreement: PI 13–Waiting times for public dentistry, 2018 Identifying and definitional attributes Metadata item type: Indicator
Indicator type: Progress measure
Short name: PI 13–Waiting times for public dentistry, 2018
METeOR identifier: 658509
Registration status: Health, Proposed 01/07/2017
Description: Median (50th percentile) and 90th percentile waiting time between being placed on a public dentistry waiting list and:
(a) being offered dental care; and
(b) receiving dental care.
Indicator set: National Healthcare Agreement (2018) Health, Proposed 01/07/2017
Outcome area: Primary and Community Health Health, Standard 07/07/2010
Quality statement: National Healthcare Agreement: PI 13–Waiting times for public dentistry, 2018 QS No registration status
Collection and usage attributes Computation description: Calculated by subtracting the date placed on a public
dentistry waiting list (public dental listing date) from:
(a) the date dental care was offered (offer of dental caredate);
and
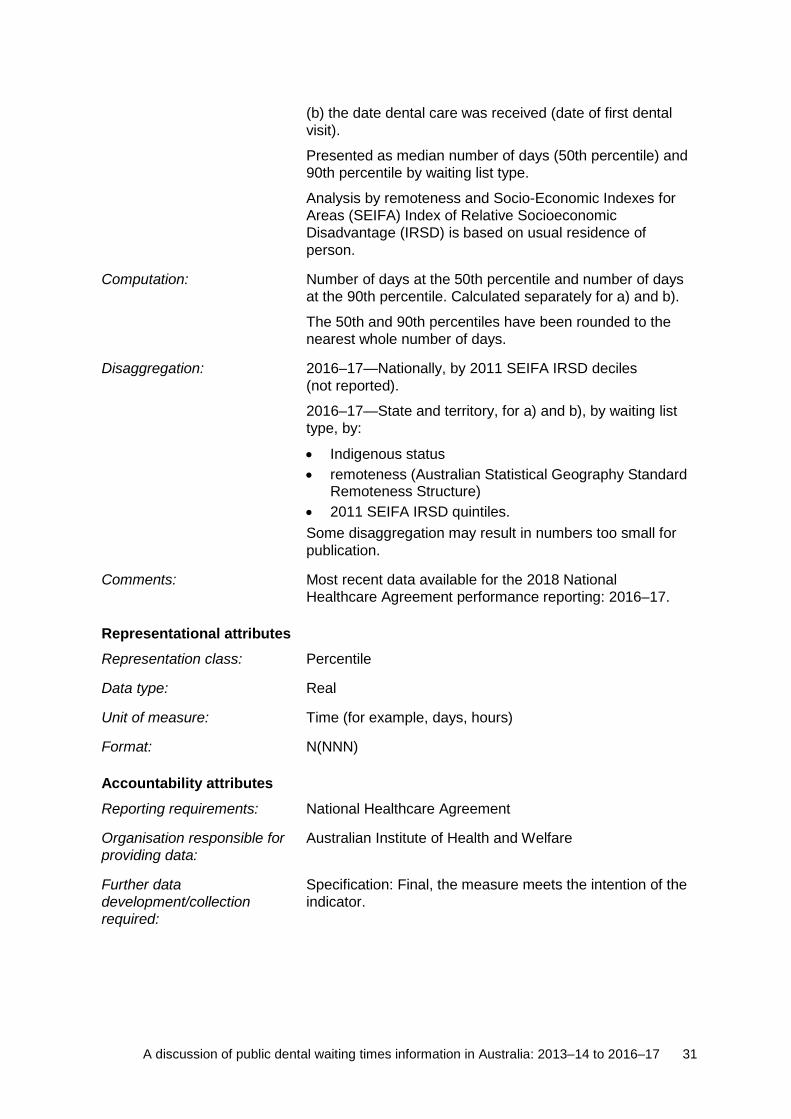
A discussion of public dental waiting times information in Australia: 2013–14 to 2016–17 31
(b) the date dental care was received (date of first dental visit).
Presented as median number of days (50th percentile) and 90th percentile by waiting list type.
Analysis by remoteness and Socio-Economic Indexes for Areas (SEIFA) Index of Relative Socioeconomic Disadvantage (IRSD) is based on usual residence of person.
Computation: Number of days at the 50th percentile and number of days at the 90th percentile. Calculated separately for a) and b).
The 50th and 90th percentiles have been rounded to the nearest whole number of days.
Disaggregation: 2016–17—Nationally, by 2011 SEIFA IRSD deciles (not reported).
2016–17—State and territory, for a) and b), by waiting list type, by:
• Indigenous status • remoteness (Australian Statistical Geography Standard
Remoteness Structure) • 2011 SEIFA IRSD quintiles. Some disaggregation may result in numbers too small for publication.
Comments: Most recent data available for the 2018 National Healthcare Agreement performance reporting: 2016–17.
Representational attributes Representation class: Percentile
Data type: Real
Unit of measure: Time (for example, days, hours)
Format: N(NNN)
Accountability attributes Reporting requirements: National Healthcare Agreement
Organisation responsible for providing data:
Australian Institute of Health and Welfare
Further data development/collection required:
Specification: Final, the measure meets the intention of the indicator.
32 A discussion of public dental waiting times information in Australia: 2013–14 to 2016–17
Appendix C: Supplementary information on waiting list management The information in tables C1, C2 and C3 were provided to the AIHW by the state and territory public dental services.
Table C1: Assessment waiting lists
New South Wales New South Wales does use the assessment waiting list in a comprehensive way, but does not currently submit data to the PDWT NMDS.
Victoria Does not use assessment waiting lists.
Queensland In Queensland, the assessment waiting list is used only for a minority of patients who cannot be allocated to a waiting list using the standard triage questionnaire.
Western Australia Does not use assessment waiting lists.
South Australia Does not use assessment waiting lists.
Tasmania Does not use assessment waiting lists.
Australian Capital Territory
Does not use assessment waiting lists. In the 2016–17 data, the waiting list type of 7 records was assessment, an invalid waiting list type in the Australian Capital Territory. These records are not included in the data reported.
Northern Territory In the Northern Territory, a small number of patients are placed on the assessment waiting list after having waited on another type of waiting list and having not received a first visit. After receiving a first visit, they may then be relisted on another type of waiting list for treatment. Only the Northern Territory has reported data to the PDWT for patients on an assessment list.
Table C2: Management features of state and territory waiting lists
New South Wales New South Wales uses a Priority Oral Health Program (POHP) for access to public dental care and management of public dental waiting lists. The POHP prioritises access to dental assessment and treatment based on medical and dental need, as well as socioeconomic and other risk factors. The POHP triage questionnaire helps services to prioritise patients’ need for clinical assessment according to the urgency of their problem. The Priority Clinical Code allocated determines whether the person receives an appointment at this time or is placed on a waiting list. Details of factors influencing access, and benchmark waiting times, are outlined in the relevant NSW Ministry of Health Policy Directive.
Victoria Clients are placed on the waiting list for specific community dental agencies; a patient can be on the waiting list for only one community agency at a time, although they may transfer without penalty and will retain their original Date Placed on List.
Patients are offered an appointment when their name reaches the top of the specific list they are on.
Patients with no natural teeth are added to the denture care waiting list. Patients with natural teeth are placed on the general dental care waiting list and, once that course of care is complete, are placed on the denture care waiting list with the original date they were placed on the general dental care waiting list.
Queensland If a patient requires non-urgent/routine dental care, they are assigned to the general dental care waiting list. This is a self-referral list, which is the main waiting list for adult patients.
If a patient is identified as a potential priority patient, they are assigned to the Clinical Assessment list. These patients are examined by a dentist who determines their treatment requirements and urgency. Patients may then be assigned to the general dental care list, or prioritised on one of three priority lists, which have recommended waiting times of 1, 3 or 12 months.
For patients who require treatment under general anaesthetic, there are three general anaesthetic lists with corresponding time frames.
Offers of dental care that are not accepted result in the person’s being removed from the waiting list.

A discussion of public dental waiting times information in Australia: 2013–14 to 2016–17 33
Western Australia Pubic dental clinics operate a general dental care waiting list for non-emergency dental care to prioritise patients in date order. Each waiting list entry also has a ‘profile’ field to indicate the treatment needs of each patient. The main profiles used are ‘Exam’ and ‘Edent’ (full denture). Patients initially identified as edentulous are placed on the general dental care waiting list under the ‘Edent’ profile; otherwise, they are usually placed under the ‘Exam’ profile.
Patients are removed from the general dental care waiting list in date order by the public clinics, or are sent a voucher for their (subsidised) treatment to be provided through a registered private dental clinic. Patients may return to their previous position on the general dental care waiting list if they refuse the voucher, or are unable to have their treatment completed by the private dental clinic. This can result in a two-tiered waiting list where the public clinics are unable to keep pace with the removal of voucher patients.
After being removed from the waiting list, ‘Exam’ patients may subsequently be found to need dentures. If these dentures cannot be provided within the time frame of the current course of treatment, the patient can be reinstated on the general dental care waiting list (backdated to their previous date), with a profile indicating the type of dentures required. This can result in a two-tiered waiting time where the denture patients cannot be seen as quickly as ‘Exam’ patients.
The Country Patients Dental Subsidy Scheme waiting list allows registered private dental clinics to waitlist treatment plans for eligible patients at their clinic. Patients are removed in date order once public funds are made available to pay for the planned treatment items.
In all of the cases described here, the patient is removed from the waiting list and advised to make an appointment (offered care).
South Australia The urgency of the patient’s need for dental care is identified using the Relative Needs Index computerised triage system tool. If the patient requires emergency care, they are not part of the waiting list system.
For general dental care, clients are removed from waiting lists in chronological order.
For denture care waiting lists, there is a prioritisation based on clinical criteria and case complexity as denture lists are then categorised into Priority and Routine. Within these two classifications, clients wait in chronological order, but the Priority denture waiting time is usually only a few months, compared with the routine waiting time which currently is about 18 months.
Tasmania Oral Health Services Tasmania processes preclude multiple waiting list episodes for one course of treatment. Clients are put on either the general dental care waiting list or the denture care waiting list depending on their identified need, and proceed through to completion from that one episode of listing. For example, clients requiring a denture who need general care first to make them dentally fit are put on the general dental care waiting list; once given a course of general care, they proceed straight to prosthetic services. They are not listed again on the prosthetic waiting list.
General care clients are listed and offered care in order of listing date. Clients who do not respond to an offer of care are suspended from the waiting list. If they later present for care, they are restored to the waiting list in their original position, retaining all their previous waiting time, instead of starting a new episode of waiting. Often this places the client immediately at the top of the list, and if the resources are available they will be given an appointment.
Clients with a denture that needs repair or replacement are put on the denture care waiting list. They are prioritised after an assessment by a prosthetist and offered denture services according to their priority.
Australian Capital Territory
n.a.

34 A discussion of public dental waiting times information in Australia: 2013–14 to 2016–17
Northern Territory The Northern Territory uses public dental waiting lists for general dental care and denture care services in the urban area of Darwin. Remote, children’s and identified priority group dental services are not waitlisted.
If a patient requires non-urgent/routine dental care, they are assigned to the general dental care waiting list after assessment by a clinician. An assessment list operates in the Darwin region. The selection of patients from the waiting list is prioritised according to, firstly, clinical need (as reflected by an assigned priority category) and, secondly, the date assigned. Where patients do not respond after multiple contact attempts, they are removed from the waiting list but may be reinstated to their original date of listing if they present for care at a later stage. Patients may continue to access non-waitlisted acute services as required while waiting for general dental care or denture care services. As patients access acute services, their treatment needs may change. This may be reflected in elevated prioritisation on the general dental care waiting list if clinical needs increase, or removal from the waiting list if treatment needs have been met via acute care pathways.
Patients may be placed on the denture care waiting list following assessment by a clinician or referral following general or acute treatment, or by self-referral. Generally, patients should be dentally fit before being placed on the denture care waiting list. Denture services are prioritised based on clinical need and date listed. High-priority and immediate denture services, including denture repairs, are not waitlisted.
Table C3: Management of recall patients by state and territory
New South Wales A separate waiting list for recall patients is managed.
Victoria Patients can be on either a waiting list, or a recall list.
Queensland The general dental care waiting list is used for recall/follow-up care, as well as for initial treatment.
If patients have not received general treatment in the previous 12 months (or at all), they are identified as ‘New’ when allocated to the general dental care waiting list.
If patients have recently (that is, within the previous 12 months) received general dental care treatment, they are identified as ‘Returning’ when reallocated to the general dental care waiting list.
This system allows clinics to manage new and returning (recall) patients separately but ensures that total demand for general dental care is reported.
Western Australia All related care is captured in the patient’s course of care. On completion of a course of care, patients are placed onto a separate recall waiting list system to remind them to come back for a check-up every 12–18 months (depending on clinical need).
South Australia A small proportion (approximately 5%–10%) of adults are assessed at the end of a general course of dental care, using standardised high risk/medical criteria, and are offered a 12-month recall reminder. Indigenous patients and clients of supported resident facilities completing a general course of care are also offered a 12-month recall reminder. When the appropriate future month approaches, patients are mailed or contacted to offer a subsequent appointment for a recall examination—without the need to be placed on any waiting list.
The Recall system lists are kept separate from waiting lists.
The School Dental Service recalls the majority of patients aged under 18. These patients are also out of scope for the PDWT NMDS.
Tasmania There is no recall process for adult patients who have received a course of care previously. All adult patients contacting the service are triaged and the course of action taken will be in accordance with their triage outcome.
Australian Capital Territory
n.a.
Northern Territory In urban areas of Darwin and Alice Springs, a separate recall list is kept for patients after completion of waitlisted treatment, based on referral by a clinician following a general course of treatment where patient-specific recall needs are identified. Not all patients are automatically placed on recall lists. The recall frequency is determined according to clinical need. Patients may continue to access acute care outside of the specified recall frequency as required. Both adult and children’s recall lists are used.

A discussion of public dental waiting times information in Australia: 2013–14 to 2016–17 35
Glossary assessment: A consultation and examination to determine current oral health status and future treatment or treatment needs.
denture care: Provision of full or partial dentures or other dental prosthetic devices for the full or partial restoration and/or maintenance of oral health, function and appearance.
general dental care: Any examination and treatment relating to natural teeth and soft tissue resulting in a person being dentally fit, excluding specialist services and denture treatment.
remoteness classification: Each state and territory is divided into several regions based on their relative accessibility to goods and services (such as general practitioners, hospitals and specialist care) as measured by road distance. These regions are based on the Accessibility/Remoteness Index of Australia (ARIA+) and defined as Remoteness Areas by the Australian Statistical Geographical Standard (ASGS) in each Census year. The five Remoteness Areas are Major cities, Inner regional, Outer regional, Remote and Very remote.
Socio-Economic Indexes for Areas (SEIFA): A set of indexes, derived using Census data that aim to represent the socioeconomic position of Australian communities and identify areas of disadvantage of the population of an area; it does not show how individuals living in the same area differ from each other in their socioeconomic group. This report uses the Index of Relative Socio-Economic Disadvantage.

36 A discussion of public dental waiting times information in Australia: 2013–14 to 2016–17
References COAG (Council of Australian Governments) Health Council 2015. Healthy mouths, healthy lives: Australia’s National Oral Health Plan 2015–2024. Adelaide: South Australian Dental Service. Viewed 2 February 2017, <http://www.coaghealthcouncil.gov.au/Portals/0/Australia%27s%20National %20Oral%20Health%20Plan%202015-2024_uploaded%20170216.pdf>. DoH (Department of Health) 2017a. Guide to the Child Dental Benefits Schedule. Canberra: Department of Health. Viewed 16 October 2017, <http://www.health.gov.au/internet/main/publishing.nsf/content/42FC28F2797C4A10CA257BF0001A35F6/$File/Guide%20to%20the%20Child%20Dental%20Benefits%20Schedule.pdf>.
DoH 2017b. National partnership agreements (NPAs) on public dental services. Canberra: Department of Health. Viewed 30 August 2017, <http://webarchive.nla.gov.au/gov /20160105152044/http://www.health.gov.au/internet/main/publishing.nsf/content/dentalnpa>.
Lalloo R & Kroon J 2016. Impact of dental National Partnership Agreements on public dental service waiting lists in Queensland. Australian and New Zealand Journal of Public Health 41:199–203.
PC (Productivity Commission) 2017. Introducing competition and informed user choice into human services: reforms to human services. Draft report. Canberra: Productivity Commission.
SCRGSP (Steering Committee for the Review of Government Service Provision) 2016. Report on Government Services 2016. Canberra: Productivity Commission. Viewed 14 August 2017, <http://www.pc.gov.au/research/ongoing/report-on-government-services>.
SCRGSP 2017. Report on Government Services 2017. Canberra: Productivity Commission. Viewed 14 August 2017, <http://www.pc.gov.au/research/ongoing/report-on-government-services>.
SCRGSP 2018. Report on Government Services 2018. Canberra: Productivity Commission. Viewed 30 January 2018, <http://www.pc.gov.au/research/ongoing/report-on-government-services>.

A discussion of public dental waiting times information in Australia: 2013–14 to 2016–17 37
List of tables Table 1.1: PDWT NMDS data elements .................................................................................... 5
Table 2.1: Programs for priority groups and target populations................................................. 9
Table 3.1: Number of records reported to the PDWT NMDS, Australia, 2013–14 to 2016–17 .................................................................................................................. 15
Table 3.3.1: Number of offers of care, first dental visits and new listings on waiting lists reported to the PDWT NMDS, Victoria, 2013–14 to 2016–17 ................................ 16
Table 3.3.2: Waiting times (days) at the 50th and 90th percentiles for general dental care, Victoria, 2013–14 to 2016–17 ................................................................................. 17
Table 3.3.3: Waiting times (days) at the 50th and 90th percentiles for denture care, Victoria, 2013–14, 2014–15, 2015–16 and 2016–17 ............................................................ 17
Table 3.4.1: Number of offers of care, first dental visits and new listings on waiting lists reported to the PDWT NMDS, Queensland, 2013–14, 2014–15, 2015–16 and 2016–17 .................................................................................................................. 18
Table 3.4.2: Waiting times (days) at the 50th and 90th percentiles for general dental care, Queensland, 2013–14, 2014–15, 2015–16 and 2016–17 ...................................... 18
Table 3.4.3: Waiting times (days) at the 50th and 90th percentiles for denture care, Queensland, 2013–14, 2014–15, 2015–16 and 2016–17 ...................................... 19
Table 3.5.1: Number of offers of care, first dental visits and new listings on waiting lists reported to the PDWT NMDS, Western Australia, 2013–14, 2014–15, 2015–16 and 2016–17 ........................................................................................................... 19
Table 3.5.2: Waiting times (days) at the 50th and 90th percentiles for general dental care, Western Australia, 2013–14, 2014–15, 2015–16 and 2016–17 ............................. 20
Table 3.5.3: Waiting times (days) at the 50th and 90th percentiles for denture care, Western Australia, 2013–14, 2014–15, 2015–16 and 2016–17 ............................. 20
Table 3.6.1: Number of offers of care, first dental visits and new listings on waiting lists reported to the PDWT NMDS, South Australia, 2013–14, 2014–15, 2015–16 and 2016–17 ........................................................................................................... 21
Table 3.6.2: Waiting times (days) at the 50th and 90th percentiles for general dental care, South Australia, 2013–14, 2014–15, 2015–16 and 2016–17 ................................. 21
Table 3.6.3: Waiting times (days) at the 50th and 90th percentiles for denture care, South Australia, 2013–14, 2014–15, 2015–16 and 2016–17 ................................. 22
Table 3.7.1: Number of offers of care, first dental visits and new listings on waiting lists reported to the PDWT NMDS, Tasmania, 2013–14, 2014–15, 2015–16 and 2016–17 .................................................................................................................. 22
Table 3.7.2: Waiting times (days) at the 50th and 90th percentiles for general dental care, Tasmania, 2013–14, 2014–15, 2015–16 and 2016–17 .......................................... 23
Table 3.7.3: Waiting times (days) at the 50th and 90th percentiles for denture care, Tasmania, 2013–14, 2014–15, 2015–16 and 2016–17 .......................................... 23
Table 3.8.1: Number of offers of care, first dental visits and new listings on waiting lists reported to the PDWT NMDS, Australian Capital Territory, 2013–14, 2014–15, 2015–16 and 2016–17 ............................................................................................ 24
Table 3.8.2: Waiting times (days) at the 50th and 90th percentiles for general dental care, Australian Capital Territory, 2013–14, 2014–15, 2015–16 and 2016–17 ............... 24

38 A discussion of public dental waiting times information in Australia: 2013–14 to 2016–17
Table 3.8.3: Waiting times (days) at the 50th and 90th percentiles for denture care, Australian Capital Territory, 2013–14, 2014–15, 2015–16 and 2016–17 ............... 25
Table C1: Assessment waiting lists ......................................................................................... 32
Table C2: Management features of state and territory waiting lists ........................................ 32
Table C3: Management of recall patients by state and territory .............................................. 34
List of boxes Box 1.1: Scope statement for the PDWT NMDS .................................................................... 3
Box 1.2: Calculating waiting times .......................................................................................... 7

Stronger evidence,better decisions,improved health and welfare
Stronger evidence, better decisions, improved health and welfare
This report presents data at a state and territory level for the first 4 years (2013–14 to 2016–17) of the Public Dental Waiting Times National Minimum Data Set. This data set covers adults who were placed on the main public dental waiting lists used in Australia, to enable monitoring of in-scope waiting times. No national-level data are presented due to concerns about data comparability. This report examines factors that contribute to this lack of comparability, ahead of a planned redevelopment of the data set.
aihw.gov.au
A discussion of public dental waiting times information in Australia 2013–14 to 2016–17