Embed Size (px)
Citation preview

A Developer Centered Bug Prediction ModelDario Di Nucci1, Fabio Palomba1, Giuseppe De Rosa1
Gabriele Bavota2, Rocco Oliveto3, Andrea De Lucia1
1University of Salerno, Fisciano (SA), Italy, 2Universita della Svizzera italiana (USI), Switzerland,3University of Molise, Pesche (IS), Italy
[email protected], [email protected], [email protected]@usi.ch, [email protected], [email protected]
Abstract—Several techniques have been proposed to accurately predict software defects. These techniques generally exploitcharacteristics of the code artefacts (e.g., size, complexity, etc.) and/or of the process adopted during their development andmaintenance (e.g., the number of developers working on a component) to spot out components likely containing bugs. While these bugprediction models achieve good levels of accuracy, they mostly ignore the major role played by human-related factors in the introductionof bugs. Previous studies have demonstrated that focused developers are less prone to introduce defects than non-focused developers.According to this observation, software components changed by focused developers should also be less error prone than componentschanged by less focused developers. We capture this observation by measuring the scattering of changes performed by developersworking on a component and use this information to build a bug prediction model. Such a model has been evaluated on 26 systemsand compared with four competitive techniques. The achieved results show the superiority of our model, and its high complementaritywith respect to predictors commonly used in the literature. Based on this result, we also show the results of a “hybrid” prediction modelcombining our predictors with the existing ones.
Index Terms—Scattering Metrics, Bug Prediction, Empirical Study, Mining Software Repositories
F
1 INTRODUCTION
Bug prediction techniques are used to identify areas ofsoftware systems that are more likely to contain bugs.These prediction models represent an important aidwhen the resources available for testing are scarce, sincethey can indicate where to invest such resources. The sci-entific community has developed several bug predictionmodels that can be roughly classified into two families,based on the information they exploit to discriminatebetween “buggy” and “clean” code components. Thefirst set of techniques exploits product metrics (i.e., metricscapturing intrinsic characteristics of the code compo-nents, like their size and complexity) [1], [2], [3], [4],[5], while the second one focuses on process metrics (i.e.,metrics capturing specific aspects of the developmentprocess, like the frequency of changes performed to codecomponents) [6], [7], [8], [9], [10], [11], [12]. While somestudies highlighted the superiority of these latter withrespect to the product metric based techniques [7], [13],[11] there is a general consensus on the fact that notechnique is the best in all contexts [14], [15]. For thisreason, the research community is still spending effortin investigating under which circumstances and duringwhich coding activities developers tend to introducebugs (see e.g., [16], [17], [18], [19], [20], [21], [22]).
Some of these studies have highlighted the central roleplayed by developer-related factors in the introductionof bugs.
In particular, Eyolfson et al. [17] showed that moreexperienced developers tend to introduce less faultsin software systems. Rahman and Devanbu [18] partlycontradicted the study by Eyolfson et al. by showing thatthe experience of a developer has no clear link with thebug introduction. Bird et al. [20] found that high levelsof ownership are associated with fewer bugs. Finally,Posnett et al. [22] showed that focused developers (i.e.,developers focusing their attention on a specific partof the system) introduce fewer bugs than unfocuseddevelopers.
Although such studies showed the potential ofhuman-related factors in bug prediction, this informationis not captured in state-of-the-art bug prediction modelsbased on process metrics extracted from version history.Indeed, previous bug prediction models exploit predic-tors based on (i) the number of developers working ona code component [9] [10]; (ii) the analysis of change-proneness [13] [11] [12]; and (iii) the entropy of changes[8]. Thus, despite the previously discussed finding byPosnett et al. [22], none of the proposed bug predictionmodels considers how focused the developers perform-ing changes are and how scattered these changes are.In our previous work [23] we studied the role playedby scattered changes in bug prediction. We defined twomeasures, namely the developer’s structural and semanticscattering. The first assesses how “structurally far” inthe software project the code components modified by adeveloper in a given time period are.
1

2
The “structural distance” between two code compo-nents is measured as the number of subsystems oneneeds to cross in order to reach one component fromthe other.
The second measure (i.e., the semantic scattering) isinstead meant to capture how much spread in termsof implemented responsibilities the code componentsmodified by a developer in a given time period are.The conjecture behind the proposed metrics is that highlevels of structural and semantic scattering make the de-veloper more error-prone. To verify this conjecture, webuilt two predictors exploiting the proposed measures,and we used them in a bug prediction model. Theresults achieved on five software systems showed thesuperiority of our model with respect to (i) the BasicCode Change Model (BCCM) built using the entropyof changes [8] and (ii) a model using the number ofdevelopers working on a code component as predictor[9] [10]. Most importantly, the two scattering measuresshowed a high degree of complementarity with themeasures exploited by the baseline prediction models.
In this paper, we extend our previous work [23] tofurther investigate the role played by scattered changesin bug prediction. In particular we:
1) Extend the empirical evaluation of our bug predic-tion model by considering a set of 26 systems.
2) Compare our model with two additional compet-itive approaches, i.e., a prediction model basedon the focus metrics proposed by Posnett et al.[22] and a prediction model based on structuralcode metrics [24], that together with the previouslyconsidered models, i.e., the BCCM proposed byHassan [8] and the one proposed by Ostrand et al.[9] [10], lead to a total of four different baselinesconsidered in our study.
3) Devise and discuss the results of a hybrid bugprediction model, based on the best combination ofpredictors exploited by the five prediction modelsexperimented in the paper.
4) Provide a comprehensive replication package [25]including all the raw data and working data setsof our studies.
The achieved results confirm the superiority of ourmodel, achieving a F-Measure 10.3% higher, on average,than the change entropy model [8], 53.7% higher, onaverage, with respect to what achieved by exploiting thenumber of developers working on a code componentas predictor [9], 13.3% higher, on average, than the F-Measure obtained by using the developers’ focus metricby Posnett et al. [22] as predictor, and 29.3% higher, onaverage, with respect to the prediction model built ontop of product metrics [1]. The two scattering measuresconfirmed their complementarity with the metrics usedby the alternative prediction models. Thus, we devised a“hybrid” model providing an average boost in predictionaccuracy (i.e., F-Measure) of +5% with respect to the bestperforming model (i.e., the one proposed in this paper).
Structure of the paper. Section 2 discusses the related lit-erature, while Section 3 presents the proposed scatteringmeasures. Section 4 presents the design of our empiricalstudy and provides details about the data extraction pro-cess and analysis method. Section 5 reports the results ofthe study, while Section 6 discusses the threats that couldaffect their validity. Section 7 concludes the paper.
2 RELATED WORK
Many bug prediction techniques have been proposedin the literature in the last decade. Such techniquesmainly differ for the specific predictors they use, and canroughly be classified in those exploiting product metrics(e.g., lines of code, code complexity, etc), those relyingon process metrics (e.g., change- and fault-proneness ofcode components), and those exploiting a mix of the two.Table 1 summarizes the related literature, by groupingthe proposed techniques on the basis of the metrics theyexploit as predictors.
The Chidamber and Kemerer (CK) metrics [36] havebeen widely used in the context of bug prediction. Basiliet al. [1] investigated the usefulness of the CK suitefor predicting the probability of detecting faulty classes.They showed that five of the experimented metrics areactually useful in characterizing the bug-proneness ofclasses. The same set of metrics has been successfullyexploited in the context of bug prediction by El Emam etal. [26] and Subramanyam et al. [27]. Both works reportedthe ability of the CK metrics in predicting buggy codecomponents, regardless of the size of the system underanalysis.
Still in terms of product metrics, Nikora et al. [28]showed that measuring the evolution of structural at-tributes (e.g., number of executable statements, numberof nodes in the control flow graph, etc.) it is possible topredict the number of bugs introduced during the sys-tem development. Later, Gyimothy et al. [2] performeda new investigation on the relationship between CKmetrics and bug proneness. Their results showed that theCoupling Between Object metric is the best in predictingthe bug-proneness of classes, while other CK metrics areuntrustworthy.
Ohlsson et al. [3] focused the attention on the useof design metrics to identify bug-prone modules. Theyperformed a study on an Ericsson industrial systemshowing that at least four different design metrics can beused with equivalent results. The metrics performanceare not statistically worse than those achieved usinga model based on the project size. Zhou et al. [29]confirmed their results showing that size-based modelsseem to perform as well as those based on CK metricsexcept than the Weighted Method per Class on somereleases of the Eclipse system. Thus, although Bell etal. [35] showed that more complex metric-based modelshave more predictive power with respect to size-basedmodels, the latter seem to be generally useful for bugprediction.

3
TABLE 1Prediction models proposed in literature
Type of Information Exploited Prediction Model Predictors
Product metrics
Basili et al. [1] CK metricsEl Emam et al. [26] CK metricsSubramanyam et al. [27] CK metricsNikora et al. [28] CFG metricsGyimothy et al. [2] CK metrics, LOCOhlsson et al. [3] CFG metrics, complexity metrics, LOCZhou et al. [29] CK metrics, OO metrics, complexity metrics, LOCNagappan et al. [14] CK metrics, CFG metrics, complexity metrics
Process metrics
Khoshgoftaar et al. [6] debug churnNagappan et al. [30] relative code churnHassan and Holt [31] entropy of changesHassan and Holt [32] entropy of changesKim et al. [33] previous fault locationHassan [8] entropy of changesOstrand et al. [10] number of developersNagappan et al. [34] consecutive changesBird et al. [20] social network analysis on developers’ activitiesOstrand et al. [9] number of developersPosnett et al. [22] module activity focus, developer attention focus
Product and process metrics
Graves et al. [7] various code and change metricsNagappan and Ball [4] LOC, past defectsBell et al. [35] LOC, age of files, number of changes, program typeZimmerman et al. [5] complexity metrics, CFG metrics, past defectsMoser et al. [13] various code and change metricsMoser et al. [11] various code and change metricsBell et al. [12] various code and change metricsD’Ambros et al. [15] various code and change metrics
Nagappan and Ball [4] exploited two static analysistools to early predict the pre-release bug density. Theresults of their study, conducted on the Windows Serversystem, show that it is possible to perform a coarsegrained classification between high and low qualitycomponents with a high level of accuracy. Nagappan etal. [14] analyzed several complexity measures on fiveMicrosoft software systems, showing that there is noevidence that a single set of measures can act universallyas bug predictor. They also showed how to methodicallybuild regression models based on similar projects inorder to achieve better results. Complexity metrics in thecontext of bug prediction are also the focus of the workby Zimmerman et al. [5]. Their study reports a positivecorrelation between code complexity and bugs.
Differently from the previous discussed techniques,other approaches try to predict bugs by exploiting pro-cess metrics. Khoshgoftaar et al. [6] analyzed the contri-bution of debug churns (defined as the number of linesof code added or changed to fix bugs) to a model basedon product metrics in the identification of bug-pronemodules. Their study, conducted on two subsequentreleases of a large legacy system, shows that modulesexceeding a defined threshold of debug churns are oftenbug-prone. The reported results show a misclassificationrate of just 21%.
Nagappan et al. [30] proposed a technique for earlybug prediction based on the use of relative code churnmeasures. These metrics relate the number of churns toother factors such as LOC or file count. An experimentperformed on the Windows Server system showed thatrelative churns are better than absolute value.
Hassan and Holt [31] conjectured that a chaotic devel-opment process has bad effects on source code qualityand introduced the concept of entropy of changes. Laterthey also presented the top-10 list [32], a methodologyto highlight to managers the top ten subsystems morelikely to present bugs. The set of heuristics behind theirapproach includes a number of process metrics, such asconsidering the most recently modified, the most frequentlymodified, the most recently fixed and the most frequentlyfixed subsystems.
Bell et al. [12] pointed out that although code churnsare very effective bug predictors, they cannot improve asimpler model based on the code components’ change-proneness. Kim et al. [33] presumed that faults do notoccur in isolation but in burst of related faults. Theyproposed the bug cache algorithm that predicts futurefaults considering the location of previous faults. Simi-larly, Nagappan et al. [34] defined change burst as a setof consecutive changes over a period of time and proposednew metrics based on change burst. The evaluation ofthe prediction capabilities of the models was performedon Windows Vista, achieving high accuracy.
Graves et al. [7] experimented both product and pro-cess metrics for bug prediction. They observed thathistory-based metrics are more powerful than productmetrics (i.e., change-proneness is a better indicator thanLOC). Their best results were achieved using a combi-nation of module’s age and number of changes, whilecombining product metrics had no positive effect onthe bug prediction. They also saw no benefits providedby the inclusion of a metric based on the number ofdevelopers modifying a code component.

4
Moser et al. [13] performed a comparative studybetween product-based and process-based predictors.Their study, performed on Eclipse, highlights the su-periority of process metrics in predicting buggy codecomponents. Later, they performed a deeper study [11]on the bug prediction accuracy of process metrics, re-porting that the past number of bug-fixes performed on a file(i.e., bug-proneness), the maximum changeset size occurredin a given period, and the number of changes involvinga file in a given period (i.e., change-proneness) are theprocess metrics ensuring the best performances in bugprediction.
D’Ambros et al. [15] performed an extensive compari-son of bug prediction approaches relying on process andproduct metrics, showing that no technique based on asingle metric works better in all contexts.
Hassan [8] analyzed the complexity of the develop-ment process. In particular he defined the entropy ofchanges as the scattering of code changes across time.He proposed three bug prediction models, namely BasicCode Change Model (BCCM), Extended Code ChangeModel (ECCM), and File Code Change Model (FCCM).These models mainly differ for the choice of the temporalinterval where the bug proneness of components isstudied. The reported study indicates that the proposedtechniques have a stronger prediction capability thana model purely based on the amount of changes ap-plied to code components or on the number of priorfaults. Differently from our work, all these predictors donot consider the number of developers who performedchanges to a component, neither how many componentsthey changed at the same time.
Ostrand et al. [9], [10] proposed the use of the numberof developers who modified a code component in a give time pe-riod as a bug predictor. Their results show that combiningdevelopers’ information poorly, but positively, impactthe detection accuracy of a prediction model. Our workdoes not use a simple count information of developerswho worked on a file, but also takes in consideration thechange activities they carry out.
Bird et al. [20] investigated the relationship betweendifferent ownership measures and pre- and post-releasesfailures. Specifically, they analyzed the developers’ con-tribution network by means of social network analysismetrics, finding that developers having low levels ofownership tend to increase the likelihood of introducingdefects. Our scattering metrics are not based on codeownership, but on the “distance” between the codecomponents modified by a developer in a given timeperiod.
Posnett et al. [22] investigated factors related to the onewe aim at capturing in this paper, i.e., the developer’sscattering. In particular, the “focus” metrics presented byPosnett et al. [22] are based on the idea that a developerperforming most of her activities on a single module (amodule could be a method, a class, etc.) has a higherfocus on the activities she is performing and is less likelyto introduce bugs.
Fig. 1. Example of two developers having different levelsof “scattering”
Jan 2015
Feb 2015
it.gui.login
it.gui.logoutit.db.insertPayslip
it.gui.logoutit.gui.addUserit.gui.confirmRegistration it.gui.logout
it.whouse.showStocksit.db.deleteUserAccount
Following this conjecture, they defined two symmetricmetrics, namely the Module Activity Focus metric (shortly,MAF), and the Developer Attention Focus metric (shortly,DAF) [22]. The former is a metric which captures towhat extent a module receives focused attention bydevelopers. The latter measures how focused are theactivities of a specific developer. As it will be clearerlater, our scattering measures not only take into accountthe frequency of changes made by developers over thedifferent system’s modules, but also considers the “dis-tance” between the modified modules. This means that,for example, the contribution of a developer working ona high number of files all closely related to a specificresponsibility might not be as much “scattered” as thecontribution of a developer working on few unrelatedfiles.
3 COMPUTING DEVELOPER’S SCATTERINGCHANGES
We conjecture that the developer’s effort in performingmaintenance and evolution tasks is proportional to thenumber of involved components and their spread acrossdifferent subsystems. In other words, we believe thata developer working on different components scattersher attention due to continuous changes of context. Thismight lead to an increase of the developer’s “scattering”with a consequent higher chance of introducing bugs.
To get a better idea of our conjecture, consider thesituation depicted in Figure 1, where two developers,d1 (black point) and d2 (grey point) are working on thesame system, during the same time period, but on dif-ferent code components. The tasks performed by d1 arevery focused on a specific part of the system (she mainlyworks on the system’s GUI) and on a very targeted topic(she is mainly in charge of working on GUIs related tothe users’ registration and login features). On the con-trary, d2 performs tasks scattered across different partsof the system (from GUIs to database management) andon different topics (users’ accounts, payslips, warehousestocks).
Our conjecture is that during the time period shown inFigure 1, the contribution of d2 might have been more“scattered” than the contribution of d1, thus having ahigher likelihood of introducing bugs in the system.
5
To verify our conjecture we define two measures,named the structural and the semantic scattering mea-sures, aimed at assessing the scattering of a developerd in a given time period p. Note that both measuresare meant to work in object oriented systems at theclass level granularity. In other words, we measure howscattered are the changes performed by developer dduring the time period p across the different classesof the system. However, our measures can be easilyadapted to work at other granularity levels.
3.1 Structural scatteringLet CHd,p be the set of classes changed by a developer dduring a time period p. We define the structural scatteringmeasure as:
StrScatd,p = |CHd,p| × average∀ci,cj∈CHd,p
[dist(ci, cj)] (1)
where dist is the number of packages to traverse inorder to go from class ci to class cj ; dist is com-puted by applying the shortest path algorithm onthe graph representing the system’s package struc-ture. For example, the dist between two classesit.user.gui.c1 and it.user.business.db.c2 isthree, since in order to reach c1 from c2 we need to tra-verse it.user.business.db, it.user.business,and it.user.gui. We (i) use the average operator fornormalizing the distances between the code componentsmodified by the developer during the time period pand (ii) assign a higher scattering to developers workingon a higher number of code components in the giventime period (see |CHd,p|). Note the the choice to usethe average to normalize the distances is driven by thefact that other central operators, such as the median,are not affected by the outliers. Indeed, suppose that adeveloper performs a change (i.e., commit) C, modifyingfour files F1, F2, F3, and F4. The first three files are in thesame package, while the fourth one (F4) is in a differentsubsystem. When computing the structural scattering forC, the median would not reflect the scattering of thechange performed on F4, since half of the six pairs of filesinvolved in the change (and in particular, F1-F2, F1-F3,F2-F3) have zero as structural distance (i.e., they are inthe same package). Thus, the median would not capturethe fact that C was, at least in part, a scattered change.This is instead captured by the mean that is influencedby outliers.
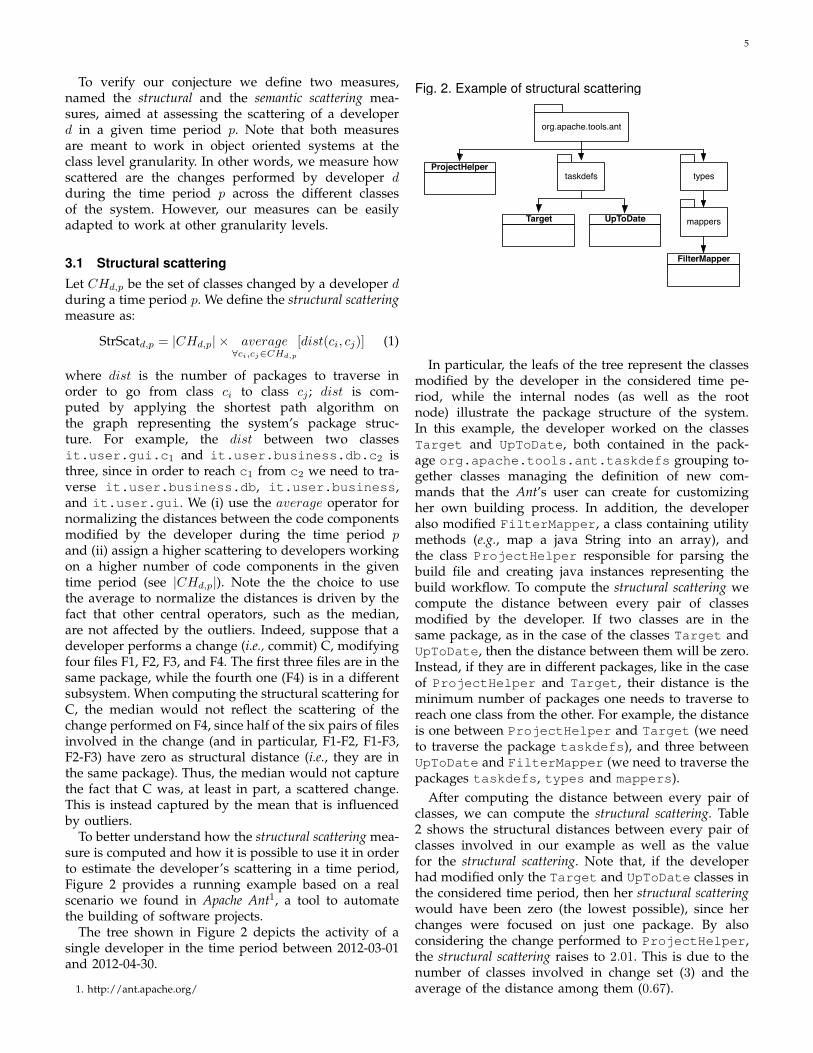
To better understand how the structural scattering mea-sure is computed and how it is possible to use it in orderto estimate the developer’s scattering in a time period,Figure 2 provides a running example based on a realscenario we found in Apache Ant1, a tool to automatethe building of software projects.
The tree shown in Figure 2 depicts the activity of asingle developer in the time period between 2012-03-01and 2012-04-30.
1. http://ant.apache.org/
Fig. 2. Example of structural scattering
org.apache.tools.ant
Target UpToDate
taskdefsProjectHelper
types
FilterMapper
mappers
In particular, the leafs of the tree represent the classesmodified by the developer in the considered time pe-riod, while the internal nodes (as well as the rootnode) illustrate the package structure of the system.In this example, the developer worked on the classesTarget and UpToDate, both contained in the pack-age org.apache.tools.ant.taskdefs grouping to-gether classes managing the definition of new com-mands that the Ant’s user can create for customizingher own building process. In addition, the developeralso modified FilterMapper, a class containing utilitymethods (e.g., map a java String into an array), andthe class ProjectHelper responsible for parsing thebuild file and creating java instances representing thebuild workflow. To compute the structural scattering wecompute the distance between every pair of classesmodified by the developer. If two classes are in thesame package, as in the case of the classes Target andUpToDate, then the distance between them will be zero.Instead, if they are in different packages, like in the caseof ProjectHelper and Target, their distance is theminimum number of packages one needs to traverse toreach one class from the other. For example, the distanceis one between ProjectHelper and Target (we needto traverse the package taskdefs), and three betweenUpToDate and FilterMapper (we need to traverse thepackages taskdefs, types and mappers).
After computing the distance between every pair ofclasses, we can compute the structural scattering. Table2 shows the structural distances between every pair ofclasses involved in our example as well as the valuefor the structural scattering. Note that, if the developerhad modified only the Target and UpToDate classes inthe considered time period, then her structural scatteringwould have been zero (the lowest possible), since herchanges were focused on just one package. By alsoconsidering the change performed to ProjectHelper,the structural scattering raises to 2.01. This is due to thenumber of classes involved in change set (3) and theaverage of the distance among them (0.67).

6
TABLE 2Example of structural scattering computation
Changed components Distanceorg.apache.tools.ant.ProjectHelper org.apache.tools.ant.taskdefs.Target 1org.apache.tools.ant.ProjectHelper org.apache.tools.ant.taskdefs.UpToDate 1org.apache.tools.ant.ProjectHelper org.apache.tools.ant.types.mappers.FilterMapper 2org.apache.tools.ant.taskdefs.Target org.apache.tools.ant.taskdefs.UpToDate 0org.apache.tools.ant.taskdefs.Target org.apache.tools.ant.types.mappers.FilterMapper 3org.apache.tools.ant.taskdefs.UpToDate org.apache.tools.ant.types.mappers.FilterMapper 3Structural Developer scattering 6.67
Finally the structural scattering reaches the value of 6.67when also considering the change to the FilterMapperclass. In this case the change set is composed of 4 classesand the average of the distances among them is 1.67.Note that the structural scattering is a direct scatteringmeasure: the higher the measure, the higher the estimateddeveloper’s scattering.
3.2 Semantic scattering
Considering the package structure might not be aneffective way of assessing the similarity of the classes(i.e., to what extent the modified classes implementsimilar responsibilities). Because of the software “aging”or wrong design decisions, classes grouped in the samepackage may have completely different responsibilities[37]. In such cases, the structural scattering measure mightprovide a wrong assessment of the level of developer’sscattering, by considering classes implementing differentresponsibilities as similar only because grouped insidethe same package. For this reason, we propose the se-mantic scattering measure, based on the textual similarityof the changed software components. Textual similaritybetween documents is computed using the Vector SpaceModel (VSM) [38]. In our application of VSM we (i) usedtf-idf weighting scheme [38], (ii) normalized the text bysplitting the identifiers (we also have maintained theoriginal identifiers), (iii) applied a stop word removal,and (iv) stemmed the words to their root (using thewell known Porter stemmer). The semantic scatteringmeasure is computed as:
SemScatd,p = |CHd,p| ×1
average∀ci,cj∈CHd,p
[sim(ci, cj)](2)
where the sim function returns the textual similaritybetween the classes ci and cj as a value between zero(no textual similarity) and one (the textual content of thetwo classes is identical). Note that, as for the structuralscattering, we adopt the average operator and assigna higher scattering to developers working on a highernumber of code components in the given time period.
Figure 3 shows an example of computation for thesemantic scattering measure. Also in this case the figuredepicts a real scenario we identified in Apache Ant ofa single developer in the time period between 2004-04-01 and 2004-06-30. The developer worked on the classesPath, Resource and ZipScanner, all contained in thepackage org.apache.tools.ant.types.
Fig. 3. Example of semantic scattering measure
org.apache.tools.ant.type
Path Resource ZipScanner
TABLE 3Example of semantic scattering computation
Changed components Text. sim.org.apache.tools.ant.type.Path org.apache.tools.ant.type.Resource 0.22org.apache.tools.ant.type.Path org.apache.tools.ant.type.ZipScanner 0.05org.apache.tools.ant.type.Resource org.apache.tools.ant.type.ZipScanner 0.10Semantic Developer scattering 24.32
Path and Resource are two data types and havesome code in common, while ZipScanner is an archivesscanner. While the structural scattering is zero for the ex-ample depicted in Figure 3 (all classes are from the samepackage), the semantic scattering is quite high (24.32) dueto the low textual similarity between the pairs of classescontained in the package (see Table 3). To computethe semantic scattering we firstly calculate the textualsimilarity between every pair of classes modified by thedeveloper, as reported in Table 3. Then we calculatethe average of the textual similarities (≈ 0.12) and weapply the inverse operator (≈ 8.11). Finally the semanticscattering is calculated multiplying the obtained valueby the number of elements in the change set, that is 3,achieving the final result of ≈ 24.32.
3.3 Applications of Scattering Measures
The scattering measures defined above could be adoptedin different areas concerned with monitoring mainte-nance and evolution activities. As an example, a projectmanager could use the scattering measures to estimatethe workload of a developer, as well as to re-allocateresources. In the context of this paper, we propose theuse of the defined measures for class-level bug predic-tion (i.e., to predict which classes are more likely to bebuggy). The basic conjecture is that developers having ahigh scattering are more likely to introduce bugs during codechange activities.
To exploit the defined scattering measures in thecontext of bug prediction, we built a new predictionmodel called Developer Changes Based Model (DCBM) thatanalyzes the components modified by developers in agiven time period. The model exploits a machine learn-ing algorithm built on top of two predictors. The first,called structural scattering predictor, is defined startingfrom the structural scattering measure, while the secondone, called semantic scattering predictor, is based on thesemantic scattering measure.
7
The predictors are defined as follow:
StrScatPredc,p =∑
d∈developersc,p
StrScatd,p (3)
SemScatPredc,p =∑
d∈developersc,p
SemScatd,p (4)
where the developersc,p is the set of developers thatworked on the component c during the time period p.
4 EVALUATING SCATTERING METRICS IN THECONTEXT OF BUG PREDICTION
The goal of the study is to evaluate the usefulness ofthe developer’s scattering measures in the prediction ofbug-prone components, with the purpose of improvingthe allocation of resources in the verification & validationactivities focusing on components having a higher bug-proneness. The quality focus is on the detection accuracyand completeness of the proposed technique as com-pared to competitive approaches. The perspective is ofresearchers, who want to evaluate the effectiveness ofusing information about developer scattered changes inidentifying bug-prone components.
The context of the study consists of 26 Apache soft-ware projects having different size and scope. Table 4reports the characteristics of the analyzed systems, andin particular (i) the software history we investigated,(ii) the mined number of commits, (iii) the size of theactive developers base (those who performed at least onecommit in the analyzed time period), (iv) the system’ssize in terms of KLOC and number of classes, and (v)the percentage of buggy files identified (as detailed later)during the entire change history. All data used in ourstudy are publicly available [25].
4.1 Research Questions and Baseline SelectionIn the context of the study, we formulated the followingresearch questions:
• RQ1: What are the performances of a bug predictionmodel based on developer’s scattering measures and howit compares to baseline techniques proposed in literature?
• RQ2: What is the complementarity between the proposedbug prediction model and the baseline techniques?
• RQ3: What are the performances of a “hybrid” modelbuilt by combining developer’s scattering measures withbaseline predictors?
In the first research question we quantify the perfor-mances of a prediction model based on developer’s scat-tering measures (DCBM). Then, we compare its perfor-mances with respect to four baseline prediction models,one based on product metrics and the other three basedon process metrics.
The first model exploits as predictor variables the CKmetrics [1], and in particular size metrics (i.e., the Linesof Code—LOC—and the Number of Methods—NOM),
cohesion metrics (i.e., the Lack of Cohesion of Method—LCOM), coupling metrics (i.e., the Coupling BetweenObjects—CBO—and the Response for a Class—RFC),and complexity metrics (i.e., the Weighted Methods perClass—WMC). We refer to this model as CM.
We also compared our approach with three predictionmodels based on process metrics. The first is the onebased on the work by Ostrand et al. [10], and exploitingthe number of developers that work on a code compo-nent in a specific time period as predictor variable (fromnow on, we refer to this model as DM).
The second is the Basic Code Change Model (BCCM)proposed by Hassan and using code change entropyinformation [8]. This choice is justified by the superiorityof this model with respect to other techniques exploit-ing change-proneness information [11], [12], [13]. Whilesuch a superiority has been already demonstrated byHassan [8], we also compared these techniques beforechoosing BCCM as one of the baselines for evaluatingour approach. We found that the BCCM works betterwith respect to a model that simply counts the number ofchanges. This is because it filters the changes that differfrom the code change process (i.e., fault repairing andgeneral maintenance modifications) considering only theFeature Introduction modifications (FI), namely the changesrelated to adding or enhancing features. However, weobserved a high overlap between the BCCM and themodel that use the number of changes as predictor(almost 84%) on the dataset used for the comparison,probably due to the fact that the nature of the infor-mation exploited by the two models is similar. Theinterested reader can find the comparison between thesetwo models in our online appendix [25].
Finally, the third baseline is a prediction model basedon the Module Activity Focus metric proposed by Posnettet al. [22]. It relies on the concept of predator-prey foodweb existing in ecology (from now on, we refer to thismodel as MAF). The metric is based on the measure-ment of the degree to which a code component receivesfocused attention by developers. It can be considered asa form of ownership metric of the developers on thecomponent. It is worth noting that we do not considerthe other Developer Attention Focus metric proposed byPosnett et al., since (i) the two metrics are symmetric, and(ii) in order to provide a probability that a component isbuggy, we need to qualify to what extent the activitieson a file are focused, rather than measuring how aredevelopers’ activities focused. Even if Posnett et al. havenot proposed a prediction model based on their metric,the results of this comparison will provide insights onthe usefulness of developer’s scattering measures fordetecting bug-prone components.
Note that our choice of the baselines is motived by thewill of: (i) considering both models based on productand process metrics, and (ii) covering a good numberof different process metrics (since our model exploitsprocess metrics), including approaches exploiting infor-mation similar to the ones used by our scattering metrics.

8
TABLE 4Characteristics of the software systems used in the study
Project Period #Commits #Dev. #Classes KLOC % buggyclasses
AMQ Dec 2005 - Sep 2015 8,577 64 2,528 949 54Ant Jan 2000 - Jul 2014 13,054 55 1,215 266 72Aries Sep 2009 - Sep 2,015 2,349 24 1,866 343 40Camel Mar 2007 - Sep 2015 17,767 128 12,617 1,552 30CXF Apr 2008 - Sep 2015 10,217 55 6,466 1,232 26Drill Sep 2012 - Sep 2015 1,720 62 1,951 535 63Falcon Nov 2011 - Sep 2015 1,193 26 581 201 25Felix May 2007 - May 2015 11,015 41 5,055 1,070 18JMeter Sep 1998 - Apr 2014 10,440 34 1,054 192 37JS2 Feb 2008 - May 2015 1,353 7 1,679 566 34Log4j Nov 2000 - Feb 2014 3,274 21 309 59 58Lucene Mar 2010 - May 2015 13,169 48 5,506 2,108 12Oak Mar 2012 - Sep 2015 8,678 19 2,316 481 43OpenEJB Oct 2011 - Jan 2013 9,574 35 4,671 823 36OpenJPA Jun 2007 - Sep 2015 3,984 25 4,554 822 38Pig Oct 2010 - Sep 2015 1,982 21 81,230 48,360 16Pivot Jan 2010 - Sep 2015 1,488 8 11,339 7,809 22Poi Jan 2002 - Aug 2014 5,742 35 2,854 542 62Ranger Aug 2014 - Sep 2015 622 18 826 443 37Shindig Feb 2010 - Jul 2015 2,000 27 1,019 311 14Sling Jun 2009 - May 2015 9,848 29 3,951 1,007 29Sqoop Jun 2011 - Sep 2015 699 22 667 134 14Sshd Dec 2008 - Sep 2015 629 8 658 96 33Synapse Aug 2005 - Sep 2015 2,432 24 1,062 527 13Whirr Jun 2010 - Apr 2015 569 17 275 50 21Xerces-J Nov 1999 - Feb 2014 5,471 34 833 260 6
In the second research question we aim at evaluatingthe complementarity of the different models, while in thethird one we build and evaluate a “hybrid” predictionmodel exploiting as predictor variables the scatteringmeasures we propose as well as the measures used bythe four experimented competitive techniques (i.e., DM,BCCM, MAF, and CM). Note that we do not limit ouranalysis to the experimentation of a model includingall predictor variables, but we exercise all 2,036 possiblecombinations of predictor variables to understand whichis the one achieving the best performances.
4.2 Experimental process and oracle definitionTo evaluate the performances of the experimented bugprediction models we need to define the machine learn-ing classifier to use. For each prediction technique, weexperimented several classifiers, namely ADTree [39],Decision Table Majority [40], Logistic Regression [41],Multilayer Perceptron [42] and Naive Bayes [43]. Weempirically compared the results achieved by the fivedifferent models on the software systems used in ourstudy (more details on the adopted procedure later inthis section). For all the prediction models the bestresults were obtained using the Majority Decision Table(the comparison among the classifiers can be found inour online appendix [25]). Thus, we exploit it in theimplementation of the five models. This classifier can beviewed as an extension of one-valued decision trees [40].It is a rectangular table where the columns are labeledwith predictors and rows are sets of decision rules.
Each decision rule of a decision table is composed of(i) a pool of conditions, linked through and/or logical
operators which are used to reflect the structure of the if-then rules; and (ii) an outcome which mirrors the classi-fication of a software entity respecting the correspondingrule as bug-prone or non bug-prone. Majority DecisionTable uses an attribute reduction algorithm to find agood subset of predictors with the goal of eliminatingequivalent rules and reducing the likelihood of over-fitting the data.
To assess the performance of the five models, wesplit the change-history of the object systems into three-month time periods and we adopt a three-month slidingwindow to train and test the bug prediction models.Starting from the first time period TP1 (i.e., the onestarting at the first commit), we train each model onit, and test its ability in predicting buggy classes onTP2 (i.e., the subsequent three-month time period). Then,we move three months forward the sliding window,training the classifiers on TP2 and testing their accuracyon TP3. This process is repeated until the end of theanalyzed change history (see Table 4) is reached. Notethat our choice of considering three-month periods isbased on: (i) choices made in previous work, like the oneby Hassan et al. [8]; and (ii) the results of an empiricalassessment we performed on such a parameter showingthat the best results for all experimented techniques areachieved by using three-month periods. In particular, weexperimented with time windows of one, two, three, andsix months. The complete results are available in ourreplication package [25].
Finally, to evaluate the performances of the five experi-mented models we need an oracle reporting the presenceof bugs in the source code.

9
Although the PROMISE repository collects a largedataset of bugs in open source systems [44], it providesoracles at release-level. Since the proposed measureswork at time period-level, we had to build our ownoracle. Firstly, we identified bug fixing commits hap-pened during the change history of each object systemby mining regular expressions containing issue IDs inthe change log of the versioning system (e.g., “fixed issue#ID” or “issue ID”). After that, for each identified issueID, we downloaded the corresponding issue report fromthe issue tracking system and extracted the followinginformation: product name; issue’s type (i.e., whether anissue is a bug, enhancement request, etc); issue’s status(i.e., whether an issue was closed or not); issue’s resolution(i.e., whether an issue was resolved by fixing it, or it wasa duplicate bug report, or a “works for me” case); issue’sopening date; issue’s closing date, if available.
Then, we checked each issue’s report to be correctlydownloaded (e.g., the issue’s ID identified from theversioning system commit note could be a false positive).After that, we used the issue type field to classify theissue and distinguish bug fixes from other issue types(e.g., enhancements). Finally, we only considered bugshaving Closed status and Fixed resolution. Basically, werestricted our attention to (i) issues that were related tobugs as we used them as a measure of fault-proneness,and (ii) issues that were neither duplicate reports norfalse alarms.
Once collected the set of bugs fixed in the changehistory of each system, we used the SZZ algorithm [45]to identify when each fixed bug was introduced. TheSZZ algorithm relies on the annotation/blame feature ofversioning systems. In essence, given a bug-fix identifiedby the bug ID, k, the approach works as follows:
1) For each file fi, i = 1 . . .mk involved in the bug-fixk (mk is the number of files changed in the bug-fixk), and fixed in its revision rel-fixi,k, we extract thefile revision just before the bug fixing (rel-fixi,k − 1).
2) starting from the revision rel-fixi,k − 1, for eachsource line in fi changed to fix the bug k the blamefeature of Git is used to identify the file revisionwhere the last change to that line occurred. Indoing that, blank lines and lines that only containcomments are identified using an island grammarparser [46]. This produces, for each file fi, a set ofni,k fix-inducing revisions rel-bugi,j,k, j = 1 . . . ni,k.Thus, more than one commit can be indicated bythe SZZ algorithm as responsible for inducing abug.
By adopting the process described above we are ableto approximate the periods of time where each class ofthe subject systems was affected by one or more bugs(i.e., was a buggy class). In particular, given a bug-fixBFk performed on a class ci, we consider ci buggy fromthe date in which the bug fixed in BFk was introduced(as indicated by the SZZ algorithm) to the date in whichBFk (i.e., the patch) was committed in the repository.
4.3 Metrics and Data AnalysisOnce defined the oracle and obtained the predictedbuggy classes for every three-month period, we answerRQ1 by using three widely-adopted metrics, namelyaccuracy, precision and recall [38]:
accuracy =TP + TN
TP + FP + TN + FN(5)
precision =TP
TP + FP(6)
recall =TP
TP + FN(7)
where TP is the number of classes containing bugs thatare correctly classified as bug-prone; TN denotes thenumber of bug-free classes classified as non bug-proneclasses; FP and FN measure the number of classes forwhich a prediction model fails to identify bug-proneclasses by declaring bug-free classes as bug-prone (FP )or identifying actually buggy classes as non buggy ones(FN ). As an aggregate indicator of precision and recall,we also report the F-measure, defined as the harmonicmean of precision and recall:
F -measure = 2 ∗ precision ∗ recallprecision+ recall
(8)
Finally, we also report the Area Under the Curve(AUC) obtained by the prediction model. The AUCquantifies the overall ability of a prediction model todiscriminate between buggy and non-buggy classes. Thecloser the AUC to 1, the higher the ability of the classifierto discriminate classes affected and not by a bug. Onthe other hand, the closer the AUC to 0.5, the lower theaccuracy of the classifier. To compare the performancesobtained by DCBM with the competitive techniques, weperformed the bug prediction using the four baselinemodels BCCM, DM, MAF, and CM on the same systemsand the same periods on which we ran DCBM.
To answer RQ2, we analyzed the orthogonality of thedifferent measures used by the five experimented bugprediction models using Principal Component Analysis(PCA). PCA is a statistical technique able to identify vari-ous orthogonal dimensions (principal components) froma set of data. It can be used to evaluate the contributionof each variable to the identified components. Throughthe analysis of the principal components and the contri-butions (scores) of each predictor to such components,it is possible to understand whether different predic-tors contribute to the same principal components. Twomodels are complementary if the predictors they exploitcontribute to capture different principal components.Hence, the analysis of the principal components providesinsights on the complementarity between models.
Such an analysis is necessary to assess whether theexploited predictors assign the same bug-proneness tothe same set of classes.

10
However, PCA does not tell the whole story. Indeed,using PCA it is not possible to identify to what extenta prediction model complements another and vice versa.This is the reason why we complemented the PCA byanalyzing the overlap of the five prediction models.Specifically, given two prediction models mi and mj , wecomputed:
corrmi∩mj=|corrmi ∩ corrmj ||corrmi
∪ corrmj|% (9)
corrmi\mj=|corrmi \ corrmj ||corrmi
∪ corrmj|% (10)
where corrmi represents the set of bug-prone classes cor-rectly classified by the prediction model mi, corrmi∩mj
measures the overlap between the sets of true positivescorrectly identified by both models mi and mj , corrmi\mj
measures the percentage of bug-prone classes correctlyclassified by mi only and missed by mj . Clearly, theoverlap metrics are computed by considering each com-bination of the five experimented detection techniques(e.g., we compute corrBCCM∩DM , corrBCCM∩DCBM ,corrBCCM∩CM , corrDM∩DCBM , etc.). In addition, giventhe five experimented prediction models mi, mj , mk, mp,mz , we computed:
corrmi\(mj∪mk∪mp∪mz) =|corrmi
\ (corrmj∪ corrmk
∪ corrmp∪ corrmz
)||corrmi
∪ corrmj∪ corrmk
∪ corrmp∪ corrmz
|%
(11)
that represents the percentage of bug-prone classes cor-rectly identified only by the prediction model mi. In thepaper, we discuss the results obtained when analyzingthe complementarity between our model and the base-line ones. The other results concerning the complemen-tarity between the baseline approaches are available inour online appendix [25].
Finally, to answer RQ3 we build and assess the per-formances of a “hybrid” bug prediction model exploit-ing different combinations of the predictors used bythe five experimented models (i.e., DCBM, BCCM, DM,MAF, and CM). Firstly, we assess the boost in perfor-mances (if any) provided by our scattering metrics whenplugged-in the four competitive models, similarly towhat has been done by Bird et al. [20], who explainedthe relationship between ownership metrics and bugsbuilding regression models in which the metrics areadded incrementally in order to evaluate their impacton increasing/decreasing the likelihood of developers tointroduce bugs.
Then, we create a “comprehensive baseline model”featuring all predictors exploited by the four competi-tive models and again, we assess the possible boost inperformances provided by our two scattering metricswhen added to such a comprehensive model. Clearly,simply combining together the predictors used by thefive models could lead to sub-optimal results, due forexample to model overfitting.
Thus, we also investigate the subset of predictorsactually leading to the best prediction accuracy. To thisaim, we use the wrapper approach proposed by Kohaviand John [47]. Given a training set built using all thefeatures available, the approach systematically exercisesall the possible subsets of features against a test set, thusassessing their accuracy. Also in this case we used theMajority Decision Table [40] as machine learner.
In our study, we considered as training set the penul-timate three-month period of each subject system, andas test set the last three-month period of each system.Note that this analysis has not been run on the wholechange history of the software systems due to its highcomputational cost. Indeed, experimenting all possiblecombinations of the eleven predictors means the runof 2,036 different prediction models across each of the26 systems (52,936 overall runs). This required approx-imately eight weeks on four Linux laptops having twodual-core 3.10 GHz CPU and 4 Gb of RAM.
Once obtained all the accuracy metrics for each combi-nation, we analyzed these data in two steps. Firstly, weplot the distribution of the average F-measure obtainedby the 2,036 different combinations over the 26 softwaresystems. Then we discuss the performances of the topfive configurations comparing the results with the onesachieved by (i) each of the five experimented models,(ii) the models built plugging-in the scattering metricsas additional features in the four baseline models, and(iii) the comprehensive prediction models that include allthe metrics exploited by the four baseline models plusour scattering metrics.
5 ANALYSIS OF THE RESULTS
In this section we discuss the results achieved aiming atanswering the formulated research questions.
5.1 RQ1: On the Performances of DCBM and ItsComparison with the Baseline Techniques
Table 5 reports the results—in terms of AUC-ROC, accu-racy, precision, recall, and F-measure—achieved by thefive experimented bug prediction models, i.e., our model,exploiting the developer’s scattering metrics (DCBM),the BCCM proposed by Hassan [8], a prediction modelthat uses as predictor the number of developers thatwork on a code component (DM) [9], [10], the predictionmodel based on the degree to which a module receivesfocused attention by developers (MAF) [22], and a pre-diction model exploiting product metrics capturing size,cohesion, coupling, and complexity of code components(CM) [1].
The achieved results indicate that the proposed pre-diction model (i.e., DCBM) ensures better predictionaccuracy as compared to the competitive techniques.Indeed, the area under the ROC curve of DCBM rangesbetween 62% and 91%, outperforming the competitivemodels.

11
TAB
LE5
AUC
-RO
C,A
ccur
acy,
Pre
cisi
on,R
ecal
l,an
dF-
Mea
sure
ofth
efiv
ebu
gpr
edic
tion
mod
els
Syst
emD
CBM
DM
BCC
MA
UC
-RO
CA
ccur
acy
Prec
isio
nR
ecal
lF-
mea
sure
AU
C-R
OC
Acc
urac
yPr
ecis
ion
Rec
all
F-m
easu
reA
UC
-RO
CA
ccur
acy
Prec
isio
nR
ecal
lF-
mea
sure
AM
Q83
%53
%42
%53
%47
%58
%24
%18
%19
%19
%61
%52
%33
%49
%39
%A
nt88
%69
%66
%72
%69
%69
%26
%28
%37
%31
%67
%63
%67
%68
%68
%A
ries
86%
56%
51%
54%
52%
65%
23%
23%
25%
24%
58%
50%
34%
45%
39%
Cam
el81
%55
%51
%55
%53
%51
%27
%18
%28
%22
%50
%39
%39
%46
%42
%C
FX79
%94
%88
%94
%91
%54
%25
%19
%25
%21
%71
%79
%86
%84
%85
%D
rill
63%
53%
45%
48%
46%
58%
23%
22%
39%
28%
52%
39%
14%
25%
18%
Falc
on75
%98
%96
%98
%97
%50
%25
%20
%21
%21
%75
%89
%86
%90
%88
%Fe
lix88
%70
%69
%67
%68
%50
%25
%17
%30
%22
%59
%61
%60
%65
%63
%JM
eter
91%
77%
72%
68%
70%
50%
29%
24%
53%
33%
69%
65%
65%
63%
64%
JS2
62%
87%
83%
86%
84%
50%
26%
22%
17%
19%
58%
81%
70%
74%
72%
Log4
j89
%71
%62
%66
%64
%50
%19
%13
%26
%17
%52
%43
%36
%78
%49
%Lu
cene
77%
84%
79%
83%
81%
54%
27%
22%
30%
26%
63%
72%
61%
86%
71%
Oak
67%
97%
95%
97%
96%
52%
27%
15%
29%
19%
66%
95%
92%
80%
86%
Ope
nEJB
82%
98%
97%
98%
98%
50%
22%
25%
20%
22%
78%
95%
81%
91%
85%
Ope
nJPA
83%
79%
71%
77%
74%
51%
20%
20%
38%
26%
78%
72%
61%
68%
64%
Pig
79%
89%
79%
89%
84%
50%
22%
21%
37%
27%
73%
71%
64%
75%
69%
Pivo
t78
%86
%75
%86
%80
%53
%26
%19
%24
%21
%68
%69
%71
%79
%75
%Po
i87
%68
%88
%59
%71
%50
%25
%34
%16
%22
%66
%60
%74
%49
%59
%R
ange
r77
%95
%90
%95
%93
%50
%28
%18
%19
%19
%76
%92
%83
%91
%87
%Sh
indi
g73
%66
%50
%65
%56
%50
%24
%23
%23
%23
%58
%58
%43
%61
%50
%Sl
ing
62%
85%
76%
84%
80%
57%
21%
17%
18%
18%
61%
80%
62%
68%
65%
Sqoo
p78
%98
%96
%98
%97
%55
%26
%19
%32
%23
%77
%97
%90
%89
%90
%Ss
hd86
%70
%59
%70
%64
%55
%24
%19
%36
%25
%69
%52
%49
%54
%52
%Sy
naps
e67
%62
%50
%62
%56
%53
%23
%17
%24
%20
%64
%49
%48
%56
%52
%W
hirr
76%
98%
95%
98%
97%
52%
26%
20%
24%
21%
74%
96%
84%
88%
86%
Xer
ces-
J83
%94
%94
%88
%91
%52
%49
%28
%35
%31
%71
%74
%59
%80
%68
%
Syst
emC
MM
AF
AU
C-R
OC
Acc
urac
yPr
ecis
ion
Rec
all
F-m
easu
reA
UC
-RO
CA
ccur
acy
Prec
isio
nR
ecal
lF-
mea
sure
AM
Q55
%43
%37
%41
%39
%56
%56
%38
%45
%41
%A
nt58
%38
%28
%33
%30
%60
%59
%60
%62
%61
%A
ries
56%
38%
28%
33%
30%
51%
45%
30%
43%
35%
Cam
el41
%42
%44
%41
%42
%50
%38
%35
%38
%36
%C
FX53
%52
%55
%46
%50
%76
%75
%82
%73
%77
%D
rill
50%
34%
26%
32%
29%
52%
32%
22%
29%
25%
Falc
on51
%52
%45
%54
%49
%71
%81
%70
%81
%75
%Fe
lix53
%55
%53
%51
%52
%67
%56
%62
%65
%63
%JM
eter
50%
43%
44%
43%
43%
68%
58%
61%
59%
60%
JS2
50%
43%
44%
43%
43%
62%
80%
72%
78%
75%
Log4
j50
%35
%38
%31
%34
%52
%51
%44
%58
%52
%Lu
cene
50%
35%
38%
31%
34%
65%
66%
66%
76%
70%
Oak
52%
46%
54%
55%
54%
64%
88%
89%
78%
83%
Ope
nEJB
61%
62%
66%
57%
61%
80%
78%
77%
79%
78%
Ope
nJPA
51%
55%
59%
45%
51%
67%
70%
57%
67%
62%
Pig
57%
62%
58%
52%
55%
69%
68%
62%
68%
65%
Pivo
t50
%41
%47
%40
%43
%66
%64
%65
%69
%67
%Po
i58
%65
%61
%65
%63
%61
%55
%58
%56
%57
%R
ange
r60
%65
%61
%65
%63
%76
%81
%77
%82
%79
%Sh
indi
g52
%48
%36
%46
%40
%54
%55
%39
%59
%47
%Sl
ing
55%
38%
35%
41%
38%
61%
76%
59%
63%
61%
Sqoo
p53
%59
%59
%64
%61
%78
%92
%89
%84
%87
%Ss
hd50
%28
%26
%31
%28
%67
%48
%46
%52
%49
%Sy
naps
e56
%43
%47
%52
%49
%61
%47
%47
%53
%50
%W
hirr
54%
61%
55%
63%
59%
69%
82%
82%
82%
82%
Xer
ces-
J58
%61
%55
%63
%59
%65
%71
%68
%75
%72
%

12
In particular, the Developer Model achieves an AUCbetween 50% and 69%, the Basic Code Change Modelbetween 50% and 78%, the MAF model between 50%and 78%, and the CM model between 41% and 61%.Also in terms of accuracy, precision and recall (and,consequently, of F-measure) DCBM achieves better re-sults. In particular, across all the different object sys-tems, DCBM achieves a higher F-measure with respectto DM (mean=+53.7%), BCCM (mean=+10.3%), MAF(mean=+13.3%), and CM (mean=+29.3%). The highervalues achieved for precision and recall indicates thatDCBM provides less false positives (i.e., non-buggyclasses indicated as buggy ones) while also being ableto identify more classes actually affected by a bug ascompared to the competitive models. Moreover, whenconsidering the AUC, we observed that DCBM reacheshigher values with respect the competitive bug predic-tion approaches. This result highlights how the proposedmodel performs better in discriminating between buggyand non-buggy classes.
Interesting is the case of Xerces-J where DCBM isable to identify buggy classes with 94% of accuracy (seeTable 5), as compared to the 74% achieved by BCCM,49% of DM, 71% of MAF, and 59% of CM. We lookedinto this project to understand the reasons behind sucha strong result. We found that the Xerces-J’s buggyclasses are often modified by few developers that, onaverage, perform a small number of changes on them.As an example, the class XSSimpleTypeDecl of thepackage org.apache.xerces.impl.dv.xs has beenmodified only twice between May 2008 and July 2008(one of the three-month periods considered in our study)by two developers. However, the sum of their structuraland semantic scattering in that period was very high (161and 1,932, respectively). It is worth noting that if a lownumber of developers work on a file, they have higherchances to be considered as the owner of that file. Thismeans that, in the case of the MAF model, the probabilitythat the class is bug-prone decreases. At the same time,models based on the change entropy (BCCM) or on thenumber of developers modifying a class (DM) experi-ence difficulties in identifying this class as buggy due tothe low number of changes it underwent and to the lownumber of involved developers, respectively. Conversely,our model does not suffer of such a limitation thanks tothe exploited developers’ scattering information.
Finally, the CM model relying on product metricsfails in the prediction since the class has code metricscomparable with the average metrics of the system (e.g.,the CBO of the class 12, while the average CBO of thesystem is 14).
Looking at the other prediction models, we can ob-serve that the model based only on the number of de-velopers working on a code component never achievesan accuracy higher than 49%. This result confirms whatpreviously demonstrated by Ostrand et al. [10], [9] onthe limited impact of individual developer data on bugprediction.
Regarding the other models, we observe that the in-formation about the ownership of a class as well as thecode metrics and the entropy of changes have a strongerpredictive power compared to number of developers.However, they still exhibit a lower prediction accuracywith respect to what allowed by the developer scatteringinformation.
In particular, we observed that the MAF modelhas good performances when it is adopted on well-modularized systems, i.e., systems grouping in the samepackage classes implementing related responsibilities.Indeed, MAF achieved the highest accuracy on theApache CFX, Apache OpenEJB, and Apache Sqoopsystems, where the average modularization quality (MQ)[48] is of 0.84, 0.79, and 0.88, respectively. The rea-son behind this result is that a high modularizationquality often correspond to a good distribution of de-velopers activities. For instance, the average numberof developers per package working on Apache CFXis 5. As a consequence, the focus of developers onspecific code entities is high. The same happens onApache OpenEJB and Apache Sqoop, where the av-erage number of developers per package is 3 and 7,respectively. However, even if the developers mainlyfocus their attention on few packages, in some casesthey also apply changes to classes contained in otherpackages, increasing their chances of introducing bugs.This is the reason why our prediction model still con-tinue to work better in such cases. A good exampleis the one of the class HBaseImportJob, containedin the package org.apache.sqoop.mapreduce ofthe project Apache Sqoop. Only two developersworked on this class over the time period be-tween July 2013 and September 2013, however thesame developers have been involved in the main-tenance of the class HiveImport of the packagecom.cloudera.sqoop.hive. Even if the two classesshared the goal to import data from other projects intoSqoop, they implement significantly different mecha-nisms for importing data. This results in a higher prone-ness of introducing bugs. The sum of the structural andsemantic scattering in that period for the two develop-ers reached 86 and 92, respectively, causing the correctprediction of the buggy file for our model, and an errorin the prediction of the MAF model.
The BCCM [8] often achieves a good predictionaccuracy. This is due to the higher change-proneness of components being affected by bugs.As an example, in the JS2 project, the classPortalAdministrationImpl of the packageorg.apache.jetspeed.administration has beenmodified 19 times between January and March 2010.Such a high change frequency led to the introduction ofa bug. However, not always such a conjecture is valid.Let us consider the Apache Aries project, in which BCCMobtained a low accuracy (recall=45%, precision=34%).Here we found several classes with high change-proneness that were not subject to any bug. For instance,
13
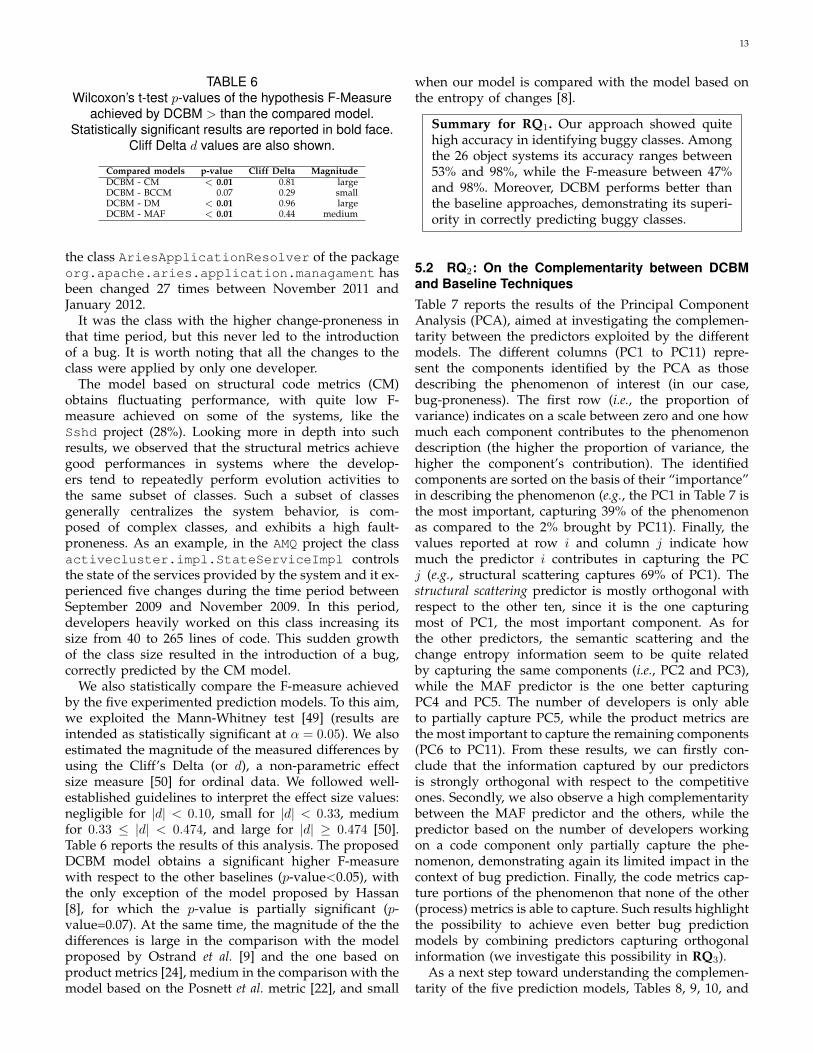
TABLE 6Wilcoxon’s t-test p-values of the hypothesis F-Measure
achieved by DCBM > than the compared model.Statistically significant results are reported in bold face.
Cliff Delta d values are also shown.
Compared models p-value Cliff Delta MagnitudeDCBM - CM < 0.01 0.81 largeDCBM - BCCM 0.07 0.29 smallDCBM - DM < 0.01 0.96 largeDCBM - MAF < 0.01 0.44 medium
the class AriesApplicationResolver of the packageorg.apache.aries.application.managament hasbeen changed 27 times between November 2011 andJanuary 2012.
It was the class with the higher change-proneness inthat time period, but this never led to the introductionof a bug. It is worth noting that all the changes to theclass were applied by only one developer.
The model based on structural code metrics (CM)obtains fluctuating performance, with quite low F-measure achieved on some of the systems, like theSshd project (28%). Looking more in depth into suchresults, we observed that the structural metrics achievegood performances in systems where the develop-ers tend to repeatedly perform evolution activities tothe same subset of classes. Such a subset of classesgenerally centralizes the system behavior, is com-posed of complex classes, and exhibits a high fault-proneness. As an example, in the AMQ project the classactivecluster.impl.StateServiceImpl controlsthe state of the services provided by the system and it ex-perienced five changes during the time period betweenSeptember 2009 and November 2009. In this period,developers heavily worked on this class increasing itssize from 40 to 265 lines of code. This sudden growthof the class size resulted in the introduction of a bug,correctly predicted by the CM model.
We also statistically compare the F-measure achievedby the five experimented prediction models. To this aim,we exploited the Mann-Whitney test [49] (results areintended as statistically significant at α = 0.05). We alsoestimated the magnitude of the measured differences byusing the Cliff’s Delta (or d), a non-parametric effectsize measure [50] for ordinal data. We followed well-established guidelines to interpret the effect size values:negligible for |d| < 0.10, small for |d| < 0.33, mediumfor 0.33 ≤ |d| < 0.474, and large for |d| ≥ 0.474 [50].Table 6 reports the results of this analysis. The proposedDCBM model obtains a significant higher F-measurewith respect to the other baselines (p-value<0.05), withthe only exception of the model proposed by Hassan[8], for which the p-value is partially significant (p-value=0.07). At the same time, the magnitude of the thedifferences is large in the comparison with the modelproposed by Ostrand et al. [9] and the one based onproduct metrics [24], medium in the comparison with themodel based on the Posnett et al. metric [22], and small
when our model is compared with the model based onthe entropy of changes [8].
Summary for RQ1. Our approach showed quitehigh accuracy in identifying buggy classes. Amongthe 26 object systems its accuracy ranges between53% and 98%, while the F-measure between 47%and 98%. Moreover, DCBM performs better thanthe baseline approaches, demonstrating its superi-ority in correctly predicting buggy classes.
5.2 RQ2: On the Complementarity between DCBMand Baseline TechniquesTable 7 reports the results of the Principal ComponentAnalysis (PCA), aimed at investigating the complemen-tarity between the predictors exploited by the differentmodels. The different columns (PC1 to PC11) repre-sent the components identified by the PCA as thosedescribing the phenomenon of interest (in our case,bug-proneness). The first row (i.e., the proportion ofvariance) indicates on a scale between zero and one howmuch each component contributes to the phenomenondescription (the higher the proportion of variance, thehigher the component’s contribution). The identifiedcomponents are sorted on the basis of their “importance”in describing the phenomenon (e.g., the PC1 in Table 7 isthe most important, capturing 39% of the phenomenonas compared to the 2% brought by PC11). Finally, thevalues reported at row i and column j indicate howmuch the predictor i contributes in capturing the PCj (e.g., structural scattering captures 69% of PC1). Thestructural scattering predictor is mostly orthogonal withrespect to the other ten, since it is the one capturingmost of PC1, the most important component. As forthe other predictors, the semantic scattering and thechange entropy information seem to be quite relatedby capturing the same components (i.e., PC2 and PC3),while the MAF predictor is the one better capturingPC4 and PC5. The number of developers is only ableto partially capture PC5, while the product metrics arethe most important to capture the remaining components(PC6 to PC11). From these results, we can firstly con-clude that the information captured by our predictorsis strongly orthogonal with respect to the competitiveones. Secondly, we also observe a high complementaritybetween the MAF predictor and the others, while thepredictor based on the number of developers workingon a code component only partially capture the phe-nomenon, demonstrating again its limited impact in thecontext of bug prediction. Finally, the code metrics cap-ture portions of the phenomenon that none of the other(process) metrics is able to capture. Such results highlightthe possibility to achieve even better bug predictionmodels by combining predictors capturing orthogonalinformation (we investigate this possibility in RQ3).
As a next step toward understanding the complemen-tarity of the five prediction models, Tables 8, 9, 10, and

14
TABLE 7Results achieved applying the Principal Component Analysis
PC1 PC2 PC3 PC4 PC5 PC6 PC7 PC8 PC9 PC10 PC11Proportion of Variance 0.39 0.16 0.11 0.10 0.06 0.05 0.03 0.03 0.03 0.02 0.02Cumulative Variance 0.39 0.55 0.66 0.76 0.82 0.87 0.90 0.92 0.95 0.97 1.00Structural scattering predictor 0.69 - - 0.08 0.04 - - - - - -Semantic scattering predictor - 0.51 0.33 0.16 0.03 - - - - - -Change entropy 0.07 0.34 0.45 0.25 0.11 0.22 - 0.01 - - -Number of Developers - - 0.05 0.02 0.29 - 0.04 0.05 0.01 - 0.07MAF 0.04 0.11 - 0.38 0.45 - 0.21 0.04 0.06 - 0.1LOC 0.04 - 0.01 - 0.03 0.07 0.18 0.21 0.11 0.09 0.33CBO 0.1 0.04 0.05 0.07 - 0.56 0.2 0.33 0.21 0.44 0.12LCOM 0.01 - 0.04 - 0.01 - 0.24 0.1 0.06 0.09 0.05NOM 0.03 - 0.01 0.01 - 0.11 - 0.12 0.43 0.22 0.1RFC 0.01 - 0.04 0.01 0.03 - 0.13 0.06 0.12 0.1 0.09WMC 0.01 - 0.02 0.02 0.01 0.04 - 0.08 - 0.06 0.14
TABLE 8Overlap analysis between DCBM and DM
System DCBM ∩ DCBM \ DM \DM% DM% DCBM%
AMQ 14 81 5Ant 9 74 17Aries 12 65 23Camel 16 67 17CXF 12 66 22Drill 27 72 1Falcon 12 84 4Felix 14 65 21JMeter 8 89 3JS2 22 75 3Log4j 13 75 12Lucene 18 75 7Oak 19 81 0OpenEJB 17 80 3OpenJPA 22 71 7Pig 16 74 10Pivot 18 80 2Poi 11 72 17Ranger 11 76 13Shindig 20 61 18Sling 16 62 21Sqoop 19 71 10Sshd 22 64 14Synapse 12 79 9Whirr 19 66 15Xerces 32 55 13Overall 14 73 13
11 report the overlap metrics computed between DCBM-DM, DCBM-BCCM, DCBM-CM, and DCBM-MAF, re-spectively.
In addition, Table 12 shows the percentage of buggyclasses correctly identified only by each of the single bugprediction models (e.g., identified by DCBM and not byDM, BCCM, CM and MAF). While in this paper we onlydiscuss in details the overlap between our model andthe alternative ones, the interested readers can find theanalysis of the overlap among the other models in ouronline appendix [25].
Regarding the overlap between our predictor (DCBM)and the one built using the number of developers (DM),it is interesting to observe that there is high comple-mentarity between the two models, with an overall73% of buggy classes correctly identified only by our
model, 13% only by DM, and 14% of instances correctlyclassified by both models. This result is consistent on allthe object systems (see Table 8).
An example of buggy class identifiedonly by our model is represented byLuceneIndexer contained in the packageorg.apache.camel.component.lucene of theApache Lucene project. This class, between February2012 and April 2012, has been modified by onedeveloper that in the same time period worked onfive other classes (the sum of structural and semanticscattering reached 138 and 192, respectively). This is thereason why our model correctly identified this class asbuggy, while DM was not able to detect it due to thesingle developer who worked on the class. On the otherside, DM was able to detect few instances of buggyclasses not identified by DCBM. This generally happenswhen developers working on a code component applyless scattered changes over the other parts of the system,as in the case of the Apache Sling project, wherethe class AbstractSlingRepository of the packageorg.apache.sling.jrc.base was modified by fourdevelopers between March 2011 and May 2011. Suchdevelopers did not apply changes to other classes, thushaving a low structural and semantic scattering. DMwas instead able to correctly classify the class as buggy.
A similar trend is shown in Table 9, when analyzingthe overlap between our model and BCCM. In this case,our model correctly classified 42% of buggy classes thatare not identified by BCCM that is, however, able tocapture 29% of buggy classes missed by our approach(the remaining 29% of buggy classes are correctly iden-tified by both models). Such complementarity is mainlydue to the fact that the change-proneness of a class doesnot always correctly suggest buggy classes, even if it isa good indicator. Often it is important to discriminatein which situations such changes are done. For exam-ple, the class PropertyIndexLookup of the packageoak.plugins.index.property in the Apache Oakproject, during the time period between April 2013 andJune 2013, has been changed 4 times by 4 developersthat worked, in the same period, on other 6 classes. This

15
caused a high scattering (both structural and semantic)for all the developers, and our model correctly markedthe class as buggy.
Instead, BCCM did not classify the component asbuggy since the number of changes applied on it isnot high enough to allow the model to predict abug. However, the model proposed by Hassan [8] isable to capture several buggy files that our modeldoes not identify. For example, in the Apache Pigproject the class SenderHome contained in the pack-age com.panacya.platform.service.bus.senderexperienced 27 changes between December 2011 andFebruary 2012. Such changes were made by two devel-opers that touched a limited number of related classesof the same package. Indeed, the sum of structural andsemantic scattering was quite low (13 and 9, respec-tively) thus not allowing our model to classify the classas buggy. Instead, in this case the number of changesrepresent a good predictor.
Regarding the overlap between our model and thecode metrics-based model (Table 10), also in this casethe set of code components correctly predicted byboth the models represents only a small percentage(13% on average). This means that the two mod-els are able to predict the bug-proneness of differ-ent code components. Moreover, the DCBM modelcaptures 78% of buggy classes missed by the codemetrics model that is able to correctly predict 9%of code components missed by our model. For ex-ample, the DCBM model is able to correctly classifythe pivot.serialization.JSONSerializer classof the Apache Pivot project, having low (good) valuesof size, complexity, and coupling, but modified by fourdevelopers in the quarter going from January 2013 toMarch 2013.
As for the overlap between MAF and our model,DCBM was able to capture 45% of buggy classes notidentified by MAF. On the other hand, MAF correctlycaptured 29% of buggy classes missed by DCBM, while26% of the buggy classes were correctly classified byboth models. An example of class correctly classifiedby DCBM and missed by MAF can be found in thepackage org.apache.drill.common.config of theApache Drill project, where the class DrillConfigwas changed by three developers during the time pe-riod between November 2014 and January 2015. Suchdevelopers mainly worked on this and other classesof the same package (they can be considered as own-ers of the DrillConfig class), but they also appliedchanges to components structurally distant from it.For this reason, the sum of structural and semanticscattering increased and our model was able to cor-rectly classify DrillConfig as buggy. On the otherhand, an example of class correctly classified by MAFand missed by DCBM is LogManager of the packageorg.apache.log4j from the Log4j project. Here thetwo developers working on the component betweenMarch 2006 and May 2006 applied several changes to
TABLE 9Overlap Analysis between DCBM and BCCM
System DCBM ∩ DCBM \ BCCM \BCCM % BCCM % DCBM %
AMQ 23 32 45Ant 39 37 24Aries 24 39 37Camel 19 43 38CXF 20 44 36Drill 27 47 26Falcon 34 40 26Felix 29 38 34JMeter 28 45 27JS2 21 40 39Log4j 16 67 17Lucene 16 45 39Oak 29 37 34OpenEJB 36 35 28OpenJPA 19 36 45Pig 31 39 30Pivot 34 46 20Poi 37 33 30Ranger 40 44 16Shindig 31 33 36Sling 16 31 53Sqoop 32 49 19Sshd 18 36 46Synapse 20 31 49Whirr 40 48 12Xerces 22 43 35Overall 29 42 29
this class, as well as related classes belonging to differentpackages. Such related updates decreased the semanticscattering accumulated by developers.
Thus, DCBM did not classify the instance as buggy,while MAF correctly detect less focused attention on theclass and marked the class as buggy.
Finally, looking at Table 12, we can see that ourapproach identifies 43% of buggy classes missed by theother four techniques, as compared to 24% of BCCM, 8%of DM, 18% of MAF, and 7% of CM. This confirms that(i) our model captures something missed by the com-petitive models, and (ii) by combining our model withBCCM/DM/MAF/CM (RQ3) we could further improvethe detection accuracy of our technique. An example ofa buggy class detected only by DCBM can be foundin the Apache Ant system. The class Exit belonging tothe package org.apache.tools.ant.taskdefs hasbeen modified just once by a single developer in the timeperiod going from January 2004 to April 2004. However,the sum of the structural and semantic scattering in thatperiod was very high for the involved developer (461.61and 5,603.19, respectively), who modified a total of 38classes spread over 6 subsystems. In the considered timeperiod the DM does not identify Exit as buggy giventhe single developer who worked on it, and the BCCMfails too due to the single change Exit underwent be-tween January and April 2004. Similarly, the CM modelis not able to identify this class as buggy due to its lowcomplexity and small size.
Conversely, an example of buggy class notdetected by DCBM is represented by the class

16
TABLE 10Overlap Analysis between DCBM and CM
System DCBM ∩ DCBM \ CM \CM % CM % DCBM %
AMQ 10 65 25Ant 8 68 24Aries 12 58 30Camel 22 53 25CXF 7 84 9Drill 5 73 22Falcon 18 79 3Felix 15 68 17JMeter 15 78 7JS2 6 88 6Log4j 11 87 2Lucene 11 77 12Oak 14 83 3OpenEJB 6 88 6OpenJPA 18 67 15Pig 16 75 9Pivot 13 78 9Poi 14 75 11Ranger 21 75 5Shindig 7 82 11Sling 7 82 11Sqoop 9 86 5Sshd 15 72 13Synapse 18 63 19Whirr 8 85 7Xerces2-j 39 59 2Overall 13 78 9
AbstractEntityManager belonging to the packageorg.apache.ivory.resource of the Apache Falconproject.
Here we found 49 changes occurring on the class onthe time period going from October 2012 to January 2013applied by two developers. The sum of the structuraland semantic scattering metrics in this time period wasvery low for both the involved developers (14.77 isthe sum for the first developer, 18.19 for the secondone). Indeed, the developers in that period only applychanges to another subsystem. This is the reason whyour prediction model is not able to mark this class asbuggy. On the other hand, BCCM and MAF predictionmodels successfully identify the buggyness of the classexploiting the information about the number of changesand ownership, respectively. DM fails due to the lownumber of developers involved in the change processof the class. Finally, CM is not able to correctly classifythis class as buggy because of the low complexity of theclass.
Summary for RQ2. The analysis of the comple-mentarity between our approach and the fourcompetitive techniques showed that the proposedscattering metrics are highly complementary withrespect to the metrics exploited by the baselineapproaches, paving the way to “hybrid” modelscombining multiple predictors.
TABLE 11Overlap Analysis between DCBM and MAF
System DCBM ∩ DCBM \ MAF \MAF % MAF % DCBM %
AMQ 24 47 29Ant 23 46 31Aries 32 47 21Camel 19 51 29CXF 20 50 31Drill 23 43 34Falcon 19 42 39Felix 24 56 20JMeter 25 53 22JS2 23 40 37Log4j 26 45 30Lucene 31 41 28Oak 26 46 28OpenEJB 28 49 24OpenJPA 22 46 32Pig 25 44 31Pivot 26 55 19Poi 27 44 29Ranger 27 41 32Shindig 27 46 27Sling 21 37 42Sqoop 33 43 24Sshd 19 40 41Synapse 21 56 23Whirr 27 53 20Xerces2-j 30 42 28Overall 26 45 29
Fig. 4. Boxplot of the average F-Measure achieved bythe 2,036 combinations of predictors experimented in ourstudy.
60 65 70 75 80
5.3 RQ3: A “Hybrid” Prediction ModelTable 13 shows the results obtained while investigatingthe creation of a “hybrid” bug prediction model, ex-ploiting a combination of predictors used by the fiveexperimented models.
The top part of Table 13 (i.e., Performances of each ex-perimented model) reports the average performances—in terms of AUC-ROC, accuracy, precision, recall, and F-measure—achieved by each of the five experimented bugprediction models. As already discussed in the contextof RQ1, our DCBM model substantially outperforms thecompetitive ones. Such values only serve as a referenceto better interpret the results of the different hybrid
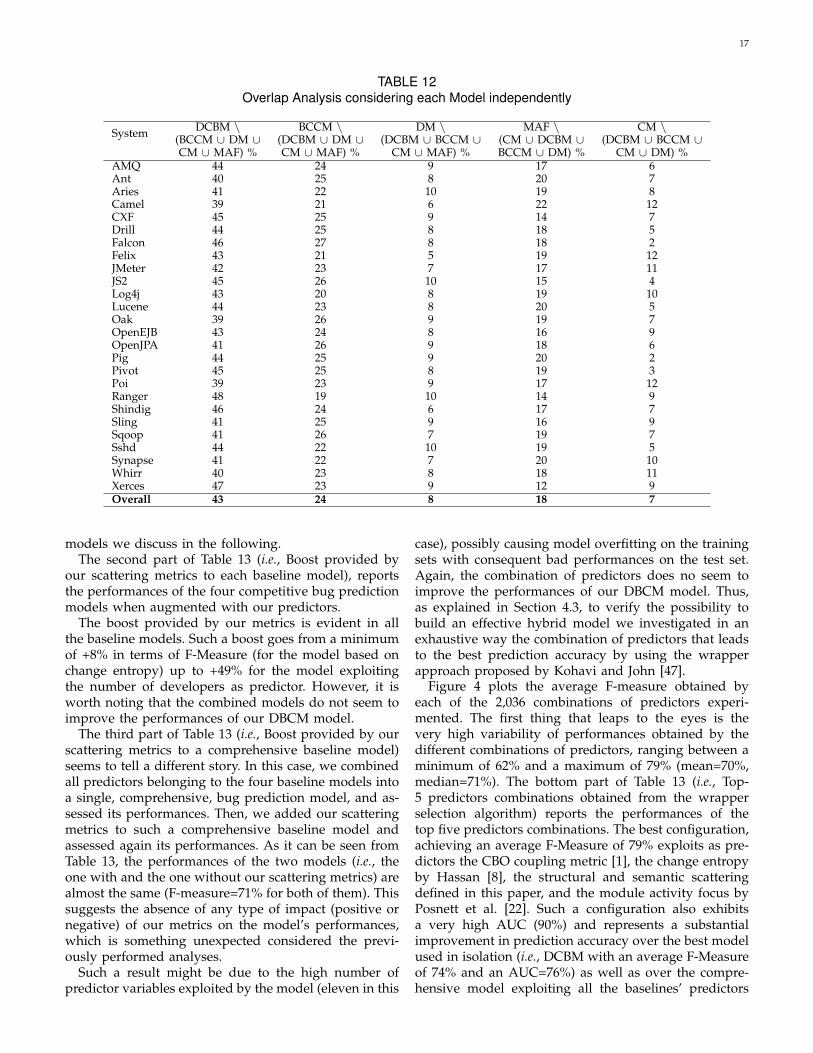
17
TABLE 12Overlap Analysis considering each Model independently
System DCBM \ BCCM \ DM \ MAF \ CM \(BCCM ∪ DM ∪ (DCBM ∪ DM ∪ (DCBM ∪ BCCM ∪ (CM ∪ DCBM ∪ (DCBM ∪ BCCM ∪CM ∪ MAF) % CM ∪ MAF) % CM ∪ MAF) % BCCM ∪ DM) % CM ∪ DM) %
AMQ 44 24 9 17 6Ant 40 25 8 20 7Aries 41 22 10 19 8Camel 39 21 6 22 12CXF 45 25 9 14 7Drill 44 25 8 18 5Falcon 46 27 8 18 2Felix 43 21 5 19 12JMeter 42 23 7 17 11JS2 45 26 10 15 4Log4j 43 20 8 19 10Lucene 44 23 8 20 5Oak 39 26 9 19 7OpenEJB 43 24 8 16 9OpenJPA 41 26 9 18 6Pig 44 25 9 20 2Pivot 45 25 8 19 3Poi 39 23 9 17 12Ranger 48 19 10 14 9Shindig 46 24 6 17 7Sling 41 25 9 16 9Sqoop 41 26 7 19 7Sshd 44 22 10 19 5Synapse 41 22 7 20 10Whirr 40 23 8 18 11Xerces 47 23 9 12 9Overall 43 24 8 18 7
models we discuss in the following.The second part of Table 13 (i.e., Boost provided by
our scattering metrics to each baseline model), reportsthe performances of the four competitive bug predictionmodels when augmented with our predictors.
The boost provided by our metrics is evident in allthe baseline models. Such a boost goes from a minimumof +8% in terms of F-Measure (for the model based onchange entropy) up to +49% for the model exploitingthe number of developers as predictor. However, it isworth noting that the combined models do not seem toimprove the performances of our DBCM model.
The third part of Table 13 (i.e., Boost provided by ourscattering metrics to a comprehensive baseline model)seems to tell a different story. In this case, we combinedall predictors belonging to the four baseline models intoa single, comprehensive, bug prediction model, and as-sessed its performances. Then, we added our scatteringmetrics to such a comprehensive baseline model andassessed again its performances. As it can be seen fromTable 13, the performances of the two models (i.e., theone with and the one without our scattering metrics) arealmost the same (F-measure=71% for both of them). Thissuggests the absence of any type of impact (positive ornegative) of our metrics on the model’s performances,which is something unexpected considered the previ-ously performed analyses.
Such a result might be due to the high number ofpredictor variables exploited by the model (eleven in this
case), possibly causing model overfitting on the trainingsets with consequent bad performances on the test set.Again, the combination of predictors does no seem toimprove the performances of our DBCM model. Thus,as explained in Section 4.3, to verify the possibility tobuild an effective hybrid model we investigated in anexhaustive way the combination of predictors that leadsto the best prediction accuracy by using the wrapperapproach proposed by Kohavi and John [47].
Figure 4 plots the average F-measure obtained byeach of the 2,036 combinations of predictors experi-mented. The first thing that leaps to the eyes is thevery high variability of performances obtained by thedifferent combinations of predictors, ranging between aminimum of 62% and a maximum of 79% (mean=70%,median=71%). The bottom part of Table 13 (i.e., Top-5 predictors combinations obtained from the wrapperselection algorithm) reports the performances of thetop five predictors combinations. The best configuration,achieving an average F-Measure of 79% exploits as pre-dictors the CBO coupling metric [1], the change entropyby Hassan [8], the structural and semantic scatteringdefined in this paper, and the module activity focus byPosnett et al. [22]. Such a configuration also exhibitsa very high AUC (90%) and represents a substantialimprovement in prediction accuracy over the best modelused in isolation (i.e., DCBM with an average F-Measureof 74% and an AUC=76%) as well as over the compre-hensive model exploiting all the baselines’ predictors

18
TABLE 13RQ3: Performances of “hybrid” prediction models
Avg. AUC-ROC Avg. Accuracy Avg. Precision Avg. Recall Avg. F-measurePerformances of each experimented modelDM 51 24 19 25 21BCCM 63 70 61 69 64CM 52 46 44 45 44MAF 62 65 59 64 61DCBM 76 77 72 77 74
Boost provided by our scattering metrics to each baseline modelDM + Struct-scattering + Seman-scattering 78 71 73 68 70BCCM + Struct-scattering + Seman-scattering 77 70 76 69 72CM + Struct-scattering + Seman-scattering 76 70 73 70 71MAF + Struct-scattering + Seman-scattering 77 70 73 70 71
Boost provided by our scattering metrics to a comprehensive baseline model# Developers, Entropy, LOC, CBO, LCOM, NOM, RFC, WMC, MAF 78 69 73 68 71# Developers, Entropy, LOC, CBO, LCOM, NOM, RFC, WMC, MAF, Struct-scattering, Seman-scattering 76 71 72 71 71
Top-5 predictors combinations obtained from the wrapper selection algorithmCBO, Change Entropy, Struct-scattering, Seman-scattering, MAF 90 85 77 81 79LOC, LCOM, Change Entropy, Seman-scattering, # Developers, MAF 78 72 77 77 77LOC, NOM, WMC, Change Entropy, Struct-scattering 78 70 77 75 76LOC, LCOM, NOM, Seman-scattering 77 70 75 75 75LOC, CBO, LCOM, NOM, RFC, Struct-scattering, Seman-scattering 77 71 76 73 75
in combinations (+8% in terms of F-Measure). Such aresult supports our conjecture that blindly combiningpredictors (as we did in the comprehensive model) couldresult in sub-optimal performances likely due to modeloverfitting.
Interestingly, the best combination of baselines’ predic-tors (i.e., all predictors from the four competitive models)obtained as result of the wrapper approach is composedof BCCM (i.e., entropy of changes), MAF, and the RFCand WMC metrics from the CM model, and achieves70% in terms of F-Measure (9% less with respect to thebest combination of predictors which also exploits ourscattering metrics).
We also statistically compare the prediction accuracyobtained across the 26 subject systems by the best-performing “hybrid” configuration and the best per-forming model. Also in this case, we exploited the Mann-Whitney test [49] for this statistical test, as well asthe Cliff’s Delta [50] to estimate the magnitude of themeasured differences. We observed a statistically signifi-cant difference (p-value=0.03) with a medium effect size(d = 0.36).
Looking at the predictors more frequently exploited inthe five most accurate prediction models, we found that:
1) Semantic-scattering, LOC. Our semantic predictorand the LOC are present in 4 out of the 5 mostaccurate prediction models. This confirms the well-known bug prediction power of the size metrics(LOC) and suggests the importance for developersto work on semantically related code componentsin the context of a given maintenance/evolutionactivity.
2) Change entropy, LCOM, Structural-scattering. Thesepredictors are present in 3 out of the 5 most accu-rate prediction models. This confirms that (i) thechange entropy is a good predictor for buggy codecomponents [8]), (ii) classes exhibiting low cohe-sion can be challenging to maintain for developers[1], and (iii) scattered changes performed acrossdifferent subsystems can increase the chances of
introducing bugs.In general, the results of all our three research ques-
tions seem to confirm the observations made D’Ambroset al. [15]: no technique based on a single metric worksbetter in all contexts. This is why the combination ofmultiple predictors can provide better results. We areconfident that plugging other orthogonal predictors inthe “hybrid” prediction model could further increase theprediction accuracy.
Summary for RQ3. By combining the eleven pre-dictors exploited by the five prediction modelssubject of our study it is possible to obtain a boostof prediction accuracy up to +5% with respect tothe best performing model (i.e., DCBM) and +9%with respect to the best combination of baselinepredictors. Also, the top five “hybrid” predictionmodels include at least one of the predictors pro-posed in this work (i.e., the structural and semanticscattering of changes) and the best model includesboth.
6 THREATS TO VALIDITY
This section describes the threats that can affect thevalidity our study. Threats to construct validity concernthe relation between the theory and the observation, andin this work are mainly due to the measurements weperformed. This is the most important type of threat forour study and it is related to:• Missing or wrong links between bug tracking systems
and versioning systems [51]: although not much canbe done for missing links, as explained in the designwe verified that links between commit notes andissues were correct;
• Imprecision due to tangled code changes [52]. We can-not exclude that some commits we identified asbug-fixes grouped together tangled code changes,of which just a subset represented the committedpatch.
19
• Imprecision in issue classification made by issue-trackingsystems [19]: while we cannot exclude misclassifica-tion of issues (e.g., an enhancement classified as abug), at least all the systems considered in our studyused Bugzilla as issue tracking system, explicitlypointing to bugs in the issue type field;
• Undocumented bugs present in the system: while werelied on the issue tracker to identify the bugs fixedduring the change history of the object systems, itis possible that undocumented bugs were presentin some classes, leading to wrong classifications ofbuggy classes as “clean” ones.
• Approximations due to identifying fix-inducing changesusing the SZZ algorithm [45]: at least we used heuris-tics to limit the number of false positives, for exam-ple excluding blank and comment lines from the setof fix-inducing changes.
Threats to internal validity concern external factors wedid not consider that could affect the variables beinginvestigated. We computed the developer’s scatteringmeasures by analyzing the developers’ activity on asingle software system. However, it is well known that,especially in open source communities and ecosystems,developers contribute to multiple projects in parallel[53]. This might negatively influence the “developer’sscattering” assessment made by our metrics. Still, theresults of our approach can only improve by consideringmore sophisticated ways of computing our metrics.
Threats to conclusion validity concern the relation be-tween the treatment and the outcome. The metrics usedin order to evaluate our defect prediction approach (i.e.,accuracy, precision, recall, F-Measure, and AUC), arewidely used in the evaluation of the performances ofdefect prediction techniques [15]. Moreover, we usedappropriate statistical procedures, (i.e., PCA [54]), andthe computation of overlap metrics to study the orthog-onality between our model and the competitive ones.
Since we had the necessity to exploit change-historyinformation to compute the scattering metrics we pro-posed, the evaluation design adopted in our study isdifferent from the k-fold cross validation [55] generallyexploited while evaluating bug prediction techniques.In particular, we split the change-history of the objectsystems into three-month time periods and we adopteda three-month sliding window to train and test theexperimented bug prediction models. This type of vali-dation is typically adopted when using process metricsas predictors [8], although it might be penalizing whenusing product metrics, which are typically assessed us-ing a ten-fold cross validation. Furthermore, althoughwe selected a model exploiting a set of product metricspreviously shown to be effective in the context of bugprediction [1], the poor performances of the CM modelmight be due to the fact that the model relies on toomany predictors, resulting in a model overfitting. Thisconjecture is supported by the results achieved in thecontext of RQ3, where we found that the top five “hy-
brid” prediction models include only a subset of codemetrics.
Threats to external validity concern the generalizationof results. We analyzed 26 Apache systems from differentapplication domains and with different characteristics(number of developers, size, number of classes, etc).
However, systems from different ecosystems shouldbe analyzed to corroborate our findings.
7 CONCLUSION AND FUTURE WORK
A lot of effort has been devoted in the last decade toanalyze the influence of the development process onthe likelihood of introducing bugs. Several empiricalstudies have been carried out to assess under whichcircumstances and during which coding activities devel-opers tend to introduce bugs. In addition, bug predictiontechniques built on top of process metrics have beenproposed. However, changes in source code are made bydevelopers that often work under stressing conditionsdue to the need of delivering their work as soon aspossible.
The role of developer-related factors in the bug pre-diction field is still a partially explored area. This papermakes a further step ahead, by studying the role playedby the developer’s scattering in bug prediction. Specifically,we defined two measures that consider the amount ofcode components a developer modifies in a given timeperiod and how these components are spread struc-turally (structural scattering) and in terms of the responsi-bilities they implement (semantic scattering). The definedmeasures have been evaluated as bug predictors in anempirical study performed on 26 open source systems.In particular, we built a prediction model exploiting ourmeasures and compared its prediction accuracy withfour baseline techniques exploiting process metrics aspredictors. The achieved results showed the superiorityof our model and its high level of complementarity withrespect to the considered competitive techniques. Wealso built and experimented a “hybrid” prediction modelon top of the eleven predictors exploited by the fivecompetitive techniques. The achieved results show that(i) the “hybrid” is able to achieve a higher accuracy withrespect to each of the five models taken in isolation, and(ii) the predictors proposed in this paper play a majorrole in the best performing “hybrid” prediction models.
Our future research agenda includes a deeper inves-tigation of the factors causing scattering to developers,and negatively impacting their ability of dealing withcode change tasks. We plan to reach such an objectiveby performing a large survey with industrial and opensource developers. We also plan to apply our techniqueat different levels of granularity, to verify if we can pointout buggy code components at a finer granularity level(e.g., methods).

20
REFERENCES[1] V. Basili, L. Briand, and W. Melo, “A validation of object-oriented
design metrics as quality indicators,” Software Engineering, IEEETransactions on, vol. 22, no. 10, pp. 751–761, Oct 1996.
[2] T. Gyimothy, R. Ferenc, and I. Siket, “Empirical validation ofobject-oriented metrics on open source software for fault pre-diction,” IEEE Transactions on Software Engineering (TSE), vol. 31,no. 10, pp. 897–910, 2005.
[3] N. Ohlsson and H. Alberg, “Predicting fault-prone software mod-ules in telephone switchess,” Software Engineering, IEEE Transac-tions on, vol. 22, no. 12, p. 886894, 1996.
[4] N. Nagappan and T. Ball, “Static analysis tools as earlyindicators of pre-release defect density,” in Proceedings of the27th International Conference on Software Engineering, ser. ICSE’05. New York, NY, USA: ACM, 2005, pp. 580–586. [Online].Available: http://doi.acm.org/10.1145/1062455.1062558
[5] T. Zimmermann, R. Premraj, and A. Zeller, “Predicting defectsfor eclipse,” in Proceedings of the Third International Workshopon Predictor Models in Software Engineering, ser. PROMISE ’07.Washington, DC, USA: IEEE Computer Society, 2007, pp. 9–.[Online]. Available: http://dx.doi.org/10.1109/PROMISE.2007.10
[6] A. N. Taghi M. Khoshgoftaar, Nishith Goel and J. McMullan,“Detection of software modules with high debug code churn ina very large legacy system,” in Software Reliability Engineering.IEEE, 1996, pp. 364–371.
[7] J. S. M. Todd L. Graves, Alan F. Karr and H. P. Siy, “Predictingfault incidence using software change history,” Software Engineer-ing, IEEE Transactions on, vol. 26, no. 7, pp. 653–661, 2000.
[8] A. E. Hassan, “Predicting faults using the complexity of codechanges,” in ICSE. Vancouver, Canada: IEEE Press, 2009, pp.78–88.
[9] R. Bell, T. Ostrand, and E. Weyuker, “The limited impact of indi-vidual developer data on software defect prediction,” EmpiricalSoftware Engineering, vol. 18, no. 3, pp. 478–505, 2013. [Online].Available: http://dx.doi.org/10.1007/s10664-011-9178-4
[10] T. J. Ostrand, E. J. Weyuker, and R. M. Bell, “Programmer-basedfault prediction,” in Proceedings of the 6th International Conferenceon Predictive Models in Software Engineering, ser. PROMISE ’10.New York, NY, USA: ACM, 2010, pp. 19:1–19:10. [Online].Available: http://doi.acm.org/10.1145/1868328.1868357
[11] R. Moser, W. Pedrycz, and G. Succi, “Analysis of the reliability ofa subset of change metrics for defect prediction,” in Proceedingsof the Second ACM-IEEE International Symposium on EmpiricalSoftware Engineering and Measurement, ser. ESEM ’08. NewYork, NY, USA: ACM, 2008, pp. 309–311. [Online]. Available:http://doi.acm.org/10.1145/1414004.1414063
[12] R. M. Bell, T. J. Ostrand, and E. J. Weyuker, “Does measuringcode change improve fault prediction?” in Proceedings of the 7thInternational Conference on Predictive Models in Software Engineering,ser. Promise ’11. New York, NY, USA: ACM, 2011, pp. 2:1–2:8.[Online]. Available: http://doi.acm.org/10.1145/2020390.2020392
[13] W. P. Raimund Moser and G. Succi, “A comparative analysis ofthe efficiency of change metrics and static code attributes for de-fect prediction,” in International Conference on Software Engineering(ICSE), ser. ICSE ’08, 2008, pp. 181–190.
[14] N. Nagappan, T. Ball, and A. Zeller, “Mining metrics to predictcomponent failures,” in Proceedings of the 28th InternationalConference on Software Engineering, ser. ICSE ’06. New York,NY, USA: ACM, 2006, pp. 452–461. [Online]. Available: http://doi.acm.org/10.1145/1134285.1134349
[15] M. DAmbros, M. Lanza, and R. Robbes, “Evaluating defect pre-diction approaches: a benchmark and an extensive comparison,”Empirical Software Engineering, vol. 17, no. 4, p. 531577, 2012.
[16] J. Sliwerski, T. Zimmermann, and A. Zeller, “Don’t program onfridays! how to locate fix-inducing changes,” in Proceedings of the7th Workshop Software Reengineering, May 2005.
[17] L. T. Jon Eyolfso and P. Lam, “Do time of day and developerexperience affect commit bugginess?” in Proceedings of the 8thWorking Conference on Mining Software Repositories, ser. MSR ’11,2011, pp. 153–162.
[18] F. Rahman and P. Devanbu, “Ownership, experience and defects:a fine-grained study of authorship,” in Proceedings of the 33rdInternational Conference on Software Engineering, ser. ICSE ’11, 2011,pp. 491–500.
[19] E. J. W. J. Sunghun Kim and Y. Zhang, “Classifying softwarechanges: Clean or buggy?” IEEE Transactions on Software Engineer-ing (TSE), vol. 34, no. 2, pp. 181–196, 2008.
[20] C. Bird, N. Nagappan, B. Murphy, H. Gall, and P. Devanbu,“Don’t touch my code!: Examining the effects of ownership onsoftware quality,” in Proceedings of the 19th ACM SIGSOFT Sym-posium and the 13th European Conference on Foundations of SoftwareEngineering, ser. ESEC/FSE ’11. ACM, 2011, pp. 4–14.
[21] G. Bavota, B. De Carluccio, A. De Lucia, M. Di Penta, R. Oliveto,and O. Strollo, “When does a refactoring induce bugs? an em-pirical study,” in Proceedings of the 12th International WorkingConference on Source Code Analysis and Manipulation, ser. SCAM’12, 2012, pp. 104–113.
[22] D. Posnett, R. D’Souza, P. Devanbu, and V. Filkov, “Dual ecologi-cal measures of focus in software development,” in Proceedings ofthe 2013 International Conference on Software Engineering, ser. ICSE’13. IEEE Press, 2013, pp. 452–461.
[23] D. D. Nucci, F. Palomba, S. Siravo, G. Bavota, R. Oliveto, andA. D. Lucia, “On the role of developer’s scattered changes in bugprediction,” in Proceedings of the 31st International Conference onSoftware Maintenance and Evolution, ICSME ’15, Bremen, Germany,2015, pp. 241–250.
[24] V. Basili, G. Caldiera, and D. H. Rombach, The Goal Question MetricParadigm. John Wiley and Sons, 1994.
[25] D. D. Nucci, F. Palomba, G. D. Rosa, G. Bavota, R. Oliveto,and A. D. Lucia. (2016) A developer centered bug predictionmodel - replication package - https://figshare.com/articles/ADeveloper Centered Bug Prediction Model/3435299.
[26] W. M. Khaled El Emam and J. C. Machado, “The prediction offaulty classes using object-oriented design metrics,” Journal ofSystems and Software, vol. 56, no. 1, p. 6375, 2001.
[27] R. Subramanyam and M. S. Krishnan, “Empirical analysis ofck metrics for object-oriented design complexity: Implicationsfor software defects,” Software Engineering, IEEE Transactions on,vol. 29, no. 4, p. 297310, 2003.
[28] A. P. Nikora and J. C. Munson, “Developing fault predictorsfor evolving software systems,” in Proceedings of the 9th IEEEInternational Symposium on Software Metrics. IEEE CS Press, 2003,pp. 338–349.
[29] Y. Zhou, B. Xu, and H. Leung, “On the ability of complexitymetrics to predict fault-prone classes in object-oriented systems,”Journal of Systems and Software, vol. 83, no. 4, pp. 660–674, 2010.
[30] N. Nagappan and T. Ball, “Use of relative code churn measures topredict system defect density,” in Software Engineering, 2005. ICSE2005. Proceedings. 27th International Conference on. IEEE, 2005, pp.284–292.
[31] A. E. Hassan and R. C. Holt, “Studying the chaos of codedevelopment,” in Proceedings of the 10th Working Conference onReverse Engineering, 2003.
[32] ——, “The top ten list: dynamic fault prediction,” in Proceedingsof the 21st IEEE International Conference on Software Maintenance,2005, ser. ICSM ’05. IEEE Computer Society, 2005, pp. 263–272.
[33] S. Kim, T. Zimmermann, E. J. Whitehead Jr, and A. Zeller,“Predicting faults from cached history,” in Proceedings of the 29thinternational conference on Software Engineering. IEEE ComputerSociety, 2007, pp. 489–498.
[34] N. Nagappan, A. Zeller, T. Zimmermann, K. Herzig, and B. Mur-phy, “Change bursts as defect predictors,” in Software ReliabilityEngineering (ISSRE), 2010 IEEE 21st International Symposium on.IEEE, 2010, pp. 309–318.
[35] R. M. Bell, T. J. Ostrand, and E. J. Weyuker, “Looking for bugsin all the right places,” in Proceedings of the 2006 internationalsymposium on Software testing and analysis. ACM, 2006, pp. 61–72.
[36] S. R. Chidamber and C. F. Kemerer, “A metrics suite for objectoriented design,” IEEE Transactions on Software Engineering (TSE),vol. 20, no. 6, pp. 476–493, June 1994.
[37] G. Bavota, A. D. Lucia, A. Marcus, and R. Oliveto, “Usingstructural and semantic measures to improve software modular-ization,” Empirical Software Engineering, vol. 18, no. 5, pp. 901–932,2013.
[38] R. Baeza-Yates and B. Ribeiro-Neto, Modern Information Retrieval.Addison-Wesley, 1999.
[39] L. M. Y. Freund, “The alternating decision tree learning algo-rithm,” in Proceeding of the Sixteenth International Conference onMachine Learning, 1999, pp. 124–133.
[40] R. Kohavi, “The power of decision tables,” in 8th European Con-ference on Machine Learning. Springer, 1995, pp. 174–189.
[41] S. le Cessie and J. van Houwelingen, “Ridge estimators in logisticregression,” Applied Statistics, vol. 41, no. 1, pp. 191–201, 1992.
21
[42] F. Rosenblatt, Principles of Neurodynamics: Perceptrons and the The-ory of Brain Mechanisms. Spartan Books, 1961.
[43] G. H. John and P. Langley, “Estimating continuous distributionsin bayesian classifiers,” in Eleventh Conference on Uncertainty inArtificial Intelligence. San Mateo: Morgan Kaufmann, 1995, pp.338–345.
[44] T. Menzies, B. Caglayan, Z. He, E. Kocaguneli, J. Krall,F. Peters, and B. Turhan. (2012, June) The promise repositoryof empirical software engineering data. [Online]. Available:http://promisedata.googlecode.com
[45] J. Sliwerski, T. Zimmermann, and A. Zeller, “When do changesinduce fixes?” in Proceedings of the 2005 International Workshop onMining Software Repositories, MSR 2005. ACM, 2005.
[46] L. Moonen, “Generating robust parsers using island grammars,”in Reverse Engineering, 2001. Proceedings. Eighth Working Conferenceon, 2001, pp. 13–22.
[47] R. Kohavi and G. H. John, “Wrappers for feature subset selection,”Artif. Intell., vol. 97, no. 1-2, pp. 273–324, Dec. 1997. [Online].Available: http://dx.doi.org/10.1016/S0004-3702(97)00043-X
[48] S. Mancoridis, B. S. Mitchell, C. Rorres, Y.-F. Chen, and E. R.Gansner, “Using automatic clustering to produce high-level sys-tem organizations of source code,” in Proccedings of 6th Interna-tional Workshop on Program Comprehension. Ischia, Italy: IEEE CSPress, 1998.
[49] W. J. Conover, Practical Nonparametric Statistics, 3rd ed. Wiley,1998.
[50] R. J. Grissom and J. J. Kim, Effect sizes for research: A broad practicalapproach, 2nd ed. Lawrence Earlbaum Associates, 2005.
[51] C. Bird, A. Bachmann, E. Aune, J. Duffy, A. Bernstein, V. Filkov,and P. Devanbu, “Fair and balanced?: Bias in bug-fix datasets,”in Proceedings of the the 7th Joint Meeting of the European SoftwareEngineering Conference and the ACM SIGSOFT Symposium on TheFoundations of Software Engineering, ser. ESEC/FSE ’09. NewYork, NY, USA: ACM, 2009, pp. 121–130. [Online]. Available:http://doi.acm.org/10.1145/1595696.1595716
[52] K. Herzig and A. Zeller, “The impact of tangled code changes,”in Proceedings of the 10th Working Conference on Mining SoftwareRepositories, MSR ’13, San Francisco, CA, USA, May 18-19, 2013,2013, pp. 121–130.
[53] G. Bavota, G. Canfora, M. Di Penta, R. Oliveto, and S. Panichella,“The evolution of project inter-dependencies in a software ecosys-tem: The case of apache,” in Software Maintenance (ICSM), 201329th IEEE International Conference on, Sept 2013, pp. 280–289.
[54] I. Jolliffe, Principal Component Analysis. John Wiley & Sons, Ltd,2005. [Online]. Available: http://dx.doi.org/10.1002/0470013192.bsa501
[55] P. A. Devijver and J. Kittler, Pattern Recognition: A StatisticalApproach, 1982.