Embed Size (px)
Citation preview

THE THIRD GENERATION RELATIVE DETECTION EFFICIENCY MODEL FOR THE BRAZILIAN LIGHTNING DETECTION NETWORK (BRASILDAT)
K. P. Naccarato; O. Pinto Jr. Instituto Nacional de Pesquisas Espaciais (INPE)
Sao Jose dos Campos, Brazil
1. INTRODUCTION
Like any other measurement system, a lightning detection network (LDN) has its own limitations. Perhaps the most significant one is its detection efficiency (DE) or the ratio of the number of detected events by the actual number of events. Therefore, the better the LDN is, it will not be able to detect all cloud-to-ground (CG) lightning events without losing at least a few of them. These losses can be highly significant due to sensors faults, communication problems or unfavorable network geometry, which leads to distortions in data (Schulz. 1997; Naccarato. 2006). Furthermore, the type of the sensors plays a very important role. It is well established that the two existing technologies: Time of Arrival(TOA) and Magnetic Direct Finding (MDF) have its advantages and limitations. A high performance network is obtained only when the distribution of the sensors (as well as their types) is relatively homogeneous over all the covered area. Unbalanced networks (with more sensors of one technology and/or particular areas covered by much more sensors than others) clearly tend to present lower performance in terms of DE (Naccarato et al. 2004a).
One of the primary motivations for evaluating the LDN performance (particularly its DE) is its effect over the actual climatological variations in CG lightning parameters provided by the network (Cummins and Bardo, 2004). In Brazil, this is particularly important because the network has been changing its configuration during the last years. Figure 1 shows the present configuration of the Brazilian Lightning Detection Network (BrasilDAT), which is composed by 47 sensors as a result of the integration of three other regional networks: SIDDEM, SIPAM and RINDAT. Thus, the whole network has both LPATS and IMPACT sensor, which are based on the TOA and MDF technologies, respectively (Cummins et al. 1998; Naccarato. 2006).
Figure 1 - The Brazilian Lightning Detection Network (BrasilDAT), which is composed by 47 sensors from the integration of three regional
networks: SIDDEM, SIPAM and RINDAT.
This paper presents a new approach for a relative detection efficiency model (RDEM). The 3rd. generation model (RDEM3) is an extension of the previous models (Naccarato et al. 2004b, 2006a), which were based on the development of Murphy et al. (2002) for the National Lightning Detection Network (NLDN), Rompala et al. (2003) for a small LDN installed by NASA in the north region of Brazil, and Schulz (1997) for the Austrian lightning detection network (ALDIS). In addition to the previous features, which include changing the sensor network configuration and considering the different type of sensors currently in use in Brazil, the new RDEM3 brings a new algorithm that takes into account the “border effect” caused by the reduced number of CG lightning events detected closer to the network boundaries. At
these regions, since almost all sensors are required to get a solution, an artificial increase of the DE occurs, which prevents the model to recover the actual CG flash rates. 2. BRIEF REVIEW OF THE PREVIOUS RDEMS Several approaches for developing a RDEM were already proposed: Schulz and Diendorfer (1996), Murphy et al. (2002) and Rompala et al. (2003). All of them use a set of CG lightning data reported by the network to compute the relative detection efficiency (RDE) of the same network. Since the reference CG lightning dataset is collected over areas associated to higher values of DE, the RDE assessed can be roughly approximated to the absolute detection efficiency (ADE).
Schulz and Diendorfer (1996) and Schulz (1997) were the first to publish a comprehensive and clear methodology of an absolute detection efficiency model (ADEM) based on data from ALDIS. In the two works, they present a model to estimate the network DE for particular peak current amplitude which allowed to correct CG lightning peak current distributions or ground flash densities based on the lightning data from the own network.
The first publications of the GAI/Vaisala ADEM were in 1995 and 1998 (Cummins et al., 1995, 1998). Although the first paper was presented before the ALDIS works, the authors did not describe in details the model, but only a general overview of the methodology. This ADEM computes estimates of the DE on a 50x50km grid over the coverage area of the network. At each grid point, the model generates specific values of peak current and computes the signal strength that should arrive at each sensor in the network using a signal propagation model. The DE model then uses a look-up table to relate the computed signal strength at each sensor to its DE and this produces a probability that the stroke will be detected by that sensor. Murphy et al. (2002) uses a very simple approach to estimate the improvement in the NLDN detection efficiency due to the 2002 upgrade. Two sets of CG lightning data were analyzed: one before and other after the upgrade for the same area and period. The cumulative peak current distribution (PCD) was then computed for the two datasets and the early PCD (before the upgrade) was then fitted to the
new PCD (after the upgrade), which was considered the reference (100% of DE). The ratio between the reference PCD and the fitted PCD represents the RDE improvement of the sensor network.
Rompala et al. (2003) developed a method to estimate the DE contours for the Rondonian lightning detection network in Brazil. They first selected an area in the middle of the network (composed only by 4 IMPACT sensors) that they assume to have the best DE. This region is called central quad (QUAD). The PCD for the lightning data in the QUAD is then computed and adjusted to a theoretical probability distribution function (PDF), which is considered to be representative of the event distribution at any location over the region. Then, the network coverage area is divided in cells of a specified size and the PCD is computed for all the lightning data detected in each cell of this grid. The reference PCD is then applied to each cell to assess what proportion of the set would be detected at each of these points. Finally, the cell DE is taken as the ratio of the computed values and the total number of events.
Combining the Murphy and Rompala methods, the first Brazilian relative detection efficiency model (RDEM1) was a very simple computational tool that could effectively assess the RDE of a LDN with relative high accuracy (Naccarato et al. 2004b). Of course, like any other method that requires real CG lightning datasets, this RDEM was highly dependent on the number of detected events to provide accurate results. Also, the higher the number of events, the longer will be the computational time. The results showed that the correction of the density of CG flashes is effective only for regions with DE between 60% and 80%. For DE values smaller than 60%, the correction cannot counteract the reduced number of events detected by the network, leading to values smaller then expected. Hence, one can say that, for regions of lower DE values, it is quite impossible for a RDEM1 to recover the CG lightning flash density which is much above the actual values. By the other hand, for regions with high DE values (above 80%), the correction does not increase appreciably the number of events, once again decreasing the capacity of the model to recover the actual values of CG flash rates.
The second Brazilian relative detection efficiency model (RDEM2) still needs lightning

data detected by the network (Naccarato et al., 2006a,b), but they are used only to compute the RDE of each sensor, which depends on the peak current and the distance from the event (due to the propagation effects). Thereby, using these individual sensor RDE distributions, the network DE is computed based on the combined probability of each sensor to detect or not an event, considering its distance from each sensor. This reduces drastically the calculations and leads to a very short computational time. The RDEM2 allows changing the sensor network geometry by enabling or disabling specific sensors of the network or including new virtual sensors. Thus, it makes simple and quick to evaluate the impact of different sensors geometries on the overall network DE. Finally, this new approach treats IMPACT and LPATS sensors in different ways, since the IMPACT sensors can report both timing and bearing information while the LPATS sensors can only provide timing data. This feature offers a more precise method for DE calculation that leads to a more accurate result, particularly for regions closer to the network boundary. The results of the RDEM2 show that modifications in the network geometry (which can be due to many different factors) produce different effects on its DE and the developed RDEM2 has enough sensitivity to reproduce most of these effects: (1) the network sensitivity for different peak current ranges; (2) the DE anomalies that are presented around the outmost sensors of the network; (3) variations in the network DE caused by the two different type of sensors (LPATS and IMPACT), which play different roles in producing the solutions. Thus, it is possible to say that the RDEM2 can reproduce with reasonably good accuracy some aspects of a LDN behavior that are directly affected by variations in the sensor network geometry. 3. THE NEW BRAZILIAN RDEM
The two previous models (RDEM1 and RDEM2) presented very interesting results, showing that the model can reproduce several features of the LDN. However, the results still show a “border effect” due to the reduced number of CG flashes detected near to the network boundaries. The new approach presented in this paper, the RDEM3 not only takes into account the peak current values and
the distance of the CG lightning, but it also neglects the solutions for particular sensors called essential (without them there is no solution). Thus, for the outmost areas (near the network boundaries), where most of the sensors are essential, the fake effect of a high DE tends to be removed. Therefore, the model is able to recover the actual CG flash rates at these areas. Furthermore, the RDEM3 can neglect the periods that each sensor of network is offline (due to communications problems or faults) with a daily resolution.
The new RDEM3 calculations are made in three steps: (1) computation of the PDF for each sensor, called the sensor RDE; (2) the choice of a particular spatial resolution over the coverage area, which depends on the amount of data and the size of the analyzed region; (3) calculation of the DE for each grid cell using a recurrent statistical algorithm.
The sensor individual DE curves were assessed based only on the CG lightning data provided by RINDAT regional network (States of São Paulo, Rio de Janeiro, Espírito Santo, Minas Gerais, Goiás and Paraná) from Jan/1999 to Dec/2004, which leads to a relevant and homogeneous dataset. All the curves are then averaged to produce one integrated RDE curve that was used for all sensors (Figure 2). Based on this average curve, the network relative DE is then computed using the same computational algorithm developed by Naccarato et al. (2006a).
0
10
20
30
40
50
60
70
80
0 150 300 450 600 750 900 1050 1200Distance (km)
RD
E (%
)
Figure 2 – Average sensor RDE distribution used by the RDEM3.
As already stated, in order to get more
realistic results, solutions where the sensor participation is essential are neglected. Also, all the days when a specific sensor was offline were
also discarded. A sensor is considered offline in one day when it reports less than 10 lightning events in that day. A sensor is considered essential for a solution, when this solution was gathered with a minimum required number of participating sensors, so that it would not exist without that sensor.
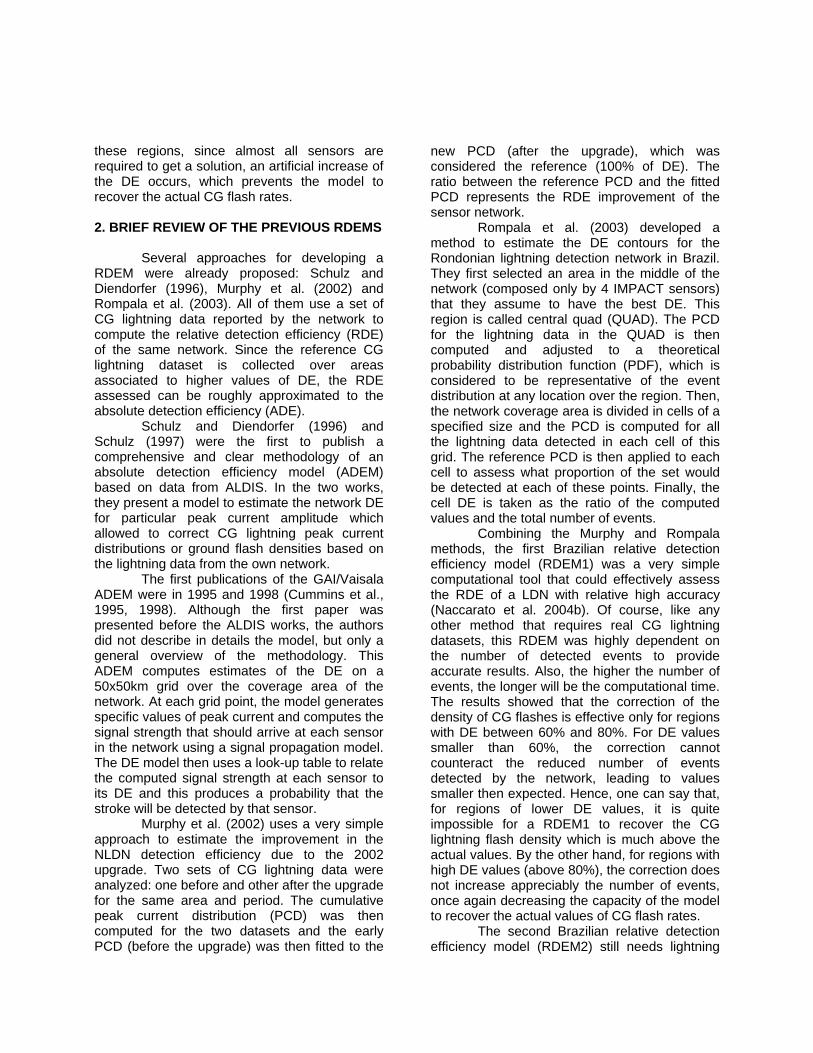
Figure 3 shows the BrasilDAT network DE (47 sensors) computed by the RDEM2 using the average sensor RDE distribution of Figure 2. By the other hand, Figure 4 brings the BrasilDAT network DE computed by RDEM3 using the same average sensor RDE curve. The values shown in magenta represent DE values lower than 30% (minimum values). Similarly, values in white represent DE values greater than 90% (maximum values).
Figure 3 – The BrasilDAT network DE computed by the RDEM2 (25x25km), showing that the DE
values are overestimated by the model particularly closer to the network boundaries.
It can be observed that, for the RDEM3,
the overall network DE is relatively low compared to the results of RDEM2, revealing that RDEM2 overestimate the actual network DE, particularly closer to the outmost sensors. Thus, it can be stated that the model sensitivity was improved by neglecting the solutions that are calculated based on the minimum number of sensors required. Those new improvements incorporated in RDEM3 are thus considered to
reproduce better the actual sensor network performance. It is also expected that this new model could minimize the “border effect”, leading to a much more realistic correction for the CG flash density maps closer to the boundaries of the network coverage area.
Figure 4 – The BrasilDAT network DE computed by the RDEM3 (25x25km), showing much more
realistic DE values particularly closer to the network edges.
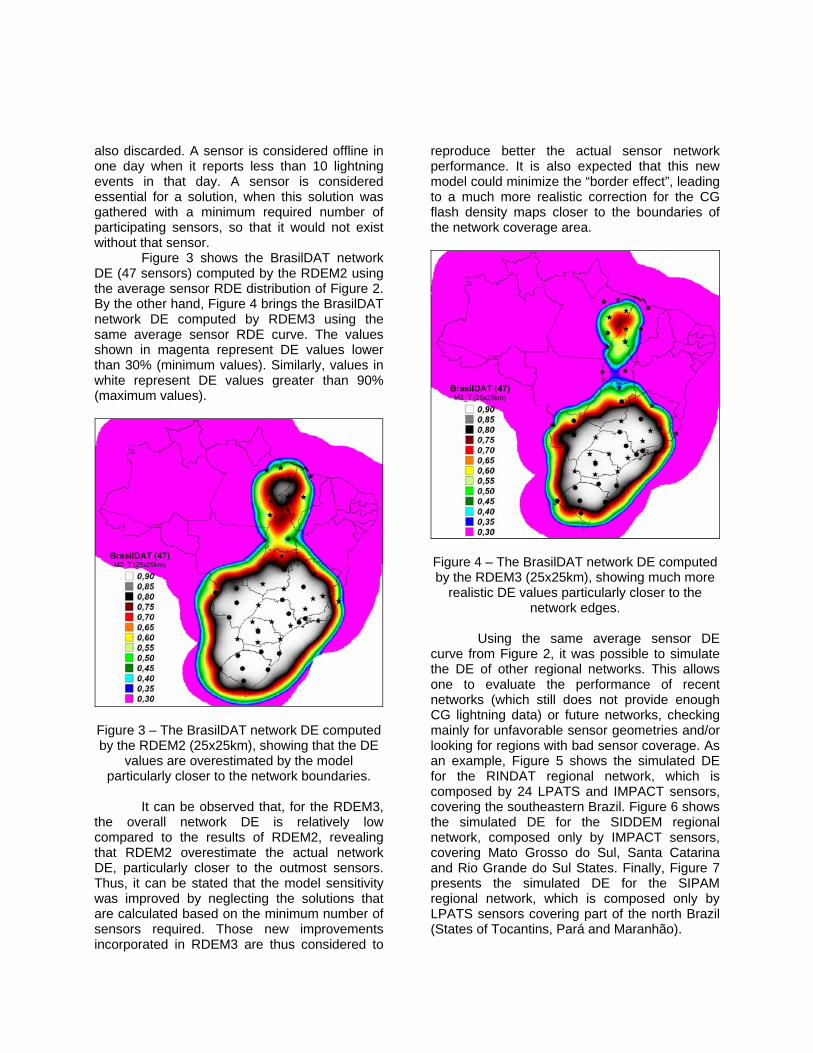
Using the same average sensor DE
curve from Figure 2, it was possible to simulate the DE of other regional networks. This allows one to evaluate the performance of recent networks (which still does not provide enough CG lightning data) or future networks, checking mainly for unfavorable sensor geometries and/or looking for regions with bad sensor coverage. As an example, Figure 5 shows the simulated DE for the RINDAT regional network, which is composed by 24 LPATS and IMPACT sensors, covering the southeastern Brazil. Figure 6 shows the simulated DE for the SIDDEM regional network, composed only by IMPACT sensors, covering Mato Grosso do Sul, Santa Catarina and Rio Grande do Sul States. Finally, Figure 7 presents the simulated DE for the SIPAM regional network, which is composed only by LPATS sensors covering part of the north Brazil (States of Tocantins, Pará and Maranhão).
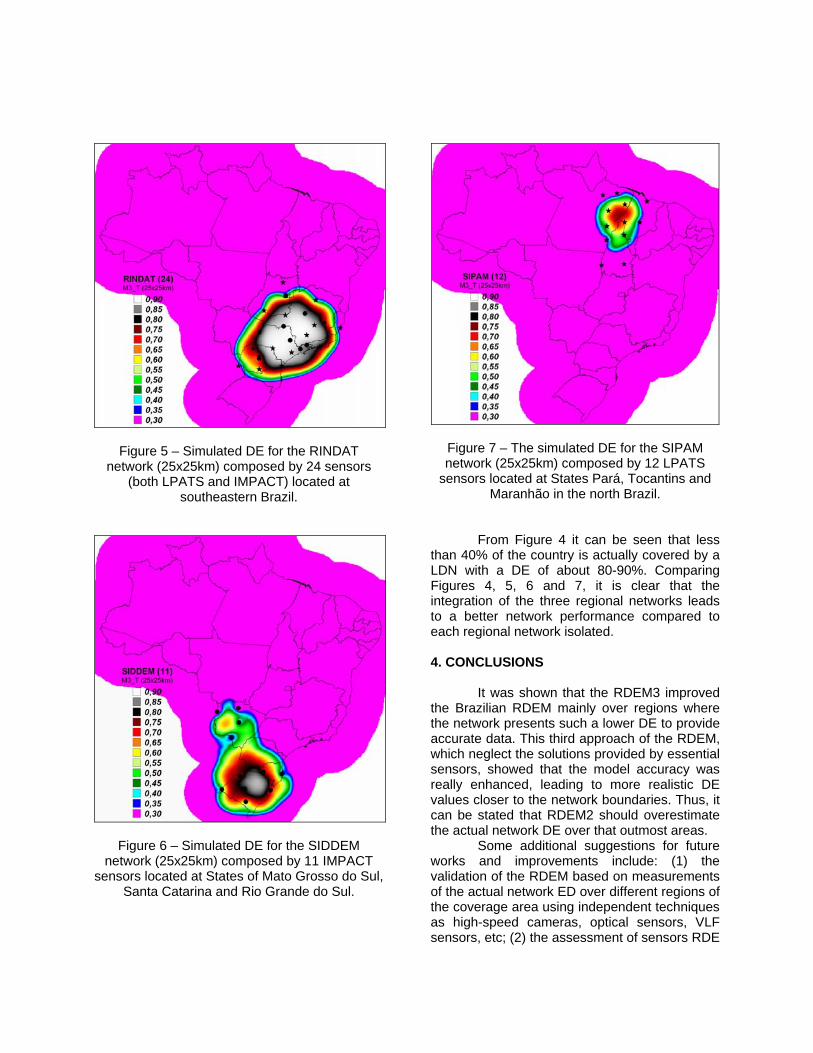
Figure 5 – Simulated DE for the RINDAT network (25x25km) composed by 24 sensors
(both LPATS and IMPACT) located at southeastern Brazil.
Figure 6 – Simulated DE for the SIDDEM network (25x25km) composed by 11 IMPACT
sensors located at States of Mato Grosso do Sul, Santa Catarina and Rio Grande do Sul.
Figure 7 – The simulated DE for the SIPAM network (25x25km) composed by 12 LPATS
sensors located at States Pará, Tocantins and Maranhão in the north Brazil.
From Figure 4 it can be seen that less
than 40% of the country is actually covered by a LDN with a DE of about 80-90%. Comparing Figures 4, 5, 6 and 7, it is clear that the integration of the three regional networks leads to a better network performance compared to each regional network isolated. 4. CONCLUSIONS
It was shown that the RDEM3 improved the Brazilian RDEM mainly over regions where the network presents such a lower DE to provide accurate data. This third approach of the RDEM, which neglect the solutions provided by essential sensors, showed that the model accuracy was really enhanced, leading to more realistic DE values closer to the network boundaries. Thus, it can be stated that RDEM2 should overestimate the actual network DE over that outmost areas.
Some additional suggestions for future works and improvements include: (1) the validation of the RDEM based on measurements of the actual network ED over different regions of the coverage area using independent techniques as high-speed cameras, optical sensors, VLF sensors, etc; (2) the assessment of sensors RDE
distributions as a function of the azimuth; (3) the evaluation of the sensor RDE distributions for different periods (since 1999) in order to include the effect of the sensor degradation and/or upgrade on its overall performance. 5. ACKNOWLEDGEMENTS
This research was supported by FAPESP (Grant No. 01/04026-7) and CNPq (Grant No. 151499/2005-5). The authors also would like to thank Furnas Centrais Elétricas for data facilities. 6. REFERENCES CUMMINS, K. L.; BARDO, E. A.; HISCOX, W. L., PYLE, R. B.; PIFER, A. E. “NLDN’95: A combined TOA/MDF technology upgrade of the U.S. National Lightning Detection Network”, Proceedings of the International Aerospace & Ground Conference on Lightning and Static Electricity, National Interagency Coordination Group, Williamsburg, 1995. CUMMINS, K. L., M. J. MURPHY, E. A. BARDO, W. L. HISCOX, R. B. PYLE, A. E. PIFER. “A combined TOA/MDF technology upgrade of the U.S. National Lightning Detection Network”, Journal of Geophysical Research, v.103, D8, p. 9035-9044, 1998 CUMMINS, K. L.; E. A. BARDO “On the relationship between lightning detection network performance and measured lightning parameters”, Proceedings of the International Conference on Grounding and Earthing & 1st International Conference on Lightning Physics and Effects, SB-RAI, Belo Horizonte, 2004. NACCARATO, K.P.; O. PINTO JR.; I.R.C.A. PINTO. “Intracloud contamination due to LPATS sensors in a lightning detection network”, Proceedings of the International Conference on Grounding and Earthing & 1st International Conference on Lightning Physics and Effects, SB-RAI, Belo Horizonte, 2004(a) NACCARATO, K.P.; O. PINTO JR.; I.R.C.A. PINTO. “Application of a detection efficiency model to correct cloud-to-ground flash density maps in southeastern Brazil”, Proceedings of the
18th International Lightning Detection Conference, Vaisala, Helsinki, 2004(b) NACCARATO, K. P. “Analysis of the cloud-to-ground lightning flashes characteristics in southeastern Brazil”. Ph.D. Dissertation, Instituto Nacional de Pesquisas Espaciais (INPE), 330pp, (in Portuguese), 2006. NACCARATO, K. P.; O. PINTO, JR.; I. R. C. A. PINTO. “A detection efficiency model for the Brazilian Lightning Detection Network (RINDAT)”, Proceedings of the 19th International Lightning Detection Conference, Vaisala, Tucson, 2006(a). NACCARATO, K. P.; O. PINTO, JR.; I. R. C. A. PINTO. Different types of detection efficiency models to correct cloud-to-ground data obtained by Lightning Detection Networks, Proceedings of the International Conference on Grounding and Earthing & 2nd International Conference on Lightning Physics and Effects, SB-RAI, Maceió, CD-ROM, Nov. 2006(b). MURPHY, M.; PIFER, A.; CUMMINS, K.; PYLE, R.; CRAMER, J. “The 2002 upgrade of the U.S. NLDN”. Proceedings of 17th. International Lightning Detection Conference, Tucson, Global Atmospherics Inc., CD-ROM, 2002. ROMPALA, J. T., R. J. BLAKESLEE, J. C. BAILEY. “Detection efficiency contours for regions serviced by lightning detection networks of limited scope”. Proceedings of the 12th International Conference on Atmospheric Electricity, ICAE, Versailles, v.1, p. 101-104, 2003. SCHULZ, W., DIENDORFER, G. “Detection efficiency and site errors of lightning location systems”. Proceedings of the 14th International Lightning Detection Conference, Global Atmospherics, Tucson, 1996. SCHULZ, W. “Performance evaluation of lightning location systems”, PhD Thesis, Technical University of Vienna, Faculty of Electrical Engineering, Austria, 136p, 1997.