Embed Size (px)
Citation preview

A detailed seabed signature from Hurricane Sandyrevealed in bedforms and scour
Arthur Trembanis and Carter DuValSchool of Marine Science and Policy, University of Delaware, 109 Penny Hall, Newark, Delaware, 19716, USA([email protected])
Jonathan Beaudoin and Val SchmidtCenter for Coastal and Ocean Mapping, University of New Hampshire, Durham, New Hampshire, USA
Doug MillerCannon Marine Laboratory, School of Marine Science and Policy, University of Delaware, Lewes, Delaware,USA
Larry MayerCenter for Coastal and Ocean Mapping, University of New Hampshire, Durham, New Hampshire, USA
[1] On 30 October 2012, Hurricane Sandy made landfall near Brigantine New Jersey bringing widespreaderosion and damage to the coastline. We have obtained a unique set of high-resolution before and afterstorm measurements of seabed morphology and in situ hydrodynamic conditions (waves and currents)capturing the impact of the storm at an inner continental shelf field site known as the ‘‘Redbird reef’’.Understanding the signature of this storm event is important for identifying the impacts of such events andfor understanding the role that such events have in the transport of sediment and marine debris on the innercontinental shelf. As part of an ONR-sponsored program designed to understand and characterize the rippledynamics and scour processes in an energetic, heterogeneous inner-shelf setting, a series of high-resolutiongeoacoustic surveys were conducted before and after Hurricane Sandy. Our overall goal is to improve ourunderstanding of bedform dynamics and spatio-temporal length scales and defect densities through theapplication of a recently developed fingerprint algorithm technique. Utilizing high-resolution swath sonarcollected by an AUV and from surface vessel sonars, our study focuses both on bedforms in the vicinity ofmanmade seabed objects and dynamic natural ripples on the inner shelf in energetic coastal settings withapplication to critical military operations such as mine countermeasures.
Components: 3,734 words, 5 figures.
Keywords: Hurricane Sandy; scour; erosion; ripples; multibeam.
Index Terms: 3045 Seafloor morphology, geology, and geophysics: Marine Geology and Geophysics; 3022 Marine sedi-ments: processes and transport : Marine Geology and Geophysics; 3050 Ocean observatories and experiments: Marine Ge-ology and Geophysics; 3020 Littoral processes: Marine Geology and Geophysics; 3080 Submergence instruments: ROV,AUV, submersibles: Marine Geology and Geophysics.
Received 15 May 2013; Revised 23 July 2013; Accepted 16 August 2013; Published 00 Month 2013.
Trembanis, A., C., DuVal, J., Beaudoin, V., Schmidt, D., Miller, L., Mayer (2013), A detailed seabed signature from Hurri-cane Sandy revealed in bed forms and scour, Geochem. Geophys. Geosyst., 14, doi:10.1002/ggge.20260.
© 2013. American Geophysical Union. All Rights Reserved. 1
Article
Volume 00, Number 00
0 MONTH 2012
doi: 10.1002/ggge.20260
ISSN: 1525-2027

1. Introduction
[2] On 30 October 2012, Hurricane Sandy madelandfall near Brigantine New Jersey bringingwidespread erosion and damage to the coastline.We have obtained a unique set of high resolu-tion before and after storm measurements ofseabed morphology and in situ hydrodynamicconditions (waves and currents) capturing theimpact of the storm at an inner continental shelffield site known as the ‘‘Redbird reef’’ [Rain-eault et al., 2013]. Understanding the signature
of this storm event is important for identifyingthe impacts of such events and for understand-ing the role that such events have in the trans-port of sediment and marine debris on the innercontinental shelf.
[3] As part of an Office of Naval Research(ONR)-sponsored program designed to understandand characterize the ripple dynamics and scourprocesses in an energetic, heterogeneous inner-shelf setting, a series of high-resolution geoacous-tic surveys were conducted before and after Hurri-cane Sandy (Figure 1). Our overall goal is to
Figure 1. Multibeam echosounder, 25 cm sun-illuminated (azimuth 315� and 45� elevation) digital eleva-tion model of the Redbird reef site (a) before Hurricane Sandy and (b) after Hurricane Sandy. Yellow boxindicates location of seafloor instruments placed in the middle of a sorted bed form where large wave orbitalripples were generated by the storm. Figure 1b illustrates the pronounced bathymetric scour in the southwestlee of the Navy barge and tugboat produced in response to the storm conditions. (c) Close-up view of a sub-merged shipwreck showing large wave orbital ripples in the southwest lee of the structure created by stormwaves mapped with AUV side-scan. Note that bright pixels in the side-scan sonar record equate to high ampli-tude of return and have been found from sediment samples (Figure 5d) to be generally associated with areasof coarse sand and gravel. Dark areas in the side-scan mosaic are associated with low amplitude of acousticreturn and have been found from sediment samples and video to be associated with areas of fine sand and silt.(d) Overview color bathymetric image showing the location of the field site (white rectangle), data courtesyof NOAA Coastal Relief Model.
TREMBANIS ET AL.: RESEARCH LETTER 10.1002/ggge.20260
2
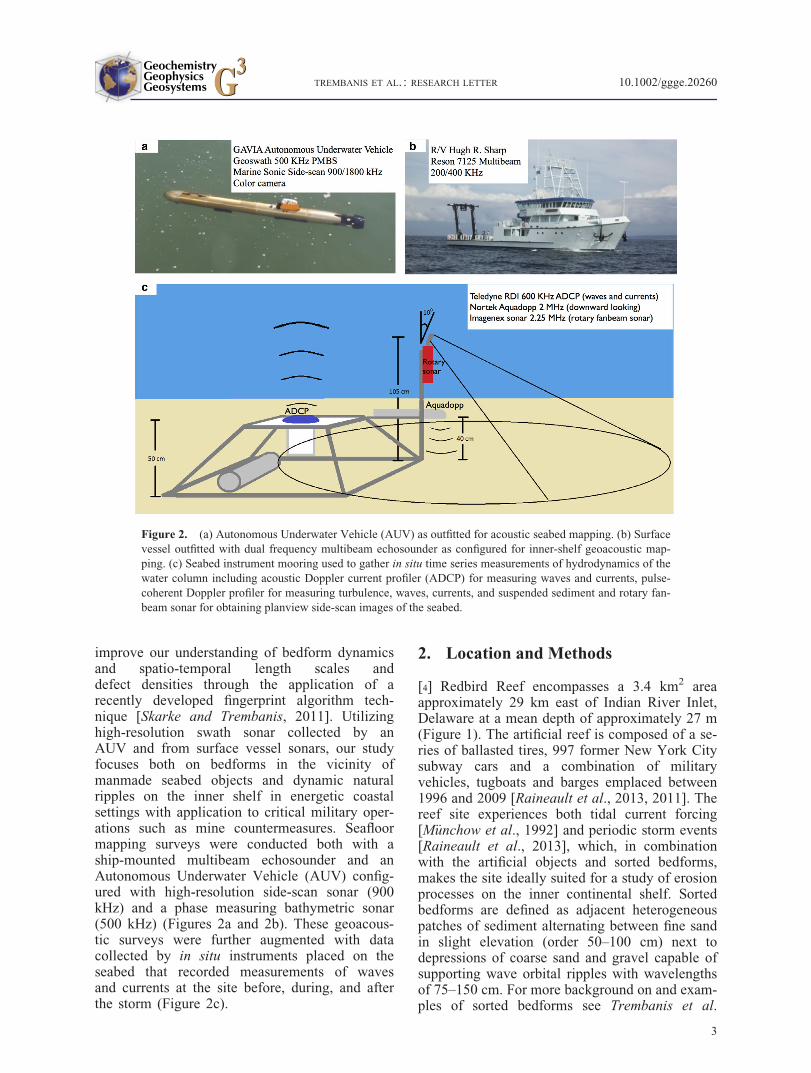
improve our understanding of bedform dynamicsand spatio-temporal length scales anddefect densities through the application of arecently developed fingerprint algorithm tech-nique [Skarke and Trembanis, 2011]. Utilizinghigh-resolution swath sonar collected by anAUV and from surface vessel sonars, our studyfocuses both on bedforms in the vicinity ofmanmade seabed objects and dynamic naturalripples on the inner shelf in energetic coastalsettings with application to critical military oper-ations such as mine countermeasures. Seafloormapping surveys were conducted both with aship-mounted multibeam echosounder and anAutonomous Underwater Vehicle (AUV) config-ured with high-resolution side-scan sonar (900kHz) and a phase measuring bathymetric sonar(500 kHz) (Figures 2a and 2b). These geoacous-tic surveys were further augmented with datacollected by in situ instruments placed on theseabed that recorded measurements of wavesand currents at the site before, during, and afterthe storm (Figure 2c).
2. Location and Methods
[4] Redbird Reef encompasses a 3.4 km2 areaapproximately 29 km east of Indian River Inlet,Delaware at a mean depth of approximately 27 m(Figure 1). The artificial reef is composed of a se-ries of ballasted tires, 997 former New York Citysubway cars and a combination of militaryvehicles, tugboats and barges emplaced between1996 and 2009 [Raineault et al., 2013, 2011]. Thereef site experiences both tidal current forcing[M€unchow et al., 1992] and periodic storm events[Raineault et al., 2013], which, in combinationwith the artificial objects and sorted bedforms,makes the site ideally suited for a study of erosionprocesses on the inner continental shelf. Sortedbedforms are defined as adjacent heterogeneouspatches of sediment alternating between fine sandin slight elevation (order 50–100 cm) next todepressions of coarse sand and gravel capable ofsupporting wave orbital ripples with wavelengthsof 75–150 cm. For more background on and exam-ples of sorted bedforms see Trembanis et al.
Figure 2. (a) Autonomous Underwater Vehicle (AUV) as outfitted for acoustic seabed mapping. (b) Surfacevessel outfitted with dual frequency multibeam echosounder as configured for inner-shelf geoacoustic map-ping. (c) Seabed instrument mooring used to gather in situ time series measurements of hydrodynamics of thewater column including acoustic Doppler current profiler (ADCP) for measuring waves and currents, pulse-coherent Doppler profiler for measuring turbulence, waves, currents, and suspended sediment and rotary fan-beam sonar for obtaining planview side-scan images of the seabed.
TREMBANIS ET AL.: RESEARCH LETTER 10.1002/ggge.20260
3

[2007], Mayer et al. [2007], Murray and Thieler[2004], and Trembanis et al. [2004, and referencestherein].
[5] The first of a series of geoacoustic surveys wasconducted on 26 October 2012, 3 days ahead ofthe landfall of the storm and thus established aunique benchmark for determining the subsequentimpact of the storm. A 1.0 � 0.5 km area (Figures1a and 1b) was mapped using a Reson multibeamsystem (model 7125 SV2) deployed on RV HughR. Sharp (Figure 2b). The multibeam system wasoperated at 400 kHz for the greater resolutionavailable in this configuration: the 1.0� � 0.5�
beam width for transmit/receive allowed for spa-tial resolution on the order of 0.5 m � 0.25 m inwater depths of 27 m for the near nadir beams.Raw Global Positioning System (GPS) measure-ments were recorded from an Applanix POSMV330 (V5) and were postprocessed using ApplanixPOSPac MMS to reduce horizontal and verticalpositioning uncertainties. By recording the GPSmeasurements, the data can be postprocessed toallow for improved accuracies based on knowl-edge of the satellite constellation orbits, clock cor-
rections, atmospheric delays, etc. Verticalpositioning provided by the POSMV allowed foran ellipsoidal reference, removing uncertaintiesassociated with poor tidal knowledge offshore,heave sensor limitations and variations in draft/squat of the vessel between surveys. Verticalrepeatability between surveys is on the order of10–15 cm.
[6] Backscatter and bathymetry data from the mul-tibeam were acquired at 200 kHz during a secondpass over the site with the intent of using thesedata for acoustic seabed characterization. Thisapproach was followed on every subsequent visitto the site, thus providing a time series of bathym-etry and backscatter at both 200 and 400 kHz. Sitesurveys were conducted in this manner on the fol-lowing dates: (1) 26 October 2012, 3 days beforeHurricane Sandy, (2) 10 November 2012, 12 daysafter Hurricane Sandy, and (3) 4 December 2012,36 days after the storm (Figure 3). The timing ofeach survey relative to the significant wave heightconditions at the field site as recorded by the insitu ADCP mooring and the nearest NOAA wavebuoy (Buoy 44009) are shown in Figures 3 and 4).
Figure 3. Time series of observed significant wave height as recorded by the in situ sensors (red line) and incomparison to the NOAA Buoy 44009 record (blue dots). Significant wave height is the average height of thehighest one third of the waves in a sample in meters. NOAA Buoy 44009 is located approximately 11 nauticalmiles to the south of the field site in the same average water depth of 27 m. Vertical lines indicate the timingof ship multibeam and AUV surveys of the field site including 3 days before Hurricane Sandy and 12 and 36days after the storm.
TREMBANIS ET AL.: RESEARCH LETTER 10.1002/ggge.20260
4

Additional high-resolution side-scan sonar (900kHz) and bathymetry (500 kHz) were collectedusing a Teledyne Gavia Autonomous UnderwaterVehicle (AUV) (Figure 1c).
3. Storm Conditions
[7] Time series of waves (Figure 3), mean currents,and sonar data were recorded by an instrumentedbottom mount frame comprised of an 600 kHzupward looking ADCP with wave and currentprofiling capability, a 2 MHz Aquadopp HR pro-filer for near-bed turbulence and 2.25 MHz Image-nex 881 rotary fanbeam sonar for time seriesmeasurements of bed form planview geometry(Figure 2c). The instrument assembly was situated(Figures 1a and 1b) within a large field (50–200 mwide and �1000 m long) of moderately sortedgravelly sand with fines (Figure 5d). This seabed
facies represents a sorted bedform feature consist-ent with the definition of sorted bedforms [Rain-eault et al., 2013; Murray and Thieler, 2004;Trembanis et al., 2004] in the vicinity of the Red-bird reef structures [Raineault et al., 2013]. Stormconditions were recorded at the surface and at theseabed before, during, and after Hurricane Sandy(Figure 3). Significant wave heights from Sandyreached over 7 m (Figure 3), with wave periods of14 s. Significant wave orbital velocities wereobserved with speeds of over 1.5 m/s near the bedand mean currents during the storm were more than0.6 m/s near the bed, tidal currents at the field siteare typically less than 0.3 m/s in magnitude [Rain-eault et al., 2013; M€unchow et al., 1992]. Within aweek following Hurricane Sandy a nor’easter eventbrought additional storm conditions to the site (Fig-ure 3). NOAA buoy 44009 data (located 18 km tothe south at the same water depth as the field site)
Figure 4. Wave climatology between 1986 and 2012 from NOAA buoy 44009 illustrating distribution ofsignificant (a) wave height (Hs) and (b) peak wave period (Tp). (c) Time series of buoy observations illustrate10 events with a significant wave height of more than 7 m for a recurrence interval of �2.8 years for condi-tions of a magnitude similar to those created by Hurricane Sandy. (d) Cross plot of significant wave heightconditions measured simultaneously by the in situ ADCP mooring (y axis) and buoy 44009 (x axis) showing astrong linear trend with a correlation coefficient (r2) of 0.963.
TREMBANIS ET AL.: RESEARCH LETTER 10.1002/ggge.20260
5

and on site ADCP wave height observations (Fig-ure 3), exhibited strong correlation during bothhigh energy and low energy conditions (Figure 4d).The buoy data and on site measurements exhibit alinear correlation coefficient (r2) of 0.963 (Figure4d) and therefore the long-term buoy data recordprovides a useful indicator of the wave climate con-ditions at this field site (Figure 4).
4. Findings
[8] Great care was taken to conduct both thebefore and after surveys utilizing the same sonarsettings, line spacing, beam spacing, ping rates,and vessel speeds. Thus, the postprocessing set-tings and workflow were identical for both surveysand the resulting observed changes to the seafloor
Figure 5. The 25 cm/pixel gridded shaded relief bathymetric map close-up of a portion of the Redbird reeffield site showing the same view and clutch of subway cars. (a) The first survey was conducted on 26 October2012, 3 days before the impact of Hurricane Sandy on the field site and exhibits a generally undisturbed seabedof fine sand supporting smooth hummocky beds (red square). (b) The second survey was conducted on 10 No-vember 2012, 12 days after the passage of Hurricane Sandy and shows the same view as in Figure 5a but with adramatically different configuration of the seabed morphology. Large symmetrical wave orbital ripples areclearly evident in an area composed of moderately sorted gravelly sand with fines (yellow oval and sample 2 inFigure 5d). Additionally, scour pits have become more pronounced and expanded around the scattered subwaycars and fluted scour jet marks are evident adjacent to the doors and window openings on the subway cars. Fur-thermore, areas that supported smooth well-sorted medium sand beds before the storm (red square in Figure 5a)have experienced significant scour and erosion into a jagged mottled topography (red square in Figure 5b).(c) The third survey was conducted on 4 December 2012, 36 days after the passage of Hurricane Sandy andillustrates partially (but not complete) recovery of the seabed to the pre-Sandy configuration. Note that in thered square in Figure 5c the previously jagged relief has been reduced to a partially smooth hummocky morphol-ogy. Additionally, some of the large wave orbital ripples have been smoothed out (yellow oval in Figure 5c)while some of the very same ripples mapped after hurricane Sandy are still present. The 45 sediment grab sam-ples have been obtained at the field site and analyzed for grain size distribution including five samples (Figure5d) taken within the area illustrated in Figures 5a–5c. These samples provide for a direct ground truth referenceto the acoustic maps of bathymetry (Figures 1a and 1b) and backscatter (Figure 1c) conditions at the field site.
TREMBANIS ET AL.: RESEARCH LETTER 10.1002/ggge.20260
6

(Figures 5a–5c) are real seabed feature changesand not the byproduct of some changes in surveydesign or gridding parameters. Pronounced fea-tures from the impact of Hurricane Sandy arestrikingly evident in the comparison of the beforeand after multibeam data (Figures 1a, 1b, and 5a–5c). Large scour patches were noted in the south-west lee of seabed structures (Figures 1b and 1c).Also, previously smooth and/or hummocky patchesof the seafloor (Figure 5a) became scoured and/orformed into large wave orbital ripples (Figure 5b)depending on the sediment texture of the surfacesediment (Figure 5d). Symmetrical wave orbitalripples were clearly observed to have formed inresponse to the high-energy waves of the stormconditions with wavelengths of 1–1.5 m (Figure5b). Within 36 days after the impact of HurricaneSandy at the field site, hummocks had returned tosome of the previously scoured areas and wave rip-ples formed by the storm, showed signs of havingbeen partially buried or flattened by diffusion andbioturbation processes (Figure 5c). Perhaps moststrikingly, several subway cars were rotated, fur-ther buried, or partially destroyed by the stormconditions with marine debris subsequently scat-tered throughout the area (Figure 5). Because onlypartial recovery was seen in December, 5 weekslater, there was likely little recovery in the shortperiod (7 days) between Hurricane Sandy and theunnamed nor’easter storm, therefore we infer thatit is reasonable to attribute the mapped morpholog-ical effects on the seabed to Hurricane Sandy.
[9] The freshly formed and exposed ripple fieldsobserved in the mapping survey provide a uniquehigh-resolution spatial snapshot of bedform mor-phology imposed by the storm conditions and formthe basis of a continued effort to monitor the subse-quent recovery of the seabed which is part of anongoing investigation. These detailed repeated high-resolution mapping efforts and in situ hydrodynamicobservations provide direct insights and confirma-tion of processes at the site that were previously[Raineault et al., 2013, 2011] only qualitativelyinferred. While changes to the seabed followingstorm events are to be expected it is unique for sci-entists to have such carefully controlled andrepeated surveys capturing the fine morphologicaldetails of a storm event over a large area. Oftenthere are only cursory qualitative before and aftermaps of seabed morphology or spatially limitedtime series in one small footprint around a mooring,with far less resolution than presented here. Thesedetailed repeated surveys allow researchers to exam-ine the temporal evolution of scour dynamics for
both natural bedforms (ripples) and manmadeobjects. There is an established body of literaturehighlighting the importance of understanding seabedscour with respect to both applied topics of theimpacts of scour on manmade objects and ship-wrecks [Whitehouse, 1998; McNinch et al., 2006]and with respect to the general scholarship regardingshelf sediment transport [Sumer and Fredsoe,2002]. The fusion of high-resolution field data (mor-phology and hydrodynamics) collected both fromsurface vessel and AUV can be used to improve ourunderstanding of the response of the seabed to bothstorm and fair weather flow conditions in a hetero-geneous inner-shelf setting, with application to theinterpretation of acoustic imagery for surface mor-phology and textural properties of surficial sedi-ments on the seabed in other similar settings.
References
Mayer, L. A., R. Raymond, G. Glang, M. D. Richardson, P. A.Traykovski, and A. C. Trembanis (2007), High-resolutionmapping of mines and ripples at the Martha’s VineyardCoastal Observatory, IEEE J. Oceanic Eng., 32(1), 133–149.
McNinch, J. E., A. C. Trembanis, and J. Wells (2006), A scourmodel for shipwrecks and marine artifacts—Developing andtesting a predictive tool for nautical archaeologists, Int. J.Nautical Archaeology, 35.2, 290–309.
M€unchow, A., A. K. Masse, and R. W. Garvine (1992), Astro-nomical and nonlinear tidal currents in a couples estuaryshelf system, Cont. Shelf Res., 12, 471–498.
Murray, A. B., and E. R. Thieler (2004), A new hypothesis andexploratory model for the formation of large-scale inner-shelf sediment sorting and ‘‘rippled scour depressions,’’Cont. Shelf Res., 24, 295–315.
Raineault, N. A., A. C. Trembanis, and D. Miller (2011), Map-ping benthic habitats in Delaware Bay and the coastal Atlan-tic : Acoustic techniques provide greater coverage and highresolution in complex shallow-water environments, Estua-ries Coasts, 35, 682–699, doi:10.1007/s12237-011-9457-8.
Raineault, N. A., A. C. Trembanis, D. C. Miller, and V.Capone (2013), Interannual changes in seafloor surficial ge-ology at an artificial reef site on the inner continental shelf,Cont. Shelf Res., 58, 67–78, doi:10.1016/j.csr.2013.03.008.
Skarke, A., and A. C. Trembanis (2011), Parameterization ofbedform morphology and defect density with fingerprintanalysis techniques, Cont. Shelf Res., 31, 1688–1700.
Sumer, B. M., and J. Fredsoe (2002), The Mechanics of Scourin the Marine Environment, 536 p., World Sci., Singapore.
Trembanis, A. C., L. D. Wright, C. T. Friedrichs, M. O. Green,and T. M. Hume (2004), The effects of spatially complexinner shelf roughness on boundary layer turbulence and cur-rent and wave friction: Tairua Embayment, New Zealand,Cont. Shelf Res., 24, 1549–1571.
Trembanis, A. C., C. T. Friedrichs, M. Richardson, P. A. Tray-kovski, and P. Howd (2007), Predicting seabed burial of cyl-inders by wave-induced scour: Application to the Sandyinner shelf off Florida and Massachusetts, IEEE J. OceanicEng., 32(1), 167–183.
Whitehouse, R. (1998), Scour at Marine Structures: A Manualfor Practical Applications, 198 p., Thomas Telford, London.
TREMBANIS ET AL.: RESEARCH LETTER 10.1002/ggge.20260
7


![HURRICANE SANDY RECOVERY WORKSHOP SUMMARY …...Hurricane Sandy Recovery Workshop Summary Report [2] Introduction On October 29, 2012, Hurricane Sandy made landfall north of Brigantine,](https://img.pdfslide.us/doc/110x75/5f0d17507e708231d438a277/hurricane-sandy-recovery-workshop-summary-hurricane-sandy-recovery-workshop.jpg)