Embed Size (px)
Citation preview

ISSN 1477-7029 102 ©ACPIL
Reference this paper: Mamabolo, A., and Myres, K., 2019. A Detailed Guide on Converting Qualitative Data into Quantitative Entrepreneurial Skills Survey Instrument. The Electronic Journal of Business Research Methods, 17(3), pp. 102-117, available online at www.ejbrm.com
A Detailed Guide on Converting Qualitative Data into Quantitative Entrepreneurial Skills Survey Instrument
Anastacia Mamabolo and Kerrin Myres University of Pretoria’s Gordon Institute of Business Science, Johannesburg, South Africa [email protected] [email protected] [email protected] DOI: 10.34190/JBRM.17.3.001 Abstract: Mixed-methods research designs are increasingly popular, especially in the management domain because they hold the potential to offset the weaknesses inherent in mono-method, qualitative or quantitative designs. In entrepreneurship research, the domain in which this study is located, mixed-method studies are conducted mostly according to a sequential-exploratory design with an aim of developing and validating theory in a single research study. In some studies, the qualitative phase is used to develop a questionnaire, which is more common. However, the actual process of converting qualitative data into operationalised constructs and survey items is usually not clearly articulated. This creates an opportunity to contribute to a better understanding of the process of transitioning from a qualitative to a quantitative study. This paper proposes such an approach, using an example of a study of the skills entrepreneurs use to start and run their businesses. In the qualitative phase, interviews were conducted with 20 entrepreneurs and 6 national experts to discover the skills required by entrepreneurs to start and manage their businesses. Data analysis, using computer assisted qualitative data analysis software, resulted in nine groups of skills considered important in performing entrepreneurial activities. Based on qualitative analysis, the study provides a detailed account of the process of converting qualitative data into a quantitative survey questionnaire, which will enhance the effectiveness of mixed-methods designs. The developed entrepreneurial skills questionnaire was tested and validated on a sample of 235 entrepreneurs. The article concludes with implications for mixed-methods researchers who want to develop new instruments, and scholars conducting research on entrepreneurial skills. Keywords: entrepreneurs, entrepreneurial skills, mixed-methods, qualitative, quantitative
1. Introduction
The mixed-methods research has emerged as a ‘‘third paradigm’’ for social research and has rapidly developed over years (Denscombe, 2008; Maxwell, 2016). This research approach involves “the collection or analysis of both quantitative and/or qualitative data in a single study in which the data are collected concurrently or sequentially, are given a priority, and involve the integration of the data at one or more stages in the process of research” (Creswell, Plano Clark, Gutmann and Hanson, 2003, p.165). Mixed-methods have been applied in business and management research, including in studies of entrepreneurship phases. Despite its significant application in many academic fields, there are also aspects of mixed-methods research on which there is a relative lack of consistency or agreement (Denscombe, 2008) and little published description of the mechanisms that can be applied to the integration of qualitative and quantitative data (Maxwell, 2016). In entrepreneurship mixed-methods research, there is scant research available on how to design instruments that measure entrepreneurial skills and the process thereof. Most mixed-methods research studies on entrepreneurship conduct surveys first, followed by interviews that provide in-depth interpretation of tested quantitative relationships (Molina-Azorín, López-Gamero, Pereira-Moliner and Pertusa-Ortega, 2012). Few sequential-exploratory research designs that start with qualitative research and end with quantitative research, have clearly explained a detailed conversion process from qualitative to quantitative research (Desa, 2012; Loué and Baronet, 2012; Murnieks, et al., 2016; Mamabolo, Kerrin and Kele, 2017; McCrudden and McTigue, 2019). An example of one of the few studies conducted is that by Crede and Borrego (2013) who converted qualitative data into survey items in a retention of engineering students’ study. Therefore, there is evidence that some various aspects of the mixed-methods research still need to be clarified. The aim of this study is to heed the call for a better description of the actual process of integrating qualitative and quantitative data in mixed-methods designs (Maxwell, 2016). In particular, the key objective of this study is to illustrate the use of qualitative findings in the development of a quantitative survey data collection instrument (Creswell, 2009).
Anastacia Mamabolo and Kerrin Myres
www.ejbrm.com 103 ISSN 1477-7029
The study reported on here, which builds on Mamabolo et al. (2017), applied a sequential-exploratory mixed-methods design, where the research process started with the qualitative research and ended with quantitative research. The qualitative data generated from 26 participants were used to develop a skills questionnaire, which was tested on a quantitative sample 235 entrepreneurs. Scholars emphasise the notion that mixed-methods designs may improve the standard of management decisions (Mitchell, 2018) and entrepreneurship research (Molina-Azorín et al., 2012). The main contribution of this study is a step-by-step conversion of data from the qualitative phase in designing a research instrument. Additionally, the study developed an entrepreneurial skills instrument, which was achieved using exploratory factor analysis and was examined for validity and reliability. This paper provides implications for entrepreneurship and research methods fields by explaining the procedure of transforming the qualitative data into a survey measurement tool. The paper is divided into four main sections. First, the literature review discusses the current research on mixed-methods and entrepreneurial skills research. Second, the methodology section provides details of the qualitative research, questionnaire development process and quantitative research. Third, the findings of the research are discussed in line with the existing literature on business methods and entrepreneurial skills research. Finally, the conclusion suggests the practical implications and recommendations for entrepreneurs, mixed-methods researchers, and entrepreneurship scholars.
2. Literature review
2.1 Mixed-Methods Research
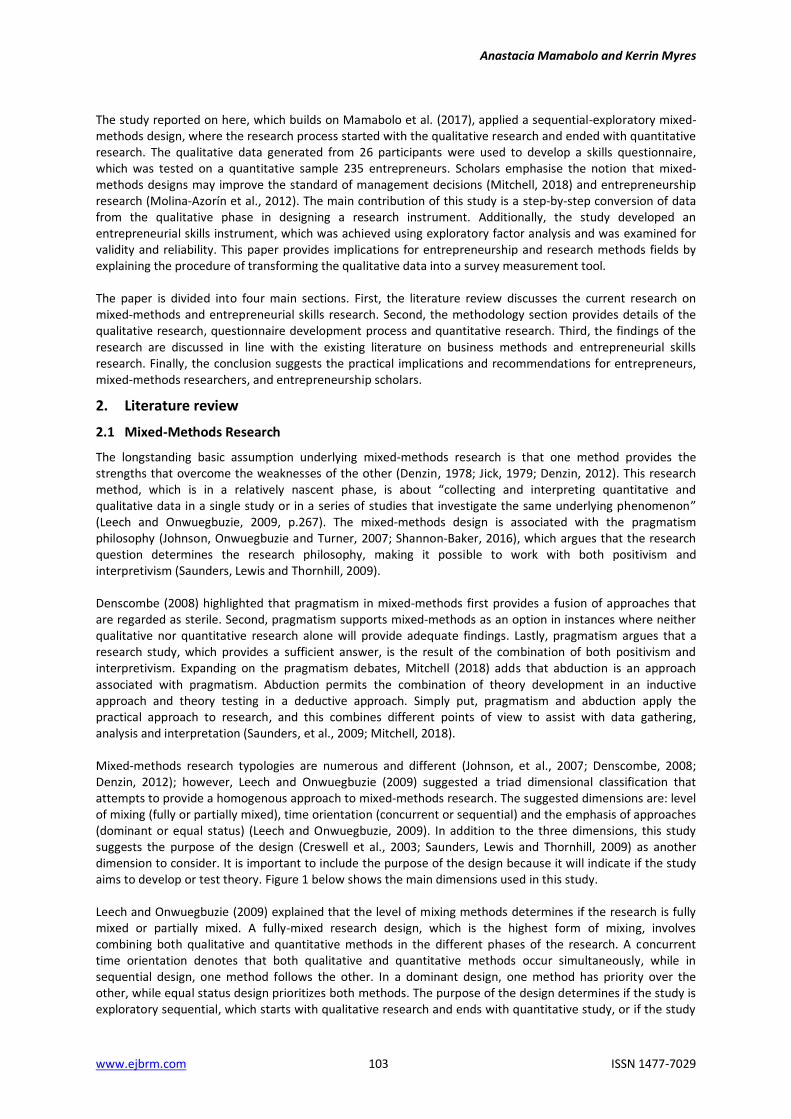
The longstanding basic assumption underlying mixed-methods research is that one method provides the strengths that overcome the weaknesses of the other (Denzin, 1978; Jick, 1979; Denzin, 2012). This research method, which is in a relatively nascent phase, is about “collecting and interpreting quantitative and qualitative data in a single study or in a series of studies that investigate the same underlying phenomenon” (Leech and Onwuegbuzie, 2009, p.267). The mixed-methods design is associated with the pragmatism philosophy (Johnson, Onwuegbuzie and Turner, 2007; Shannon-Baker, 2016), which argues that the research question determines the research philosophy, making it possible to work with both positivism and interpretivism (Saunders, Lewis and Thornhill, 2009). Denscombe (2008) highlighted that pragmatism in mixed-methods first provides a fusion of approaches that are regarded as sterile. Second, pragmatism supports mixed-methods as an option in instances where neither qualitative nor quantitative research alone will provide adequate findings. Lastly, pragmatism argues that a research study, which provides a sufficient answer, is the result of the combination of both positivism and interpretivism. Expanding on the pragmatism debates, Mitchell (2018) adds that abduction is an approach associated with pragmatism. Abduction permits the combination of theory development in an inductive approach and theory testing in a deductive approach. Simply put, pragmatism and abduction apply the practical approach to research, and this combines different points of view to assist with data gathering, analysis and interpretation (Saunders, et al., 2009; Mitchell, 2018). Mixed-methods research typologies are numerous and different (Johnson, et al., 2007; Denscombe, 2008; Denzin, 2012); however, Leech and Onwuegbuzie (2009) suggested a triad dimensional classification that attempts to provide a homogenous approach to mixed-methods research. The suggested dimensions are: level of mixing (fully or partially mixed), time orientation (concurrent or sequential) and the emphasis of approaches (dominant or equal status) (Leech and Onwuegbuzie, 2009). In addition to the three dimensions, this study suggests the purpose of the design (Creswell et al., 2003; Saunders, Lewis and Thornhill, 2009) as another dimension to consider. It is important to include the purpose of the design because it will indicate if the study aims to develop or test theory. Figure 1 below shows the main dimensions used in this study. Leech and Onwuegbuzie (2009) explained that the level of mixing methods determines if the research is fully mixed or partially mixed. A fully-mixed research design, which is the highest form of mixing, involves combining both qualitative and quantitative methods in the different phases of the research. A concurrent time orientation denotes that both qualitative and quantitative methods occur simultaneously, while in sequential design, one method follows the other. In a dominant design, one method has priority over the other, while equal status design prioritizes both methods. The purpose of the design determines if the study is exploratory sequential, which starts with qualitative research and ends with quantitative study, or if the study
The Electronic Journal of Business Research Methods Volume 17 Issue 3 2019
www.ejbrm.com 104 ©ACPIL
is only explanatory, which commences with a survey and concludes with qualitative interviews (Creswell et al., 2003). In cases where both methodologies are implemented at the same time, the design is mostly concurrent triangulation. These classifications serve as guidelines to conduct mixed-methods research that will yield results (Creswell, 2009; Saunders et al., 2009).
Figure 1: Typology of mixed methods. (+) means concurrent design, (->) is sequential design, caps lock – prioritised research, QUAL (qual) – qualitative, QUANT (quant) - quantitative Source: Authors’ own
2.2 Mixed-Methods in Entrepreneurial Skills Research
Drawing insights from human capital theory (Becker, 1964), skill is an outcome of investments in education and work experience. Mamabolo et al. (2017, p. 3) contextualizes the skill definition in entrepreneurship “as the proficiency in performing tasks in the entrepreneurial phases as a result of human capital investments (formal and education, entrepreneurial education, work, industry and entrepreneurship experiences) and can be improved by training, practice and development”. In simple terms, skills are not innate, but they can be improved through different interventions. Entrepreneurial skills, important in starting and managing a business, broadly include start-up, technical, business management and leadership, and interpersonal skills (Lichtenstein and Lyons, 2001; Loué and Baronet, 2012; Chang and Rieple, 2013; Prüfer and Prüfer, 2019). Research on entrepreneurial skills seems to favour the positivist paradigm above pragmatism and interpretivism (Chell, 2013). An ongoing criticism of the quantitative approach in entrepreneurial skills research has encouraged the emergence of qualitative approaches (Chell, 2013). Molina-Azorín et al. (2012) argue that due to the multi-faceted nature of entrepreneurship, mixed-methods research may provide a better opportunity to understand the phenomenon under inquiry. One of the popular mixed-methods research designs in entrepreneurship research is qual (qualitative) → QUAN (quantitative), where the qualitative phase provides an understanding of the context and theoretical assumptions that can be tested in the quantitative phase (Molina-Azorín et al., 2012). Another purpose of starting with a qualitative study is to design a questionnaire for the qualitative phase. Although some mixed-methods studies revise or design the measurement instrument from qualitative findings, they do not clearly indicate the process thereof (Cliff, Jennings and Greenwood, 2006; Carter et al., 2007; Dewald et al., 2007; Camarero Izquierdo, Carrión and Gutiérrez, 2008; Chen, Yao and Kotha, 2009; Desa,
Anastacia Mamabolo and Kerrin Myres
www.ejbrm.com 105 ISSN 1477-7029
2012; Loué and Baronet, 2012; Murnieks et al., 2016). This gap creates an opportunity for this study to provide a better comprehension of the approach to convert qualitative findings into a quantitative survey instrument.
2.3 Sequential-Exploratory Design
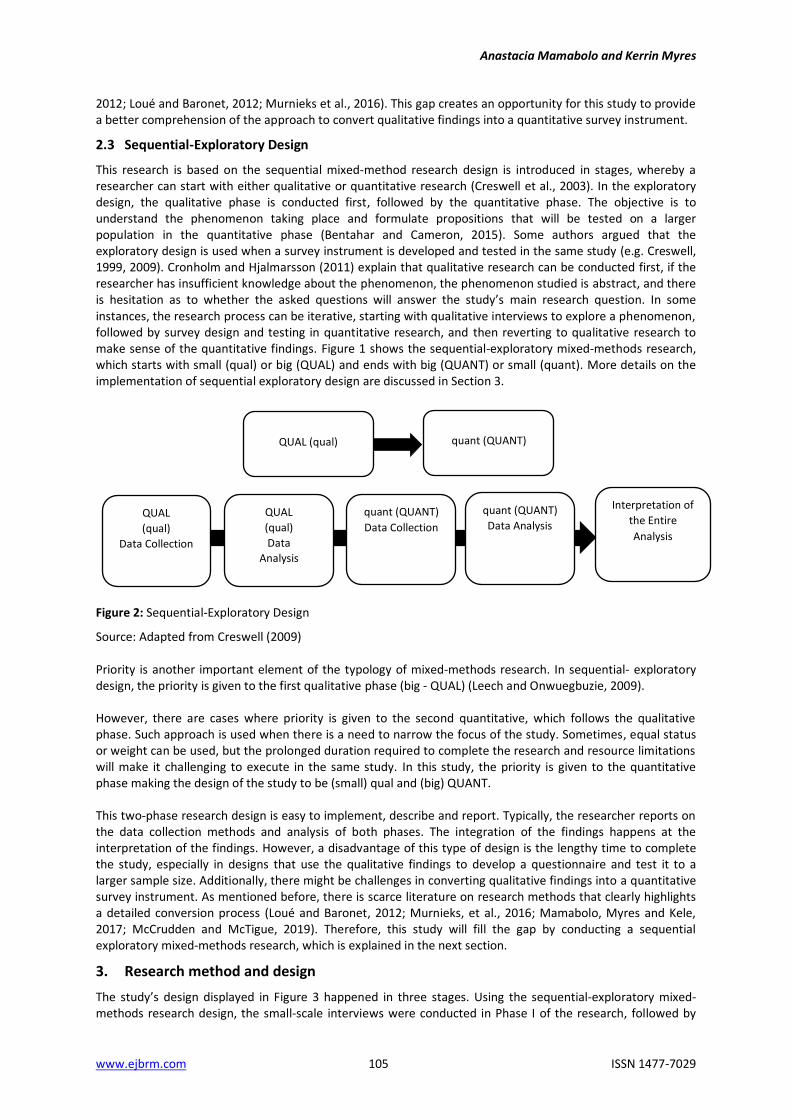
This research is based on the sequential mixed-method research design is introduced in stages, whereby a researcher can start with either qualitative or quantitative research (Creswell et al., 2003). In the exploratory design, the qualitative phase is conducted first, followed by the quantitative phase. The objective is to understand the phenomenon taking place and formulate propositions that will be tested on a larger population in the quantitative phase (Bentahar and Cameron, 2015). Some authors argued that the exploratory design is used when a survey instrument is developed and tested in the same study (e.g. Creswell, 1999, 2009). Cronholm and Hjalmarsson (2011) explain that qualitative research can be conducted first, if the researcher has insufficient knowledge about the phenomenon, the phenomenon studied is abstract, and there is hesitation as to whether the asked questions will answer the study’s main research question. In some instances, the research process can be iterative, starting with qualitative interviews to explore a phenomenon, followed by survey design and testing in quantitative research, and then reverting to qualitative research to make sense of the quantitative findings. Figure 1 shows the sequential-exploratory mixed-methods research, which starts with small (qual) or big (QUAL) and ends with big (QUANT) or small (quant). More details on the implementation of sequential exploratory design are discussed in Section 3.
Figure 2: Sequential-Exploratory Design
Source: Adapted from Creswell (2009) Priority is another important element of the typology of mixed-methods research. In sequential- exploratory design, the priority is given to the first qualitative phase (big - QUAL) (Leech and Onwuegbuzie, 2009). However, there are cases where priority is given to the second quantitative, which follows the qualitative phase. Such approach is used when there is a need to narrow the focus of the study. Sometimes, equal status or weight can be used, but the prolonged duration required to complete the research and resource limitations will make it challenging to execute in the same study. In this study, the priority is given to the quantitative phase making the design of the study to be (small) qual and (big) QUANT. This two-phase research design is easy to implement, describe and report. Typically, the researcher reports on the data collection methods and analysis of both phases. The integration of the findings happens at the interpretation of the findings. However, a disadvantage of this type of design is the lengthy time to complete the study, especially in designs that use the qualitative findings to develop a questionnaire and test it to a larger sample size. Additionally, there might be challenges in converting qualitative findings into a quantitative survey instrument. As mentioned before, there is scarce literature on research methods that clearly highlights a detailed conversion process (Loué and Baronet, 2012; Murnieks, et al., 2016; Mamabolo, Myres and Kele, 2017; McCrudden and McTigue, 2019). Therefore, this study will fill the gap by conducting a sequential exploratory mixed-methods research, which is explained in the next section.
3. Research method and design
The study’s design displayed in Figure 3 happened in three stages. Using the sequential-exploratory mixed-methods research design, the small-scale interviews were conducted in Phase I of the research, followed by
QUAL (qual)
Interpretation of
the Entire
Analysis
quant (QUANT)
QUAL
(qual)
Data Collection
quant (QUANT)
Data Collection
quant (QUANT)
Data Analysis QUAL
(qual)
Data
Analysis
The Electronic Journal of Business Research Methods Volume 17 Issue 3 2019
www.ejbrm.com 106 ©ACPIL
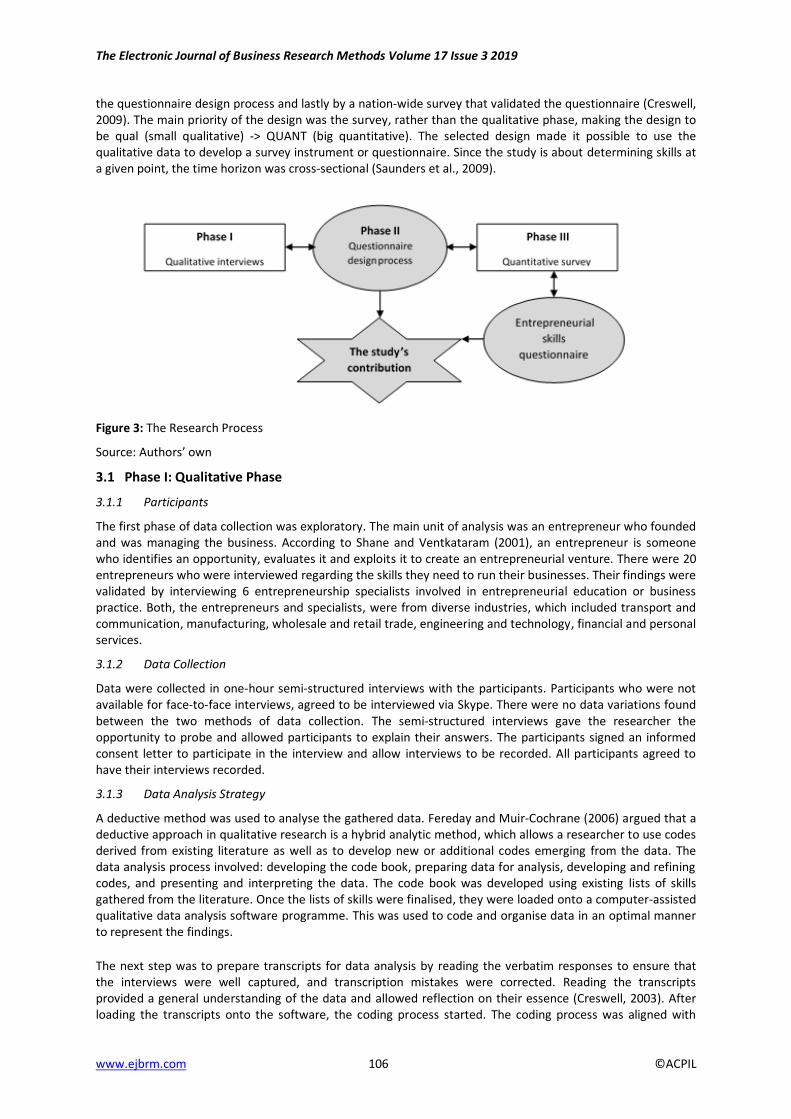
the questionnaire design process and lastly by a nation-wide survey that validated the questionnaire (Creswell, 2009). The main priority of the design was the survey, rather than the qualitative phase, making the design to be qual (small qualitative) -> QUANT (big quantitative). The selected design made it possible to use the qualitative data to develop a survey instrument or questionnaire. Since the study is about determining skills at a given point, the time horizon was cross-sectional (Saunders et al., 2009).
Figure 3: The Research Process
Source: Authors’ own
3.1 Phase I: Qualitative Phase
3.1.1 Participants
The first phase of data collection was exploratory. The main unit of analysis was an entrepreneur who founded and was managing the business. According to Shane and Ventkataram (2001), an entrepreneur is someone who identifies an opportunity, evaluates it and exploits it to create an entrepreneurial venture. There were 20 entrepreneurs who were interviewed regarding the skills they need to run their businesses. Their findings were validated by interviewing 6 entrepreneurship specialists involved in entrepreneurial education or business practice. Both, the entrepreneurs and specialists, were from diverse industries, which included transport and communication, manufacturing, wholesale and retail trade, engineering and technology, financial and personal services.
3.1.2 Data Collection
Data were collected in one-hour semi-structured interviews with the participants. Participants who were not available for face-to-face interviews, agreed to be interviewed via Skype. There were no data variations found between the two methods of data collection. The semi-structured interviews gave the researcher the opportunity to probe and allowed participants to explain their answers. The participants signed an informed consent letter to participate in the interview and allow interviews to be recorded. All participants agreed to have their interviews recorded.
3.1.3 Data Analysis Strategy
A deductive method was used to analyse the gathered data. Fereday and Muir-Cochrane (2006) argued that a deductive approach in qualitative research is a hybrid analytic method, which allows a researcher to use codes derived from existing literature as well as to develop new or additional codes emerging from the data. The data analysis process involved: developing the code book, preparing data for analysis, developing and refining codes, and presenting and interpreting the data. The code book was developed using existing lists of skills gathered from the literature. Once the lists of skills were finalised, they were loaded onto a computer-assisted qualitative data analysis software programme. This was used to code and organise data in an optimal manner to represent the findings.
The next step was to prepare transcripts for data analysis by reading the verbatim responses to ensure that the interviews were well captured, and transcription mistakes were corrected. Reading the transcripts provided a general understanding of the data and allowed reflection on their essence (Creswell, 2003). After loading the transcripts onto the software, the coding process started. The coding process was aligned with
Anastacia Mamabolo and Kerrin Myres
www.ejbrm.com 107 ISSN 1477-7029
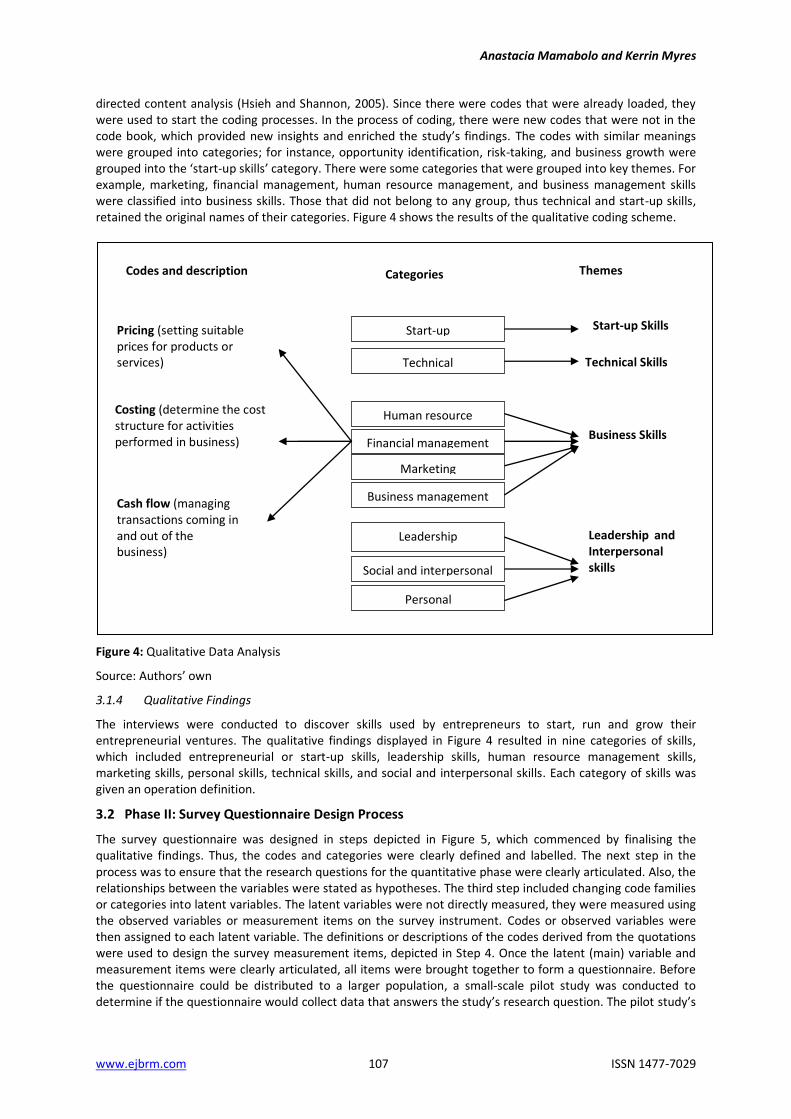
directed content analysis (Hsieh and Shannon, 2005). Since there were codes that were already loaded, they were used to start the coding processes. In the process of coding, there were new codes that were not in the code book, which provided new insights and enriched the study’s findings. The codes with similar meanings were grouped into categories; for instance, opportunity identification, risk-taking, and business growth were grouped into the ‘start-up skills’ category. There were some categories that were grouped into key themes. For example, marketing, financial management, human resource management, and business management skills were classified into business skills. Those that did not belong to any group, thus technical and start-up skills, retained the original names of their categories. Figure 4 shows the results of the qualitative coding scheme.
Figure 4: Qualitative Data Analysis
Source: Authors’ own
3.1.4 Qualitative Findings
The interviews were conducted to discover skills used by entrepreneurs to start, run and grow their entrepreneurial ventures. The qualitative findings displayed in Figure 4 resulted in nine categories of skills, which included entrepreneurial or start-up skills, leadership skills, human resource management skills, marketing skills, personal skills, technical skills, and social and interpersonal skills. Each category of skills was given an operation definition.
3.2 Phase II: Survey Questionnaire Design Process
The survey questionnaire was designed in steps depicted in Figure 5, which commenced by finalising the qualitative findings. Thus, the codes and categories were clearly defined and labelled. The next step in the process was to ensure that the research questions for the quantitative phase were clearly articulated. Also, the relationships between the variables were stated as hypotheses. The third step included changing code families or categories into latent variables. The latent variables were not directly measured, they were measured using the observed variables or measurement items on the survey instrument. Codes or observed variables were then assigned to each latent variable. The definitions or descriptions of the codes derived from the quotations were used to design the survey measurement items, depicted in Step 4. Once the latent (main) variable and measurement items were clearly articulated, all items were brought together to form a questionnaire. Before the questionnaire could be distributed to a larger population, a small-scale pilot study was conducted to determine if the questionnaire would collect data that answers the study’s research question. The pilot study’s
Start-up
Technical
Human resource
Financial management
Marketing
Social and interpersonal
Business Skills
Business management Management
Leadership Leadership and Interpersonal skills
Start-up Skills
Technical Skills
Codes and description Categories Themes
Pricing (setting suitable prices for products or services)
Costing (determine the cost structure for activities performed in business)
Cash flow (managing transactions coming in and out of the business)
Personal
The Electronic Journal of Business Research Methods Volume 17 Issue 3 2019
www.ejbrm.com 108 ©ACPIL
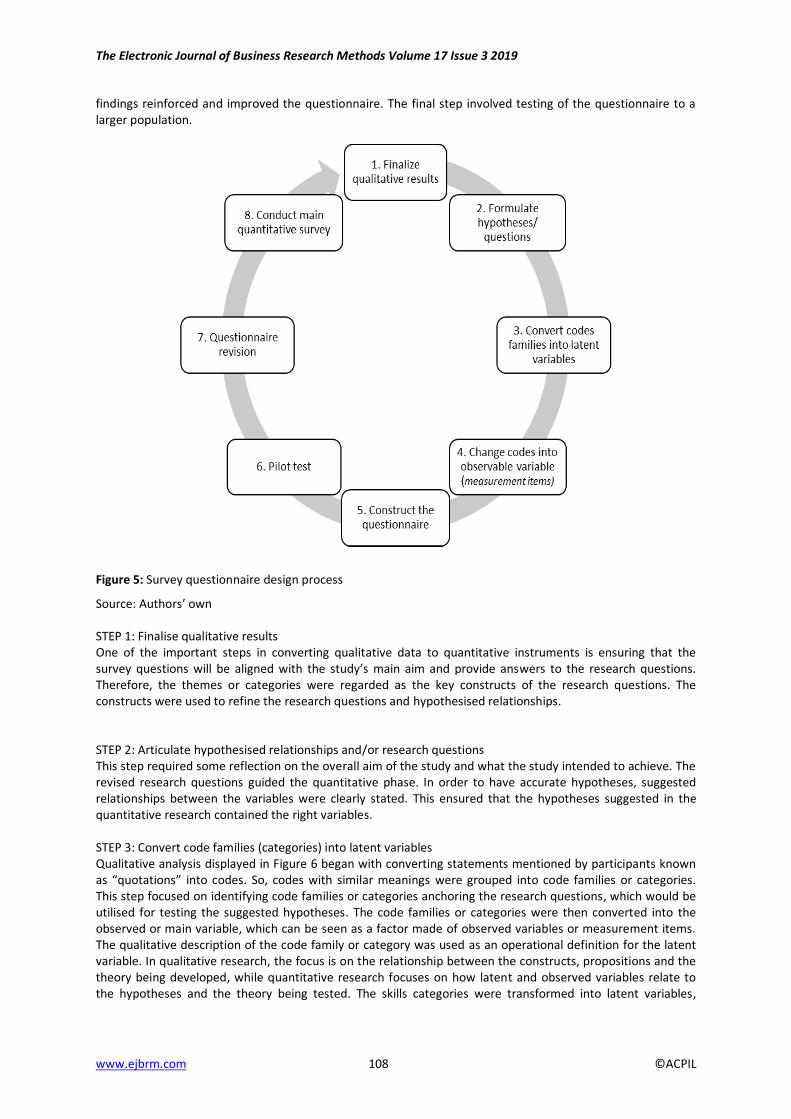
findings reinforced and improved the questionnaire. The final step involved testing of the questionnaire to a larger population.
Figure 5: Survey questionnaire design process
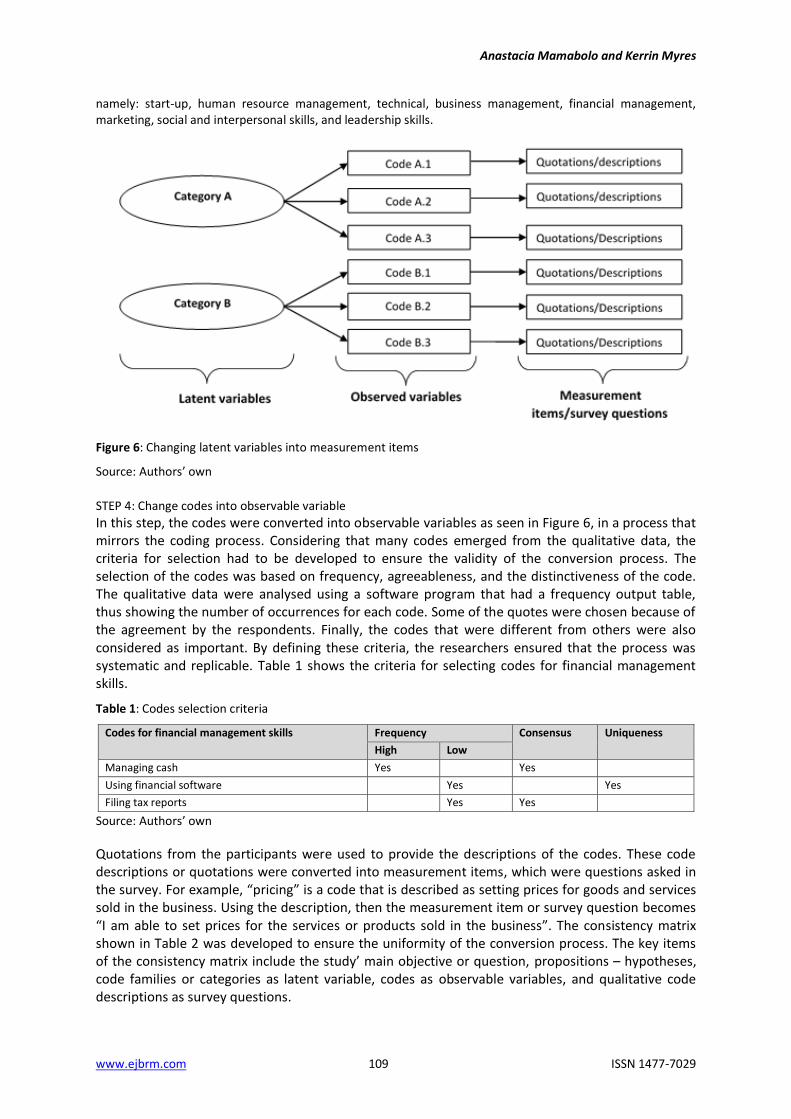
Source: Authors’ own STEP 1: Finalise qualitative results One of the important steps in converting qualitative data to quantitative instruments is ensuring that the survey questions will be aligned with the study’s main aim and provide answers to the research questions. Therefore, the themes or categories were regarded as the key constructs of the research questions. The constructs were used to refine the research questions and hypothesised relationships. STEP 2: Articulate hypothesised relationships and/or research questions This step required some reflection on the overall aim of the study and what the study intended to achieve. The revised research questions guided the quantitative phase. In order to have accurate hypotheses, suggested relationships between the variables were clearly stated. This ensured that the hypotheses suggested in the quantitative research contained the right variables. STEP 3: Convert code families (categories) into latent variables Qualitative analysis displayed in Figure 6 began with converting statements mentioned by participants known as “quotations” into codes. So, codes with similar meanings were grouped into code families or categories. This step focused on identifying code families or categories anchoring the research questions, which would be utilised for testing the suggested hypotheses. The code families or categories were then converted into the observed or main variable, which can be seen as a factor made of observed variables or measurement items. The qualitative description of the code family or category was used as an operational definition for the latent variable. In qualitative research, the focus is on the relationship between the constructs, propositions and the theory being developed, while quantitative research focuses on how latent and observed variables relate to the hypotheses and the theory being tested. The skills categories were transformed into latent variables,
Anastacia Mamabolo and Kerrin Myres
www.ejbrm.com 109 ISSN 1477-7029
namely: start-up, human resource management, technical, business management, financial management, marketing, social and interpersonal skills, and leadership skills.
Figure 6: Changing latent variables into measurement items
Source: Authors’ own
STEP 4: Change codes into observable variable
In this step, the codes were converted into observable variables as seen in Figure 6, in a process that mirrors the coding process. Considering that many codes emerged from the qualitative data, the criteria for selection had to be developed to ensure the validity of the conversion process. The selection of the codes was based on frequency, agreeableness, and the distinctiveness of the code. The qualitative data were analysed using a software program that had a frequency output table, thus showing the number of occurrences for each code. Some of the quotes were chosen because of the agreement by the respondents. Finally, the codes that were different from others were also considered as important. By defining these criteria, the researchers ensured that the process was systematic and replicable. Table 1 shows the criteria for selecting codes for financial management skills.
Table 1: Codes selection criteria
Codes for financial management skills Frequency Consensus Uniqueness
High Low
Managing cash Yes Yes
Using financial software Yes Yes
Filing tax reports Yes Yes
Source: Authors’ own
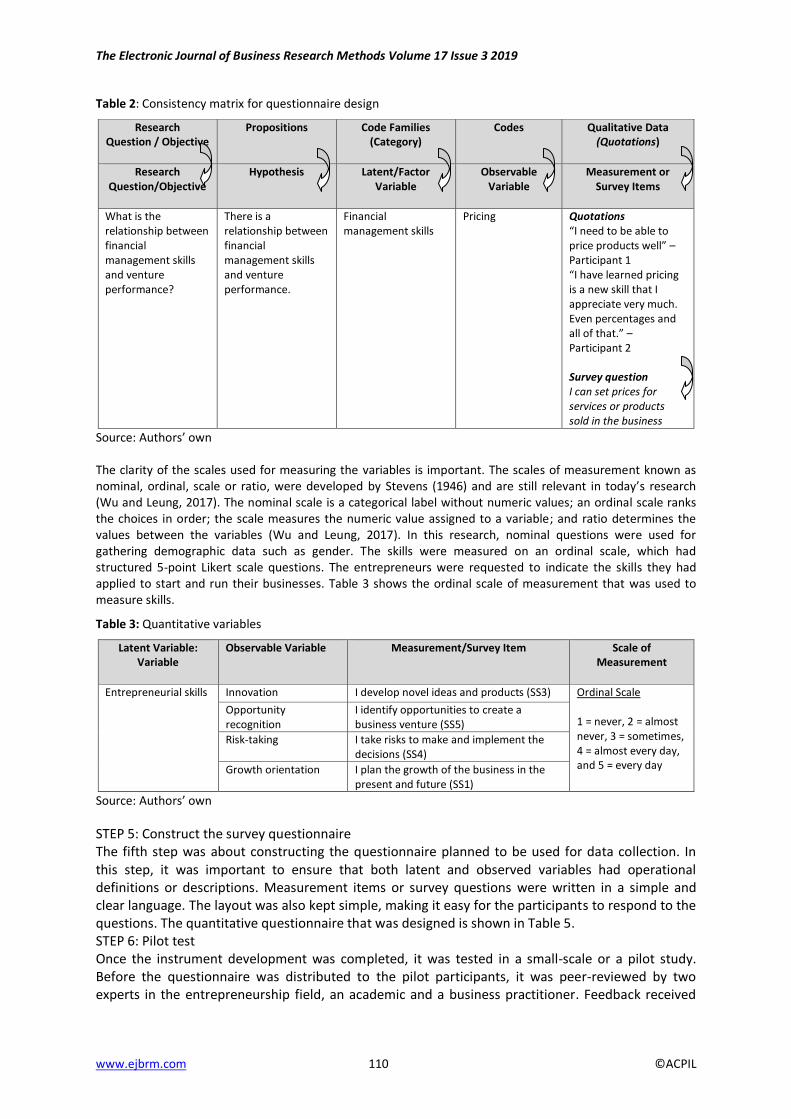
Quotations from the participants were used to provide the descriptions of the codes. These code descriptions or quotations were converted into measurement items, which were questions asked in the survey. For example, “pricing” is a code that is described as setting prices for goods and services sold in the business. Using the description, then the measurement item or survey question becomes “I am able to set prices for the services or products sold in the business”. The consistency matrix shown in Table 2 was developed to ensure the uniformity of the conversion process. The key items of the consistency matrix include the study’ main objective or question, propositions – hypotheses, code families or categories as latent variable, codes as observable variables, and qualitative code descriptions as survey questions.
The Electronic Journal of Business Research Methods Volume 17 Issue 3 2019
www.ejbrm.com 110 ©ACPIL
Table 2: Consistency matrix for questionnaire design
Research Question / Objective
Propositions Code Families (Category)
Codes Qualitative Data (Quotations)
Research Question/Objective
Hypothesis
Latent/Factor Variable
Observable Variable
Measurement or Survey Items
What is the relationship between financial management skills and venture performance?
There is a relationship between financial management skills and venture performance.
Financial management skills
Pricing Quotations “I need to be able to price products well” – Participant 1 “I have learned pricing is a new skill that I appreciate very much. Even percentages and all of that.” – Participant 2 Survey question I can set prices for services or products sold in the business
Source: Authors’ own The clarity of the scales used for measuring the variables is important. The scales of measurement known as nominal, ordinal, scale or ratio, were developed by Stevens (1946) and are still relevant in today’s research (Wu and Leung, 2017). The nominal scale is a categorical label without numeric values; an ordinal scale ranks the choices in order; the scale measures the numeric value assigned to a variable; and ratio determines the values between the variables (Wu and Leung, 2017). In this research, nominal questions were used for gathering demographic data such as gender. The skills were measured on an ordinal scale, which had structured 5-point Likert scale questions. The entrepreneurs were requested to indicate the skills they had applied to start and run their businesses. Table 3 shows the ordinal scale of measurement that was used to measure skills.
Table 3: Quantitative variables
Latent Variable: Variable
Observable Variable Measurement/Survey Item Scale of Measurement
Entrepreneurial skills Innovation I develop novel ideas and products (SS3) Ordinal Scale 1 = never, 2 = almost never, 3 = sometimes, 4 = almost every day, and 5 = every day
Opportunity recognition
I identify opportunities to create a business venture (SS5)
Risk-taking I take risks to make and implement the decisions (SS4)
Growth orientation I plan the growth of the business in the present and future (SS1)
Source: Authors’ own
STEP 5: Construct the survey questionnaire The fifth step was about constructing the questionnaire planned to be used for data collection. In this step, it was important to ensure that both latent and observed variables had operational definitions or descriptions. Measurement items or survey questions were written in a simple and clear language. The layout was also kept simple, making it easy for the participants to respond to the questions. The quantitative questionnaire that was designed is shown in Table 5. STEP 6: Pilot test Once the instrument development was completed, it was tested in a small-scale or a pilot study. Before the questionnaire was distributed to the pilot participants, it was peer-reviewed by two experts in the entrepreneurship field, an academic and a business practitioner. Feedback received
Anastacia Mamabolo and Kerrin Myres
www.ejbrm.com 111 ISSN 1477-7029
from the experts helped to improve the quality of the questionnaire, which was then distributed to entrepreneurs.
STEP 7: Questionnaire revision The results from the pilot test showed that some of the skills statements were too complex for the entrepreneurs to understand and not clear enough. In addition, the results of the qualitative study were used to inform any modifications to the questionnaires. The problematic survey questions were removed from the questionnaire before it was used in the main study. After the pilot study and questionnaire revision processes, the content and face validity of the questionnaire were justified.
3.3 Phase III: Quantitative Phase
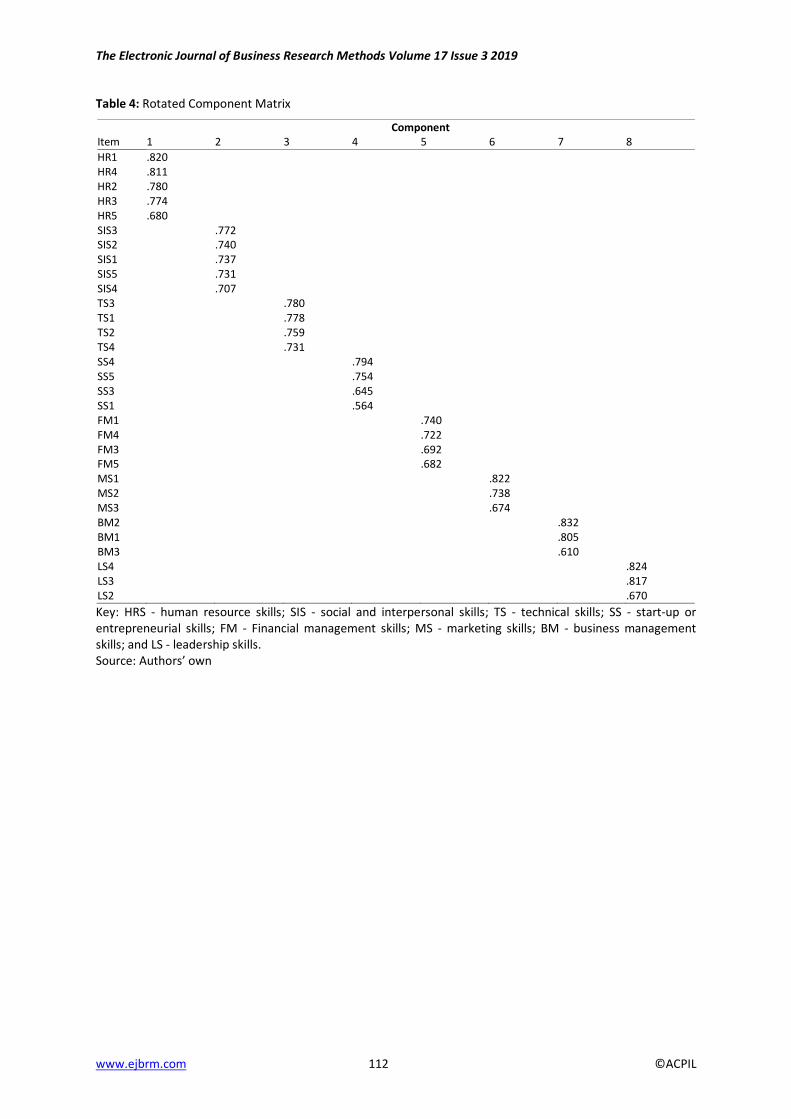
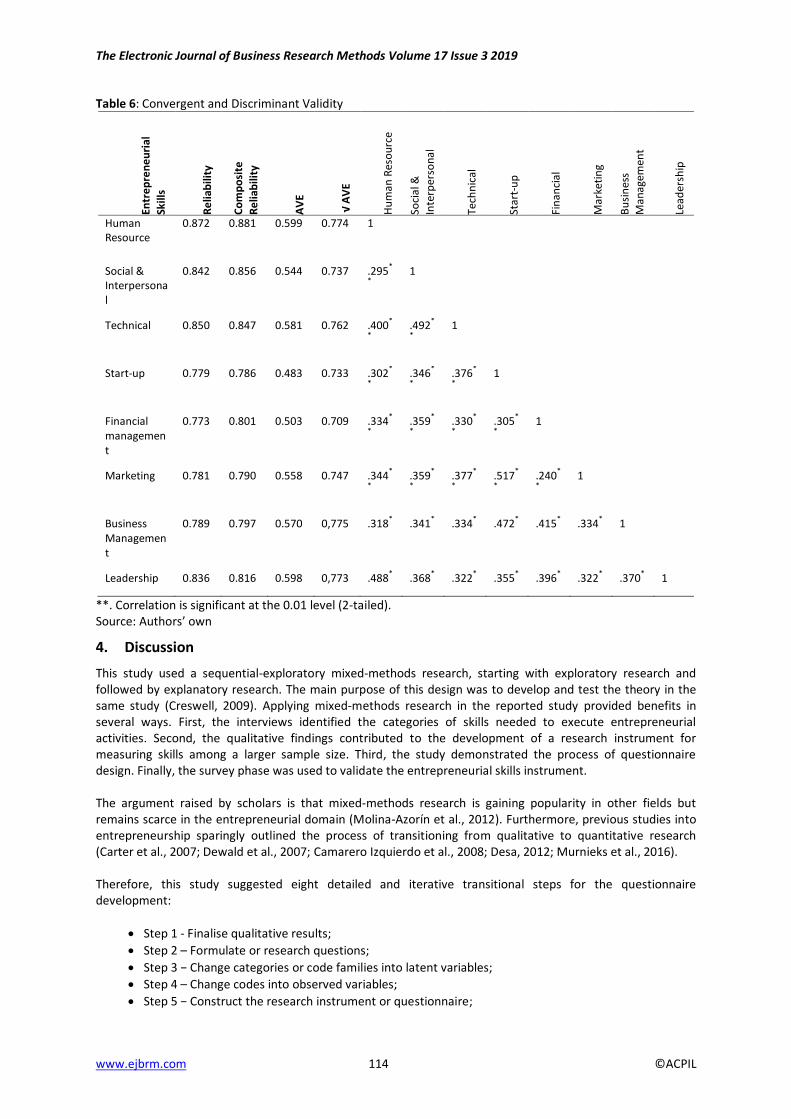
In the quantitative phase, the designed instrument was tested on a bigger sample of entrepreneurs than those in the qualitative phase. Similar to the qualitative phase, an entrepreneur who founded the business was the main respondent. The questionnaire had closed-ended questions, which were answered using an online software program. The online questionnaire was shared with entrepreneurs in all South African provinces. At the closure of the survey and data cleaning, 235 respondents made the final sample. In the sample, 35% are female and 65% are male entrepreneurs, actively engaged in entrepreneurial activities. Exploratory factor analysis using principal component extraction, was run to determine the underlying skills factor. The Kaiser-Meyer-Olkin Measure of Sampling Adequacy was 0.873 and Bartlett's Test of Sphericity had a p = 0.000, showing that the data were adequate to conduct factor analysis. The communalities were good, with the lowest (SS1 – planning the growth of the entrepreneurial venture) at 0.570 and the highest (sharing the business’s vision and mission) at 0.809. The Varimax rotation resulted in eight factors, which were: Factor 1 – human resource skills; Factor 2 – social and interpersonal skills; Factor 3- technical skills; Factor 4 – start-up skills; Factor 5 – financial management; Factor 6 – marketing skills; Factor 7 – business management skills and Factor 8 – leadership skills. Personal skills had a poor loading and was excluded during the dimension reduction process. This may be due to the notion that some of the personal skills such as resilience, passion, and discipline are behaviours rather than skills (Rauch and Frese, 2007; Chell, 2013). After the dimension reduction, the total variance explained by the factors was 69%, with human resource, and social and interpersonal skills having variance scores slightly above 10%. All factors depicted in Table 5 had a good reliability score above the required 0.70 (Kline, 2011). Convergent and discriminant validity were used to determine whether the questionnaire measured what it was intended to measure (Hair, Black, Babin, Anderson and Tatham, 2010). The convergent validity, shown in Tables 5 and 6, showed that the composite reliability for all skills categories was above the required 0.70 (Kline, 2011). The average variance extracted (AVE) for all categories of skills except start-up skills, met the required 0.50 (Hair et al., 2010). Start-up skills had an AVE slightly below 0.50. A contributing factor to this finding was the measurement item “I plan the growth in the current and future terms”, which had a low factor loading of 0.564 when compared to the other factors. With the removal of this item, the AVE improved to 0.538. One of the characteristics of an entrepreneurial venture distinguishing it from an established business is the intention to grow; therefore, this measurement item was not removed, but was included in the analysis. Researchers have an option to include or exclude this measurement items in future skills research. Retesting the questionnaire in future and in different entrepreneurial skills studies will improve its validity. The discriminant validity depicted in Table 6, was determined by the square root of the AVE. The findings showed that Square Root of AVE scores for all categories of skills were above the correlations between the constructs. Therefore, the findings suggest that the instrument designed is valid and reliable.
The Electronic Journal of Business Research Methods Volume 17 Issue 3 2019
www.ejbrm.com 112 ©ACPIL
Table 4: Rotated Component Matrix
Item Component
1 2 3 4 5 6 7 8
HR1 .820 HR4 .811 HR2 .780 HR3 .774 HR5 .680 SIS3 .772 SIS2 .740 SIS1 .737 SIS5 .731 SIS4 .707 TS3 .780 TS1 .778 TS2 .759 TS4 .731 SS4 .794 SS5 .754 SS3 .645 SS1 .564 FM1 .740 FM4 .722 FM3 .692 FM5 .682 MS1 .822 MS2 .738 MS3 .674 BM2 .832 BM1 .805 BM3 .610 LS4 .824 LS3 .817 LS2 .670
Key: HRS - human resource skills; SIS - social and interpersonal skills; TS - technical skills; SS - start-up or entrepreneurial skills; FM - Financial management skills; MS - marketing skills; BM - business management skills; and LS - leadership skills. Source: Authors’ own

Anastacia Mamabolo and Kerrin Myres
www.ejbrm.com 113 ISSN 1477-7029
Table 5: Quantitative Questionnaire Category Measurement Items Reliability Composite
Reliability Discriminant Validity (AVE)
Start-up skills -I plan the growth in current and future terms (SS1) 0.779 0.786 0.483
-I develop novel ideas and products (SS3)
-I take risks to make and implement the decisions (SS4)
-I identify opportunities to create an entrepreneurial venture (SS5)
Business management skills
-I diagnose and solve challenges related to managing a business (BM 1)
0.789 0.797 0.570
-I plan and organise tasks to run the business daily (BM2)
-I take decisions to run the business daily (BM3)
Marketing skills
- I conduct market research (MS1) 0.781 0.790 0.558
-I monitor and benchmark businesses like the one I run (MS2)
-I position the business in the suitable market (MS3)
Financial management skills
-I set suitable prices for products or services (FM1) 0.773 0.801 0.503
-I manage cash transactions coming in and out of the business (FM3)
-I determine the cost structure for activities performed in the business (FM4)
-I read and analyse the financial statements (FM5)
Human resource management skills
-I recruit and employ the right employees to work in the business (HRS1)
0.872 0.881 0.599
-I evaluate the employees’ level of skills to execute activities assigned to them (HRS2)
-I design the job descriptions for the employees (HRS3)
-I conduct performance management with the employees (HRS4)
-I implement policies on remuneration of employees (HRS5)
Technical skills
-I use the skills specific to the business’ industry (TS1) 0.850 0.847 0.581
-I develop either physical or service products (TS2)
-I manage the production processes of the products (TS3)
-I assess the quality of the produced products according to industry requirements standards (TS4)
Leadership skills
-I encourage and bring the best out in employees (LS2) 0.836 0.816 0.598
-I share the business’ vision and mission with the employees (LS3)
-I encourage employees to excel (LS4)
Social and interpersonal skills
-I care about the emotional well-being of others (SIS1) 0.842 0.856 0.544
-I communicate purposefully with all stakeholders (SIS2)
-I listen attentively to others (SIS3)
-I build trustworthy relationships with stakeholders (SIS4)
-I engage well with different cultures SIS5)
Source: Authors’ own
The Electronic Journal of Business Research Methods Volume 17 Issue 3 2019
www.ejbrm.com 114 ©ACPIL
Table 6: Convergent and Discriminant Validity
Entr
ep
ren
eu
rial
Skill
s
Re
liab
ility
Co
mp
osi
te
Re
liab
ility
AV
E
√ A
VE
Hu
man
Res
ou
rce
Soci
al &
Inte
rper
son
al
Tech
nic
al
Star
t-u
p
Fin
anci
al
Mar
keti
ng
Bu
sin
ess
Man
agem
ent
Lead
ersh
ip
Human Resource
0.872 0.881 0.599 0.774 1
Social & Interpersonal
0.842 0.856 0.544 0.737 .295*
*
1
Technical 0.850 0.847 0.581 0.762 .400*
*
.492*
*
1
Start-up 0.779 0.786 0.483 0.733 .302*
*
.346*
*
.376*
*
1
Financial management
0.773 0.801 0.503 0.709 .334*
*
.359*
*
.330*
*
.305*
*
1
Marketing 0.781 0.790 0.558 0.747 .344*
*
.359*
*
.377*
*
.517*
*
.240*
*
1
Business Management
0.789 0.797 0.570 0,775 .318* .341
* .334
* .472
* .415
* .334
* 1
Leadership 0.836 0.816 0.598 0,773 .488* .368
* .322
* .355
* .396
* .322
* .370
* 1
**. Correlation is significant at the 0.01 level (2-tailed). Source: Authors’ own
4. Discussion
This study used a sequential-exploratory mixed-methods research, starting with exploratory research and followed by explanatory research. The main purpose of this design was to develop and test the theory in the same study (Creswell, 2009). Applying mixed-methods research in the reported study provided benefits in several ways. First, the interviews identified the categories of skills needed to execute entrepreneurial activities. Second, the qualitative findings contributed to the development of a research instrument for measuring skills among a larger sample size. Third, the study demonstrated the process of questionnaire design. Finally, the survey phase was used to validate the entrepreneurial skills instrument. The argument raised by scholars is that mixed-methods research is gaining popularity in other fields but remains scarce in the entrepreneurial domain (Molina-Azorín et al., 2012). Furthermore, previous studies into entrepreneurship sparingly outlined the process of transitioning from qualitative to quantitative research (Carter et al., 2007; Dewald et al., 2007; Camarero Izquierdo et al., 2008; Desa, 2012; Murnieks et al., 2016). Therefore, this study suggested eight detailed and iterative transitional steps for the questionnaire development:
Step 1 - Finalise qualitative results;
Step 2 – Formulate or research questions;
Step 3 − Change categories or code families into latent variables;
Step 4 – Change codes into observed variables;
Step 5 − Construct the research instrument or questionnaire;

Anastacia Mamabolo and Kerrin Myres
www.ejbrm.com 115 ISSN 1477-7029
Step 6 − Conduct a small-scale pilot study;
Step 7 − Revise the questionnaire; and
Step 8 – Validate the questionnaire on a larger sample of participants. Some of these steps were similar to those of Crede and Borrego (2013) in their study of examining the retention of graduate engineering students. The findings indicate that the final skills identified in this study are similar to those that are reported in relevant literature. They are start-up skills (Timmons, 1999; Shane, 2000; Prüfer and Prüfer, 2019); technical skills (Lichtenstein and Lyons, 2001; Chang and Rieple, 2013); business management skills (Hisrich, Peters & Sheperd, 2005; Loué & Baronet, 2012; Narkhede, Nehete, Raut and Mahajan, 2014); financial management skills (Botha, Nieman and van Vuuren, 2006; Loué and Baronet, 2012); marketing skills (Botha et al., 2006; Van Scheers, 2011); human resource management skills (Botha et al., 2006; Loué and Baronet, 2012; Chell, 2013); social and interpersonal skills (Baron and Markman, 2000; Baron and Tang, 2009; Morales and Marquina, 2013); and leadership skills (Loué and Baronet, 2012; Chell, 2013). Although personal skills identified in the qualitative phase are similar to those in the literature (Lichtenstein and Lyons, 2001; Timmons and Spinelli, 2004; Chang and Ripple, 2013), they were eliminated in the dimension reduction process or factor analysis. This is due to the notion that some of the personal skills are behaviours, which might be difficult to measure and not skills (Rauch and Frese, 2007; Chell, 2013). The main contribution of this study is the research instrument that measures the eight categories of skills in one study. The instrument contains the key or foundational skills that may be applicable in any entrepreneurial venture and industry. The next section concludes this paper by alerting the reader to its implications and recommendations for business practice and for academia.
5. Conclusion
The aim of this study is to enhance understanding of how qualitative and quantitative data can be combined in sequential mixed-method research, thereby illustrating “the actual use and integration of qualitative and quantitative methods” (Maxwell, 2016, p.21). The reported study sets out to identify and design a skills measurement instrument and show how this was done methodologically. An argument raised is that scholars have sparingly discussed the conversion from qualitative to quantitative research. The suggested research objectives are met, and the study makes two important contributions. First, the study articulates a clear and replicable 8-Step questionnaire development process using qualitative research, thereby making a methodological contribution to mixed-method designs. Second, the study develops a research instrument that can be used to measure the level of entrepreneurial skills. Finally, the research suggests implications to research methodology, entrepreneurship scholarships and practice.
5.1 The Implications for Research Methodology
The study suggests that entrepreneurship and management research can be expanded by using mixed-methods research. Scholars can adapt the conversion procedure illustratively used in this study when designing questionnaires in sequential-exploratory mixed-methods research. This conversion process is not exclusive to entrepreneurship but can be equally well applied in other fields of inquiry. As more researchers document their conversion processes, the rigour and validity of the steps will be improved. Therefore, the suggested conversion serves as a contribution to the mixed-methods research filed.
5.2 The Implications for Entrepreneurship Scholarship
The survey instrument can be used by scholars to further entrepreneurship skills research. Such future studies can focus on testing the instrument in different contexts and with larger populations to develop robust categories of skills and their measurement items. The designed questionnaire can be used to determine the relationship between skills and other variables such as business growth or profitability. Since the personal skills were excluded from the analysis because of their behavioural nature, future studies should explore the nature of personal attributes. Finally, comparative studies can be conducted to determine the industry and contextual differences regarding skills requirements.
The Electronic Journal of Business Research Methods Volume 17 Issue 3 2019
www.ejbrm.com 116 ©ACPIL
5.3 The Implications for Practice
The questionnaire developed in this study can be used by training institutions as a framework to teach skills in entrepreneurship courses. Further, the tool can be used to assess the level and kind of skills that entrepreneurs have before and after training. Having information about the skills entrepreneurs need, can be one way of ensuring that they learn the relevant skills to perform entrepreneurial tasks in an efficient and effective manner and become successful in their business ventures. Finally, potential entrepreneurs can use the designed questionnaire to measure the level of their skills and identify the skills gaps that must be filled so that they can successfully start and manage their ventures.
References
Baron, R.A. and Markman, G.D., 2000. Beyond social capital: How social skills can enhance entrepreneurs' success. Academy of Management Perspectives, 14(1), pp.106-116.
Baron, R.A. and Tang, J., 2009. Entrepreneurs' social skills and new venture performance: Mediating mechanisms and cultural generality. Journal of Management, 35(2), pp.282-306.
Becker, G.S., 1964. Human capital: A theoretical and empirical analysis, with special reference to education, National Bureau of Economic Research: New York.
Bentahar, O. and Cameron, R., 2015. Design and Implementation of a Mixed Method Research Study in Project Management. Electronic Journal of Business Research Methods, 13(1).
Botha, M., Nieman, G. and van Vuuren, J., 2006. Enhancing female entrepreneurship by enabling access to skills. The International Entrepreneurship and Management Journal, 2(4), pp.479-493.
Camarero Izquierdo, C., Carrión, C. H. and Gutiérrez, S. S. M., 2008. Developing relationships within the framework of local economic development in Spain. Entrepreneurship and Regional Development, 20(1), pp. 41-65.
Carter, S., Shaw, E., Lam, W. and Wilson, F., 2007. Gender, entrepreneurship, and bank lending: The criteria and processes used by bank loan officers in assessing applications. Entrepreneurship Theory and Practice, 31(3), pp. 427-444.
Castro, F. G., Kellison, J. G., Boyd, S. J. and Kopak, A., 2010. A methodology for conducting integrative mixed methods research and data analyses. Journal of Mixed Methods Research, 4(4), pp. 342-360.
Chang, J. and Rieple, A., 2013. Assessing students' entrepreneurial skills development in live projects. Journal of Small Business and Enterprise Development, 20(1), pp.225-241.
Chell, E., 2013). Review of skill and the entrepreneurial process. International Journal of Entrepreneurial Behaviour & Research, 19(1), pp. 6-31.
Chen, X. P., Yao, X. and Kotha, S., 2009. Entrepreneur passion and preparedness in business plan presentations: a persuasion analysis of venture capitalists' funding decisions. Academy of Management journal, 52(1), pp. 199-214.
Cliff, J. E., Jennings, P. D. and Greenwood, R., 2006. New to the game and questioning the rules: The experiences and beliefs of founders who start imitative versus innovative firms. Journal of Business Venturing, 21(5), pp. 633-663.
Crede, E. and Borrego, M., 2013. From ethnography to Items: a mixed methods approach to developing a survey to examine graduate engineering student retention. Journal of Mixed Methods Research, 7(1), pp. 62-80.
Creswell, J. W., 1999. Mixed-method research: introduction and application. In G. J. Cizek (Ed.), Handbook of Educational Policy (pp. 455-472). New York: Academic Press.
Creswell, J. W., 2003. Research design: Qualitative, quantitative, and mixed methods approaches. United Kingdom: Sage Publications.
Creswell, J. W., 2009. Research design: Qualitative, quantitative, and mixed methods approaches. United Kingdom: Sage Publications.
Creswell, J. W., Plano Clark, V. L., Gutmann, M. L., and Hanson, W. E., 2003. Advanced mixed methods research designs. Handbook of mixed methods in social and behavioral research, 209, 240.
Cronholm, S. and Hjalmarsson, A., 2011. Experiences from sequential use of mixed methods. The electronic journal of business research methods, 9(2), pp.87-95.
Denscombe, M., 2008. Communities of practice: A research paradigm for the mixed methods approach. Journal of mixed methods research, 2(3), 270-283.
Denzin, N.K., 1978. The research act (2nd ed.). New York: McGraw-Hill. Denzin, N.K., 2012. Triangulation 2.0. Journal of mixed methods research, 6(2), pp.80-88. Desa, G., 2012. Resource mobilization in international social entrepreneurship: Bricolage as a mechanism of institutional
transformation. Entrepreneurship Theory and Practice, 36(4), pp. 727-751. Dewald, J. R., Hall, J., Chrisman, J. J. and Kellermanns, F. W., 2007. The governance paradox: Preferences of small
vulnerable firms in the homebuilding industry. Entrepreneurship Theory and Practice, 31(2), pp.279-297. Fereday, J., and Muir-Cochrane, E., 2006. Demonstrating rigor using thematic analysis: A hybrid approach of inductive and
deductive coding and theme development. International journal of qualitative methods, 5(1), pp.80-92. Hair, J. F., Black, W. C., Babin, B. J., Anderson, R. E. and Tatham, R. L., 2010. Multivariate data analysis (7th ed.). Upper
Saddle River, NJ: Pearson Prentice Hall. Hisrich, R.D., Peters, M.P. and Sheperd, D.A., 2005. Entrepreneurship, international edition. Jick, T. D., 1979. “Mixing qualitative and quantitative methods: Triangulation in action”. Administrative science quarterly,
24(4), pp. 602-611.

Anastacia Mamabolo and Kerrin Myres
www.ejbrm.com 117 ISSN 1477-7029
Johnson, R. B., Onwuegbuzie, A. J., and Turner, L. A., 2007. Toward a definition of mixed methods research. Journal of mixed methods research, 1(2), 112-133.
Jick, T. D., 1979. Mixing qualitative and quantitative methods: Triangulation in action. Administrative science quarterly, 24(4), pp. 602-611.
Kline, R. B., 2011. Principles and practice of structural equation modelling. New York: Guilford press. Leech, N. L., and Onwuegbuzie, A. J., 2009. A typology of mixed methods research designs. Quality & quantity, 43(2), 265-
275. Lichtenstein, G.A. and Lyons, T.S., 2001. The entrepreneurial development system: Transforming business talent and
community economies. Economic Development Quarterly, 15(1), pp.3-20. Likert, R., 1932. A technique for the measurement of attitudes”. Archives of Psychology, 22, pp. 5-55. Loué, C., and Baronet, J., 2012. Toward a new entrepreneurial skills and competencies framework: a qualitative and
quantitative study. International Journal of Entrepreneurship and Small Business, 17(4), 455-477. Mamabolo, M.A., Kerrin, M. and Kele, T., 2017. Entrepreneurship management skills requirements in an emerging
economy: A South African outlook. Southern African Journal of Entrepreneurship and Small Business Management 9(1), a111, pp. 1-10. https://doi.org/10.4102/ sajesbm.v9i1.111
Maxwell, J.A., 2016. Expanding the history and range of mixed methods research. Journal of Mixed Methods Research, 10(1), pp.12-27.
McCrudden, M.T. and McTigue, E.M., 2019. Implementing integration in an explanatory sequential mixed methods study of belief bias about climate change with high school students. Journal of Mixed Methods Research, pp.1-20
Mitchell, A., 2018. A Review of Mixed Methods, Pragmatism and Abduction Techniques. The Electronic Journal of Business Research Methods, 16(3), pp. 103-116,
Molina-Azorin, J.F. and Fetters, M.D., 2019. Building a better world through mixed methods research. Journal of Mixed Methods Research, 13(3), pp. 275–281.
Molina-Azorín, J. F., López-Gamero, M. D., Pereira-Moliner, J. and Pertusa-Ortega, E. M., 2012. Mixed methods studies in entrepreneurship research: Applications and contributions. Entrepreneurship & Regional Development, 24(5-6), pp. 425-456.
Murnieks, C. Y., Cardon, M. S., Sudek, R., White, T. D. and Brooks, W. T., 2016. Drawn to the fire: The role of passion, tenacity and inspirational leadership in angel investing. Journal of Business Venturing, 31(4), pp. 468-484.
Narkhede, B.E., Nehete, R.S., Raut, R.D. and Mahajan, S.K., 2014. Impact of entrepreneurial skills on the firm’s performance: Evidence from manufacturing SMEs in India. International Journal of Indian Culture and Business Management, 8(2), pp.216-236.
Prüfer, J., and Prüfer, P., 2019. Data science for entrepreneurship research: studying demand dynamics for entrepreneurial skills in the Netherlands. Small Business Economics, pp. 1-22.
Rauch, A. and Frese, M., 2007. Let's put the person back into entrepreneurship research: A meta-analysis on the relationship between business owners' personality traits, business creation, and success. European Journal of work and organizational psychology, 16(4), pp.353-385.
Saunders, M., Lewis, P., & Thornhill, A., 2009. Research Methods for Business Students (5 th ed.). India: Pearson Education. Shane, S., 2000. Prior knowledge and the discovery of entrepreneurial opportunities. Organization science, 11(4), pp.448-
469. Shane, S. and Venkataraman, S., 2001. Entrepreneurship as a field of research: A response to Zahra and Dess, Singh, and
Erikson. Academy of management review, 26(1), pp.13-16. Shannon-Baker, P., 2016. Making paradigms meaningful in mixed methods research. Journal of mixed methods
research, 10(4), pp.319-334. Srnka, K. J., and Koeszegi, S. T., 2007. From words to numbers: how to transform qualitative data into meaningful
quantitative results. Schmalenbach Business Review, 59(1), pp. 29-57. Stevens, S.S., 1946. On the Theory of Scales of Measurement. Science, 103 (684), pp. 677-680. Timmons, J.A., 1999, New Venture Creation: Entrepreneurship for the 21st Century, Irwin McGraw‐Hill, New York, NY. Timmons, J. and Spinelli, S., 2004. New venture strategies: Entrepreneurship for the 21st century. Burr Ridge, IL: Irwin-
McGraw-Hill Publishers. Van Scheers, L., 2011. SMEs marketing skills challenges in South Africa. African Journal of Business Management, 5(13),
pp.5048-5056. Wu, H., and Leung, S. O., 2017. Can Likert scales be treated as interval scales?—A Simulation study. Journal of Social Service
Research, 43(4), pp.527-532.