Embed Size (px)
Citation preview
Solar Physics (2006) 236: 207–226
DOI: 10.1007/s11207-006-0142-1 C© Springer 2006
A DETAILED COMPARISON OF COSMIC RAY GAPS WITH SOLARGNEVYSHEV GAPS
R.P. KANEInstituto Nacional de Pesquisas Espaciais – INPE, C. P. 515, 12245-970 – Sao Jose dos Campos,
SP, Brazil(e-mail: [email protected])
(Received 27 January 2006; accepted 10 April 2006)
Abstract. After increasing almost monotonically from sunspot minimum, sunspot activity near max-
imum falters and remains in a narrow grove for several tens of months. During the 2–3 years of turmoil
near sunspot maximum, sunspots depict several peaks (Gnevyshev peaks). The spaces between suc-
cessive peaks are termed as Gnevyshev Gaps (GG). An examination showed that the depths of the
troughs varied considerably from one GG to the next in the same cycle, with magnitudes varying in
a wide range (<1% to ∼20%). In any cycle, the sunspot patterns were dissimilar to those of other
solar parameters, qualitatively as well as quantitatively, indicating a general turbulence, affecting
different solar parameters differently. The solar polar magnetic field reversal does not occur at the
beginning of the general turmoil; it occurs much later. For cosmic ray (CR) modulation which occurs
deep in the heliosphere, one would have thought that the solar open magnetic field flux would play
a crucial role, but observations show that the sunspot GGs are not reflected well in the solar open
magnetic flux, where sometimes only one peak occurred (hence no GG at all), not matching with
any sunspot peak and with different peaks in the northern and southern hemispheres (north – south
asymmetry). Gaps are seen in interplanetary parameters but these do not match exactly with sunspot
GGs. For CR data available only for five cycles (19 – 23), there are CR gaps in some cycles, but the
CR gaps do not match perfectly with gaps in the solar open magnetic field flux or in interplanetary
parameters or with sunspot GGs. Durations are different and/or there are variable delays, and mag-
nitudes of the sunspot GGs and CR gaps are not proportional. Solar polar magnetic field reversal
intervals do not coincide with either sunspot GGs or CR gaps, and some CR gaps start before mag-
netic field reversals, which should not happen if the magnetic field reversals are the cause of the CR
gaps.
1. Introduction
Sunspots have a major 11-year cycle. However, the maximum is not smooth butstructured. Two or more peaks can be identified during the solar maximum. Thissplitting of activity, identified for the first time in the green corona line intensitydata by Gnevyshev (1963, 1967), was earlier a subject of study mainly in the formerSoviet Union (e.g. Gnevyshev, 1977 and references therein). Since then, a double-peak structure has been reported for several solar and interplanetary phenomena(details in the review by Storini et al., 2003). It has been reported for cosmic raymodulation also, though this can happen only through the effects of solar phenom-ena on the heliosphere, where the main cosmic ray modulation occurs. For solarphenomena, Gnevyshev and co-investigators suggested that a dual-peaked activity
208 R.P. KANE
is seen in each 11-year cycle, with a first peak (occurring at all the solar latitudes)at the end of the increasing phase and a second one (but at lower solar latitudesonly) at the start of the declining phase. Hence, two waves of activity (partly su-perimposed in time) were proposed as the origin of the phenomenon. However,as described by Feminella and Storini (1997), the solar background activity tendsto be single peaked and the double peak appearance is related only to the grow-ing event importance in each layer of the solar atmosphere. These results indicatethat dynamical activity phenomena should be superimposed on a quasi-stationary11-year trend. Using Obridko and Shelting’s (1992) findings, clues for a link be-tween outstanding activity phenomena and the strength of the heliomagnetic fieldenergy were found. On this ground, during the inversion of the polar heliomagneticfield, a decrease (or a gap) in the number of high energy events occurs (GnevyshevGap, GG). Alania et al. (1999) state that in the course of Sun’s polar magnetic fieldreversal, a part of the Sun’s energy is used up for this reversal process. This impliesthat during such periods the interaction between “local magnetic fields” (particu-larly those connected with the processes involved in the development of large andcomplex active regions, Bumba and Howard, 1965) and the “background magneticfield” is suppressed, and large-scale dynamical phenomena cannot reach the solarcorona and hence they are not able to affect the interplanetary medium. The long-term behavior of the average current helicity of active regions demonstrates theGGs (Bao and Zhang, 1998; Storini et al., 1999a,b), in agreement with Bieber andRust’s (1995) computations on the long-term magnetic flux released from the Sun(Feminella and Storini, 1997) and the observation of Cane et al. (1999) that duringGG intervals the solar open magnetic flux attains the minimum value in each cycle(see some more details and contradictions in Kane, 2005a). Feminella and Storini(1997) demonstrated that during GG periods, intense solar activity is missing or itis really lower. It was also claimed that the solar atmospheric GG interval is moreeasily identified when parameters of energetic activity phenomena are considered.Moreover, the bimodal behavior of solar activity was stated to occur separately ineach solar hemisphere (Feminella and Storini, 1997), which implies that using solarparameters for the Sun as a star, the GG valley can be masked by the different GGtime occurrence in each hemisphere. On the other hand, during the past solar cycle22, the GG occurrence was reported to be practically synchronous in both hemi-spheres and the dual-peak solar activity cycle was illustrated by several researchers(Feminella and Storini, 1997; Storini, Massetti, and Antalova, 1997; Storini et al.,1997, 1999a; Atac and Ozguc, 1998; Bao and Zhang, 1998; Krainev et al., 1998;Bazilevskaya et al., 2000 among others).
When the galactic cosmic ray (CR) flux was investigated, a clear evidence ofa double-peaked trend in the CR modulation was found for two solar activity cy-cles (Storini, 1995; Storini and Pase, 1995; Storini, Massetti, and Antalova, 1997;Storini et al., 1997). Another aspect underlined at that time was that huge Forbushdecrease phenomena avoid the central part of the maximum solar activity phase. As
A DETAILED COMPARISON OF COSMIC RAY GAPS WITH SOLAR GNEVYSHEV GAPS 209
mentioned in Storini et al. (2003), in the international cosmic ray context, there wereother authors claiming for a period of relative quietness close to the sunspot max-imum. Nagashima, Sakakibara, and Morishita (1991) showed that the occurrenceof the most powerful solar cosmic-ray events (the so-called GLEs, ground-levelenhancements) obey the rule of “event gap” during the high-latitude solar mag-netic field reversals (which happens during the maximum activity phase), whileBazilevskaya et al. (1995) found in such periods a reduction of the power spectrumdensity of cosmic ray variations with a characteristic time of 26 – 29 days (see alsoSabbah et al., 1995; Vernova et al., 1995). Storini et al. (2003) state that it is moreeasy to identify such features in the interplanetary medium than in the solar atmo-sphere, particularly when a time scale from about one to twelve months is used inthe search. According to them, the GG reliability is very evident in: (i) the solarwind time series; (ii) the number of transient interplanetary perturbations (relatedto CMEs accompanied by solar flares); (iii) the number of transient interplanetaryshocks; (iv) the number and fluence of energetic solar proton events; (v) the numberof ground-level enhancements; (vi) the occurrence rate of extended bidirectional1 MeV ion flows observed by IMP8; (viii) the CR variability; (ix) the occurrenceof intense Forbush decreases (detailed references in Storini et al., 2003, who havealso discussed in detail the present views about the origin of the “Gnevyshev gap”).Recently, Ahluwalia and Kamide (2005) presented details about the associationof the Gnevyshev gap with the frequency of Forbush decreases and the associatedSSCs and claimed that the gap coincides with the epoch of solar polar magnetic fieldreversal. Storini and Laurenza (2003) presented results about the gaps in solar cycle22 for counting rates of a muon telescope and three neutron monitors of differentgeomagnetic rigidity cutoffs, and found GG in all of these, using 13-month runningaverages.
In all the works so far for various parameters (including interplanetary andcosmic rays), a gap anywhere between the first and the last peaks of sunspotsis considered a gap directly comparable with all other gaps. No attention ispaid as to whether the beginnings of these gaps matched within 2 – 3 months.This is important, because for ascertaining a cause-effect relationship, the causemust precede (or coincide with) the effect, not follow it. In a recent paper, Kane(2005a) illustrated the Gnevyshev gaps (GGs) in several solar parameters, indi-cated some dissimiliarities when monthly data were used, and suggested that theterm GG should be used only for solar parameters. In the present communica-tion, gaps are illustrated on short time-scales (months) for solar and interplane-tary parameters and for CR intensities to check whether the gaps (occurring dur-ing the 2 – 3 year interval near sunspot maximum) are qualitatively similar andsynchronous (within 2 – 3 months) in all these parameters. Data were obtainedfrom the NOAA websites (SPIDR etc.) for solar and interplanetary parametersand for CR neutron monitors, and for muons from the Nagoya University website,http://www.stelab.nagoya-u.ac.jp/ste-www1/div3/muon/muon3.html.
210 R.P. KANE
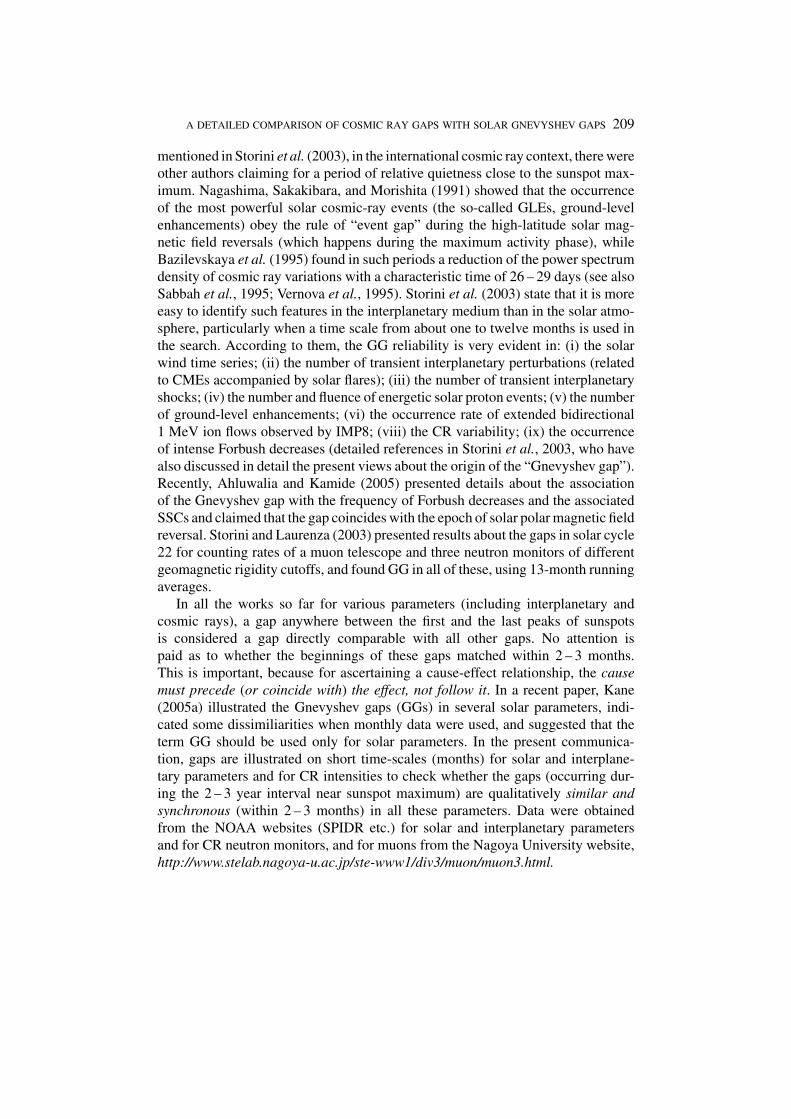
Figure 1. Plots of 3-monthly means (crosses) and 12-monthly running means (full lines) during
sunspot cycles 22 and 23 (1986 – 2004) for sunspot numbers Rz, 2800 MHz solar radio emission F10,
solar magnetic open flux at low solar latitudes, northern N, 0 to +45◦ and southern S, 0 to −45◦,
coronal green line index, cosmic ray neutron monitors at Thule, Calgary, Kiel, Moscow, Climax,
Huancayo-Haleakala, Hermanus, McMurdo, South pole, and Nagoya muon telescopes for vertical,
and inclined at 30◦ and 64◦ N, E, S, W.
2. Plots
Figure 1 shows the plots of 12-monthly running means (full lines) and the 3-monthlyvalues (crosses) for sunspots Rz, the 2800 MHz solar radio flux F10, solar openmagnetic flux for solar low latitude belts 0 to +45◦ and 0 to −45◦ (Wang andSheeley, 2002), Coronal green line index, and CR neutron monitor intensities atthe locations Thule (77◦N, 69◦W, cut-off rigidity <1 GV), Calgary (51◦N, 114◦W,
A DETAILED COMPARISON OF COSMIC RAY GAPS WITH SOLAR GNEVYSHEV GAPS 211
cut-off rigidity 1.1 GV), Kiel (54◦N, 10◦E, cut-off rigidity 2.3 GV), Moscow (55◦N,37◦E, cut-off rigidity 2.4 GV), Climax (39◦N, 106◦W, cut-off rigidity 3.0 GV),Huancayo (12◦S, 75◦W, cut-off rigidity 12.9 GV) Haleakala (20◦N, 56◦W, cut-offrigidity 12.9 GV), Hermanus (34◦S, 19◦E, cut-off rigidity 4.6 GV), McMurdo (78◦S,167◦E, cut-off rigidity <1 GV) and South Pole (90◦S, cut-off rigidity <1 GV), andfor Nagoya muons (35◦N, 137◦E, cut-off rigidity for Vertical, 11.5 GV; 30◦N, 12.9GV; 30◦E, 16.2 GV; 30◦S, 11.3 GV; 30◦W, 9.4 GV). Two basic features are evident,namely, the 11-year solar cycle changes and the structures (double peaks) near thesunspot maximum years. Only the latter will be discussed in detail in the presentcommunication. The following may be noted:
(1) In cycle 22, both sunspots Rz and solar radio flux F10 show double peaksnear sunspot maxima, crudely in 12-monthly means but more prominentlyin 3-monthly means, with peak separations of ∼30 months in cycle 22 and∼21 months in cycle 23. Bazilevskaya et al. (2000) mentioned that thestructured maximum appeared to be due to the superposition of two quasi-oscillating processes with characteristic time-scales of 11 years and of 1 – 3years (quasi-biennial oscillations) and that the absolute amplitude of thequasi-biennial oscillations depended on the 11-year cycle phase and reachedits maximum at the maximum of the 11-year cycle. This was confirmed ina general way in Kane (2005b,c), but Kane (2005b) emphasized that therewere many periodicities shorter than the QBO also.
(2) The low-latitude open flux shows only one peak in each hemisphere in eachof the cycles 22 and 23, and the peaks in S occur several months later thanthose in N. In cycle 22, the N and S peaks were 21 months apart, whilein cycle 23, these were 36 months apart. Thus, the matching between themagnetic peaks with sunspots and F10 is not good. In cycle 22, the open fluxpeak N almost coincides with the first peak of Rz, but in cycle 23, the openflux peak N occurred several (∼9) months earlier than the first Rz peak.
(3) The coronal green line index probably had double peaks in both cycles 22and 23, with peak separations of about 24 months in both.
(4) In CR neutron monitor counting rates, the two peaks are not clearly discern-able in the 12-month running means, and a broad plateau seems to have lastedfor ∼18 months in cycle 22 and ∼36 months in cycle 23. For muon countingrates of the Nagoya telescope, there are peaks in cycle 22 and 23 similar tothose for CR neutron monitors, but the troughs between the peaks are smallerfor higher zenith angles. Overall, the magnitudes of trough depths for muonsare very small (<1%).
Since 12-monthly running means seemed to reduce the Gnevyshev gap GGconsiderably, plots on finer time scales were examined. Figure 2 shows the plotsof monthly values (thin lines) with 3-monthly means superposed (thick lines),near sunspot maxima for cycle 22 (1988 – 1992) in the left half and for cycle 23
212 R.P. KANE
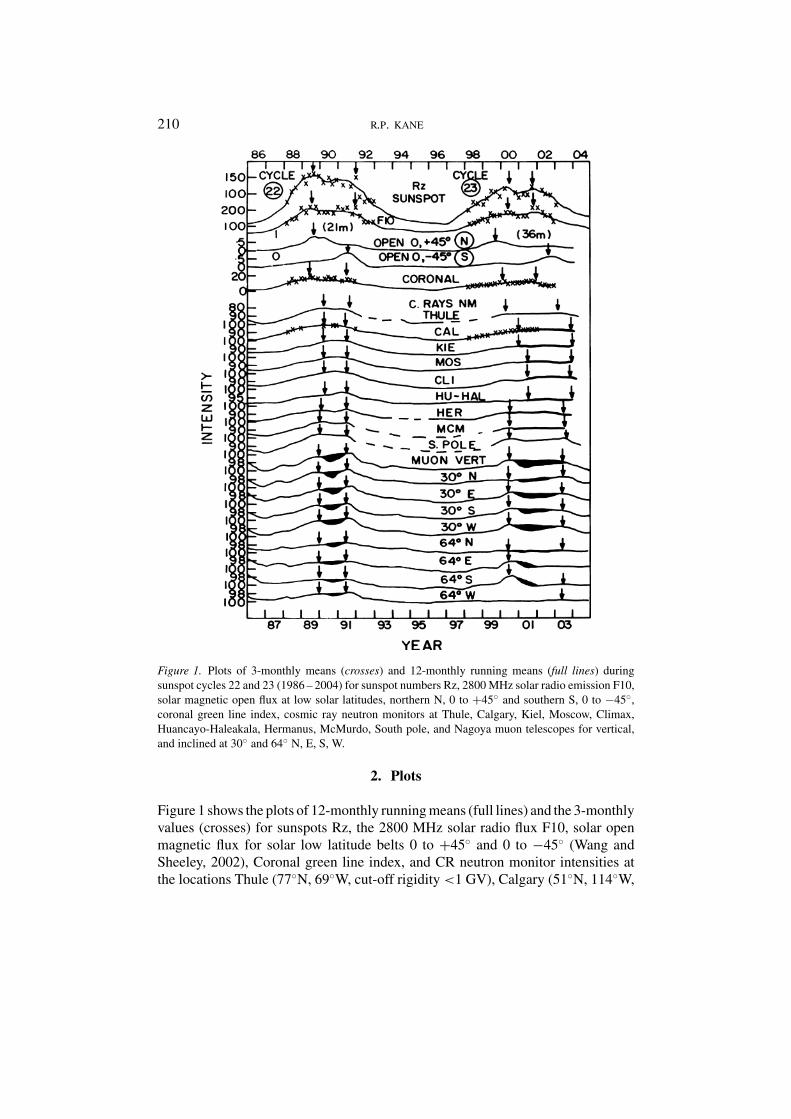
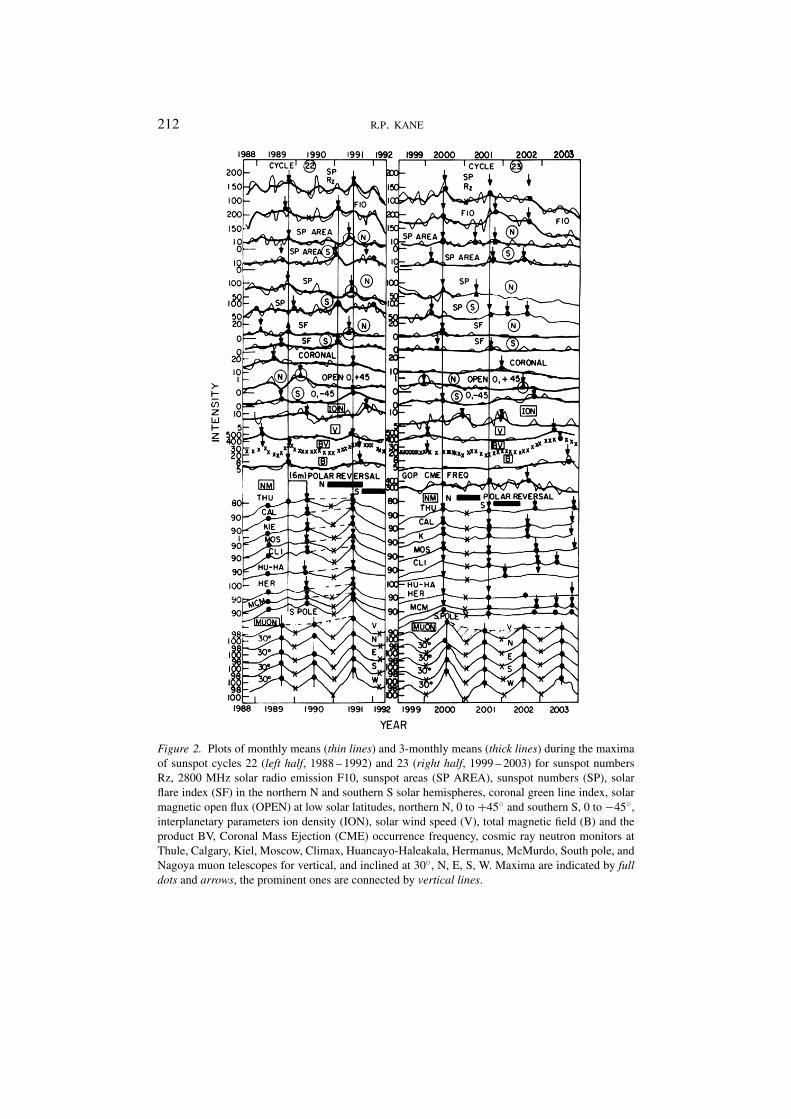
Figure 2. Plots of monthly means (thin lines) and 3-monthly means (thick lines) during the maxima
of sunspot cycles 22 (left half, 1988 – 1992) and 23 (right half, 1999 – 2003) for sunspot numbers
Rz, 2800 MHz solar radio emission F10, sunspot areas (SP AREA), sunspot numbers (SP), solar
flare index (SF) in the northern N and southern S solar hemispheres, coronal green line index, solar
magnetic open flux (OPEN) at low solar latitudes, northern N, 0 to +45◦ and southern S, 0 to −45◦,
interplanetary parameters ion density (ION), solar wind speed (V), total magnetic field (B) and the
product BV, Coronal Mass Ejection (CME) occurrence frequency, cosmic ray neutron monitors at
Thule, Calgary, Kiel, Moscow, Climax, Huancayo-Haleakala, Hermanus, McMurdo, South pole, and
Nagoya muon telescopes for vertical, and inclined at 30◦, N, E, S, W. Maxima are indicated by fulldots and arrows, the prominent ones are connected by vertical lines.
A DETAILED COMPARISON OF COSMIC RAY GAPS WITH SOLAR GNEVYSHEV GAPS 213
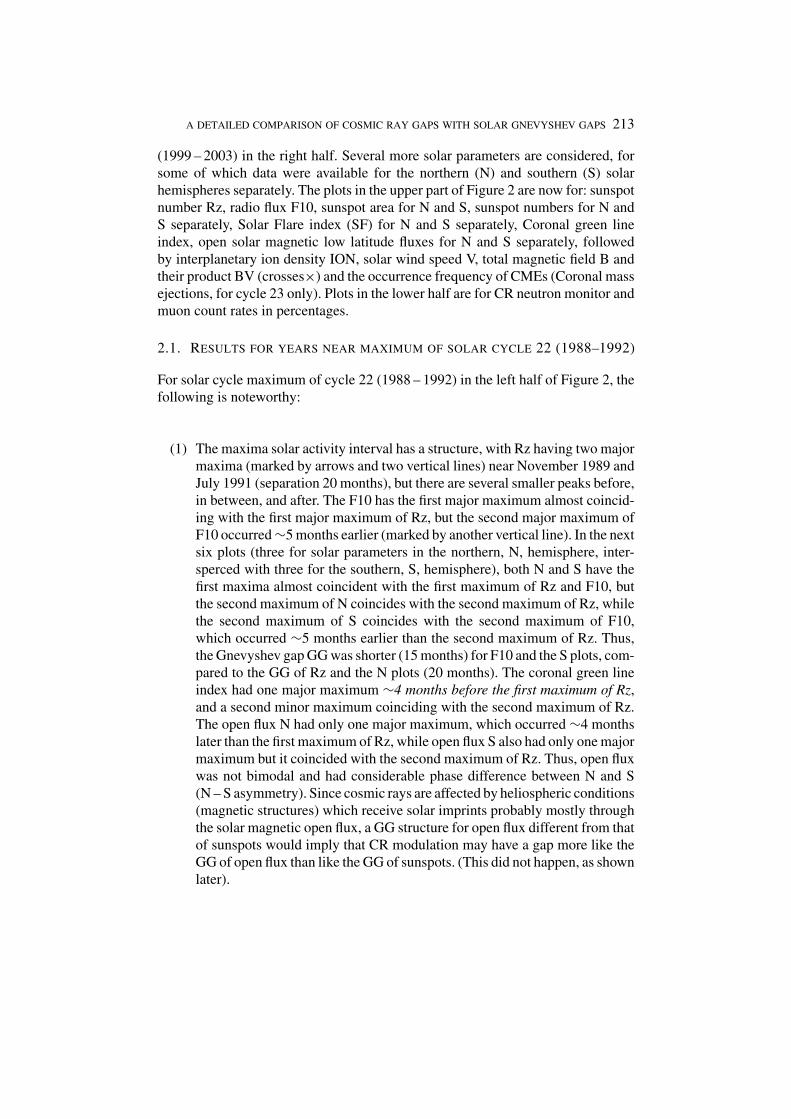
(1999 – 2003) in the right half. Several more solar parameters are considered, forsome of which data were available for the northern (N) and southern (S) solarhemispheres separately. The plots in the upper part of Figure 2 are now for: sunspotnumber Rz, radio flux F10, sunspot area for N and S, sunspot numbers for N andS separately, Solar Flare index (SF) for N and S separately, Coronal green lineindex, open solar magnetic low latitude fluxes for N and S separately, followedby interplanetary ion density ION, solar wind speed V, total magnetic field B andtheir product BV (crosses×) and the occurrence frequency of CMEs (Coronal massejections, for cycle 23 only). Plots in the lower half are for CR neutron monitor andmuon count rates in percentages.
2.1. RESULTS FOR YEARS NEAR MAXIMUM OF SOLAR CYCLE 22 (1988–1992)
For solar cycle maximum of cycle 22 (1988 – 1992) in the left half of Figure 2, thefollowing is noteworthy:
(1) The maxima solar activity interval has a structure, with Rz having two majormaxima (marked by arrows and two vertical lines) near November 1989 andJuly 1991 (separation 20 months), but there are several smaller peaks before,in between, and after. The F10 has the first major maximum almost coincid-ing with the first major maximum of Rz, but the second major maximum ofF10 occurred ∼5 months earlier (marked by another vertical line). In the nextsix plots (three for solar parameters in the northern, N, hemisphere, inter-sperced with three for the southern, S, hemisphere), both N and S have thefirst maxima almost coincident with the first maximum of Rz and F10, butthe second maximum of N coincides with the second maximum of Rz, whilethe second maximum of S coincides with the second maximum of F10,which occurred ∼5 months earlier than the second maximum of Rz. Thus,the Gnevyshev gap GG was shorter (15 months) for F10 and the S plots, com-pared to the GG of Rz and the N plots (20 months). The coronal green lineindex had one major maximum ∼4 months before the first maximum of Rz,and a second minor maximum coinciding with the second maximum of Rz.The open flux N had only one major maximum, which occurred ∼4 monthslater than the first maximum of Rz, while open flux S also had only one majormaximum but it coincided with the second maximum of Rz. Thus, open fluxwas not bimodal and had considerable phase difference between N and S(N – S asymmetry). Since cosmic rays are affected by heliospheric conditions(magnetic structures) which receive solar imprints probably mostly throughthe solar magnetic open flux, a GG structure for open flux different from thatof sunspots would imply that CR modulation may have a gap more like theGG of open flux than like the GG of sunspots. (This did not happen, as shownlater).
214 R.P. KANE
(2) The interplanetary parameters also show peaks and gaps. The ion densityION is known to have an uncertain long-term relationship with sunspotactivity (correlation was −0.23 during 1970 – 2003, see Table I in Kane,2005b). Hence, the appearance of a fine structure like the solar GG ininterplanetary ion density may have doubtful meaning. There are two peaksin ion density, but these are delayed by ∼4 – 6 months with respect to thefirst and second peaks of Rz. The solar wind speed V also has two peaks.The first peak occurred ∼9 months earlier than the first peak of Rz, andthe second peak occurred two months later than the second peak of Rz.Thus, there was a mismatch. The interplanetary B has two peaks, the firstone coinciding with the first peak of Rz, and the second peak slightlydelayed (∼2 months) with respect to the second peak of Rz. In contrast tointerplanetary ion density and V, the variation of B seems to have a bettercorrelation with sunspot cycle (correlation was +0.68 during 1970 – 2003,see Table I in Kane, 2005b). Hence, the double-peaked structure of B mayhave some meaning (discussed further later).
(3) The GG phenomenon in solar indices is often reported to be related tothe solar polar magnetic field reversals. These intervals are available inMakarov and Makarova (1996), Harvey and Recely (2002) and Vernovaet al. (2002) and the years (in decimal) for north and south pole reversalsare: cycle 22, 1990.8, 1991.8; cycle 23, 2000.9, 2001.8. These are shownas rectangles below the plots for B. As can be seen, the reversals occurredmuch later than the first peak of Rz in November 1989 (∼September 1990for North pole and ∼September 1991 for South pole). Thus, polar reversalis only one of the features of the turmoil during sunspot maximum, and notan initiator of any dynamic process.
(4) The lower part of Figure 2 shows plots of CR counting rates (%). The CRneutron monitors are at latitudes right from high North (Thule) to high South(South pole), but the variations are almost alike. The plots are upside downso that maxima are actually minima (large depressions of CR counts). Aftera minor peak in November 1989 (coinciding with the first major peak ofsunspots), the first CR peak occurred in May 1990, 6 months later than thefirst peak of Rz in November 1989 (for Huancayo-Haleakala, it was 5 monthslater). This delay is most probably due to the transit time of solar emissionsfrom the solar surface through the heliosphere, for which the boundaryis roughly placed at about 100 AU. However, whereas the CR gap starts ∼6months later than the first maximum of Rz (which we interpret as delay ofsolar emissions reaching the heliosphere), the CR gap ends exactly at thesecond maximum of Rz, so no delay is involved. This means that the CRgap is narrower than the Rz GG by about 6 months.
(5) Incidentally, the interplanetary V and B could have physical significancefor heliospheric modulation of cosmic rays. Ahluwalia (2003, 2005) andAhluwalia and Kamide (2005) emphasize that it is not just V or just B, but
A DETAILED COMPARISON OF COSMIC RAY GAPS WITH SOLAR GNEVYSHEV GAPS 215
their product BV representing the ‘electric field carried by the solar wind’,which should play a significant role in causing cosmic ray modulation, andmay be important for the cosmic ray gap also. To check this, values of theproduct BV were calculated and are plotted in between the V and B plots inFigure 2 (left half), as crosses (×). There are three peaks, with gaps of 8 and22 months. The latter gap almost coincides with the Rz gap of 20 months,but both these are larger than the CR gap of 14 months. Thus, associationof BV gaps with CR gaps is dubious.
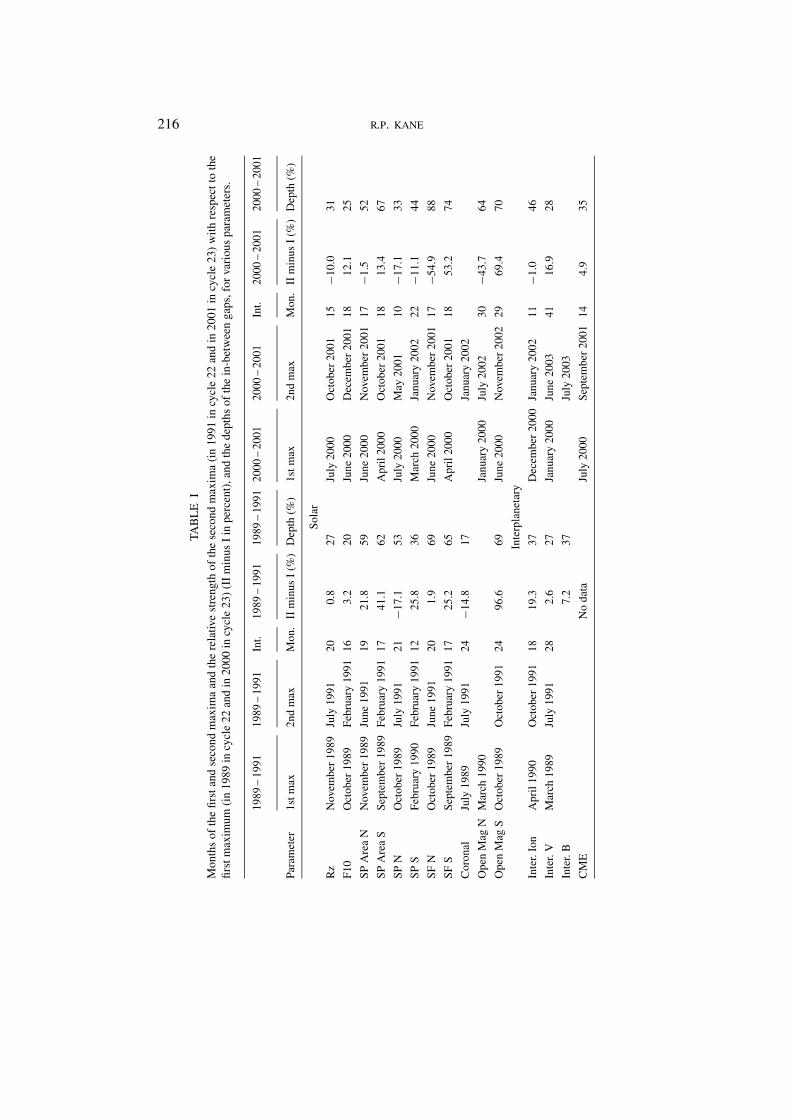
(6) Table I (left half) gives the months of the first and second maxima, the timeinterval between them (in months) and depths of the gap, defined as thedifference between the minimum and the average of the first and secondmaxima for the various parameters for cycle 22. For example, for Rz, thefirst and second maxima (3-monthly values) were 171.9 in November 1989and 173.2 in July 1991, the average of the two was 172.6, the minimumbetween these two maxima was 126.0 in May 1990, and hence, the depthwas 100(172.6 – 126.0)/(172.6) = 27%. As can be seen, the second peak washigher than the first peak (positive values) for almost all parameters but in dif-ferent percentages (for CR neutron monitors, in a range of ∼3 – 5%), exceptfor sunspot numbers in the northern hemisphere (SP N), and for the coronalgreen line index, where the first peak was higher. The depths also varied in awide range, but for CR neutron monitors, the range was 9 – 15% except forCR of higher energies at Huancayo-Haleakala (∼6%). For muons, all thesequantities are smaller as compared to the neutron monitors, and the peaksfor neutron monitors and muons are not alike. There are phase differences of2 – 3 months, some positive (leads), some negative (lags). However, since wehave used 3-monthly values of muon intensities, large seasonal temperatureeffects (uncorrected) are expected to be present. The peak separation of 12months clearly indicates that these peaks have a seasonal origin and mayhave no relationship with the external GG phenomena. Thus, the depthsin the muon plots are not solar GG effects but, uncorrected atmosphericseasonal temperature effects on muon intensities. If we use 12-monthlymeans, the seasonal effects are minimized but the troughs become shallowerand the gap depths become smaller as shown in the bottom part of Figure 1.
2.2. RESULTS FOR YEARS NEAR MAXIMUM OF SOLAR CYCLE 23 (1999–2003)
For solar cycle maximum of cycle 23 (1999 – 2003), results are shown as plots inthe right half of Figure 2 and values in the right half of Table I. The following isnoteworthy:
(1) In Figure 2 right half, the maxima interval has a structure, with Rz hav-ing three major maxima (marked by arrows and the first two marked byvertical lines) near July 2000 and September 2001 (separation 14 months)
216 R.P. KANE
TA
BL
EI
Mo
nth
so
fth
efi
rst
and
seco
nd
max
ima
and
the
rela
tive
stre
ng
tho
fth
ese
con
dm
axim
a(i
n1
99
1in
cycl
e2
2an
din
20
01
incy
cle
23
)w
ith
resp
ect
toth
e
firs
tm
axim
um
(in
19
89
incy
cle
22
and
in2
00
0in
cycl
e2
3)
(II
min
us
Iin
per
cen
t),an
dth
ed
epth
so
fth
ein
-bet
wee
ng
aps,
for
vari
ou
sp
aram
eter
s.
1989
–1991
1989
–1991
Int.
1989
–1991
1989
–1991
2000
–2001
2000
–2001
Int.
2000
–2001
2000
–2001
Par
amet
er1st
max
2nd
max
Mon.
IIm
inus
I(%
)D
epth
(%)
1st
max
2nd
max
Mon.
IIm
inus
I(%
)D
epth
(%)
Sola
r
Rz
Novem
ber
1989
July
1991
20
0.8
27
July
2000
Oct
ober
2001
15
−10.0
31
F10
Oct
ober
1989
Feb
ruar
y1991
16
3.2
20
June
2000
Dec
ember
2001
18
12.1
25
SP
Are
aN
Novem
ber
1989
June
1991
19
21.8
59
June
2000
Novem
ber
2001
17
−1.5
52
SP
Are
aS
Sep
tem
ber
1989
Feb
ruar
y1991
17
41.1
62
Apri
l2000
Oct
ober
2001
18
13.4
67
SP
NO
ctober
1989
July
1991
21
−17.1
53
July
2000
May
2001
10
−17.1
33
SP
SF
ebru
ary
1990
Feb
ruar
y1991
12
25.8
36
Mar
ch2000
Januar
y2002
22
−11.1
44
SF
NO
ctober
1989
June
1991
20
1.9
69
June
2000
Novem
ber
2001
17
−54.9
88
SF
SS
epte
mber
1989
Feb
ruar
y1991
17
25.2
65
Apri
l2000
Oct
ober
2001
18
53.2
74
Coro
nal
July
1989
July
1991
24
−14.8
17
Januar
y2002
Open
Mag
NM
arch
1990
Januar
y2000
July
2002
30
−43.7
64
Open
Mag
SO
ctober
1989
Oct
ober
1991
24
96.6
69
June
2000
Novem
ber
2002
29
69.4
70
Inte
rpla
net
ary
Inte
r.Io
nA
pri
l1990
Oct
ober
1991
18
19.3
37
Dec
ember
2000
Januar
y2002
11
−1.0
46
Inte
r.V
Mar
ch1989
July
1991
28
2.6
27
Januar
y2000
June
2003
41
16.9
28
Inte
r.B
7.2
37
July
2003
CM
EN
odat
aJu
ly2000
Sep
tem
ber
2001
14
4.9
35
A DETAILED COMPARISON OF COSMIC RAY GAPS WITH SOLAR GNEVYSHEV GAPS 217
TA
BL
EI
(Con
tinu
ed)
1989
–1991
1989
–1991
Int.
1989
–1991
1989
–1991
2000
–2001
2000
–2001
Int.
2000
–2001
2000
–2001
Par
amet
er1st
max
2nd
max
Mon.
IIm
inus
I(%
)D
epth
(%)
1st
max
2nd
max
Mon.
IIm
inus
I(%
)D
epth
(%)
CR
Neu
trons
Thule
May
1990
July
1991
14
2.8
9Ju
ly2000
Sep
tem
ber
2001
14
−1.3
4
Cal
gar
yM
ay1990
July
1991
14
5.0
14
July
2000
Sep
tem
ber
2001
14
2.9
6
Kie
lM
ay1990
July
1991
14
4.3
12
July
2000
Sep
tem
ber
2001
14
1.1
5
Mosc
owM
ay1990
July
1991
14
5.1
12
July
2000
Sep
tem
ber
2001
14
−0.2
6
Cli
max
May
1990
July
1991
14
4.8
15
July
2000
Sep
tem
ber
2001
14
0.7
7
Huan
.Hal
ea.
Apri
l1990
July
1991
15
2.9
6Ju
ly2000
Januar
y2002
14
−0.2
3
Her
man
us
May
1990
July
1991
14
4.3
10
July
2000
Sep
tem
ber
2001
14
1.9
4
McM
urd
oM
ay1990
July
1991
14
4.0
12
July
2000
Sep
tem
ber
2001
14
0.1
5
South
Pole
May
1990
July
1991
14
5.2
15
July
2000
Sep
tem
ber
2001
14
1.3
6
CR
Muons
Muon
Ver
tica
lJu
ly1990
July
1991
12
3.3
6.2
August
2000
August
2001
12
−1.8
5.9
Muon
30
NJu
ly1990
July
1991
12
3.0
6.0
August
2000
August
2001
12
0.2
5.0
Muon
30
EJu
ly1990
July
1991
12
2.8
5.7
August
2000
August
2001
12
−2.4
5.7
Muon
30
SJu
ly1990
July
1991
12
3.1
6.1
August
2000
August
2001
12
−2.3
6.4
Muon
30
WJu
ly1990
July
1991
12
3.2
6.3
August
2000
August
2001
12
−2.3
7.1
218 R.P. KANE
and September 2002 (further separation 12 months). F10 has almost similarmaxima. Further plots for other parameters show maxima not necessarilynear about these, in some cases only the first one and in some cases, only thesecond one. The open flux N had only one major maximum, which occurred∼6 months earlier than the first maximum of Rz, while open flux S also hadonly one major maximum much later than the second maximum of Rz, andcoinciding with the third maximum of Rz. Thus, open flux was not bimodaland had considerable phase difference between N and S.
(2) The interplanetary parameters ION and V also show two peaks, but verydifferent from those of Rz and F10.
(3) The interplanetary B has only one peak in September 2003, much later thaneven the third peak of Rz (September 2002).
(4) Data for CME occurrence frequency were available for cycle 23(Gopalswamy et al., 2003a,b; Kane, 2006) and show peaks similar to Rz.
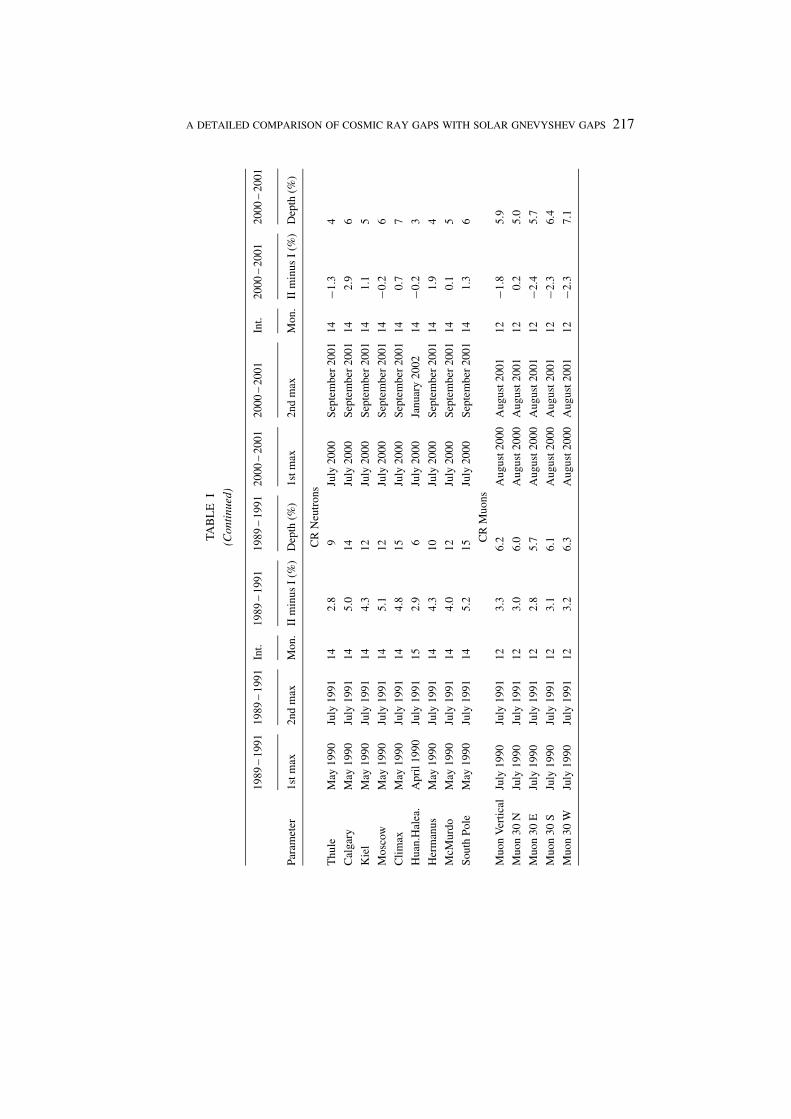
(5) The plots of CR neutron monitor counting rates (%) show a first peak co-inciding with the first peak of Rz. Thus, there was no lag between the two,in contrast to the 6 months lag in cycle 22, indicating that the explanationof the lag as due to delay of solar characteristics reaching deep into theheliosphere may not always be true. However, later, there are virtually nofurther peaks. All neutron monitors show a very shallow gap and remainedalmost steady at the high modulation level for a very long time, almost upto the end of 2003 when a second maximum (maximum CR depression ormodulation) occurred at about November 2003, though by that time, Rz haddecreased considerably. Table I (right half) gives the depths of the gaps forthe various parameters. For solar and interplanetary parameters, the depthswere in similar wide ranges in cycles 22 (20 – 69%) and 23 (25 – 88%). Butfor CR neutron monitors, the range was only 4 – 7% in cycle 23, in contrastto 9 – 15% in cycle 22 (excluding Huancayo-Halekala for which the depthswere 6% in cycle 22 and 3% in cycle 23, both lower than the depths at otherlocations, due to higher energy response). Thus, the gap in neutron monitorcount rates was shallower in cycle 23 as compared to cycle 22. The plotfor the product BV, shown by crosses (×) in between the plots of V and B,shows a monotonic increase ending finally as one strong peak in July 2003,and the BV plot has no resemblace whatsoever with the CR neutron monitorplots.
(6) The muon plots show strong peaks and gaps throughout the interval 1999 –2003. There are four peaks and three gaps, but for comparison with neutronmonitors, only the second gap (shown hatched on the vertical muon plot) isconsidered. However, the muon peaks are not of solar origin. Peak separa-tions of exactly 12 months indicate that these are uncorrected temperatureeffects, mostly unrelated to the GG phenomenon. The 12-monthly runningmeans shown at the bottom of Figure 1 indicate very shallow trough depths(<1%).
A DETAILED COMPARISON OF COSMIC RAY GAPS WITH SOLAR GNEVYSHEV GAPS 219
Delays and hysteresis effects in CR modulation have been known earlier andhave been explained as due to drift mechanisms which give opposite effects withthe changing sign of the solar magnetic field (Jokipii and Thomas, 1981; Kota andJokipii, 1983), but there are other superposed effects due to a convection-diffusionmechanism, which do not depend on the sign of the solar magnetic field (details inDorman, 2001; Dorman, Iucii, and Villoresi, 2001; Dorman, Iucii, and Villoresi,2001). If so, is the reduction in gap depth in cycle 23 (as compared to cycle 22)due to the enhanced hyteresis effect (CR depression continuing even when sunspotnumber have started reducing) in odd cycles, or is the gap depth variation due toother causes? This could be checked by examining the gap depths in earlier oddcycles 19 and 21, and comparing with the depths in even cycles 20 and 22. For allthese five cycles 19 – 23, CR data are available for the neutron monitors at Kiel,Moscow, Climax and Huancayo. Figure 3 shows the plots of 3-monthly values ofthe solar parameters Rz, F10 and solar magnetic open flux, and of CR intensity atClimax only (for other neutron monitors, variations were similar and are not shownhere), for the few years around the sunspot maxima in cycles 19 – 23 on the left sideand the corresponding hysteresis loops (Rz versus CR% at Climax) on the rightside. The following may be noted:
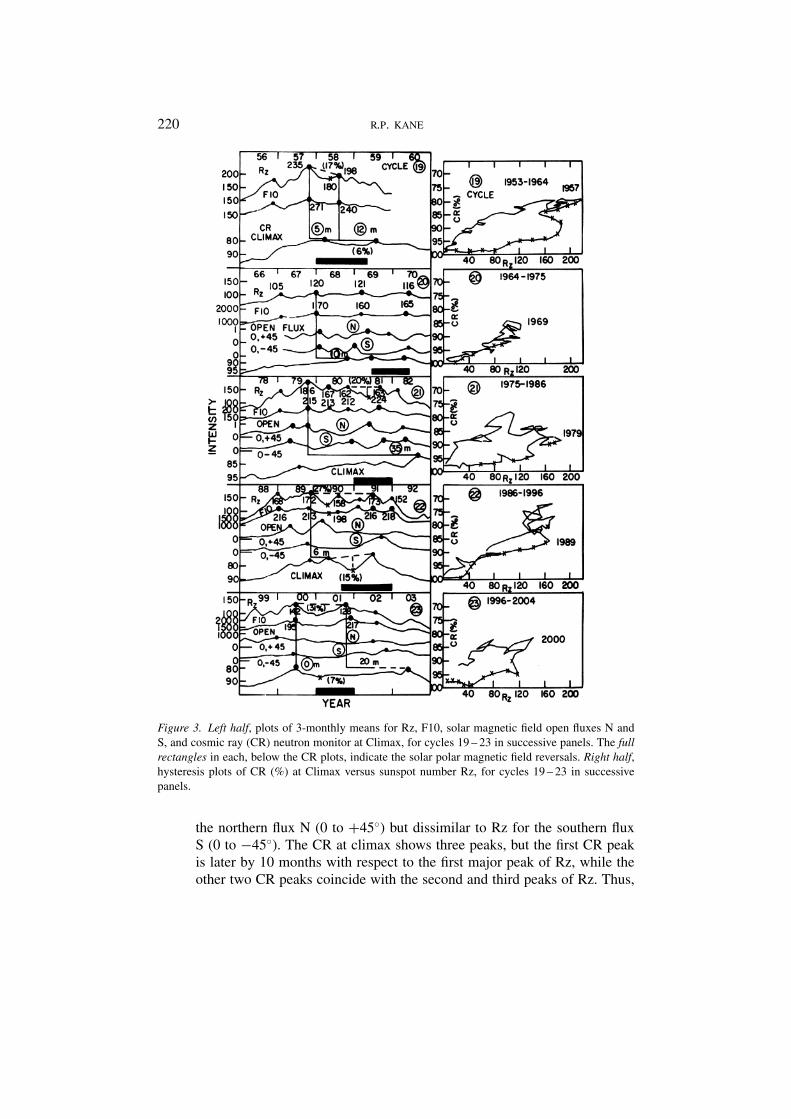
(1) In Kane (2005a), the sunspots near maxima were examined for all cycles1 – 23 and it was noted that all had more than one maxima. Cycles 1, 9 –11, 19, 23 had only two major maxima, while all others had more than twoprominent maxima. Here in Figure 3 left half, the top plot for cycle 19 showstwo prominent maxima in Rz and F10, and the gap depth for Rz is 17%.The Climax CR also has two maxima with a small gap depth of ∼6%, butthe first CR maximum is 5 months later as compared to the first maximumof Rz, and the second CR maximum is 12 months later as compared to thesecond maximum of Rz. Thus, apart from the shifts, the separation betweenthe first and second maxima is 9 months for Rz but 16 months for CR. Acomplete association between Rz and CR is therefore doubtful, though itcould be given the benefit of a distorted association. The rectangle at thebottom indicates the interval during which the solar polar magnetic fieldreversed, first at the solar northern pole and a few months later at the solarsouthern pole (dates from Makarov and Makarova, 1996; Harvey and Recely,2002; Vernova et al., 2002). As can be seen, for cycle 19, the reversal startedsoon after the first maximum of Rz, and the CR peak occurred soon after thestarting of the magnetic field reversal.
(2) In the next plot for cycle 20, Rz and F10 have three prominent peaks (peakvalues marked, 120, 121, 116 for Rz; 170, 160, 165 for F10), but the values inbetween (troughs) are lower only by a few units, so that the Gnevyshev gapsGGs are of negligible depths (∼1%). Thus, there are virtually no prominentGGs in Rz and F10 in this cycle 20. Data for solar open magnetic flux areavailable for this cycle for 1967 onwards and show peaks similar to Rz for
220 R.P. KANE
Figure 3. Left half, plots of 3-monthly means for Rz, F10, solar magnetic field open fluxes N and
S, and cosmic ray (CR) neutron monitor at Climax, for cycles 19 – 23 in successive panels. The fullrectangles in each, below the CR plots, indicate the solar polar magnetic field reversals. Right half,hysteresis plots of CR (%) at Climax versus sunspot number Rz, for cycles 19 – 23 in successive
panels.
the northern flux N (0 to +45◦) but dissimilar to Rz for the southern fluxS (0 to −45◦). The CR at climax shows three peaks, but the first CR peakis later by 10 months with respect to the first major peak of Rz, while theother two CR peaks coincide with the second and third peaks of Rz. Thus,
A DETAILED COMPARISON OF COSMIC RAY GAPS WITH SOLAR GNEVYSHEV GAPS 221
the association of Rz with CR is partial. Incidentally, the depths of the gapsin between the CR peaks are also very small (∼1%). Hence, in cycle 20, onecan conclude that the peaking is almost as a plateau, with negligible GGs.The solar polar magnetic field reversal occurred later than the first peak ofCR and coincided with the interval between the latter two CR peaks.
(3) In the next plot for cycle 21, there are four prominent peaks in Rz and F10 ofalmost the same magnitudes (peak values marked, 186, 167, 162, 163 for Rz;215, 213, 212, 224 for F10), so there are more than one (actually three) GGs,with the largest GG depth of ∼20% between the third and fourth peaks of Rz.The open fluxes have 3 – 4 peaks but only the first one of each N and S tallieswith the first peak of Rz. Other peaks do not tally. In the Climax CR plots,there is no gap at all. The modulation continued monotonically far beyond allthe Rz peaks and CR had only one maximum much later, in September 1982(with no prominent maximum thereafter either, plot not shown here) whenRz activity was on the decline. The CR peak was 35 months later than thefirst Rz peak, and since there was no second maximum, there was no CR gap.Thus, in this cycle 21, though Rz and F10 had multiple peaks and substantialGG depths, CR had no dips. The solar polar magnetic field reversal occurredduring the third and fourth peaks of Rz, but much earlier (20 months) thanthe CR peak.
(4) The next plot for cycle 22 has been depicted earlier in the left half of Figure 2,and here too, though two prominent peaks are marked prominently in Rz andF10, there are many in between peaks of comparable magnitudes (peak valuesmarked, 168, 172, 158, 173, 152 for Rz; 216, 213, 198, 216, 218 for F10),and there are many GGs. The largest gap depth in Rz is ∼27%. The openfluxes N and S have each a major peak and a minor peak, not tallying withthe Rz peaks. In CR, there is only one prominent peak in July 1991, tallyingwith a prominent peak in Rz, but there are two earlier minor peaks in CR,the first CR peak tallying with the first major peak of Rz, and the secondCR peaks occurring 6 months later. There is a big gap between the second(minor) and the third (major) peak of CR and the gap depth is ∼15%, thelargest CR gap in any cycle. Whether this gap corresponds to any of theseveral Rz GGs is a moot question. The CR gap started about 6 months laterthan a Rz GG. Matching is not perfect, though some association cannot beruled out. The solar polar magnetic field reversal occurred during the thirdand fourth peaks of Rz, and almost coincided with the CR gap.
(5) The next plot for cycle 23 has also been depicted earlier in the right half ofFigure 2. Here, things are much simpler than in any of the previous cycles.Rz and F10 have only two major peaks (142, 128 for Rz; 195, 217 for F10)and the 16-month GG depth is 31% for Rz, again largest in any cycle (cycle19, 17%; cycle 20, nil; cycle 21, 20%; cycle 22, 27%). The open fluxes N andS have each a major peak and a minor peak, not tallying with the Rz peaks.In CR, there are two peaks, the first CR peak tallying with the first peak of
222 R.P. KANE
Rz, but the second CR peak occurring 20 months later than the second peakof Rz. Thus again, matching is not perfect (Rz GG lasted 16 months, CR gaplasted 35 months). The solar polar magnetic field reversed a little after theGG of Rz, and was within the long-lasting CR gap.
(6) The right half of Figure 3 shows the hysteresis loops in the various cycles. Anobvious feature is that the loops are broader during odd cycles 19, 21, 23 ascompared to the even cycles 20, 22. This feature is well known (confirmedhere for cycle 23 which is about to end) and is explained as due to driftmechanisms which give opposite effects with the changing sign of the solarmagnetic field (Jokipii and Thomas, 1981; Kota and Jokipii, 1983). However,at both ends of the sunspot cycle (solar minimum at the left side bottom,solar maximum at the right side top of each panel), there are small loopsindicating dephasing between the evolution of sunspots and CR modulation.Notably, the loops in cycles 19, 21, 23, though all broad, are not exactly alike,indicating considerable differences in successive odd cycles. Similarly, thenarrow loops in cycles 20 and 22 are not alike. In cycle 20, the points arealmost along a straight line, indicating very little dephasing between Rz andCR, while in cycle 22, there is considerable dephasing during the rising anddeclining phases, and a wider loop is obtained.
For CR, data are available only for five cycles (19 – 23) and the GG relationshipwith sunspots or even with polar field reversals seems to be dubious. Briefly, theresults are as follows:
In cycle 19, sunspots had two peaks with a GG of 17% lasting 9 months, CRhad a gap of 6% five months later, lasting 16 months, and the polar field reversaloccurred in between. So, this could be an example of a rough association betweenall the three.
In cycle 20, sunspots had three flat peaks and no worthwhile GGs, CR had threeflat peaks ten months later and no worthwhile gaps, and the polar field reversaloccurred later than the first peaks of Rz and CR. Thus, the reversal phenomenoncould not be the cause of any CR gap.
In cycle 21, sunspots had four major peaks and one GG of 20% between thethird and fourth peaks, lasting 10 months. CR had only one major peak much laterthan all the sunspot peaks (hence no gap at all in CR), and the polar field reversaloccurred during the later peaks of sunspots but much before the only major peakof CR.
In cycle 22, sunspots had four major peaks and one GG of 27% between thefirst and second peaks, lasting 9 months. CR had three peaks and one GG of 15%between the second and third peaks (lasting 14 months), about six months later thansunspot GG, and the polar field reversal occurred much after the sunspot GG andstarted 4 months after the start of the CR gap.
In cycle 23, sunspots had two peaks (separation 16 months) with a GG of 33%.CR also had two peaks (but with a separation of 34 months, double that of sunspot
A DETAILED COMPARISON OF COSMIC RAY GAPS WITH SOLAR GNEVYSHEV GAPS 223
separation), and a gap of 7% starting simultaneously with the sunspot GG (butending much later), and the polar field reversal occurred six months later than thefirst peaks of sunspots and CR
Thus, taking a broad view, one would claim a rough overall association betweensunspot and CR gaps and the solar polar magnetic field reversal intervals, ignoringcompletely the phase differences. However, examining critically, the CR gaps donot match perfectly with sunspot GGs. Durations are different and/or there arevariable delays, and magnitudes of the depths of the suspot GGs and CR gaps areloosely proportional (Cycle 19, Rz 17%, CR 6%; Cycle 20, no GGs; Cycle 21,Rz 20%, no CR GG; Cycle 22, Rz 27%, CR 15%; Cycle 23, Rz 33%, CR 7%).Magnetic field reversal intervals do not coincide exactly with either sunspot GGsor CR gaps. More embarrassing, some magnetic field reversals started later thanthe starting of the CR gaps. Hence, the field reversal could not be a cause of theCR gaps (causes must precede effects, not succeed). The field reversals occur atthe maximum of all solar cycles, but CR gaps occurred only in three cycles (oneeven cycle 22, and two odd cycles 19, 23) out of five. With only five CR cycleswith characteristics so different from each other, any general conclusion would beunreliable.
3. Conclusions and discussion
After rising almost monotonically from sunspot minimum, sunspot activity faltersand remains in a narrow grove for several tens of months (2 – 3 years) and later,decreases almost monotonically up to the next sunspot minimum. During the 2 – 3years near sunspot maximum (let us term it Turmoil Interval TI), sunspots may de-pict several peaks (Gnevyshev peaks) and several gaps (spaces between successivepeaks, termed as Gnevyshev Gaps GG). An examination (present paper and alsoKane, 2005a,b,c, 2006) revealed the following:
(1) In all the cycles 1 – 23 so far, there have been two or more Gnevyshev peaks inthe TI near solar maxima and correspondingly, one or more GGs. However,the depths of the troughs are variable from one GG to the next in the samecycle and the magnitudes may vary in a wide range (<1% to ∼20%).
(2) This pattern of multiple sunspot peaks in the TI of each cycle is not the samefor all other solar parameters. The months of commencement and endingand the magnitudes of the depths differ from those of sunspot GGs, and fromparameter to parameter. Thus, whereas there is a general turbulence intervalTI superimposed on a quasi-stationary 11-year trend, its patterns are differentfor different solar parameters, qualitatively as well as quantitatively. Largenorth – south asymmetries are seen in the patterns.
(3) The solar open magnetic flux emerging from the Sun (estimated roughly at∼20 solar radii above the photosphere) also shows gaps, but their patterns
224 R.P. KANE
are different in the northern and southern low solar latitudes, and unlike thepattern of any other solar parameter.
(4) A connection with the reversal of solar polar magnetic field is often claimedin the literature, and it is surmised that in the course of the Sun’s polarmagnetic field reversal, a part of the Sun’s energy is used up for this reversalprocess, implying that during such periods the interaction between “localmagnetic fields” (particularly those connected with the processes involvedin the development of large and complex active regions) and the “backgroundmagnetic field” is suppressed, and large-scale dynamical phenomena cannotreach the solar corona and hence they are not able to affect the interplanetarymedium. However, we find a mismatch between the GGs of sunspots andother parameters and the commencement of the polar magnetic field reversal.The reversal occurs several months after the first sunspot maximum. Thus,the field reversal is only one of the features occurring some time during theTI, but could not be the initiator of the turmoil.
(5) Interplanerary parameters also show gaps but these are dissimilar to the gapsof all other parameters.
(6) For cosmic ray (CR) modulation which occurs deep in the heliosphere, whatmatters is the state of the heliosphere. This state should be affected by thesolar emissions (plasma as well as magnetic field structures) reaching wayout in the heliosphere with some delay. For CR, data are available only forfive cycles (19 – 23) and in some cycles (not all), gaps are seen during TI,but the CR gaps, when they occur, do not match with sunspot GGs or withgaps in any other parameter. Durations are different and/or there are variabledelays, and magnitudes of the suspot GGs and CR gaps are not proportional(Cycle 19, 17%, 6%; Cycle 20, no GGs; Cycle 21, 20%, no CR GG; Cycle22, 27%, 15%; Cycle 23, 33%, 7%).
(7) Long-term variations of CR are roughly anti-parallel to sunspot activity butthe plots of CR versus sunspot number show hysteresis loops which arebroader in odd cycles 19, 21, 23 as compared to the loops in the even cycles20, 22. This is well-known and is explained as due to drift mechanisms someof which give opposite effects with the changing sign of the solar magneticfield.
Since none of the solar and near-Earth interplanetary parameters show gapsqualitatively and quantitatively similar to the gaps in CR, the exact cause of CR gapsremains obscure. None of the solar and near-Earth interplanetary parameters seemto reflect the heliospheric conditions that dictate CR modulation. One would havethought that solar open magnetic field flux would be an appropriate parameter forsuch a connection, but it does not seem to be so. Or, its pattern may be getting largelymodified by the time the effects reach the middle heliosphere. The same argumentapplies to interplanetary partameters. CRs are affected by diverse structures ofthe solar wind (e.g., interplanetary transients, corotating regions, current sheet,
A DETAILED COMPARISON OF COSMIC RAY GAPS WITH SOLAR GNEVYSHEV GAPS 225
etc.) in different ways. Various physical processes (diffusion, drift, convection,focusing, adiabatic deceleration, wave-particle interactions, etc.) are involved in themodulation, and each of them has its own characteristic time. As a result, differentdelays could occur between various solar wind features and the CR response.
For the solar open magnetic flux, Wang and Sheeley (2003) performed ad hocnumerical simulations exploring the nature of the source regions of the solar mag-netic field. They stimulated the evolution of the Sun’s equatorial dipole strength andtotal open flux under the assumption that the active region sources are distributedrandomly in longitude and interpreted the results with the help of a simple randomwalk model including dissipation. They found that the equatorial dipole and openflux exhibited multiple peaks during each 11-year cycle, with the highest peak oc-curring during sunspot maximum and/or later in the declining phase. They attributethe Gnevyshev gaps (GGs) to random fluctuations in the rate of emergence of majoractive regions and their longitude distribution, and the widths of the peaks are de-termined by the time scale for the equatorial dipole to decay through the combinedaction of meridional flow, differential rotation and super granular diffusion. Howthese patterns are transmitted to regions deep in the heliosphere is a moot question.
Acknowledgments
Thanks are due to the various workers who recorded the neutron monitor data at thevarious locations and to Zenjiro Fujii and his colleagues at the Cosmic Ray Section,Solar-Terrestrial Environment Laboratory, Nagoya University for the muon data.Neutron monitors of the Bartol Research Institute are supported by a NSF grantATM-0527878. Thanks are due to the referee for valuable suggestions. The presentwork was partially supported by FNDCT, Brazil under contract FINEP-537/CT.
References
Ahluwalia, H.S.: 2003, Geophys. Res. Lett. 30(3), 1133, doi:10.1029/2002GL016017.
Ahluwalia, H.S.: 2005, J. Geophys. Res. 110, A10106, doi:10.1029/2005JA011106.
Ahluwalia, H.S. and Kamide, Y.: 2005, Adv. Space Res. 35, 2119.
Alania, M.V., Baranov, D.G., Tyasto, M.I., and Vernova, E.S.: 1999, Proc. 26th ICRC 7, 13 l.
Atac, T. and Ozguc, A.: 1998, Solar Phys. 180, 397.
Bao, S.D. and Zhang, H.Q.: 1998, in A. Antalova and A. Kucera (eds.), JOSO Annual Report’97,
Astronomical Institute, Tatranska Lomnica, p. 132.
Bazilevskaya, G.A., Krainev, M.B., Makhmutov, V.S., and Sladkova, A.I.: 1995, 24th ICRC 4, 572.
Bazilevskaya, G.A., Krainev, M.B., Makhmutov, V.S., Fltickiger, E.O., Sladkova, A.I., and Storini,
M.: 2000, Solar Phys. 197, 157.
Bieber, J.W. and Rust, D.M.: 1995, Astrophys. J. 453, 911.
Bumba, V. and Howard, R.: 1965, Astrophys. J. 141, 1502.
226 R.P. KANE
Cane, H.V., Wibberenz, G., Richardson, I.G., and von Rosenvinge, T.T.: 1999, Geophys. Res. Lett.26, 565.
Dorman, L.I.: 2001, Adv. Space Res. 27(3), 601.
Dorman, L.I., Iucii, N., and Villoresi, G.: 2001, Adv. Space Res. 27(3), 595.
Dorman, L.I., Dorman, I.V., Iucii, N., Parisi, M., and Villoresi, G.: 2001, Adv. Space Res. 27(3), 589.
Feminella, F. and Storini, M.: 1997, Astron. Astrophys. 322, 311.
Gnevyshev, M.N.: 1963, Sov. Astron. A.I (7), 311.
Gnevyshev, M.N.: 1967, Solar Phys. 1, 109.
Gnevyshev, M.N.: 1977, Solar Phys. 51, 175.
Gopalswamy, N., Lara, A., Yashiro, S., and Howard, R.A.: 2003a, Astrophys. J. 598, L63.
Gopalswamy, N., Lara, A., Yashiro, S., Nunes, S., and Howard, R.A.: 2003b, Proceedings of the ISCS
2003 Symposium, Solar Variability as an Input to the Earth’s Environment 1. Tatranska Lomnica,
Slovakia, ESA. SP-535, (ed. Wilson) ESTEC, Noordwijk, The Netherlands, September, p. 403.
Harvey, K.L. and Recely, F.: 2002, Solar Phys. 211, 31.
Jokipii, J.R. and Thomas, B.: 1981, Astrophys. J. 243, 1115.
Kane, R.P.: 2005a, Solar Phys. 229, 387.
Kane, R.P.: 2005b, Solar Phys. 227, 155.
Kane, R.P.: 2005c, J. Geophys. Res. 110, A01108, doi:10.1029/2004JA010606.
Kane, R.P.: 2006, Solar Phys. 233, 107.
Kota, J. and Jokipii, J.R.: 1983, Astrophys. J. 265, 573.
Krainev, M.B., Bazilevskaya, G.A., Fltickiger, E.O., Makhmutov, V.S., Sladkova, A.I., and Storini,
M.: 1998, Proceedings of the Conference on 50th Anniversary of the Kislovodsk Astronomical
Observatox-v, Pulkovo, St. Petersburg, p. 95.
Makarov, V.I. and Makarova, V.V.: 1996, Solar Phys. 163, 267.
Nagashima, K., Sakakibara, S., and Morishita, I.: 1991, Geomag. Geoelectr. 43, 685.
Obridko, V.N. and Shelting, B.D.: 1992, Solar Phys. 137, l67.
Sabbah, I., Helmi, M., Bishara, A., and Borie, M.: 1995, Proc. 24th ICRC 4, 560.
Simpson, J.A., Fonger, W., and Trieman, S.B.: 1953, Phys. Rev. 90, 934.
Storini, M.: 1995, Adv. Space Res. 16(9), 51.
Storini, M. and Laurenza, M.: 2003, Mem. S. A. It. (Memoirs Societa Astronomica Italiana) 74, 774.
Storini, M. and Pase, S.: 1995, STEP GBRSC News 5(Special Issue), 255.
Storini, M., Massetti, S., and Antalova, A.: 1997, Proc. 25th ICRC 1, 409.
Storini, M., Pase, S., Sykora, J., and Parisi, M.: 1997, Solar Phys. 172, 317.
Storini, M., Feminella, F., Antalova, A., and Massetti, S.: 1999a, in A. Antalova, H. Balthasar, and
A. Kucera (eds.), Joso Annual Report’98, Astronomical Institute, Tatranska Lomnica, p. 153.
Storini, M., Jakimiec, M., Antalova, A., and Sykora, J.: 1999b, Proc. 26th ICRC 7, 151.
Storini, M., Bazilevskaya, G.A., Fluckiger, E.O., Krainev, M.B., Makhmutov, V.S., and Sladkova,
A.I.: 2003, Adv. Space Res. 31(4), 895.
Vernova, E.S., Tyasto, M.I., Baranov, D.G., and Grigorian, M.S.: 1995, Proc. 24th ICRC 4, 564.
Vernova, E. S., Mursula, K., Tyasto, M. I., and Baranov, D. G.: 2002, Solar Phys. 205, 371.
Wang, Y.M. and Sheeley, N.R.: 2002, J. Geophys. Res. 107(A10), 1302, doi:10.1029/2001JA000500,
SSH 10, 1.
Wang, Y.M. and Sheeley, N.R.: 2003, Astrophys. J. 590, 1111.