Embed Size (px)
Citation preview

Progress In Electromagnetics Research B, Vol. 66, 107–121, 2016
A Design of Switch Array Antenna with Performance Improvementfor 77 GHz Automotive FMCW Radar
Doo-Soo Kim*, Dong-Hee Hong, Ho-Sang Kwon, and Jin-Mo Yang
Abstract—In this paper, a switch array antenna (SAA) with performance improvement for 77 GHzautomotive FMCW radar to detect moving targets and near-field region (NFR) targets is proposed.The SAA generally mitigates hardware complexity, weight and cost, while it has technical difficultiesto overcome depending on radar requirements. Firstly, a time-divided transmit by switch array todetect the moving targets causes a phase distortion of echo signals and generates considerably high andperiodic side lobes of the SAA beam. In order to suppress side lobes more than 10 dB, a sub-array, apart of the SAA with non-distorted phases, is used to synthesize a compensation beam. Secondly, theSAA to detect the NFR targets, one of the radar requirements, deteriorates a beam performance by aspherical wave. To overcome a partial compensation method is proposed considering beam coverage ofthe radar operation at each target range. Some of the NFR targets to verify minimum range detectionare simulated and the SAA beam gets back main lobe and has side lobes 15∼25 dB suppressed withcompensation. With the SAA designed, a detection performance of the radar is simulated. Two targetsand radar system parameter are used, and signal processing tasks are included in simulation. Alsooutdoor test is carried out to verify that the proposed compensation methods enhance the detectionperformance of the radar with real targets. It is confirmed that the moving targets and NFR targets arewell detected because multiple false targets are eliminated with the proposed compensation methods.
1. INTRODUCTION
Generally, the main functions of a radar are detecting and tracking targets, and its required performancesdepend on applications. Recently, commercial cars introduce automotive radars preventing collision forsafety enhancement of drivers [1]. Automotive radars apply transmit-receive modules (TRMs) to anindividual element of array antennas and obtain improved performances with digital beam forming(DBF) [2, 3]. In military application, the automotive radars, one of the sensors for unmanned vehicles,are currently developed for autonomous navigation as well as collision prevention to meet differentiatedradar requirements. Especially performance requirements, such as expansion of radar detection rangeand higher target resolution, need an antenna aperture widened and the number of array increased fora high gain and narrow antenna beam. It means that a radar has the risks of hardware complexity,weight and cost by increase of the number of receiving channels. In order to overcome these risks, aswitch array structure (SAS) can be considered [4]. The SAS can obtain an expanded array effect withlimited number of array elements.
On the other hand, the SAS needs some improvement because it causes performance deteriorationof target detection by a beam distortion. The radar generally aims at detection of long-range targets bya plane wave, not near-field region (NFR) targets by a spherical wave. In the NFR with spherical waveformed, the performance deterioration of target detection is inevitable by the beam distortion. However,the detection of NFR targets for the automotive radars with autonomous navigation as well as collision
Received 4 January 2016, Accepted 16 February 2016, Scheduled 4 March 2016* Corresponding author: Doo-Soo Kim ([email protected]).The authors are with the Agency for Defense Development, P. O. Box 35-3, Yuseong, Daejeon 34186, Korea.

108 Kim et al.
prevention against bad weather conditions, such as heavy rain and snow, is indispensable. So the beamdistortion of NFR targets should be absolutely improved to guarantee the detection performance of theradar. Especially an array antenna to get a high resolution and narrow beam with several tens of λ ofan aperture generates a spherical wave within several meters and results in beam distortion seriously.So far, most automotive radars cover small-sized array antennas with below 10λ of the aperture, sonobody raises questions and suggests their solutions on the beam distortion by the spherical wave ofNFR targets [4, 6, 7]. Also a time-divided transmit by switch array to detect moving targets causes aphase distortion of echo signals and generates considerably high and periodic side lobes of the antennabeam. Most switch array antennas (SAAs) studied so far result in the same beam distortion of themoving targets as well. However, they focus on standstill targets, so there are no technical approacheson the beam distortion of the moving targets [4, 6]. There was a research on the beam improvement ofthe moving targets with a special algorithm [7]. However, a processing time to carry out the algorithmis not enough for a real-time radar operation. It means that the radar should get more hardwarecapabilities with a high-speed signal processing for the real-time operation. Therefore, a compact andsimple technical approach useful for the SAA needs to be considered.
There are multiplicative arrays partly similar to the SAS to improve grating lobes [8, 9]. However,an effect of the multiplicative arrays is limited on single target detection, not possible for multipletargets detection simultaneously. When there are multiple targets on different angles at the same rangeand velocity, there is a possibility to detect false targets due to coupling effects by a product beambetween the arrays. The multiplicative arrays should overcome the performance deterioration of theNFR targets detection by the spherical wave as well.
Therefore, this paper proposes the SAA with performance improvement for 77 GHz automotiveFMCW radar to detect moving targets and NFR targets. The rest of this paper is organized as follows.Section 2 presents the radar system design covering a system hardware structure and a waveform.Section 3 presents the SAA design with compensation methods to detect the moving targets and NFRtargets. Section 4 presents simulation and measurement results of the radar performance with the SAA.Finally, conclusions are discussed in Section 5.
2. RADAR SYSTEM DESIGN
2.1. System Hardware Structure
A system hardware structure of the designed radar is presented in Figure 1. The radar system isimplemented with the SAS, which widens the antenna aperture and increases the number of arrayelements, to obtain a high gain and narrow antenna beam with limited hardware capability. Theantenna, which is placed separately, consists of 5 transmit array elements and 12 receive array elements.Total 60 virtual array elements are synthesized with the time-divided transmit by switch array at a
Figure 1. Radar system structure.
Progress In Electromagnetics Research B, Vol. 66, 2016 109
transmitter (TX). In order to implement, a transmit array spacing should be multiplied by the numberof receive array and receive array spacing. The TX consists of a direct digital synthesizer (DDS), a phaselocked loop (PLL), a voltage controlled oscillator (VCO), a mixer, a low pass filter (LPF), a multiplier,a coupler, a switch and power amplifiers (PAs). The waveform is generated by the DDS, which featureslow spurious output, excellent frequency resolution, direct implementation of frequency, etc. The TXgenerates Ku-band signals (12∼13 GHz) at the end of LPF, multiplies them by 6 with the multiplier anddelivers 77 GHz FMCW signals to the transmit array elements. A receiver (RX) consists of a low noiseamplifier (LNA), a mixer, LPF, an intermediate frequency (IF) PA and an analog-to-digital converter(ADC). Received FMCW signals from targets go through down-conversion, filtering (20 MHz), sampling(50 MHz) and are converted to digital signals. A signal processor (SP) consists of two digital signalprocessing boards.
The SP receives 60 channels data and carries out a high-speed parallel processing for 30 Hz updatetime of the radar operation. Main functions of the SP are to extract target information, such as range,velocity and angle. In order to reduce processing time, the target information is extracted with FastFourier Transform (FFT). The SP controls the DDS and the switch using pulse repetition interval (PRI)as well.
2.2. Waveform Design
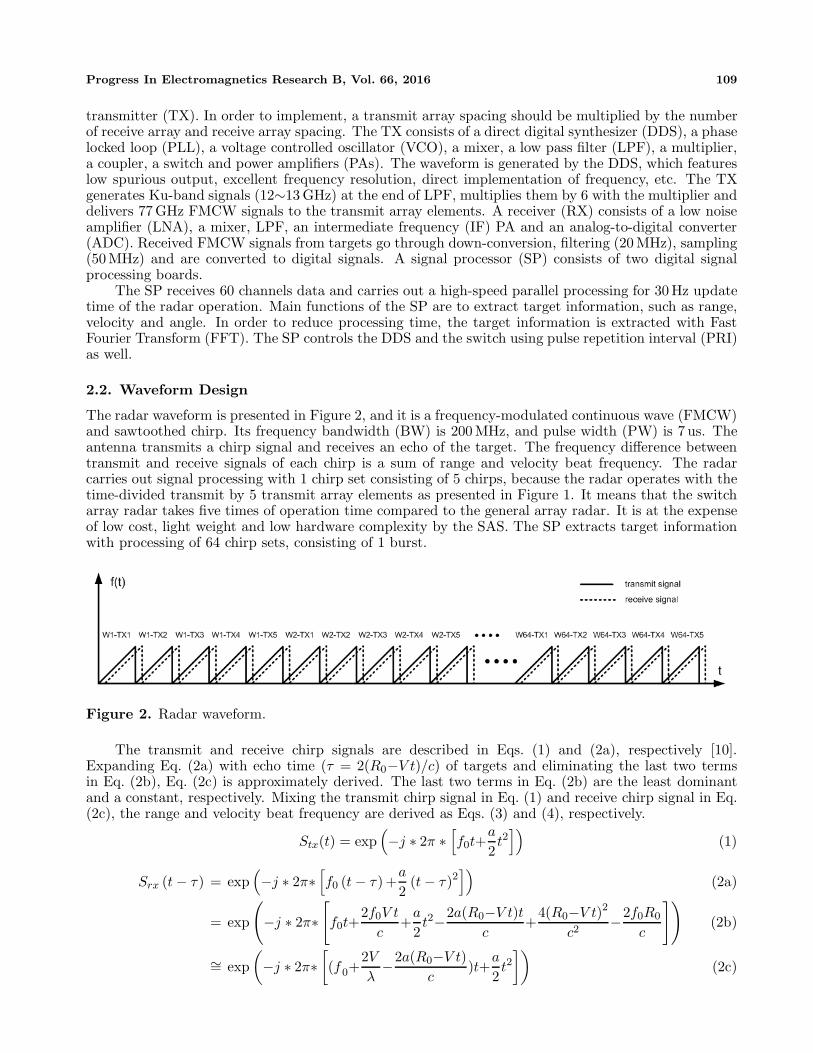
The radar waveform is presented in Figure 2, and it is a frequency-modulated continuous wave (FMCW)and sawtoothed chirp. Its frequency bandwidth (BW) is 200 MHz, and pulse width (PW) is 7 us. Theantenna transmits a chirp signal and receives an echo of the target. The frequency difference betweentransmit and receive signals of each chirp is a sum of range and velocity beat frequency. The radarcarries out signal processing with 1 chirp set consisting of 5 chirps, because the radar operates with thetime-divided transmit by 5 transmit array elements as presented in Figure 1. It means that the switcharray radar takes five times of operation time compared to the general array radar. It is at the expenseof low cost, light weight and low hardware complexity by the SAS. The SP extracts target informationwith processing of 64 chirp sets, consisting of 1 burst.
Figure 2. Radar waveform.
The transmit and receive chirp signals are described in Eqs. (1) and (2a), respectively [10].Expanding Eq. (2a) with echo time (τ = 2(R0−V t)/c) of targets and eliminating the last two termsin Eq. (2b), Eq. (2c) is approximately derived. The last two terms in Eq. (2b) are the least dominantand a constant, respectively. Mixing the transmit chirp signal in Eq. (1) and receive chirp signal in Eq.(2c), the range and velocity beat frequency are derived as Eqs. (3) and (4), respectively.
Stx(t) = exp(−j ∗ 2π ∗
[f0t+
a
2t2])
(1)
Srx (t − τ) = exp(−j ∗ 2π∗
[f0 (t − τ) +
a
2(t − τ)2
])(2a)
= exp
(−j ∗ 2π∗
[f0t+
2f0V t
c+
a
2t2−2a(R0−V t)t
c+
4(R0−V t)2
c2−2f0R0
c
])(2b)
∼= exp(−j ∗ 2π∗
[(f0+
2Vλ
−2a(R0−V t)c
)t+a
2t2])
(2c)

110 Kim et al.
fr = 2a(R0−V t)/c (3)fd = −2V/λ (4)
where f0, a, R0, V and c denote the carrier frequency, chirp slope (= BW/PW ), initial range of thetarget, radial velocity and light velocity, respectively.
3. SWITCH ARRAY ANTENNA (SAA) DESIGN
3.1. SAA with Virtual Array Concept
Figure 3. Virtual array concept.
Generally, a virtual array is implemented with the transmit and receive arrays, which are placedseparately as presented in Figure 3. The transmit and receive arrays consist of M and N elements,respectively. Putting the transmit array spacing as multiplication by the number of receive array and thereceive array spacing, the virtual array is equal to the array consisting of 1 transmit element and MNreceive array elements. Array factor derived from equality relation between both arrays is described inEq. (5).
AF (θ) =( M∑
m=1
Ame−jk0mdtx sin θs
N∑n=1
Ane−jk0ndrx sin θs
)·(ejk0(mdtx+ndrx) sin θ
)
=MN∑i=1
Biejk0idrx( sin θ− sin θs) (5)
where Am, An, Bik0, dtx, drx, m, n, θs denote the weighting of the transmit array, weighting ofthe receive array, weighting of the virtual array, wave number, transmit array spacing, receive arrayspacing, element number of the transmit array, element number of the receive array and beam scanangle, respectively.
The virtual array concept can be applied in the SAS with time-divided transmit. A synthesizedantenna beam with the switch array radar explained in Figure 1 and Eq. (5) is presented in Figure 4. Inorder to calculate the antenna beam, the receive array spacing (0.6λ), transmit array spacing (7.2λ) andweighting of 60 elements (−35 dB Taylor) with 5 transmit array elements and 12 receive array elementsare used. The antenna beam is calculated with Discrete Fourier Transform (DFT) at bore-sight. Withthe SAS using the virtual array concept, (M + N) real array elements play a role of MN virtual arrayelements. It is why the automotive radars consider the SAS in system design.
3.2. SAA for Beam Improvement of Moving Targets
3.2.1. Phase Distortion by Time-Divided Transmit
In a virtual array structure, the simultaneous transmit with orthogonal waveforms at the transmitarray elements generates the same phase front at the receive array elements, while each RX consistsof complicated matched filters because each matched filter should deal with corresponding orthogonal

Progress In Electromagnetics Research B, Vol. 66, 2016 111
Figure 4. Synthesized antenna beam of virtual array.
waveform. The time-divided transmit by switch array with the same waveforms described in Section 2mitigates the hardware complexity because each RX needs only one matched filter, while the time-divided transmit causes a phase distortion at the receive array elements for the moving targets. Figure 5conceptually shows that the moving targets generate phase distortion at the receive array elements bysequential transmit in the SAS. In Figure 5, Ws-TXm (s = 1 ∼64, m = 1 ∼5) denotes the radarwaveform presented in Figure 2. The phase distortion at each receive array element with the movementof targets is derived as Eq. (6). The phase distortion can be calculated with the radial velocity (V ),pulse width (PW ), element number of the transmit array (m), element number of the receive array (n),number of transmit array (M) and number of receive array (N). In Eq. (6), ‘floor’ means an emissionof fractions to get an integer. A same formula can be derived with Eq. (4), the velocity beat frequency,and the time-divided transmit by switch array.
Figure 5. Phase distortion of the receive array for moving targets.
θTXm (m,n)= exp(− j ∗ 2π ∗ 2V ∗ floor
([m − 1]+
[n − 1]N
)∗PW
λ
)for 1 ≤ m ≤ M, 1 ≤ n ≤ N (6)
The characteristics of the phase distortion depend on velocity of the moving targets. The phasedistortion for the velocities, such as +28, 0, −28 m/s, with the SAA (M = 5, N = 12) is presented inFigure 6. The phase distortion at MN array elements for the velocity of the moving targets generatesM −1 times, and each N array elements receive non-distorted phase signals. Depending on approachingor receding of the targets, the phase distortion at array elements is generated in the opposite way.
A synthesized antenna beam of the SAA with the phase distortion given in Figure 6 is presented inFigure 7. The antenna beam is calculated with DFT at bore-sight. Due to the velocity of the movingtargets, considerably high and periodic side lobes are generated. The periodic side lobes result from

112 Kim et al.
Figure 6. Phase distortion for the velocity of moving targets.
Figure 7. Synthesized antenna beam with the phase distortion.
periodic phase distortion with the time-divided transmit by switch array, and the velocity of the movingtargets determines the side-lobe angle, side-lobe level and beam accuracy. The antenna beam for thevelocity within ±28 m/s has lower side lobes and better accuracy than that shown in Figure 7. Theantenna beam has a little accuracy error and can be compensated in the SP easily, while the considerablyhigh and periodic side lobes deteriorate the radar performance with an increased false alarm of targets.Therefore, the side lobes to improve the radar performance should be suppressed.
3.2.2. Side Lobes Suppression Using Sub-Array Beam
The antenna beam of the SAA with the phase distortion by the time-divided transmit can be improvedusing a sub-array beam. Each N array elements obtain non-distorted phase signals in MN arrayelements, consisting of M transmit array elements and N receive array elements. It is also confirmedin Figure 6 that the periodic phase distortion of M − 1 times is generated as stairs, and each N arrayelements get non-distorted signals. When the sub-array beam synthesized with N array elements isapplied to get a product beam as Eq. (7), the SAA beam to suppress the side lobes can be finallyformed. In Eq. (7), the left parentheses represent the antenna beam of the SAA, consisting of MNarray elements, with the phase distortion, and the right parentheses represent the sub-array beam,synthesized with N array elements, with non-distorted phase signals
AF (θ)=
(M∑
m=1
N∑n=1
Amnθ (m,n) ejk0(mdtx+ndrx)(sinθ− sin θs)
)·(
N∑n=1
Bnejk0ndrx( sin θ− sin θs)
)(7)
where θ (m,n), Amn, Bn denote the phase distortion of the SAA in Eq. (6), weighting of MN arrayelements, and weighting of N array elements, respectively. Other variables are identical to Eq. (5).
The synthesized antenna beam of the SAA with and without the sub-array beam compensation ispresented in Figure 8. The antenna beam is calculated with DFT at bore-sight for the velocity +28 m/s.
Progress In Electromagnetics Research B, Vol. 66, 2016 113
Figure 8. Synthesized antenna beam with/without compensation.
The weighting of the SAA and sub-array are −35 dB Taylor and uniform distribution, respectively. InFigure 8, the side lobes are excellently suppressed more than 10 dB with compensation because the highand periodic side lobes without compensation nearly falls on each null of the sub-array beam. The sidelobes of the product beam are not perfectly suppressed because the antenna beam with the SAA isdeflected off a little at bore-sight due to the phase distortion. However, the maximum and average sidelobe levels of the antenna beam with compensation are highly improved, so the radar performance ofthe moving targets is finally enhanced with detection rate of false targets decreased.
3.3. SAA for Beam Improvement of Near-Field Region (NFR) Targets
3.3.1. Phase Distortion by NFR Targets
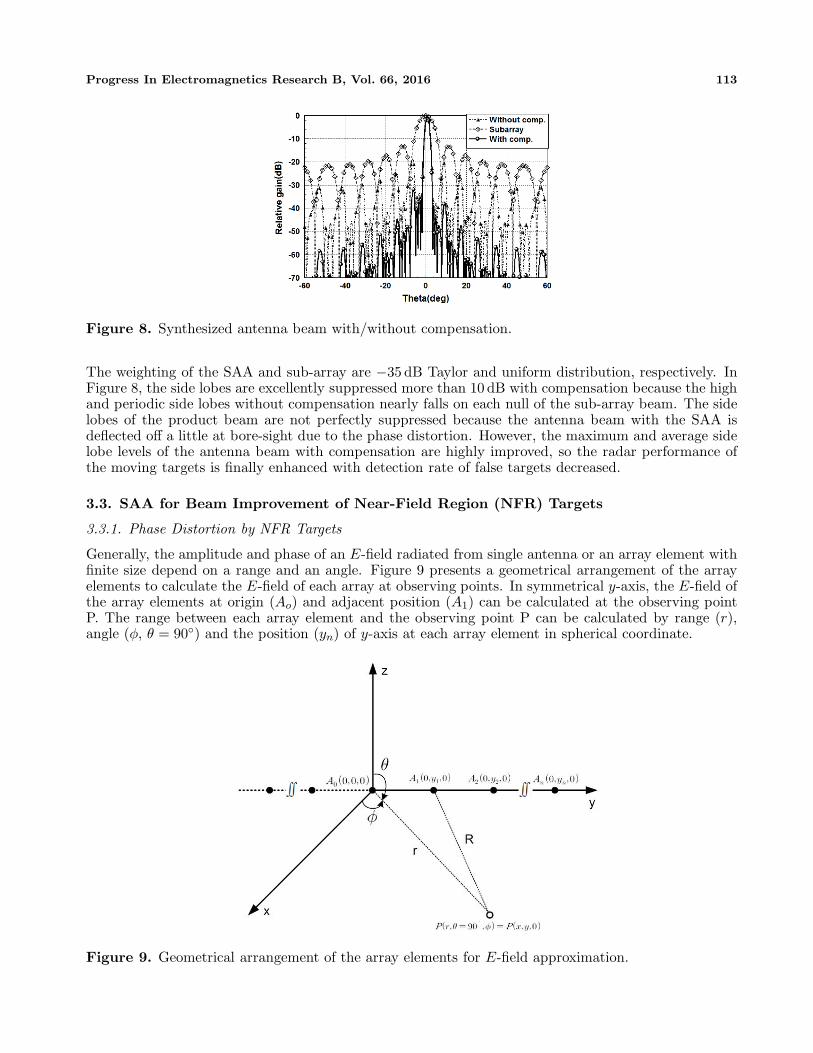
Generally, the amplitude and phase of an E-field radiated from single antenna or an array element withfinite size depend on a range and an angle. Figure 9 presents a geometrical arrangement of the arrayelements to calculate the E-field of each array at observing points. In symmetrical y-axis, the E-field ofthe array elements at origin (Ao) and adjacent position (A1) can be calculated at the observing pointP. The range between each array element and the observing point P can be calculated by range (r),angle (φ, θ = 90◦) and the position (yn) of y-axis at each array element in spherical coordinate.
Figure 9. Geometrical arrangement of the array elements for E-field approximation.

114 Kim et al.
The range of array element (A1) with a binomial expansion is derived as Eq. (8) and the rest ofthe array elements can be done with corresponding y-axis position of each array element in Eq. (8) aswell [5].
R (y1, φ) = r−y1 sin φ+1r
(y21
2cos φ2
)+
1r2
(y31
2sin φ cos φ2
)+ · · · (8)
At the observing point P, the relative amplitude and phase of the E-field at each array elementdetermine a purity of the antenna beam. Generally the range from each array element has more influenceon the phase than the amplitude and each range forms a relative phase distribution of the array elementsdifferently. Putting a maximum phase difference among the array elements with λ/16, the range (R) tocalculate the phase of each array element can be approximated as Eqs. (8a) and (8b) [5]. Eqs. (8a) and(8b) are a plane wave and a spherical wave, respectively. In range of Eq. (8b) the radiating near fieldis formed.
R (y1, φ) ∼= r − y1 sin φforr ≥2D2
λ(8a)
∼= r − y1 sin φ+1r
(y21
2cos φ2
)for 0.62
√D3
λ≤ r ≤2D2
λ(8b)
where D denotes a size of the antenna, consisting of the array elements.The angle estimation of the targets is generally carried out at range with the plane wave formed
as Eq. (8a). In the NFR with the spherical wave formed as Eq. (8b), the antenna beam with the planewave assumed has distortion characteristics
The relative range distribution between the targets and the array elements at bore-sight (φ = 0◦)with (8b) is presented in Figure 10. The SAA designed with 5 transmit array elements and 12 receive
Figure 10. Relative range distribution between targets and the array elements.
Figure 11. Relative phase distribution between targets and the array elements.

Progress In Electromagnetics Research B, Vol. 66, 2016 115
Figure 12. Synthesized antenna beam for the NFR targets.
array elements is considered at target ranges 2m, 3 m and 4m. Those are representative ranges ofminimum detection range required for the automotive radars. The relative phase distribution amongthe array elements by (8b) is presented in Figure 11. It is confirmed that the phase difference amongthem for the NFR targets is considerable due to 77 GHz carrier frequency. The synthesized antennabeam for the NFR targets with (8b) is calculated as (9).
AF (φ) =MN∑t=1
Ate−jk0R(yt,φ)e−jk0tdrx sin φs (9)
where At and φs denotes an weighting of MN array elements and a beam scan angle other variablesare identical to Eq. (5).
The synthesized antenna beam for the NFR targets with Eq. (9) is presented in Figure 12. Theantenna beam is calculated with DFT at bore-sight. The antenna beam is distorted a little in a shapeof main lobe and has higher and periodic side lobes. The antenna beam includes the sub-array beamcompensation to suppress side lobes generated by the time-divided transmit discussed Section 3.2. Itmeans that an additional compensation should be considered to improve the antenna beam for the NFRtargets.
3.3.2. Beam Compensation of NFR Targets
The relative phase distribution among the array elements is generated differently depending on the angleof the observing point (φ, θ = 90◦) at a fixed target range (r) in the NFR. In other words, each angleof the observing point causes a different phase distribution among the array elements. Therefore beamcompensation with FFT-based beam synthesis is not fully possible, while beam compensation with DFT-based beam synthesis is fully possible because each beam is synthesized independently. The designedradar use FFT-based beam synthesis and its antenna beam can be compensated partially consideringbeam coverage for its operation. The distorted antenna beam for the NFR targets is compensated asEq. (10). In Eq. (10), the left parentheses represent Eq. (9), and the right parentheses represent thephase compensation of the array elements using a representative angle within beam coverage.
AF (φ) =MN∑t=1
(Ate
−jk0R(yt,φ)e−jk0tdrxsinφs
)·(ejk0R(yt,φcom)
)(10)
where φcom is a compensation angle, other variables are identical to Eqs. (5) and (9).The synthesized antenna beam with compensation for the NFR targets at bore-sight and 30◦ beam
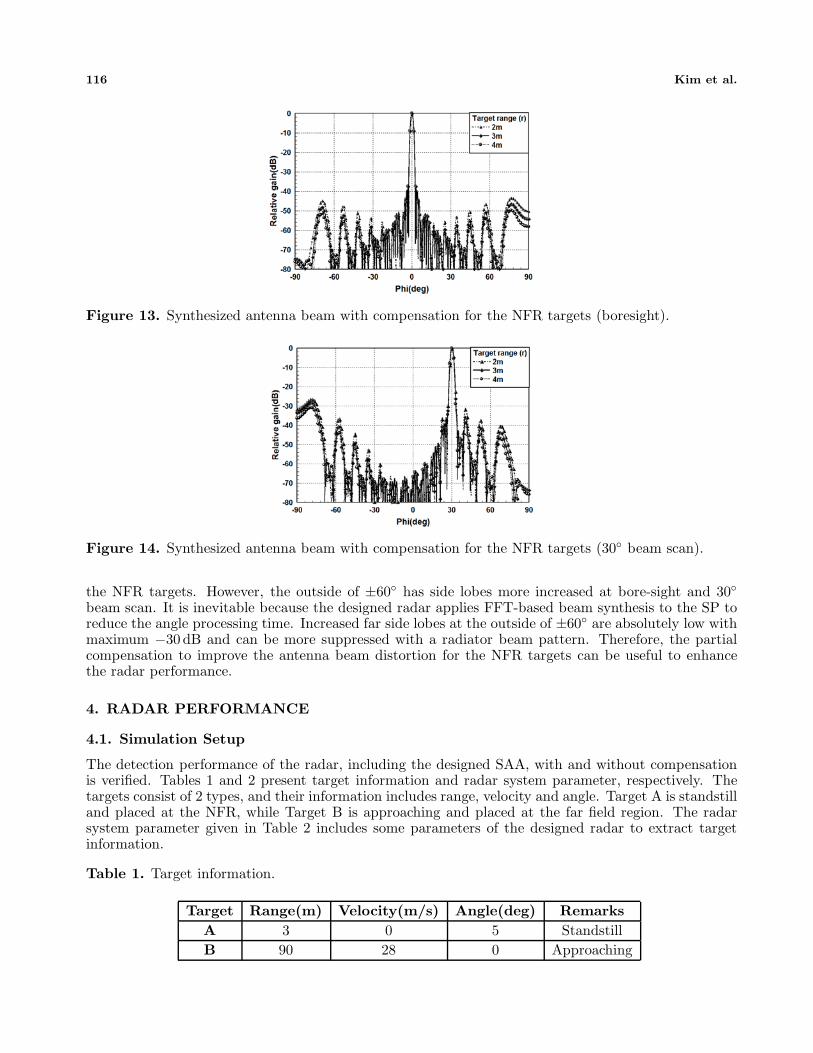
scan are presented in Figures 13 and 14, respectively. The phase compensation of the array elements iscarried out selecting bore-sight as the representative angle to compensate all the distorted beams withinbeam coverage. Compared to the antenna beam synthesized with the phase distortion as in Figure 12,the antenna beam with compensation gets back to the shape of main lobe and has suppressed sidelobes as in Figure 13. Especially near side lobes adjacent to the main lobe is 15∼25 dB suppressed for
116 Kim et al.
Figure 13. Synthesized antenna beam with compensation for the NFR targets (boresight).
Figure 14. Synthesized antenna beam with compensation for the NFR targets (30◦ beam scan).
the NFR targets. However, the outside of ±60◦ has side lobes more increased at bore-sight and 30◦beam scan. It is inevitable because the designed radar applies FFT-based beam synthesis to the SP toreduce the angle processing time. Increased far side lobes at the outside of ±60◦ are absolutely low withmaximum −30 dB and can be more suppressed with a radiator beam pattern. Therefore, the partialcompensation to improve the antenna beam distortion for the NFR targets can be useful to enhancethe radar performance.
4. RADAR PERFORMANCE
4.1. Simulation Setup
The detection performance of the radar, including the designed SAA, with and without compensationis verified. Tables 1 and 2 present target information and radar system parameter, respectively. Thetargets consist of 2 types, and their information includes range, velocity and angle. Target A is standstilland placed at the NFR, while Target B is approaching and placed at the far field region. The radarsystem parameter given in Table 2 includes some parameters of the designed radar to extract targetinformation.
Table 1. Target information.
Target Range(m) Velocity(m/s) Angle(deg) RemarksA 3 0 5 StandstillB 90 28 0 Approaching

Progress In Electromagnetics Research B, Vol. 66, 2016 117
Table 2. Radar system parameter.
Parameter Value RemarksCarrier frequency 77 GHzChirp bandwidth 200 MHzPulse width 7 usSampling frequency 50 MHzPulse repetition interval 7 usNo. of transmit array elements 5 TX switch applied.
No. of synthesized array = 60No. of receive array elements 12Transmit array spacing 7.2λReceive array spacing 0.6λChirp set 5 chirpBurst 64 chirp setNo. of FFT point for range processing 512 Hamming windowNo. of FFT point for doppler processing 64 Chebyshev windowNo. of FFT point for beam processing 64 −35 dB Taylor window
A signal processing flow of the designed radar is presented in Figure 15. A data cube consists ofADC data (350), chirp sets (64) and synthesized array elements (60) by TX switch. The ADC data aregenerated with mixing Stx(t), given in Eq. (1), and Srx(t − τ), given in Eq. (2c). A range processing iscarried out with zero-padding and 512 points FFT. A doppler processing is carried out with 64 pointsFFT. The maximum detection range for simulation is less than 130 m, so we used first 256 range bindata to extract doppler information of the targets. Finally, an angle processing is carried out withzero-padding and 64 points FFT. In each processing, window weighting to prevent false targets by sidelobes is applied as Table 2.
Figure 15. Signal processing flow of the designed radar.
4.2. Simulation Results
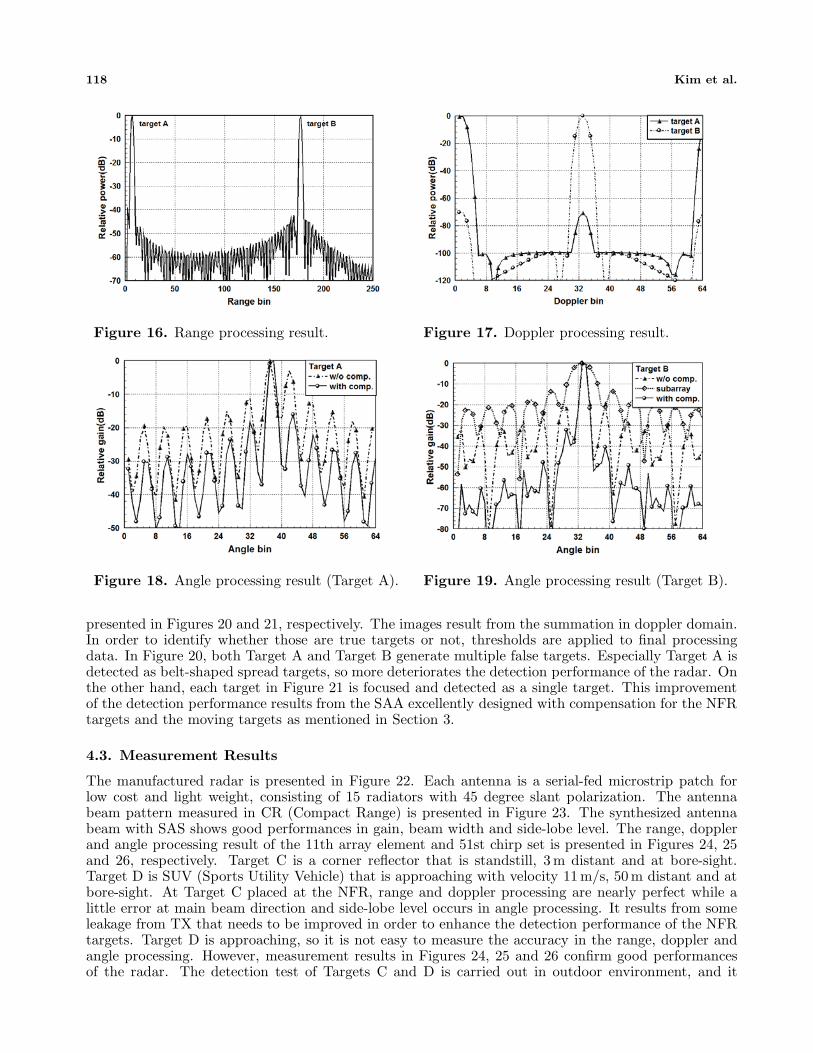
The range processing result of 20th array element and 32nd chirp set is presented in Figure 16. A rangebin size is 0.51 m. Target A and Target B are detected at 7th bin (3.06 m) and 177th bin (89.76 m),respectively. The doppler processing result of the 20th array element is presented in Figure 17. Adoppler bin size is 0.88 m/s. Both Target A and Target B are detected at the 1st bin (0 m/s) and 33thbin (28.16 m/s), respectively. The angle processing results are presented in Figures 18 and 19. An anglebin size is 1.4◦, and 33rd bin is bore-sight. Target A without and with compensation are detected at the36th (4.2◦) and 37th (5.6◦) bins, respectively. It is confirmed that both Target A, the NFR target, andTarget B, the moving target, have considerably suppressed side lobes with beam compensation. Someerror in each processing result is caused by a bin resolution with FFT and more decreased througha tracking filter later. The images without and with beam compensation in range-angle domain are
118 Kim et al.
Figure 16. Range processing result. Figure 17. Doppler processing result.
Figure 18. Angle processing result (Target A). Figure 19. Angle processing result (Target B).
presented in Figures 20 and 21, respectively. The images result from the summation in doppler domain.In order to identify whether those are true targets or not, thresholds are applied to final processingdata. In Figure 20, both Target A and Target B generate multiple false targets. Especially Target A isdetected as belt-shaped spread targets, so more deteriorates the detection performance of the radar. Onthe other hand, each target in Figure 21 is focused and detected as a single target. This improvementof the detection performance results from the SAA excellently designed with compensation for the NFRtargets and the moving targets as mentioned in Section 3.
4.3. Measurement Results
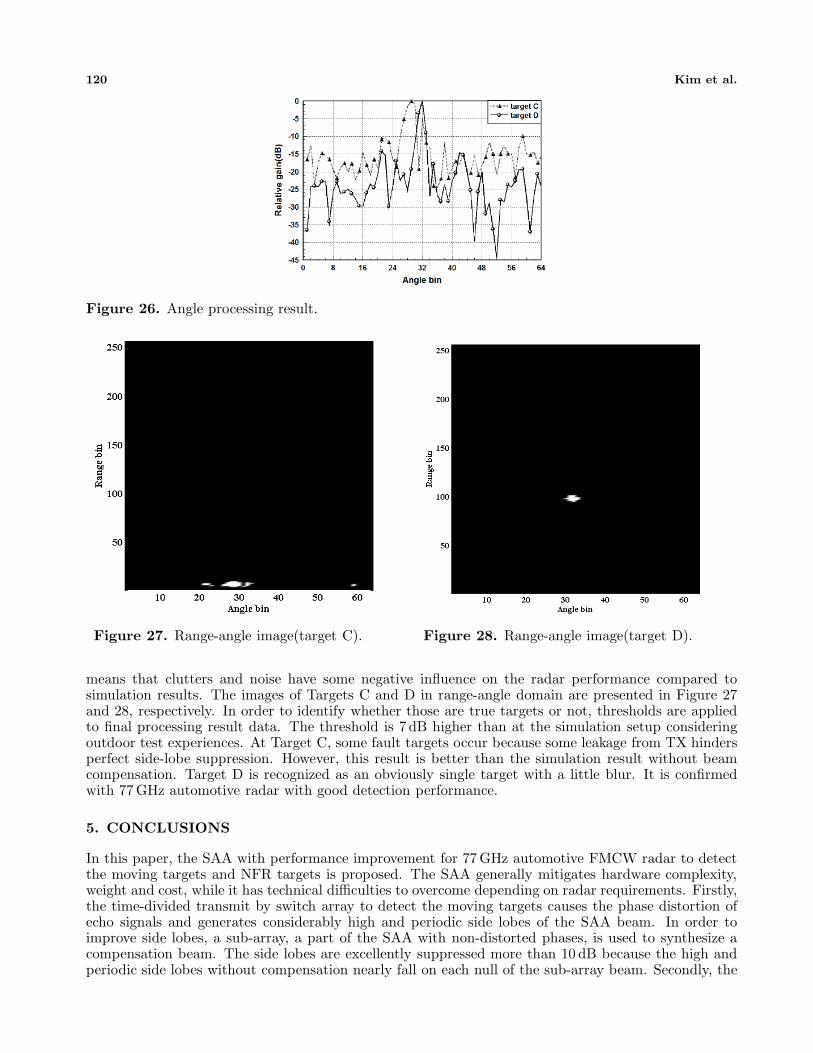
The manufactured radar is presented in Figure 22. Each antenna is a serial-fed microstrip patch forlow cost and light weight, consisting of 15 radiators with 45 degree slant polarization. The antennabeam pattern measured in CR (Compact Range) is presented in Figure 23. The synthesized antennabeam with SAS shows good performances in gain, beam width and side-lobe level. The range, dopplerand angle processing result of the 11th array element and 51st chirp set is presented in Figures 24, 25and 26, respectively. Target C is a corner reflector that is standstill, 3 m distant and at bore-sight.Target D is SUV (Sports Utility Vehicle) that is approaching with velocity 11 m/s, 50 m distant and atbore-sight. At Target C placed at the NFR, range and doppler processing are nearly perfect while alittle error at main beam direction and side-lobe level occurs in angle processing. It results from someleakage from TX that needs to be improved in order to enhance the detection performance of the NFRtargets. Target D is approaching, so it is not easy to measure the accuracy in the range, doppler andangle processing. However, measurement results in Figures 24, 25 and 26 confirm good performancesof the radar. The detection test of Targets C and D is carried out in outdoor environment, and it

Progress In Electromagnetics Research B, Vol. 66, 2016 119
Figure 20. Range-angle image(w/o compensa-tion).
Figure 21. Range-angle image(with compensa-tion).
Figure 22. Manufactured radar. Figure 23. Measured beam pattern of SAA.
Figure 24. Range processing result. Figure 25. Doppler processing result.
120 Kim et al.
Figure 26. Angle processing result.
Figure 27. Range-angle image(target C). Figure 28. Range-angle image(target D).
means that clutters and noise have some negative influence on the radar performance compared tosimulation results. The images of Targets C and D in range-angle domain are presented in Figure 27and 28, respectively. In order to identify whether those are true targets or not, thresholds are appliedto final processing result data. The threshold is 7 dB higher than at the simulation setup consideringoutdoor test experiences. At Target C, some fault targets occur because some leakage from TX hindersperfect side-lobe suppression. However, this result is better than the simulation result without beamcompensation. Target D is recognized as an obviously single target with a little blur. It is confirmedwith 77 GHz automotive radar with good detection performance.
5. CONCLUSIONS
In this paper, the SAA with performance improvement for 77 GHz automotive FMCW radar to detectthe moving targets and NFR targets is proposed. The SAA generally mitigates hardware complexity,weight and cost, while it has technical difficulties to overcome depending on radar requirements. Firstly,the time-divided transmit by switch array to detect the moving targets causes the phase distortion ofecho signals and generates considerably high and periodic side lobes of the SAA beam. In order toimprove side lobes, a sub-array, a part of the SAA with non-distorted phases, is used to synthesize acompensation beam. The side lobes are excellently suppressed more than 10 dB because the high andperiodic side lobes without compensation nearly fall on each null of the sub-array beam. Secondly, the

Progress In Electromagnetics Research B, Vol. 66, 2016 121
SAA to detect the NFR targets, one of the radar requirements, deteriorates the beam performance by thespherical wave. To overcome this deterioration, the partial compensation method is proposed consideringbeam coverage of the radar operation at each target range because FFT-based beam synthesis generatesall of the beams simultaneously. The phase compensation of the array elements is carried out selectingbore-sight as the representative angle to compensate all the distorted beams within beam coverage.Some of the NFR targets to verify minimum range detection are simulated, and the SAA beam gets themain lobe back and has side lobes 15∼25 dB suppressed with compensation. With the SAA designed,the detection performance of the radar is simulated. Two targets and radar system parameter areused, and signal processing tasks are included in simulation. The range, doppler and angle processingare carried out, and in order to identify whether the detected targets are true or not, thresholds areapplied to final processing result data. It is confirmed that the moving targets and NFR targets are welldetected because multiple false targets are eliminated with the proposed compensation methods. Alsooutdoor test confirms that the proposed compensation methods improve the detection performance ofthe radar with real targets, consisting of corner reflector and SUV. This improvement of the detectionperformance results from the SAA excellently designed with compensation for the NFR targets andmoving targets.
REFERENCES
1. Folster, F., H. Rohling, and U. Lubbert, “An automotive radar network-based on 77 GHz FMCWsensors,” Radar Conference 2005, 871–876, May 2005.
2. Lievers, C. M., W. L. van Rossum, A. P. M. Maas, and A. G. Huizing, “Digital beam formingon transmit and receive with an AESA FMCW radar,” Proceeding of the 4th European RadarConference 2007, 47–50, October 2007.
3. Van Rossum, W. L., C. M. Lievers, A. P. M. Maas, and A. G. Huizing, “Suppression of sidelobescatterers in an AESA FMCW radar,” Radar Conference 2008, 1–5, 2008.
4. Schneider, M., “Automotive radar — Status and trends,” IEEE-German Microwave Conference2005(GeMic 2005), 144–147, 2005.
5. Balanis, C. A., Antenna Theory,, 133–151 John Wiley & sons inc., 1997.6. Lee, M. S. and Y. H. Kim, “Design and performance of a 24-GHz switch-antenna array FMCW
radar system for automotive applications,” IEEE Transactions on Vehicular Technology, Vol. 59,No. 5, 2290–2297, 2010.
7. Hu, C., Y. Liu, H. Meng, and X. Wang, “Randomized switched antenna array FMCW radar forautomotive applications,” IEEE Transactions on Vehicular Technology, Vol. 63, No. 8, 3624–3641,2014.
8. Macphie, R. H. and T. H. Yoon, “Grating lobe suppression with a thinned multiplicative receivingarray,” Microwave Conference Proceedings, APMC, 2005.
9. Davies, D. E. N. and C. R. Ward, “Low sidelobe patterns from thinned arrays using multiplicativeprocessing,” Communications, Radar and Signal Processing, IEE Proceedings, Vol. 127, No. 1, 1980.
10. Skolnik, M. I., Radar Handbook, 3rd Edition, 8.28.4, McGraw-Hill, 2008.