Embed Size (px)
Citation preview

Western Michigan University Western Michigan University
ScholarWorks at WMU ScholarWorks at WMU
Dissertations Graduate College
8-1983
A Descriptive Study of Organizational Structure and Its A Descriptive Study of Organizational Structure and Its
Relationship to Employee Utilization in the Electric Utility Industry Relationship to Employee Utilization in the Electric Utility Industry
Frederick M. Keaton Western Michigan University
Follow this and additional works at: https://scholarworks.wmich.edu/dissertations
Part of the Human Resources Management Commons, and the Labor Relations Commons
Recommended Citation Recommended Citation Keaton, Frederick M., "A Descriptive Study of Organizational Structure and Its Relationship to Employee Utilization in the Electric Utility Industry" (1983). Dissertations. 2452. https://scholarworks.wmich.edu/dissertations/2452
This Dissertation-Open Access is brought to you for free and open access by the Graduate College at ScholarWorks at WMU. It has been accepted for inclusion in Dissertations by an authorized administrator of ScholarWorks at WMU. For more information, please contact [email protected].
A DESCRIPTIVE STUDY OF ORGANIZATIONAL STRUCTUREAND ITS RELATIONSHIP TO EMPLOYEE UTILIZATION
IN THE ELECTRIC UTILITY INDUSTRY
by
Frederick M. Keaton
A Dissertation Submitted to the
Faculty of The Graduate College in partial fulfillment of the
requirements for the Degree of Doctor of Education
Department of Educational Leadership
Western Michigan University Kalamazoo, Michigan
August 1983
R e p ro d u c e d w «d pe rm iss io n o , ,h e copyrlgh , ow ner. F u r th e r reproduction prohibited w «hou t perm iss ion .

A DESCRIPTIVE STUDY OF ORGANIZATIONAL STRUCTUREAND ITS RELATIONSHIP TO EMPLOYEE UTILIZATION
IN THE ELECTRIC UTILITY INDUSTRY
Frederick M. Keaton, Ed.D.
Western Michigan University, 1983
The purpose of this study was to examine the effects that six
structural variables had upon the utilization of employees within
an electric utility. Specifically the objectives were:
1. To investigate the relationship between the organizational
level within an organization and work force utilization.
2. To determine whether a relationship exists between span of
control and work force utilization.
3. To determine whether a relationship exists between line
versus staff positions and work force utilization.
4. To investigate the relationship between organizational
subunit size and work force utilization.
5. To investigate the relationship between centralized versus
decentralized organizations and work force utilization.
6. To determine whether a relationship exists between blue-
collar versus white-collar workers and work force utilization.
Work force utilization percentages were determined through the
Industrial Engineering Technique of work sampling. Over 200,000
work sampling observations were taken of the personnel of 17 depart
ments during a 12-month time period. Organizational structure data
were determined through the use of corporate and departmental
R e p ro d u c e d with perm iss ion of th e copyright ow ner. F u r th e r reproduction prohibited without perm iss ion .

organizational charts.
Some of the findings of the study were: (a) no relationship
was found to exist between work force utilization and the structural
variables of organizational level, line versus staff, blue-collar
versus white-collar, and centralized versus decentralized employees;
and (b) a relationship was found to exist between work force utili
zation and the structural variables of span of control and subunit size.
In some instances, the data supported the majority of research
conducted in this area; and in some instances, the data did not sup
port previous studies. Based on the findings of the study, recom
mendations for future research and management practice were sug
gested.
R e p ro d u c e d with perm iss ion of th e copyright ow ner. F u r th e r reproduction prohibited without perm iss ion .
INFORMATION TO USERS
This reproduction was made from a copy of a document sent to us for microfilming. While the most advanced technology has been used to photograph and reproduce this document, the quality of tlie reproduction is heavily dependent upon the quality of the material submitted.
The following explanation o f techniques is provided to help clarify markings or notations which may appear on this reproduction.
1.The sign or “ target” for pages apparently lacking from the document photographed is “Missing Page(s)” . If it was possible to obtain the missing page(s) or section, they are spliced into the film along with adjacent pages. This may have necessitated cutting through an image and duplicating adjacent pages to assure complete continuity.
2. When an image on the film is obliterated with a round black mark, it is an indication of either blurred copy because o f movement during exposure, duplicate copy, or copyrighted materials that should no : have been filmed. For blurred pages, a good image o f the page can be found in the adjacent frame. If copyrighted materials were deleted, a target note will appear listing the pages in the adjacent frame.
3. When a map, drawing or chart, etc., is part of the material being photographed, a definite method of “sectioning” the material has been followed. It is customary to begin filming at the upper left hand comer o f a large sheet and to continue from left to right in equal sections with small overlaps. If necessary, sectioning is continued again—beginning below the first row and continuing on until complete.
4. For illustrations that cannot be satisfactorily reproduced by xerographic means, photographic prints can be purchased at additional cost and inserted into your xerographic copy. Tliese prints are available upon request from the Dissertations Customer Services Department.
5. Some pages in any document may have indistinct print. In all cases the best available copy has been filmed.
UniversiVM icrœ lm s
International300 N. Zeeb Road Ann Arbor, Ml 48106
R e p ro d u c e d with perm iss ion of th e copyright ow ner. F u r th e r reproduction prohibited without perm iss ion .

Reproduced with permission of the copyright owner. Further reproduction prohibited without permission.

8326664
Keaton, Frederick Monroe
A DESCRIPTIVE STUDY O F ORGANIZATIONAL STRUCTURE AND ITSRELATIONSHIP TO EMPLOYEE UTILIZATION IN THE ELECTRIC UTILITYINDUSTRY
Western Michigan University Ed.D. 1983
UniversityMicrofilms
Intern &ti O n el SOO N. zeeb Road, Ann Arbor, Ml 48106
Copyright 1983
by
Keaton, Frederick Monroe
All Rights Reserved
R e p ro d u c e d with p erm iss ion of th e copyright ow ner. F u r the r reproduction prohibited without perm iss ion .
Reproduced with permission of the copyright owner. Further reproduction prohibited without permission.
PLEASE NOTE:
In all cases this material has been filmed in the best possible way from the available copy. Problems encountered with this document have been identified here with a check m ark ■ £ _
1. Glossy photographs or pages.
2. Colored illustrations, paper or print______
3. Photographs with dark background______
4. Illustrations are poor copy_______
5. Pages with black marks, not original copy.
6. Print shows through as there is text on both sides of page.
7. Indistinct, broken or small print on several pages •l/ '
8. Print exceeds margin requirements______
9. Tightly bound copy with print lost in spine____
10. Computer printout pages with indistinct print.
11. Page(s)____________ lacking when material received, and not available from school orauthor.
12. Page(s)____________ seem to be missing in numbering only as text follows.
13. Two pages num bered____________ . Text follows.
14. Curling and wrinkled pages______
15. e th er__________________________________________ ________________________________
UniversityMicrofiinns
International
R e p ro d u c e d with p erm iss ion of th e copyright ow ner. F u r the r reproduction prohibited without perm iss ion .

Reproduced with permission of the copyright owner. Further reproduction prohibited without permission.

ACKNOWLEDGMENTS
I am indebted to the faculty of Western Michigan University,
and their staff who made it possible for this doctoral program to
be offered at Selfridge Air Base in Mt. Clemens, Michigan. A spe
cial thanks goes to the instructors of the Educational Leadership
Department who traveled to Mt. Clemens to offer the students guid
ance and quality instruction.
A special debt of gratitude is extended to Dr. Uldis Smidchens,
Dr. Diane Petway, and Dr. Richard Munsterman for their contribution
and support while serving on the dissertation committee.
I thank my wife, Brenda, and my daughters, Kim and Karen, for
the love and support they have given to me during the past three
years.
I extend a special thanks to my parents, Edward and Eamestine
Keaton, for their continued support and faith in me during the pur
suit of my educational goals.
This family effort has brought all of us closer together.
Without your support and love, this degree would have never been
attained.
Frederick M. Keaton
11
R e p ro d u c e d with perm iss ion of th e copyright ow ner. F u r th e r reproduction prohibited without perm iss ion .
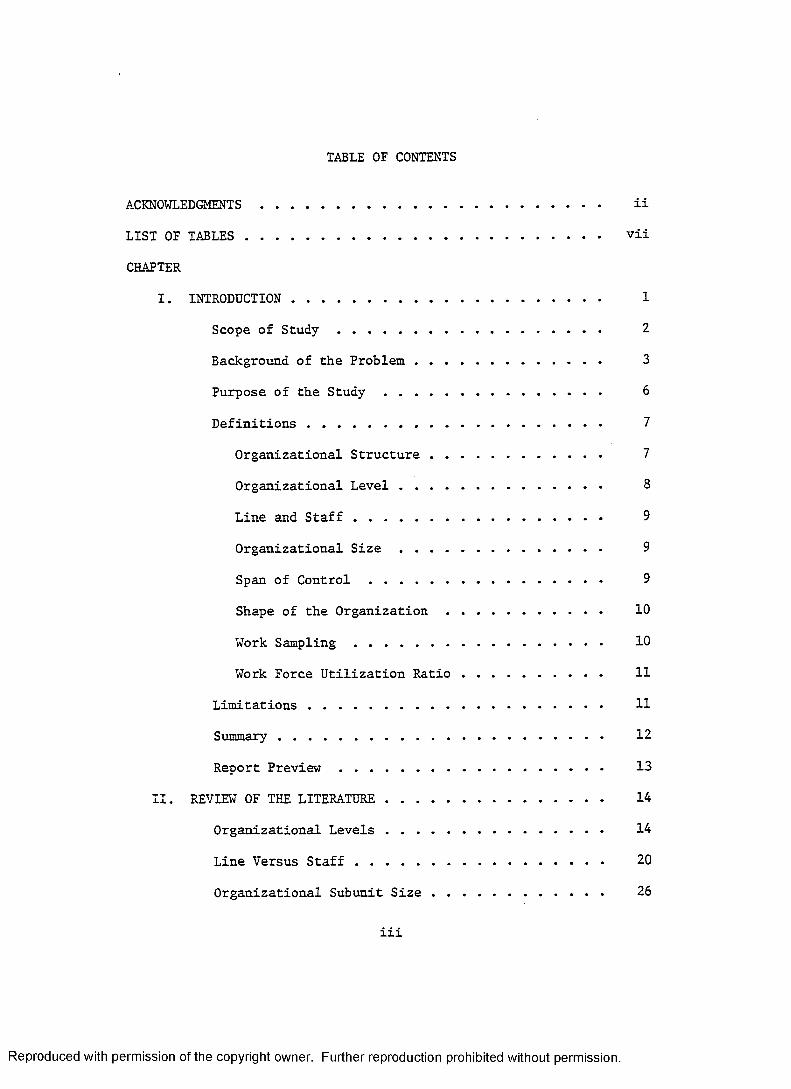
TABLE OF CONTENTS
ACKNOWLEDGMENTS........................................ ii
LIST OF TABLES............................................ vii
CHAPTER
I. INTRODUCTION .................................... 1
Scope of S t u d y ............................... 2
Background of the Problem...................... 3
Purpose of the S t u d y .......................... 6
Definitions ................................... 7
Organizational Structure .................... 7
Organizational Level ........................ 8
Line and Staff............................. 9
Organizational Size ........................ 9
Span of Control........................... 9
Shape of the Organization.................. 10
Work Sampling............................. 10
Work Force Utilization Ratio ................ 11
Limitations................................... 11
Summary...................................... 12
Report Preview ............................... 13
II. REVIEW OF THE LITERATURE.......................... 14
Organizational Levels .......................... 14
Line Versus Staff............................. 20
Organizational Subunit Size .................... 26
iii
R e p ro d u c e d with perm iss ion of th e copyright ow ner. F u r th e r reproduction prohibited without perm iss ion .

Table of Contents— Continued
CHAPTER
Span of Control............................... 32
Traditional Viewpoint ...................... 32
Current Research ............................ 35
Centralization Versus Decentralization ......... 40
White-Collar Versus Blue-Collar Worker ......... 47
Job Satisfaction Related to Job Performance . . . . 51
Conclusions Based Upon the Review of theLiterature................................... 53
Statement of the Hypotheses.................... 53
III. DESIGN AND METHODOLOGY........................... 54
Subjects..................................... 54
Measures..................................... 36
Advantages................................. 58
Disadvantages ............................. 59
Work Sampling Procedures .................... 60
Validity of Work Sampling.................. 62
Reliability of Work Sampling................. 64
Data Collection............................... 64
Data Analysis Procedures ...................... 65
Classifications of Departments ................ 66
Line Versus S t a f f .......................... 66
Centralized Versus Decentralized ............. 67
Subunit Size............................... 67
Span of Control............................ 67
iv
R e p ro d u c e d with perm iss ion of th e copyright ow ner. F u r th e r reproduction prohibited without perm iss ion .

Table of Contents— Continued
CHAPTER
Management Versus Nonmanagement............. 68
White-Collar Versus Blue-Collar ............. 68
Summary....................................... 68
IV. RESULTS........................................ 70
Introduction ................................. 70
Presentation and Analysis of Data............... 70
Organization Level .......................... 70
Line Versus S t a f f .......................... 72
Blue-Collar Employees Versus White Collar . . . 73
Centralized Versus Decentralized ............. 74
Span of Control............................ 74
Subunit Size............................... 75
Summary....................................... 77
V. CONCLUSIONS, RECOMMENDATIONS, AND SUMMARY ......... 78
Conclusions................................... 78
Organizational Level ........................ 78
Line Versus S t a f f ....................... 79
Span of Control........................... 79
Centralized Versus Decentralized ............. 80
Blue-Collar Employees Versus White-Collar . . . 80
Subunit Size............................... 81
Uses by Public Utilities...................... 81
Recommendations for Future Research ............. 82
Summary....................................... 83
V
R e p ro d u c e d with perm iss ion of th e copyright ow ner. F u r th e r reproduction prohibited without perm iss ion .
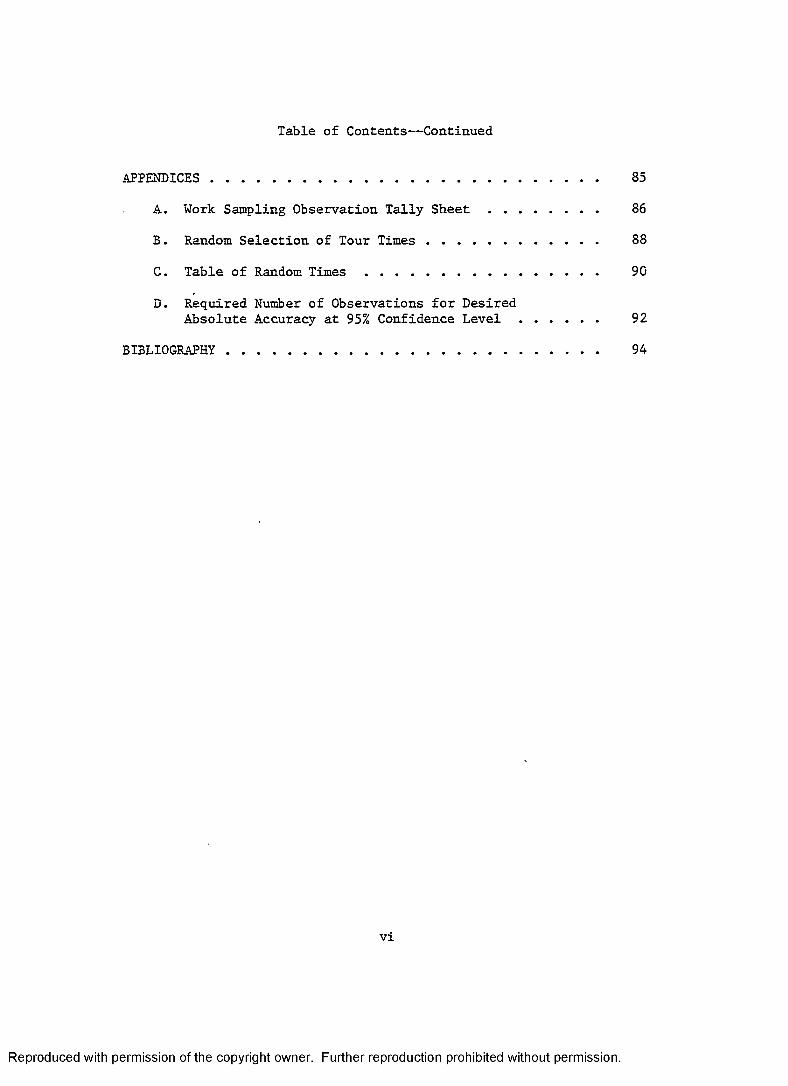
Table of Contents— Continued
APPENDICES.............................................. 85
A. Work Sampling Observation Tally Sheet ............. 86
B. Random Selection of Tour Times..................... 88
C. Table of Random T i m e s ............................ 90
D. Required Number of Observations for DesiredAbsolute Accuracy at 95% Confidence Level ......... 92
BIBLIOGRAPHY ............................................ 94
VI
R e p ro d u c e d with perm iss ion of th e copyright ow ner. F u r th e r reproduction prohibited without perm iss ion .

LIST OF TABLES
1. Summary Analysis of Means and Standard Deviationsof Work Force Utilization Percentages ................ 71
2. Results of the _t Test Between the Work Force Utilization of Management and NonmanagementEmployees.......................................... 72
3. Summary _t Analysis Data for the Difference BetweenWork Force Utilization of Line and Staff Personnel . . . . 73
4. Results of the ̂ Test Between Work Force Utilizationof White-Collar and Blue-Collar Workers ............... 73
5. Results of the t Test Between Work Force Utilizationof Centralized and Decentralized Workers............... 74
6. Results of the _t Test Between the Work Force Utilization of Small Span of Control Employeesand Large Span of Control Employees.................. 75
7. Pearson Product-Moment Correlation Coefficient Between Organizational Size and Work ForceUtilization........................................ 76
Vll
R e p ro d u c e d with perm iss ion of th e copyright ow ner. F u r th e r reproduction prohibited without perm iss ion .

CHAPTER I
INTRODUCTION
Porter and Lawler (1965) stated that:
All organizations are structured, in the sense of having positions and parts which are systematically related to other positions and parts. Since organizations vary in their structure, it is appropriate to examine the question of whether differences in the structure of organizations are related to differences in the attitudes and behavior of their members, (p. 23)
There is hardly an aspect of an individual's life that is not
affected by a formal or informal organization. Hicks and Gullett
(1976) stated that the family constitutes an organization which we
are introduced to at birth, and we continue to join structured orga
nizations for the rest of our lives.
Conversely, since the beginning of mankind, with its participa
tion in organizations, mankind has always searched for a better way
to do things. One such method which has been used is the "scien
tific management" approach developed by Frederick W. Taylor in the
19th century. Scientific management is defined as management based
on measurement plus control (Nance & Nolan, 1971). Taylor, Gantt,
the Gilbreths, and others who followed the scientific approach,
introduced and developed many new management principles and tech
niques which were designed to systematize and standardize the plan
ning, measurement, and control of industry.
In order to have effective controls they found it necessary to
establish a systematic method of effective measurement. The
1
R e p ro d u c e d with perm iss ion of th e copyright ow ner. F u r th e r reproduction prohibited without perm iss ion .

technique developed was the use of work standards. Nance and Nolan
(1971) defined a work standard as "any established criterion, rule
or model against which comparisons are made— that which is set up
and established by authority for the measure of quantity, weight,
extent, value or quality" (p. 17). Karger and Bayha (1977) related
the importance of standards to control as "Control is simply com
paring some performance or condition (machine, human, environmental,
etc.) against a standard and exerting corrective action when devia
tion from the standard occurs" (p. 4).
One such method of setting standards is that of work sampling
which was developed by L. H. Tippett in 1934 and has been commonly
used as a work measurement tool by various industries since that
time. Hansen (1960) has stated that work sampling is an effective
method of developing standards. In addition to this application,
Hansen (1960), Coombe and Densmore (1982), and Benes (1981) have
referred to work sampling as an effective tool for determining em
ployee utilization. For the purposes of this paper, work sampling
was used to determine employee utilization.
Scope of Study
This study was designed to assess the relationship between work
force utilization and organizational structure. The interest in
employee utilization was bom during the Industrial Revolution.
There was a resurgence at the start of the 20th century in the form
of scientific management. Recently it has been revived with the
state of the economy.
R e p ro d u c e d with perm iss ion of th e copyright ow ner. F u r th e r reproduction prohibited without perm iss ion .

3Concurrently, there has long been an emphasis placed on organi
zational structure. The classical theorists, Fayol (1977), Urwick
(1974), and Taylor (1947) placed heavy emphasis on chain of command,
span of control, and specialization of function, which were all re
lated to organizational structure and efficiency. Hollander and
Hunt (1967) stated that although organizational policies and struc
tures may be elaborated separately from their membership, people
populate and work them, and the interplay of people and structures
define the phenomena of organization. Drucker (1974) stated that
structure is the vehicle managers use to obtain the goals and ob
jectives of their organization.
The modem theorists were interested in the behavioral aspects
of the organization without regard to the structural aspects.
Bennis (1959) stated that classical theorists talked about organiza
tions without people, while modern theorists talk about people with
out organizations.
Background of the Proolem
Increased productivity and work force utilization are primary
goals of business organizations. Most of us would agree that with
out satisfactory levels of productivity profit-oriented organiza
tions could not survive. However, this premise applies to non
profit making organizations as well. Non-profit making organiza
tions are also interested in achieving greater output without a pro
portionate increase in equipment, money, or employee hours, which
can be classified as inputs.
R e p ro d u c e d with perm iss ion of th e copyright ow ner. F u r th e r reproduction prohibited without perm iss ion .
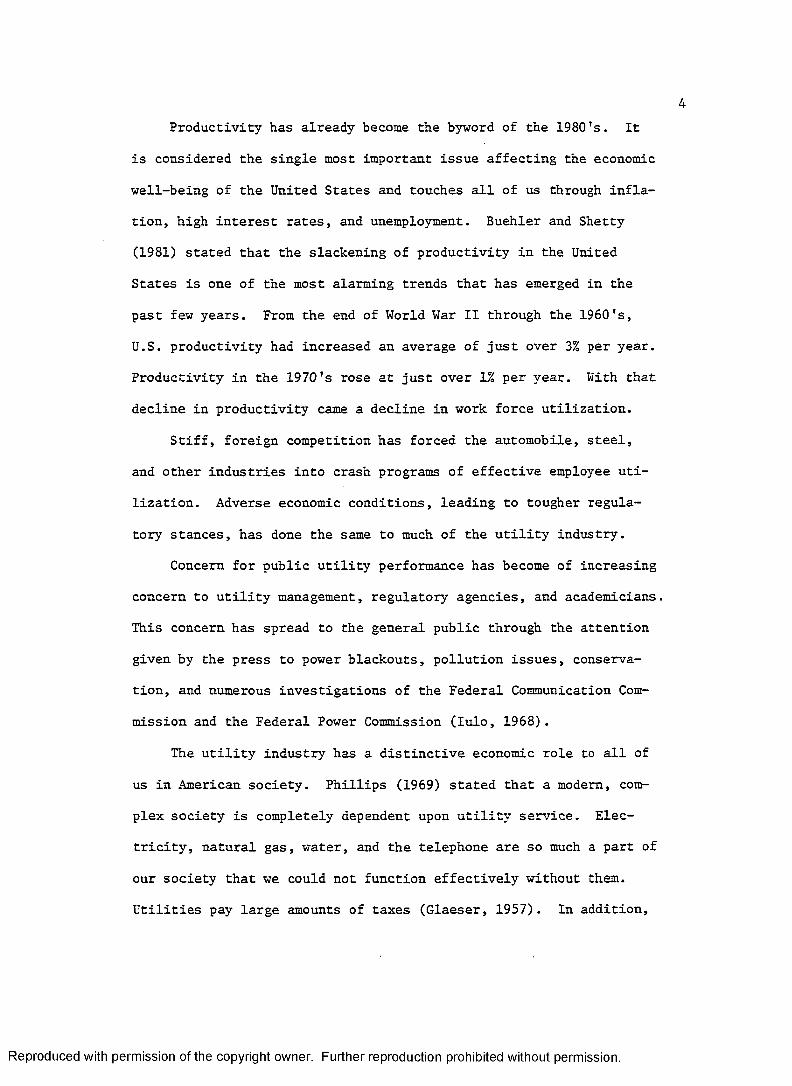
4Productivity has already become the byword of the 1980's. It
is considered the single most important issue affecting the economic
well-being of the United States and touches all of us through infla
tion, high interest rates, and unemployment. Buehler and Shetty
(1981) stated that the slackening of productivity in the United
States is one of the most alarming trends that has emerged in the
past few years. From the end of World War II through the 1960's,
U.S. productivity had increased an average of just over 3% per year.
Productivity in the 1970's rose at just over 1% per year. With that
decline in productivity came a decline in work force utilization.
Stiff, foreign competition has forced the automobile, steel,
and other industries into crash programs of effective employee uti
lization. Adverse economic conditions, leading to tougher regula
tory stances, has done the same to much of the utility industry.
Concern for public utility performance has become of increasing
concern to utility management, regulatory agencies, and academicians.
This concern has spread to the general public through the attention
given by the press to power blackouts, pollution issues, conserva
tion, and numerous investigations of the Federal Communication Com
mission and the Federal Power Commission (lulo, 1968).
The utility industry has a distinctive economic role to all of
us in American society. Phillips (1969) stated that a modem, com
plex society is completely dependent upon utility ser'/ice. Elec
tricity, natural gas, water, and the telephone are so much a part of
our society that we could not function effectively without them.
Utilities pay large amounts of taxes (Glaeser, 1957). In addition.
R e p ro d u c e d with perm iss ion of th e copyright ow ner. F u r th e r reproduction prohibited without perm iss ion .

5utilities are large users of new capital. Public utilities account
for large percentages of all new securities issued by corporations
(Garfield & Lovejoy, 1964).
The public mood as it relates to utilities is not good. Be
sides unemployment, inflation, and high interest rates, the increas
ing burden of property taxes and rising utility rates are certain to
pressure the state and federal legislators into even tougher spend
ing and regulatory policies.
It is inconceivable that the electric utility industry can con
tinue to receive favorable rate decisions, regardless of how well
justified they may be. The industry will have to clearly demon
strate that it is doing everything within its power to control costs
and improve employee utilization. Even this may not be convincing
enough. Much of the increasing costs of doing business will have to
be overcome by their own productivity efforts.
The task of providing effective productivity measures for the
utility industry has not been an easy one. The reasons for this are
the multiplicity of elements in utility performance, the problem of
weighing these elements, scarcity of data, and the problem of deter
mining the cause and effect of performance differences. Further
more, the process of assigning the credit or blame for performance
differences is difficult. Regulatory commissions, research groups,
suppliers, and the utilities themselves have historically attributed
good performance to their own influence.
One such approach to effectively measuring the performance of
utilities has been suggested by Dodge (1968). Dodge feels the
R e p ro d u c e d with p erm iss ion of th e copyright ow ner. F u r the r reproduction prohibited without perm iss ion .

industrial organization approach is an effective method of judging
performance. The industrial approach involves an inspection of the
market structure, conduct, and performance of an industry. This
approach involves the setting of standards and goals for the organi
zation and adjustments in the structure of the organization or the
conduct of the organization to meet these goals. Optimum perform
ance is the goal; structure and conduct are the means of reaching
the goal.
Coombe and Densmore (1982), Benes (1981), and Naisbitt and
Hallett (1980) have mentioned the effective use and the need for the
industrial organization approach within the electric utility indus
try.
The industrial organization approach relates to the use of work
measurement techniques. The use of the work measurement technique
of work sampling was used in this paper.
Numerous studies have been written concerning the relationship
between organizational structure and job behavior. However, little
has been written concerning the relationship between organizational
structure and employee utilization, which is the focus of this
paper.
Purpose of Study
The purpose of this study was to examine the effects that six
structural variables had upon the utilization of employees within an
electric utility in the Midwest United States. Specifically, the ob
jectives were:
R e p ro d u c e d with p e rm iss ion of th e copyright ow ner. F u r th e r reproduction prohibited without perm iss ion .

1. To investigate the relationship between the level of an
individual within an organization and work force utilization.
2. To determine whether a relationship exists between span of
control and work force utilization.
3. To determine whether a relationship exists between line
versus staff positions and work force utilization.
4. To investigate the relationship between organizational sub
unit size and work force utilization.
5. To investigate the relationship between centralized versus
decentralized organizations and work force utilization.
6. To determine whether a relationship exists between blue-
collar versus white-collar workers and work force utilization.
Definitions
Organizational Structure
Khandwalla (1977) described organizational structure as:
Structure is the more or less permanent arrangement of the parts of a whole. Organization structure is the network of durable and formally sanctioned organizational arrangements and relationships. . . . What writers on bureaucracy such as Weber call the hierarchy of authority, formal intermember communications, specialization of functions, and specification of rules and procedures are elements of organizational structure. What students of classical management theory such as Urwick call the organization chart, forms of departmentalization, and the span of control are also elements of organization structure. What administrative decision-making theorists such as Simon call performance programs are also elements of structure. In every case, however, the element of structure is a formally sanctioned relationship. It is, or intended to be, durable. And it is, or intended to be, an appropriate administrative means by which the
R e p ro d u c e d with perm iss ion of th e copyright ow ner. F u r th e r reproduction prohibited without perm iss ion .
organization goes about achieving the purposes for which it is set up. (pp. 482-483)
Ghiselli and Siegel (1972) referred to structure as:
The structure of an organization refers to the nature of the distribution of the units and positions within it, and to the nature of the relationships among those units and positions. The dimensions of structure upon which organizations can be differentiated are people (size), groups (functional divisions, line or staff), levels of management and shape (centralization-decentralization, tall vs. flat), (p. 617)
Structure, as used in this study, will refer to the relation
ships of organizational levels, span of control, line and staff,
size, and shape of the organization.
Organizational Level
Historically, most of the research into organizational level
has followed the road paved by the Hawthorne investigations which
highlighted the distinction between managers and nonmanagers and
between various levels of management (Porter & Lawler, 1965) .
Berger and Cummings (1978) referred to organizational level as "the
individual's position in the vertical hierarchy of authority and
ranges from the non-supervisory workers at the lower end of the
scale to the chief executive at the upper extreme" (p. 3).
For purposes of this paper, organizational level will refer to
an individual's position in the organization with each employee
being classified as a manager or nonmanager.
R e p ro d u c e d with perm iss ion of th e copyright ow ner. F u r th e r reproduction prohibited without perm iss ion .
Line and Staff
According to Filley, House, and Kerr (1976), line functions
refer to activities of work which contribute directly to the primary
service objective of the organization. Staff functions are support
ive functions which contribute to the efficiency and the maintenance
of the organization. For purposes of this paper, the distinction
made by L. Allen (1958) will be used to distinguish between line and
staff. Line units are defined as those which directly relate to the
major objective of the organization, and the function is located
within the direct chain of command of the organization. Staff units
are involved indirectly with the major objectives of the organiza
tion. They are concerned with performing service activities for the
line such as counseling, guidance or planning activities, recruiting
line personnel, and interpreting policy matters.
Organizational Size
Organizational size for purposes of this paper will refer to
subunits within the total organization. Porter and Lawler (1965)
referred to subunits as primary work groups, departments, and
factories. This definition fits the criteria of this paper.
Span of Control
Since the early days of organizational theory, writers have
questioned and prescribed an effective span of control. The desired
width of the span is a major determinant in the structure of an
R e p ro d u c e d with perm iss ion of th e copyright ow ner. F u r th e r reproduction prohibited without perm iss ion .

10organization. For purposes of this paper, the definition described
by Ouchi and Dowling (1974) will be used. They described span of
control as the total number of employees over whom the supervision
has some authority, responsibility, or control.
Shape of the Organization
The shape of an organization for purposes of this paper will be
defined in terms of centralization versus decentralization. Cen
tralization patterns will be based upon geographic location (Pfiffner
& Sherwood, 1960; Porter & Lawler, 1965; Smith, 1958).
A centralized department is defined as an organization located
with all supervision within one industrial complex. A decentral
ized department is one located within various geographical locations
with supervisors or managers located in all of these locations.
Work Sampling
The definition used by Karger and Bayha (1977) will be used in
this paper. They defined work sampling as:
The application of statistical sampling theory and techniques to the study of work systems in order to estimate universe parameters from sample data. It is commonly used to improve the work measurement and methods engineering area to produce statistically sound estimates of the percentages of time that a work system is in any of a variety of states of work activity. With appropriate procedures, work sampling can produce information from which time standards might be determined. Syn: ActivitySampling, Frequency Study, Ratio Delay Study, (p. 271)
R e p ro d u c e d with perm iss ion of th e copyright ow ner. F u r th e r reproduction prohibited without perm iss ion .
11Work Force Utilization Ratio
The formula used by Hansen (1960) will be used to compute the
work force utilization ratio. The formula is:
iru. Katio=
Work force utilization is defined as the percentage of time of an
8-hour day that an employee spends on productive work activities.
Productive work activities are those activities defined in an indi
vidual’s job description as contributing to a measurable or un
measurable end product of that individual's department.
Limitations
The first limitation is that the work sampling utilization
ratio should not be misinterpreted as a productivity measurement
tool. Work sampling does not measure one's output. Work sampling
only tells the observer what percentage of the time period selected
for measurement that an individual is working or not working. The
quality of the output must be determined by the supervisor, and the
quantity of output must be determined by other work measurement
tools. The advantage of work sampling is that it allows for compar
isons of dissimilar organizations and departments.
Another limitation of the study was that the population con
sisted of the members of a large corporation. The results may not
apply to individuals in small firms.
R e p ro d u c e d with p erm iss ion of th e copyright ow ner. F u r the r reproduction prohibited without perm iss ion .
12The third limitation of the study was that the effects of the
variables were not studied on a multiple or combination basis.
Summary
This study examined the relationship between work force utili
zation and organizational structure. The interest in employee uti
lization and organizational structure are entrenched in classical
American Management Theory.
With the current state of the American economy, there has been
a resurgence in the study of productivity and work force utilization
in industry, on a national and an international level. One industry
that has felt the "wrath" of the public, because of increasing size
of their bills to the public, has been the utility industry. If the
utility industry expects to receive favorable rate decisions, they
must demonstrate to the public that they are doing everything in
their power to improve productivity.
One such successful method of measuring performance in the in
dustry is the technique of work sampling which gives a work force
utilization percentage (the percentage of time of an 8-hour day an
employee spends on productive activities).
For the purposes of this study, the structural variables of
levels within an organization, span of control, line or staff posi
tions, organizational size, organizational shape, and blue-collar
versus white-collar workers were analyzed in their relationship to
work force utilization.
R e p ro d u c e d with perm iss ion of th e copyright ow ner. F u r th e r reproduction prohibited without perm iss ion .

13Report Preview
The remainder of this report will consist of four chapters.
Chapter II deals with the review of the literature concerning the
relationship between organizational structural variables and work
force utilization. The review will specifically examine the re
search evidence concerning the relationship between work force uti
lization and organizational shape, blue-collar versus white-collar
workers, organizational size, line or staff positions, span of con
trol, and number of levels within an organization.
Chapter III will discuss the methodology used during this re
search effort.. This chapter will explain how the research sample
was selected, and will explain the technique of work sampling. It
will present the variables under investigation, the method of data
collection, and will review the statistical techniques used in the
analysis.
Chapter IV will consist of a discussion of the results and a
presentation of the findings of the research effort.
Chapter V will be a summary chapter and will discuss the con
clusions and implications of the study.
R e p ro d u c e d with perm iss ion of th e copyright ow ner. F u r th e r reproduction prohibited without perm iss ion .

CHAPTER II
REVIEW OF THE LITERATURE
The investigation into the relationship between various struc
tural factors and employee utilization has produced a considerable
amount of research concerning the various effects of these variables.
Specifically, the review of literature will be concerned with the
structural variables of organizational level, line and staff, orga
nizational size, span of control, centralization versus decentrali
zation, and blue-collar versus white-collar worker.
Organizational Levels
The research which related the relationship between an employ
ee's level within the organization and his behavior has been histor
ically divided into two basic areas. In the 1940's many writers
were influenced by the Hawthorne studies, which concentrated on the
plight of the industrial worker as related to managers. The social,
physical, and psychological conditions which they had to endure, as
compared to management were highlighted. Argyris (1957), Likert
(1960), and Leavitt (1958) continued with this relationship of man
agers to nonmanagers throughout the late 1950's and early 1960's.
The second area relates to the relationship of job satisfaction of
various levels of management personnel to organizational behavior.
Pfiffner and Sherwood (1960) stated "differentiation of task between
echelons is of more significance to the selection and training of
14
R e p ro d u c e d with perm iss ion of th e copyright ow ner. F u r th e r reproduction prohibited without perm iss ion .
15leaders at the several levels than may be indicated by the attention
accorded it in the past" (p. 139).
However, there had been relatively few articles published on
behavior as relating to the various levels of management. Porter
and Lawler (1965) stated:
This- relative lack of attention to the effects of differentiation among levels of management is somewhat surprising when one considers the amount of interest that industrial psychologists and sociologists have shown in the effects of division of labor. Almost always however, division of labor has been studied as it occurs along a horizontal dimension of the rank and file worker level.(p. 25)
During the late 1950's various authors concentrated on the
hierarchy of need satisfaction (Maslow, 1954) as it relates to the
industrial organization. Argyris (1957), R. Davis (1951), Haire
(1956), Leavitt (1958), and Viteles (1953) published articles on
this relationship. These articles generally agree that organiza
tions pay the worker in physical or security need satisfaction areas,
rather than in higher order areas, such as, social, esteem, or self-
actualization. Argyris (1957) and Haire (1956) stated this situa
tion of mass production workers is often mentioned as a prime illus
tration of this need satisfaction pattern in large organizations.
Porter (1961) stated "this motivational reward system has been
thought of as especially true for nonmanagement production workers,
but little attention has been directed towards the appropriateness
of this picture for the management part of the organization" (p. 1).
Haire (1956) agreed with this in stating that most studies have
emphasized the social and egotistic need satisfactions of the hourly
R e p ro d u c e d with perm iss ion of th e copyright ow ner. F u r th e r reproduction prohibited without perm iss ion .

16paid worker. Argyris (1957) believed that these types of need satis
factions apply to all individuals with the organization. He be
lieved the higher the individual in the organization the more able
he is to satisfy his needs. Therefore, he is stating that there
exists a difference in opportunity within management to satisfy
different types of needs.
During the 1960's there was substantial research into organiza
tional behavior at the various managerial levels. Generally, the
results have been consistent with those studies comparing non-
managerial workers to their supervisors. The studies conclude that
job satisfaction increases with increasing levels of management.
Porter and Lawler (1965) stated that "recent studies, plus one
appearing prior to the Herzberg review, seem to be nearly unanimous
in concluding that job satisfaction or morale does increase monu
mentally with'increasing levels of management" (p. 2 7). The
studies which Porter and Lawler reviewed were Browne and Neitzel
(1952); Rosen (1961); Porter (1961); Porter (1962); Opinion Research
Corporation (1962); and Haire, Ghiselli, and Porter (1963).
Browne and Neitzel (1952) conducted studies to determine the
communication, supervision, and morale of three supervisory levels
of women employees in the utility industry. They concluded "morale
scores were found to be positively related to the echelon level of
the supervisors, the inner level of supervisors generally having the
highest scores" (p. 90).
Rosen (1961) conducted a study to determine whether differences
exist among three levels of management within a single plant. Rosen
R e p ro d u c e d with perm iss ion of th e copyright ow ner. F u r th e r reproduction prohibited without perm iss ion .
17used four desirable conditions of work which were originally men
tioned by Rosen and Weaver (1960). The areas were:
1. Relations with superiors.
2. Relations with the company.
3. Relations with peers.
4. Decision making and implementation.
They concluded that "there was some evidence suggesting that
richness of the job environment in terms of desirable conditions of
work was related positively to increased status in the hierarchy"
(p. 160).
Porter (1961) studied two levels of management, first line
supervisors and lower middle management, within three companies.
Porter concluded:
Lower level management positions were more likely to produce deficiencies in fulfillment of psychological needs than were middle level positions. This suggests that there exists a differential opportunity within management to satisfy various motivational needs, (p. 8)
Porter (1962) sampled over 1,000 managers from various com
panies . Porter employed a questionnaire using Maslow type cate
gories to determine how managers in business and industry feel about
their jobs. The results were generally in agreement with the Rosen
(1961) study. Porter (1961) concluded that the most satisfied man
agers cluster at the highest management levels, and that satisfac
tion tends to decrease at each successive lower level of management.
Haire et al. (1963), through the study of managerial levels in
over 14 countries, concluded that job satisfaction is related to the
managerial level.
R e p ro d u c e d with perm iss ion of th e copyright ow ner. F u r th e r reproduction prohibited without perm iss ion .

18Since 1965 numerous studies have been conducted which related
organizational behavior to the organizational level. During the
late 1960's various studies were conducted which related job satis
faction to performance. Katz and Kahn (1966) stated in relating job
involvement to satisfaction, that job involvement is a necessary
condition if an individual is to fully accept the organizational
demands placed upon him. They stated that the degree of job involve
ment is related to the level of aspiration and to the degree of
internalization of organizational goals is often related to your
level within the organization, which leads to more job satisfaction.
Bass (1965) viewed job involvement as representative of the ego of
the employee within his job and thus related it to performance.
Bass (1965) stated that the following conditions lead to the
strengthening of job involvement : opportunity to make more job-
related decisions, the feeling that one is significantly contribut
ing to the company, recognition, achievement, self-determination,
and the freedom to set one's own work pace. All of these variables
are related to one's level within the organization.
Lawler and Porter (1967) concluded that there exists a rela
tionship between an employee's belief about the probability that
rewards depend upon their job behavior, and their actual job per
formance. The more managers believe that rewards such as pay, pro
motions, and respect stem from good performance, the more likely
they will be rated as good performers. Georgopoulos, Mahoney, and
Jones (1957); Galbraith and Cummings (1967); and Porter and Lawler
(1968) have reported similar findings. The variables such as pay.
R e p ro d u c e d with perm iss ion of th e copyright ow ner. F u r th e r reproduction prohibited without perm iss ion .
19promotions, and respect will vary according to one's level within
the organization.
Miller (1966) conducted a study which examined the behavior of
a randomly selected group of 171 national union officials. The re
searcher concluded that the higher level union officials were more
satisfied than the lower level officials. However, when the data
were further segmented by craft versus industrial unions, the data
from the industrial unions only barely supported the findings. This
study was significant because previous studies lumped all the re
spondents together into one population and assumed the overall re
sults were applicable to all the subgroups within the population.
Porter and Mitchell (1967) studied 1,297 noncommissioned and
commissioned officers of the United States Air Force. The results
indicated that within the two groups, satisfaction increased as the
rank increased. Johnson and Marcrum (1968) reported similar results
in a study involving 504 officers in the United States Army.
Rhinehart, Barrell, DeWolfe, Griffin, and Spaner (1969) con
ducted a study of 2,026 managers in the veterans administration.
They concluded that "Managers from government, and managers from
business both show positive relationships between vertical locations
in the management hierarchy and need satisfaction, with satisfaction
decreasing as the management scale is decreasing" (p. 233).
Herman and Hulin (1973) attempted to reproduce much of the
earlier research dealing with job satisfaction and organizational
levels. In the study consisting of four levels of supervisors in a
manufacturing plant, the authors received mixed results. This led
R e p ro d u c e d with perm iss ion of th e copyright ow ner. F u r th e r reproduction prohibited without perm iss ion .
20the authors to cast doubt on previous studies which had been con
ducted in this area.
Hamner and Tosi (1974) concluded that the ambiguity of one's
role in an organization is related to job satisfaction and organiza
tional level. They referred to this as role conflict. They stated
that at the higher management positions, this problem may not arise
so much from conflicting demands, but from a lack of job clarity and
ill defined expectations. At the lower managerial levels the jobs
are usually well defined.
Szilagyi, Sims, and Keller (1976) conducted a study of 931 hos
pital employees in five occupational levels, and another study of
174 employees in three occupational levels. They concluded that
one's occupational level was positively correlated with one's job
satisfaction.
The conclusions drawn from the research concerning one's level
within the organization and job satisfaction are not clear. While
most of the research indicated that a positive relation exists be
tween job satisfaction and organizational level, there were numerous
studies that disagreed with this conclusion. These inconsistencies
would indicate that future research is necessary.
Line Versus Staff
Browne and Golembiewski (1974) stated that "perhaps no area in
organization theory stands more in need of clarification than the
line-staff concept" (p. 406). Many writers are ready to abandon the
concept, and others have invented new but similar terms of their
R e p ro d u c e d with perm iss ion of th e copyright ow ner. F u r th e r reproduction prohibited without perm iss ion .

21own. Koontz and O'Donnell (1968) concluded, "There probably is no
area of management which in practice causes more difficulty, more
friction and more loss of time and effectiveness" (p. 29).
One of the earliest studies to compare the attitudes of line
and staff personnel was conducted by Dalton (1950). Dalton defined
the staff organization as the functions which were research and ad
visory, and the line organization as the function which has exclu
sive authority over the production processes. Dalton noted distinct
differences in the personalities between the two groups. He noted
that staff members were generally younger and came from a different
social background than the line personnel. Staff personnel were
better educated and had different educational preferences. Dalton
discovered the turnover rate of staff managers to be two to four
times that of the line managers.
K. Davis (1953) conducted a study concerning the communication
patterns between line and staff personnel. K. Davis concluded that
staff managers were better informed than the line managers. K. Davis
attributed this to the greater mobility on the part of the staff
managers. K. Davis (1953) stated:
Staff executives in such areas as personnel and control found that their duties both required and allowed them to walk through other departments without someone wondering whether they were "not working" to get away forcoffee, and so on— all of which meant they heard morenews from the other executives they talked with. (p. 47)
Burns (1954), in his study in a British engineering firm, agreed
with the idea of greater flexibility in communication for the man
agers in the staff positions.
R e p ro d u c e d with p erm iss ion of th e copyright ow ner. F u r the r reproduction prohibited without perm iss ion .
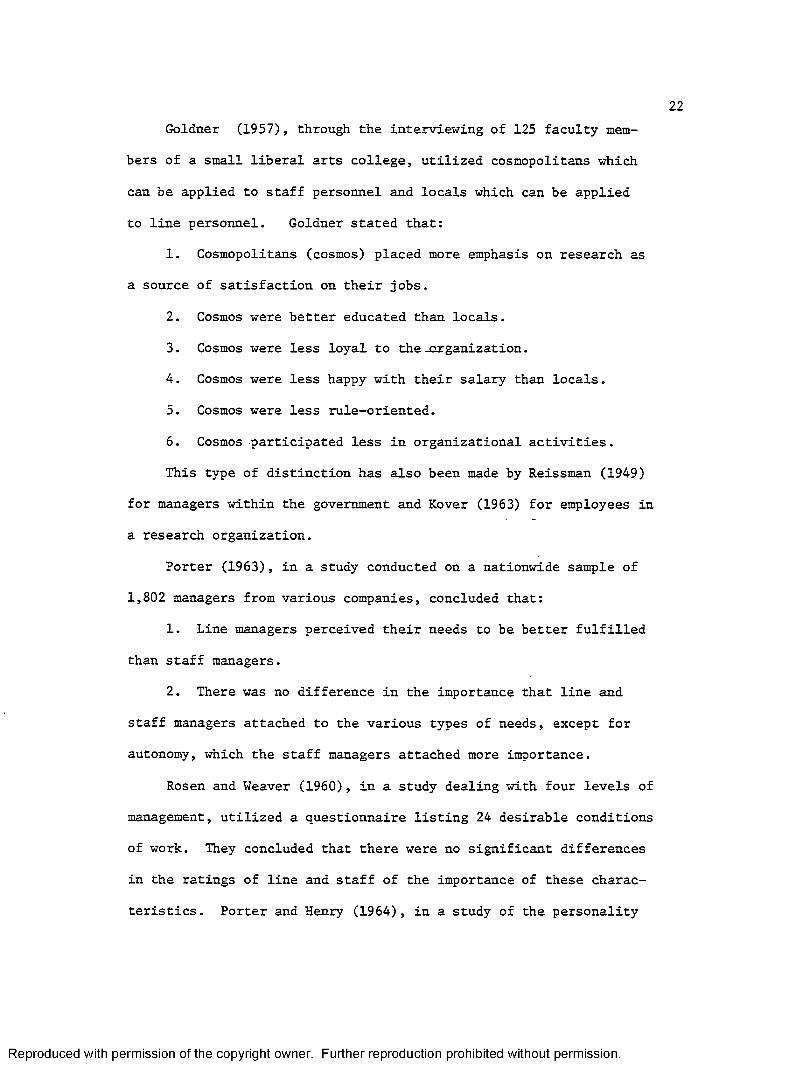
22Goldner (1957), through the interviewing of 125 faculty mem
bers of a small liberal arts college, utilized cosmopolitans which
can be applied to staff personnel and locals which can be applied
to line personnel. Goldner stated that:
1. Cosmopolitans (cosmos) placed more emphasis on research as
a source of satisfaction on their jobs.
2. Cosmos were better educated than locals.
3. Cosmos were less loyal to the-organization.
4. Cosmos were less happy with their salary than locals.
5. Cosmos were less rule-oriented.
6. Cosmos participated less in organizational activities.
This type of distinction has also been made by Reissman (1949)
for managers within the government and Kover (1963) for employees in
a research organization.
Porter (1963), in a study conducted on a nationwide sample of
1,802 managers from various companies, concluded that:
1. Line managers perceived their needs to be better fulfilled
than staff managers.
2. There was no difference in the importance that line and
staff managers attached to the various types of needs, except for
autonomy, which the staff managers attached more importance.
Rosen and Weaver (1960), in a study dealing with four levels of
management, utilized a questionnaire listing 24 desirable conditions
of work. They concluded that there were no significant differences
in the ratings of line and staff of the importance of these charac
teristics. Porter and Henry (1964), in a study of the personality
R e p ro d u c e d with perm iss ion of th e copyright ow ner. F u r th e r reproduction prohibited without perm iss ion .
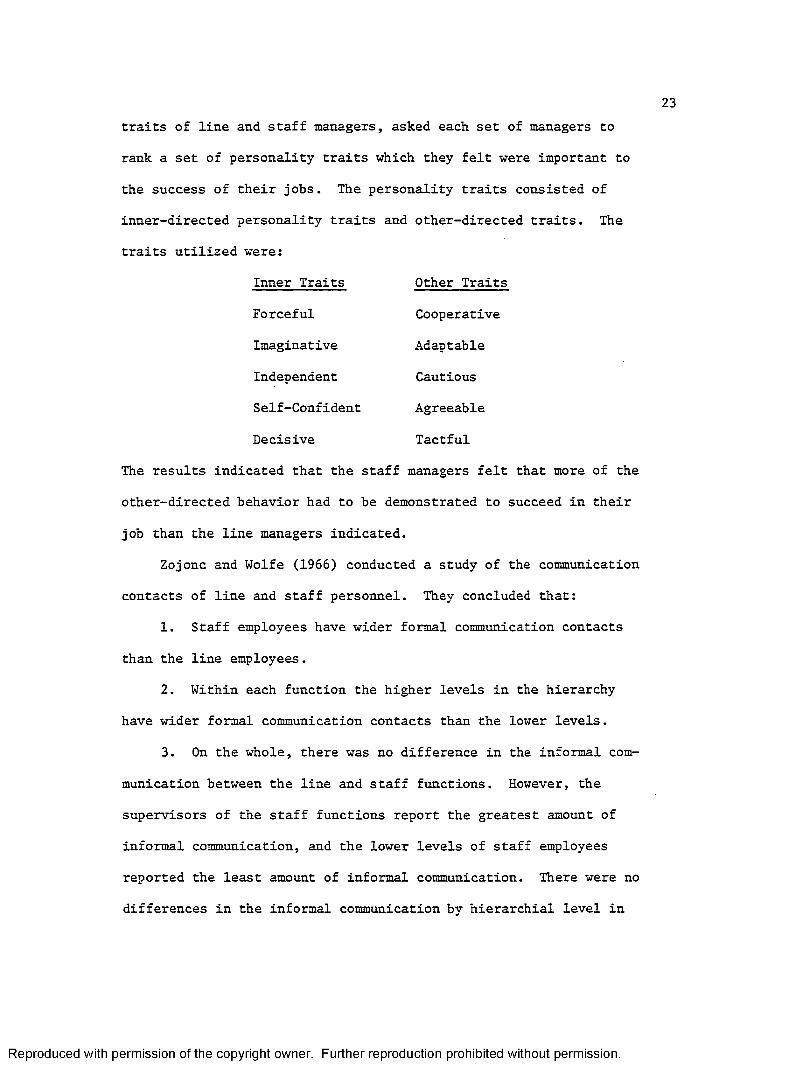
23traits of line and staff managers, asked each set of managers to
rank a set of personality traits which they felt were important to
the success of their jobs. The personality traits consisted of
inner-directed personality traits and other-directed traits. The
traits utilized were:
Inner Traits Other Traits
Forceful Cooperative
Imaginative Adaptable
Independent Cautious
Self-Confident Agreeable
Decisive Tactful
The results indicated that the staff managers felt that more of the
other-directed behavior had to be demonstrated to succeed in their
job than the line managers indicated.
Zojonc and Wolfe (1966) conducted a study of the communication
contacts of line and staff personnel. They concluded that:
1. Staff employees have wider formal communication contacts
than the line employees.
2. Within each function the higher levels in the hierarchy
have wider formal communication contacts than the lower levels.
3. On the whole, there was no difference in the informal com
munication between the line and staff functions. However, the
supervisors of the staff functions report the greatest amount of
informal communication, and the lower levels of staff employees
reported the least amount of informal communication. There were no
differences in the informal communication by hierarchial level in
R e p ro d u c e d with perm iss ion of th e copyright ow ner. F u r th e r reproduction prohibited without perm iss ion .

24the line employees.
4. Staff organizations demonstrated more complex, more differ
entiated, less segmented, and more highly organized structures than
line employees.
5. Staff employees seemed to identify with the company more
than the line employees. Among the line employees, the supervisors
showed the greatest amount of identification; among staff employees
the lowest levels showed the greatest identification.
BelasCO and Alutto (1969) disagreed with many of the previous
studies. They stated "It has been implicitly assumed that the roots
of such controversies lie in discrepancies between the perceptions
or expectations held by staff role performers and relevant manage
rial (line) role definers" (p. 2). Belasco and Alutto stated that
there have been few empirical studies which have explored and proved
the differences of perceptions between line and staff members.
Browne and Golembiewski (1974) conducted a study to investigate
the interunit perceptions which exist in the line and staff subunits.
The members of operating units perceived their units to be important,
powerful, and having outward orientations and producing positive
feelings. The members of the staff units perceived their own orga
nizations as being unimportant, impotent, and producing positive
feelings.
Concurrent with the studies on the conflict between the line
and staff personnel have been attempts to relive the differences in
the satisfaction between the two groups. The concept is that of the
dual ladder. Goldner and Ritti (1967) referred to the dual ladder
R e p ro d u c e d with perm iss ion of th e copyright ow ner. F u r th e r reproduction prohibited without perm iss ion .
25concept as:
The side by side existence of the usual ladder of hierarchial position leading to authority over greater and greater numbers of employees (line personnel) and another ladder consisting of titles carrying successive higher salaries, higher status, and sometimes greater autonomy or more responsible assignments (staff personnel).(p. 491)
Schonner and Harrell (1965) stated that "the dual ladder has failed
in its aim of conferring equal prestige and equal compensation for
managers and technical personnel, at least in the eyes of the two
groups concerned" (p. 57). Ritti (1971) stated that instead of per
mitting the staff to maintain their commitment to the organization,
it actually serves to formalize the powerlessness of the staff per
sonnel. Schriescheim, Von Glinow, & Kerr (1975) mentioned the fol
lowing problems with the dual ladder:
1. Lack of equity between the two ladders.
2. Lack of power. The staff members are removed from the
sources of managerial responsibilities which would interfere with
their technical and professional responsibilities.
3. The professional ladder is often viewed as a face-saving
device for individual failure.
4. There is not an adequate number of staff positions.
5. The evaluative criteria of staff personnel are not always
equitable; line personnel are often used to evaluate line personnel.
While most of the data indicate that there is a difference in
the behavior of line and staff personnel, the inconsistencies indi
cated that future research is needed.
R e p ro d u c e d with perm iss ion of th e copyright ow ner. F u r th e r reproduction prohibited without perm iss ion .

26Organizational Subunit Size
Porter and Lawler (1965) defined subunit as "any grouping of
the members of a business organization that systematically excludes
part of the membership of that organization" (p. 34). They stated
that work groups, departments, and factories have been studied fre
quently as organizational subunits. Previous studies have indicated
that the relationship between subunit size within organizations and
job attitudes and performance have concluded that small subunits
perform better in all of these areas. Porter and Lawler (1965) cite
Strauss and Sayles (1960), and Viteles (1953).
One of the first writers who commented on the effects of orga
nizational size on the behavior of its members was Simmel (1902).
Simmel stated that as group size increases, certain structural
effects are imposed on that group.
One of the first questions which was related to organizational
size was its relation to productivity. Marriott (1949), in a study
of two automobile factories, found in a study ranging from very
small groups to large groups of 200 individuals, that "low but sig
nificant correlations were obtained which demonstrate an inverse
relationship between output and size, the small sized groups showing
consistently larger output in each factory" (p. 56). However, all
of the studies in this area have not proved to be consistent in
their results. South (1927), previously to the Marriott study, con
cluded that the effect of size upon productivity was situational.
He concluded that smaller groups were faster than larger groups in
R e p ro d u c e d with perm iss ion of th e copyright ow ner. F u r th e r reproduction prohibited without perm iss ion .

27solving concrete problems and slower in solving abstract problems.
Benge (1944), in a study which utilized a sample taken from various
companies and included rank and file workers, concluded that the
attitude of employees toward their boss was significantly better in
smaller organizations rather than large organizations. Kelley and
Thibaut (1954) reported that the effects of size is situational.
Herbst (1957) and Revans (1958) reported on a curvilinear rela
tionship between unit size and output. Herbst (1957), in a study
concerning the output of various retail shops, concluded that middle
size units performed the best. Revans (1958), in a study relating
performance to coal outputs, concluded that the output of coal per
man year reaches a maximum in the size range of 1,500-2,000 men and
then it begins to decline. Revans also concluded in a study of
retail shops similar to the Herbst study that sales rates reach a
maximum in medium size units and then they began to decline.
Balderston, Brecht, Karabasz, and Riddle (1949) related size
and the scale of production to the scale of administration. They de
fined the scale administration as the number of people to be coordi
nated into the system. Balderston et al. (1949) related this con
cept to industrial plants. In industrial plants the scale of admin
istration is usually small and the scale of production is large;
therefore, any determination of effective organizational size should
be considered in respect to this relationship.
Argyle, Gardner, and Cioffi (1958) stated that larger groups
have higher productivity rates than smaller groups. Indik and
Seashore (1951), in a study between automobile dealers, found no
R e p ro d u c e d with perm iss ion of th e copyright ow ner. F u r th e r reproduction prohibited without perm iss ion .
28significant relationships between size and performance.
In addition to levels of productivity, there are other factors
which influence employee utilization. One of those factors is that
of absenteeism which has been related to subunit size. One of the
first studies which concentrated on the relationship between size
and absence rates was a study by the Action Society Trust (1953).
They reported a correlation of .45 between the size of the factory
within a given company and absence rates. Revans (1958) quoted the
Annual Report of the Chief Inspector of Factories, and stated that
in British industry the compensable accident rate rose steadily as
the size of factories increased. Revans (1958) reported in a study
of five randomly chosen gas works ranging in size from 67 to 3,430
that the correlation between the size of the plant and the average
duration of absences was .91. Revans reported a .62 correlation be
tween absence rates due to sickness and unit size. Baumgartel and
Sobol (1959) conducted a study of work locations in the airline
industry and found a correlation between absenteeism and work loca
tion. These findings have been agreed upon by Hewitt and Parfitt
(1953) and Indik and Seashore (1961)-,- who have stated that larger
departments of a company have higher absenteeism rates than smaller
departments. All studies have not agreed with the results.
Meltzer and Mann (1953), in a study of the absence rates of white-
collar workers, did not find a significant relationship between
absenteeism and subunit size. Argyle et al. (1958) found a curvi
linear relationship between absenteeism and subunit size, with the
lowest absence rates in the middle size groups.
R e p ro d u c e d with perm iss ion of th e copyright ow ner. F u r th e r reproduction prohibited without perm iss ion .
29Other studies in the area of subunit size which relate to em
ployee utilization have been studied. Revans (1958), reporting on
data collected in the British coal mines, relating unit size to
strikes and the severity of the strikes. Revans stated that the
tonnage lost per man increases as the size of organization in
creases. Worthy (1950) related this to employee morale. He stated
that the size of the unit is related to the morale level of the
unit, with the morale level in the smaller units being higher. Katz
(1949) agreed with this idea that employees of smaller units are
more satisfied than employees of large work units. Kerr,
Koppelmeier, and Sullivan (1951), in a study of 894 workers in 29
departments in two electronic plants, related organizational subunit
size to employee satisfaction. They discovered an inverse relation
ship between size and job satisfaction. H. Campbell (1952) related
organizational size to incentive pay plans and job satisfaction. He
concluded that workers in the smaller groups felt they had a better
knowledge of how their pay plan worked which increased their satis
faction. Worthy (1950) stated "Our researches demonstrate that mere
size is unquestionably one of the most important factors in deter
mining the quality of employee relationships : the smaller the unit
the higher the morale and vice versa" (pp. 172-173). Indik and
Seashore (1961), in a study in the automobile industry, Indik (1965),
and Thomas and Fink (1969) have also indicated that subordinate
satisfaction decreases with unit size.
All studies have not agreed with the relationship between orga
nizational size and job satisfaction. Meltzer and Salter (1962)
R e p ro d u c e d with perm iss ion of th e copyright ow ner. F u r th e r reproduction prohibited without perm iss ion .

30reported on questionnaires which were completed by 75% of all the
physiological scientists working within the United States. They
concluded that "there is no relationship between size and productiv
ity and curvilinear relationship between size and satisfaction"
(p. 360). Brayfield and Crockett (1955) suggested that dissatisfac
tion on the part of employees leads to high turnover and absenteeism.
In addition to studies on organizational subunit size, there
have been studies conducted on total organizational size which have
some relevance to explaining the relationship between organizational
size and employee utilization. Porter and Lawler (1965) conducted a
review on two studies which dealt with total organizational size and
employee attitudes. The first study mentioned was by Benge (1944).
His findings were based on the study of rank and file workers. He
concluded that the morale in smaller companies is better than the
morale in larger companies. Porter and Lawler (1965) stated that
"those results are extremely difficult to evaluate, however since
neither the number or type of respondents nor the number of com
panies on which the results were based was specified in the
article" (p. 41). Another study mentioned by Porter and Lawler is
a study conducted by Tallacchi (1960) which was concerned with the
relationship between individual attitudes and behavior. Tallacchi's
study was described as consisting of 93 organizations; however, in
vestigation determined that 45 of these organizations were actually
plants that comprised parts of only 5 different companies. Despite
this mixing of organizations and subunits, there seems to be suffi
cient evidence to support Tallacchi's conclusion that a negative
R e p ro d u c e d with p erm iss ion of th e copyright ow ner. F u r the r reproduction prohibited without perm iss ion .

31correlation exists between employee satisfaction and organizational
size at the rank and file level.
Strawser, Ivancevich, and Lyon (1969) conducted a study concern
ing the job satisfaction of 269 accountants in large and small CPA
firms. They concluded "in each case where statistically significant
differences were found, accountants in small firms reported less
perceived need satisfaction than CPA's employed by large firms"
(pp. 342-343).
All the studies have not agreed with the previous results.
Ingham (1970) concluded on data collected concerning employee satis
faction that there was no significant difference in the satisfaction
of employees within large and small organizations. Cummings and
El Salmi (1970) agreed with this conclusion in their survey of 456
managers. They concluded that company size was not related to the
managers' job satisfaction.
There have been two studies which disagree with the previous
points of view on overall organizational size. Parr (1973), in a
study dealing with the agribusiness, found an inverse relationship
between size and job satisfaction. These findings were agreed upon
by Osborn and Hunt (1975) in the study of an undergraduate business
fraternity, where they found that size was positively related to
satisfaction with work.
Based upon the information collected concerning the relation
ship between unit size and job satisfaction, several conclusions can
be drawn. It can be concluded that there is a direct relationship
between satisfaction and unit size, or it can be concluded that
R e p ro d u c e d with perm iss ion of th e copyright ow ner. F u r th e r reproduction prohibited without perm iss ion .

32there is a negative relationship, or it can be concluded that no
relationship exists. From the inconsistencies of the data, it is
indicated that further research is needed.
Span of Control
Span of control is defined as the number of subordinates who
directly report to a supervisor. Pfiffner and Sherwood (1960)
stated:
Much blood has been let to reduce to executives' span with inconsequential results to administrative performance. Yet span of control sails merrily on. There is much written about it. Most consultants tab this as an essential in reform proposals. Students sweat over its definition, mainly because they assume the concept should be more complicated than it really is. Thus, regardless of what its merits may be, span of control is so entrenched in the administration culture that it must be accorded a nrominent place in any book on organization.(pp. 155-156)
Traditional Viewpoint
Entwisle and Walton (1961) stated that the idea of span of con
trol is an ancient theory of management, dating as far back as there
are records; military organizations have utilized this concept.
Originally theories concerning span of control were based upon
casual observation and the deductive reasoning of these observa
tions. Entwisle and Walton (1961) and Urwick (1974) mentioned that
General Sir Ian Hamilton in a book entitled the Soul and Body of an
Arm in 1921 is credited with bringing attention to the principle of
span of control. Urwick (1974) presented Hamilton's principles as:
R e p ro d u c e d with perm iss ion of th e copyright ow ner. F u r th e r reproduction prohibited without perm iss ion .

33Any military reorganization should conform to certain set princi
ples: (a) power must go with responsibility; (b) the average human
brain finds its effective scope in handling from three to six other
brains.
Henri Fayol, who Filipetti (1932) mentioned as one of the major
contributors to the field of management and administration, had a
theory concerning span of control. Fayol (1977) stated that regard
less of his rank, an ideal span of control is a number less than
six, except for a foreman who is dealing with a simple operation and
is dealing with 20-30 individuals.
The classical writers do not confine their concepts of span of
control to the same number of levels. For example, Urwick (1956)
stated that the ideal span of control for top management is four,
but that at supervisory levels the number may range from eight to
12. Urwick emphasized that this principle applies only to subordi
nates doing work which is interrelated; therefore, the degree of
interrelationships must be taken into account. Urwick stated that
if the work of two units is so close that what one of the units does
directly affects the results achieved by the other, there must be
a constant coordination of their activities by the supervisor. On
the other hand, if the relationship between the two is only inter
mittent, the supervisor only needs to give it his or her occasional
attention.
Urwick (1974) demonstrated the theory of Graicunas who demon
strated mathematically that increases in the number of subordinates
which report directly to a manager are accompanied by geometric
R e p ro d u c e d with perm iss ion of th e copyright ow ner. F u r th e r reproduction prohibited without perm iss ion .
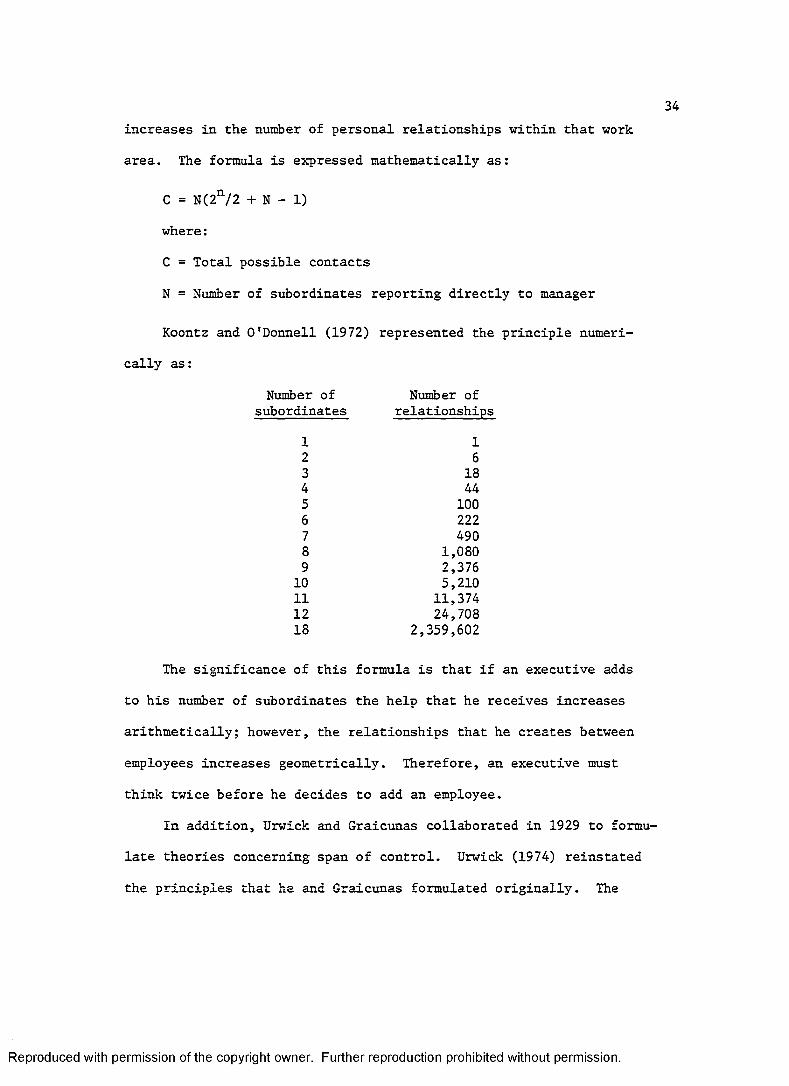
34increases in the number of personal relationships within that work
area. The formula is expressed mathematically as:
C = N(2^/2 + N - 1)
where:
C = Total possible contacts
N = Number of subordinates reporting directly to manager
Koontz and O'Donnell (1972) represented the principle numeri
cally as:
Number of Number ofsubordinates relationships
1 12 63 184 445 1006 2227 4908 1,0809 2,37610 5,21011 11,37412 24,70818 2,359,602
The significance of this formula is that if an executive adds
to his number of subordinates the help that he receives increases
arithmetically; however, the relationships that he creates between
employees increases geometrically. Therefore, an executive must
think twice before he decides to add an employee.
In addition, Urwick and Graicunas collaborated in 1929 to formu
late theories concerning span of control. Urwick (1974) reinstated
the principles that he and Graicunas formulated originally. The
R e p ro d u c e d with perm iss ion of th e copyright ow ner. F u r th e r reproduction prohibited without perm iss ion .
35principle was "no executive should attempt to supervise directly the
work of more than five, or at the most six, direct subordinates
whose work interlocks" (p. 351). Urwick (1938) stated that this
principle has been criticized and misunderstood numerous times.
Urwick (1938) stated that the principle was not meant to apply at
the lower levels of supervision where the work of subordinates is
not interrelated.
Bossard (1945) calculated that with each additional employee,
the number of interpersonal relationships increase exponentially, as
given in the formula X = (N̂ - N)/2. Gillmore (1948) stated that
"it is generally agreed that if the functions that are to be coordi
nated are interdependent and dissimilar, the span of control should
not exceed five" (p. 12).
In general, these classical theorists have assumed that a small
span of control is the ideal situation for most organizations. Most
of the classical theorists recommend spans of control between three
and six.
Current Research
One of the first theorists to disagree with the classical
theorists' approach was Worthy (1950). Worthy, in his studies at
Sears, Roebuck and Company concerning organizational structure,
stated:
Over complexity of organizational structure is one of the most important and fundamental causes of poor management employee relationships in our modern economic system, and that until this problem is found and corrected, no
R e p ro d u c e d with perm iss ion of th e copyright ow ner. F u r th e r reproduction prohibited without perm iss ion .
36substantial improvement in these relationships is possible. (p. 174)
Furthermore, Worthy suggested that a large span of control is good
since it provides for better communication on the part of the em
ployees and better initiative and room for growth. This view has
not been shared by all researchers, which has caused a controversy
concerning this management principle.
Dale (1952), in a survey which he conducted for the American
Management Association, recommended an ideal span of control as
being between three to six. However, he stated that the number of
subordinates in successful companies often exceeds the optimum spans
suggested by classical theorists.
Suojanen (1955) stated that the idea of there being an optimum
or "correct" span of control is meaningless and that this principle
has become a management fable.
R. Davis (1951) distinguished between two types of spans of
control. The first type was the executive span of control which
applied to the middle and upper organizational levels. He stated
that this executive span should be between three and nine, depending
on the type of work the company performs and their rate of growth.
The second type of span of control which he identified is the opera
tive span of control which applies to the lower organizational
levels. For these levels, R. Davis suggests an acceptable span of
control as high as 29-30 subordinates.
Urwick (1956) defended his classical position which was refuted
by Dale (1952). Urwick pointed out that Dale's measure included all
R e p ro d u c e d with perm iss ion of th e copyright ow ner. F u r th e r reproduction prohibited without perm iss ion .

37the subordinates that had access to the supervisor, not just those
reporting directly to the supervisor in the chain of command.
Urwick felt this was an invalid measure of determining the responsi
bility of immediate supervision.
Porter and Lawler (1965) mentioned that most of the research
that had been performed up until that time was concerned with deter
mining variables that were related to the size of the span of con
trol in existing organizations. Pfiffner and Sherwood (1960) stated
that there had been relatively little empirical research on the
study of span of control.
Woodward (1958) conducted a study of 100 industrial firms in
southern England, and discovered a relationship between the size of
the span of control of first line supervisors and company perform
ance. The pattern of span of control was compared to various mea
sures such as profit figures. The companies were divided into three
groups based upon the type of manufacturing technologies. The three
categories were: (1) job order, (2) mass production, and (3) con
tinuous processing. The findings revealed that successful firms in
the job order and continuous processing areas tended to have wider
spans of control. Successful firms in the mass production area were
found to have narrow spans. These findings suggest that there is no
one ideal approach to determining a proper span of control size;
certain types of technologies perform better with certain structures.
Woodward's study did point out that large spans of control can pro
duce high performance.
R e p ro d u c e d with perm iss ion of th e copyright ow ner. F u r th e r reproduction prohibited without perm iss ion .
38Entwisle and Walton (1961) presented data concerning span of
control compiled from a study of colleges and universities. They
stated spans of control were related to the size of the organiza
tion. Entwisle and Walton stated "sheer size rather than functional
orientation may be the predominant function in determining the size
of the span" (p. 528). They stated that span of control was based
upon:
Span of attention— a person is psychologically incapable of
attending to more than seven items at once.
Group combinations— the larger the span the more possibilities
there are for forming subgroups.
Cliques— as span increases, more and more possibilities in
crease for splinter groups based upon mutual attraction.
During the 1960’s, the Lockheed Missile and Space Company
(Stieglitz, 1962) successfully applied the classical theory in estab
lishing their managerial spans. In an attempt to quantify factors
which influence the span of control, Stieglitz defined seven factors
which he considered to affect optimal span of control. The factors
were: (1) similarity of function, (2) geographic proximity, (3)
complexity of functions, (4) direction and control, (5) coordination,
(6) planning, and (7) organizational assistance.
Each of these factors was weighted to reflect degrees of super
visory burden. The index was used to assist in planning and organi
zational design of the Lockheed units. These studies resulted in
reductions in managerial personnel on the supervisory payroll.
R e p ro d u c e d with perm iss ion of th e copyright ow ner. F u r th e r reproduction prohibited without perm iss ion .

39Udell (1967) expanded on the research conducted at Lockheed.
In a study conducted on executives of 67 Illinois and Wisconsin
manufacturing companies, he attempted to determine whether the vari
ables utilized at Lockheed applied to these executives. Udell con
cluded that span of control increases with the amount of supervision
received by others in the organization. This was consistent with
classical theory. Additionally, he concluded that professional
employee standards make it possible for supervisors to maintain a
large span of control. Finally, he concluded that geographical
separation of subordinates will result in smaller spans because of
the difficulty and time consumed in supervision.
Research was carried out in the 1960's which related effective
spans of control with competence of the employees and the complexity
of the job. Blau (1968) conducted a study of 254 finance depart
ments of state and local governments. Blau stated "the span of con
trol of first line supervisors is on the average somewhat narrow if
the staff has superior qualifications than if it doesn't" (p. 460).
In addition, Blau stated that expert training makes a man more inde
pendent in performing his duties and the individual becomes more
aware of the broad aspects of his job and he is able to detect oper
ating problems and solve them. This view is shared by Meyers (1968)
and Bell (1967). Bell (1967), in interviews conducted with super
visors and managers in a community hospital, suggested that when
subordinates have highly complex jobs, their span of control is de
creased. Additionally, the more complex a superior's job, the lower
his span of control.
R e p ro d u c e d with perm iss ion of th e copyright ow ner. F u r th e r reproduction prohibited without perm iss ion .

40House and Miner (1969) conducted studies concerning the size of
effective spans of control relating to industry. They concluded
that the size of effective span of control is dependent on an orga
nization's technology. Furthermore, they concluded that when deter
mining an effective span of control, one must consider such factors
as the demands of the task, desirability of group cohesiveness, the
members' needs for satisfaction, and the leadership skills available
in the organization.
Ouchi and Dowling (1974) pointed out a problem associated with
defining span of control. They stated that the term span of control
is usually regarded as a measure of the limits of hierarchial author
ity exercised by a single manager. That interpretation is appropri
ate for some research questions but not for others.
There were so many conclusions drawn by the various authors in
the research concerning span of control that it is reasonable to ex
pect that there is no one ideal span of control for all organiza
tions. Future research can only add to the understanding of this
facet of organizational structure.
Centralization Versus Decentralization
Pfiffner and Sherwood (1960) stated that the trend in large
scale organizations is toward decentralization; however, decentrali
zation has several meanings. It can be viewed in terms of decision
making or geographical dispersion.
Fayol (1977), in his general principles of management, in re
lating to centralization or decentralization, stated:
R e p ro d u c e d with perm iss ion of th e copyright ow ner. F u r th e r reproduction prohibited without perm iss ion .

41Like division of work, centralization belongs to the national order, this turns on the fact that in every organism, animal or social, sensations converge towards the brain or directive part and from the brain or directive part orders are sent out which set all parts of the organism in movement, (p. 114)
Fayol stated that the question of centralization or decentralization
is a question of proportion, it is just a matter of finding the
optimum degree for the particular organization.
The individual who is credited with the transformation of
American industry to the concept of decentralization in the 1920’s
was Alfred P. Sloan, Jr., of General Motors. Sloan (1964) felt the
greatest purpose of decentralization was to attain a greater measure
of control. Sloan stated that without control from the central
offices, the divisions would get out of hand and fail to follow the
procedures set by corporation management. Some of the advantages
are the economies of specialization and the need upon all levels of
management to sell their ideas rather than simply giving orders.
Most of the early research into centralization versus decentral
ization was conducted after World War II. Three of the most signif
icant research findings in this area were conducted in the form of
case studies (e.g., Drucker, 1946; Givens, 1949; and Selznick, 1949).
Drucker (1946) conducted an 18-month study of the General Motors
Corporation from the standpoint of an outside consultant to report
on its managerial policies and organization. Drucker concluded that
a decentralized organization is not always the best type to have.
He stated "decentralization while applicable in most situations, is
not universally valid as the most efficient form of industrial
R e p ro d u c e d with perm iss ion of th e copyright ow ner. F u r th e r reproduction prohibited without perm iss ion .
42organization" (p. 121). Drucker concluded:
Fisher body is a conspicuously efficient producer. Its efficiency and performance account in large part for General Motors’ rise to first place in the automobile business. While the internal figures of the corporation are available, there is little doubt that the rate of return on which Fisher operates compares favorably with that of decentralized divisions. What advantage in efficiency could Fisher derive from being decentralized?What disadvantage is entailed in its centralization?(p. 121)
Selznick (1949) conducted a study of the Tennessee Valley
Authority. He commented on the advantages of having decentralized
federal agencies. Selznick stated "an excessive centralized govern
ment is inherently disqualified at least in the United States, from
fully promoting the welfare of its citizens" (p. 24). He stated
that the Tennessee Valley Authority served as an example of the de
centralization of federal functions and was the boldest and most
far-reaching effort of his time to decentralize the administration
of federal functions. Selznick mentioned three essential goals of
this decentralized federal agency.
1. The responsible agency must be permitted the freedom to
make some of its own significant decisions.
2. The decentralized agency must be given a key role in
coordinating the work of federal, state, and local programs.
3. There must be active participation by the people themselves
in the program.
Givens (1949) stated that there are two extreme forms of man
agement. One form was top-down management which was dictatorial,
and the other was management from bottom-up, where upper management
R e p ro d u c e d with perm iss ion of th e copyright ow ner. F u r th e r reproduction prohibited without perm iss ion .

43tries to encourage the initiative of all those down the line.
Givens stated that bottom-up management is not the usual concept of
decentralization. Givens stated that it is carrying decentraliza
tion a step further. He calls it progressive decentralization. It
spreads from one part to others. It includes not only subsidiary
presidents and department heads, but it gives foremen, superintend
ents , and all people along the management line freedom to take
calculative risks and try new ideas. Givens (1949) stated "progres
sive decentralization takes a certain percentage of mistakes for
granted and in review finds them less frequent and less costly than
the results under the czarist type of management" (p. 7).
Ginzberg and Reilley (1957) reported on the effect of decentral
ization in the armed forces, with the establishment of the Army
Service Forces which reversed the flow of paperwork away from Wash
ington and into the field.
Baker and France (1954) conducted a study which compared the
behavior of managers in centralized and decentralized industrial
relations departments. They concluded that there was no substantial
difference in the attitudes of the individuals in centralized de
partments and those within the decentralized departments.
Tannenbaum and Massarik (1950) stated that an effective decen
tralized organization is situational. They stated that a decentral
ized organization is appropriate when the organization has signifi
cant time to implement the model, when the members of the organiza
tion are competent to make their own decisions, and when the managers
are willing to make any decision the group makes.
R e p ro d u c e d with perm iss ion of th e copyright ow ner. F u r th e r reproduction prohibited without perm iss ion .

44Dale (1952) commented on the criteria which determine to what
degree an organization is decentralized. He stated that decentrali
zation of authority increases with:
1. The number of decisions made in the lower levels of manage
ment.
2. The importance of the decisions made in the lower levels of
management.
3. The less checking on the decisions by higher management.
4. The increase in the functions affected by the decisions
made at the lower levels.
E. Weiss (1957), through the use of a 22-item questionnaire,
studied 34 corporations. He found no significant differences be
tween the centralized organizations and the decentralized organiza
tions , with respect to the following variables : absenteeism, turn
over rates, grievances, accident severity, and the age of the man
agers .
Marschak (1959) stated that the effects of centralization or
decentralization on an organization was situational. He stated that
the efficiency of the two depended upon the type of business which
was involved. Litzinger (1963) conducted a study of the effects of
centralization or decentralization upon bank managers. He concluded
that there was no significant difference in the attitudes of the two
groups.
Sloan (1964) conducted a study which yielded similar results
to the study of Marschak (1959). Sloan also stated that the effects
of centralization or decentralization upon a company was situational.
R e p ro d u c e d with perm iss ion of th e copyright ow ner. F u r th e r reproduction prohibited without perm iss ion .

45Sloan stated that for companies where there is a great deal of inde
pendence of action between the members, such as a retail store, that
increased decentralization is desirable. However, in a company
where the members' actions are complimentary, such as the railroad
industry, a high degree of centralization is crucial.
Porter and Lawler (1965), in summarizing various studies con
cerning decentralization, concluded that the previous studies show
no clear cut support on the advantages of decentralization. They
stated: "Perhaps the chief obstacle to research in this area, though
is the lack of an adequate method for measuring the degree of de
centralization. Until such a measure is developed the research evi
dence gathered will undoubtedly remain difficult to interpret"
(p. 48).
In the late 1960's research was extended into the relationship
between productivity and decentralization. Hage (1965), in his
axiomatic theory of organization, contended that greater formulation
and centralization contributes to greater efficiency and productiv
ity, due to the fact that this type of structure reduces uncertainty
in decision making. Price (1968) reported on similar findings of
Hage. Holland (1973) conducted a study of the organizational struc
ture of an institution for the mentally retarded. His objective was
to test whether decentralization facilitated the individualization
of resident care. Holland stated that "decentralization can be seen
as prompting markedly greater participation and involvement of
direct care staff in individualizing and personalizing their care
of residents" (p. 242). Mott (1972) conducted a study of federal
R e p ro d u c e d with perm iss ion of th e copyright ow ner. F u r th e r reproduction prohibited without perm iss ion .

46agencies. Mott suggested there were serious problems with central
ized organizations. He stated that centralization had a serious im
pact on production. He stated "the usual reason given for lower
production in centralized organizations is that this model of
decision-making is repugnant to the personalities and values of most
Americans, particularly professional workers" (p. 85).
Molnar and Rogers (1976) reported on data collected from a
sample of 110 public agencies in Iowa. They reported that the more
formalized and centralized agencies receive and supply more re
sources than those which are less formalized, and therefore, they
have higher levels of output. Whetten (1978), in a study of the
central administrators of manpower programs, agreed with Molnar and
Rogers (1976) that centralization is positively related to higher
levels of output. Whetton (1978) also concluded that while central
ization facilitates productivity, it can also produce a dissatisfied
staff which can cause problems in reaching organizational goals.
Gibson, Ivancevich, and Donnelly (1973) reported on the merits
of decentralization versus centralization. They concluded that the
advantages of decentralization were:
1. Decentralization aids in the development of more highly
skilled managers.
2. Decentralization leads to a healthy competitive climate
within the organization.
3. Decentralization leads to a more equitable performance
appraisal system: managers can be compared with their peers.
R e p ro d u c e d with perm iss ion of th e copyright ow ner. F u r th e r reproduction prohibited without perm iss ion .

474. Decentralization leads to greater management job satisfac
tion, due to their greater participation in management decisions.
In addition, Gibson et al. (1973) summarized some of the dis
advantages of decentralization:
1. Since most managers are familiar with centralized authority,
it may be difficult for them to change their attitudes and delegate
authority.
2. Increasing the responsibilities of the managers may require
additional training programs to increase their skills.
3. Alterations of current administrative operations of the
organization, such as performance appraisals and accounting systems,
may be required.
The conclusions concerning the advantages of centralized versus
decentralized organizations are not clear. Though most of the
studies indicated that a decentralized organization was preferable,
the data were inconclusive. Therefore, this would seem to indicate
that further research is needed to help resolve the inconsistency
of the literature.
White-Collar Versus Blue-Collar Worker
Herzberg, Mausner, Peterson, and Capwell (1957) summarized the
literature through the early 1950's which associated organizational
levels. They stated that "one unequivocal fact emerges from the
studies of job satisfaction: the higher the level of occupation,
the higher the morale" (p. 20). The studies reviewed by Herzberg
et al. were Ash (1954), Browne and Neitzel (1952), J. Campbell
R e p ro d u c e d with perm iss ion of th e copyright ow ner. F u r th e r reproduction prohibited without perm iss ion .

48(1948), Hull and Kolstad (1942), and Kolstad (1944). Ash (1954),
through the use of Science Research Associates Employee Inventory,
tested 134 employees of a steel plant, and concluded "management
supervisory and union estimates of employee morale as reflected in
the kinds of items in the inventory did not closely agree with in
ventory scores based on employee response" (p. 337). Specifically,
he concluded:
1. Department foremen usually estimated employee attitudes to
be more favorable than it was.
2 . The unions underestimated favorableness.
3. Union representatives were more accurate than foremen.
4. Agreement between union and foreman was usually negligible.
In a study which was not reported in the Herzberg et al. (1957)
review, Morse (1953) compared the levels of satisfaction of 61 super
visor workers with some 600 hourly workers and concluded:
The supervisors are considerably more satisfied with their jobs and with the company as a place to work. They are somewhat less satisfied than the employees with their salaries and are about equal in satisfaction with the employees regarding the advancement they have received in the company, (p. 93)
Morse's conclusion generally agreed with the studies mentioned
in the Herzberg et al. (1957) review. However, she added that some
levels of satisfaction for supervisors may not be higher than those
of rank-file workers, specifically the area of wages.
Support for Morse's (1953) conclusions were provided by Handy-
side (1961) who studied 30 managers and 467 production workers in
nine factories. An extensive questionnaire of over 200 questions
R e p ro d u c e d with perm iss ion of th e copyright ow ner. F u r th e r reproduction prohibited without perm iss ion .

49and a follow-up interview made 6 months later was used to reach the
conclusion that job satisfaction was higher for managerial personnel
than it was for production workers.
Friedlander (1965) conducted a study which compared white- and
blue-collar employees in the U.S. Government. He concluded that the
white-collar workers rated factors, such as security and co-workers,
significantly lower than the blue-collar workers, and intrinsic fac
tors, such as achievement and the use of abilities, as higher than
the blue-collar workers.
Centers and Bugental (1966) conducted a study which obtained
results which were similar to Friedlander (1965). The individuals
tested were asked to rate six factors in terms of their importance
to them on the job. They concluded that white-collar workers usu
ally ranked work interests and other intrinsic factors among their
top three factors more than the blue-collar workers, and that they
were less likely to rate pay and security among their top three
factors than the blue-collar workers.
Meyers (1964) conducted a study of white- and blue-collar work
ers, using a blue-collar sample of female assemblers. He concluded
that there were no significant differences between the groups' re
sponses on the factors of achievement and pay. However, the blue-
collar workers, unlike the white-collar workers, did not mention
advancement or responsibility as sources of satisfaction or dis
satisfaction.
Armstrong (1971) conducted a study of engineers and assemblers
at Texas Instruments. They concluded that the engineers ranked job
R e p ro d u c e d with perm iss ion of th e copyright ow ner. F u r th e r reproduction prohibited without perm iss ion .

50content factors such as recognition and achievement higher than the
assemblers, and factors such as salary and working conditions lower
than the assemblers. Armstrong's results were substantiated by
Gluskinos and Kestelman (1971), who obtained similar results.
Schneider and Locke (1971) disagreed with the classification
system of Herzberg et al. (1957) and found results which were simi
lar to Herzberg et al. in one sample of employees, but not in the
other sample. They concluded that Herzberg confused the events of
what happened and what made it happen.
In 1974, Locke and Whitting compared the job satisfaction of
white- and blue-collar workers of 911 employees of the solid waste
management industry. The study concluded that the white-collar
workers were more satisfied with their job than the blue-collar
workers. The authors stated:
These white-collar-blue-collar differences should not necessarily be interpreted as indicating that the two groups of employees have (on the average) different value system. It is equally plausible to assume that the two groups have simply had different work experiences.(p. 154)
Rizzo, House, and Lirtzman (1970) conducted a study of manage
rial and technical employees of a manufacturing research division,
relating job satisfaction to one’s position in the organization.
They concluded that there was a relationship between role ambiguity
and job satisfaction. Hamner and Tosi (1974) concluded that for
lower level employees the effects of multiple authority patterns are
important determinants of job satisfaction. Shuler and Shaller
(1974) concluded that the relationship between role conflict.
R e p ro d u c e d with perm iss ion of th e copyright ow ner. F u r th e r reproduction prohibited without perm iss ion .

51satisfaction, and performance are related to one’s position in the
organization.
Although most of the research indicated that there was a rela
tionship between job satisfaction and whether one is a blue-collar
or white-collar worker, the data were inconclusive as to which work
ers were the most satisfied. Some studies indicated that there was
no relationship; therefore, it is difficult to draw definite con
clusions without further research.
Job Satisfaction Related to Job Performance
The research reviewed in this paper has examined various struc
ture variables to job satisfaction. Therefore, the next logical
step in relating satisfaction to employee utilization is to review
the research which has been conducted concerning job performance and
job satisfaction.
Concurrent with the research concerning organizational levels
related to job satisfaction, there had been attempts made to relate
job satisfaction to job performance. Previous research had proved
to be inconsistent in proving a significant correlation between the
two variables. March and Simon (1958), Morse (1953), and Brayfield
and Crockett (1955) have attempted to distinguish additional vari
ables which influence this relationship such as motivations, expecta
tions, and aspirations of the workers and the rewards obtainable by
them. Herzberg et al. (1957) have even found some inverse relation
ships between the two variables. Katzell, Barrett, and Parker
(1961), in a study conducted in an industrial company containing 72
R e p ro d u c e d with perm iss ion of th e copyright ow ner. F u r th e r reproduction prohibited without perm iss ion .
52warehousing divisions, concluded "job satisfactions were positively
associated, beyond chance expectancy, with two aspects of perform
ance, quantity and profitability. There was no relationship be
tween job satisfaction and either quality of turnover" (p. 68).
Lawler and Porter (1967) reported that expectancy attitudes are
positively related to performance. Porter and Lawler (1968) again
pointed out that the expectancy attitudes caused the performance.
Their research indicates that performance leads to rewards, which
in turn leads to satisfaction. They contended that satisfaction
rather than causing performance is caused by it. Slocum (1971) in
a study which compared the need satisfaction of first line super
visors with top and middle managers and related need satisfaction
to job performance, concluded in a study using Maslow's (1943) hier
archy of needs, that: Overall there existed a relationship between
the higher order need satisfaction and performance. However, the
data also indicated that the satisfaction of lower order needs were
not correlated with performance of first line supervisors.
Lichtman (1970) reported on a study involving 95 employees of
the Internal Revenue Office. Lichtman divided the employees up into
three groups : managers, supervisors, and workers. He concluded
that there was a positive relationship between one's level in the
organization and productivity and that job satisfaction increased
with one's level within the organization.
As with the other literature reviewed in this chapter, the con
tradictions prove the data to be inconclusive. Therefore, further
research is needed in this area.
R e p ro d u c e d with perm iss ion of th e copyright ow ner. F u r th e r reproduction prohibited without perm iss ion .
53Conclusions Based Upon the Review
of the Literature
The studies reviewed in this chapter indicate that there is
sufficient evidence to justify further research in the relationship
between organizational structure, satisfaction, performance, and
employee utilization. The literature presents numerous contradic
tions in dealing with the six variables reviewed. Further research
can only improve the understanding of these contradictions.
Statement of the Hypotheses
As a result of the literature review presented in Chapter II,
the following general hypotheses were tested:
1. There is a relationship between one’s level in the organi
zation and work force utilization.
2. There is a relationship between work force utilization and
whether an employee is a line or staff worker.
3. There is a relationship between organizational subunit size
and work force utilization.
4. There is a relationship between work force utilization and
span of control.
5. There is a relationship between work force utilization and
centralized versus decentralized departments.
6. There is a relationship between work force utilization and
whether an employee is a white-collar or blue-collar worker.
R e p ro d u c e d with p erm iss ion of th e copyright ow ner. F u r the r reproduction prohibited without perm iss ion .
CHAPTER III
DESIGN AND METHODOLOGY
This chapter will describe the design of the study. The type
of research design utilized in this study will be detailed, and the
rationale for the design choice will be explained. The population
which was chosen for the study will be identified. The technique of
work sampling will be explained. The validity and reliability of
work sampling will be defended. Finally, the statistical techniques
utilized in this study will be discussed.
Subjects
The population of this study consisted of 11,537 employees of a
major U.S. electric utility. The company services over 1.7 million
customers and has a service area of over 7,600 square miles. The
company is set up organizationally like many major corporations.
The president of the corporation reports to the chairman of the
board. Under the president of the company are eight vice-presidents
with 50 departments reporting to them. Because of the aforemen
tioned structure, it is concluded that much of the data developed in
this study can be applied to other large corporate organizations.
In order to compare organizational structure with work sampling
levels, the following corporate departments, which were active in
the corporate work measurement program from July 1981 through June
1982, were studied:
54
R e p ro d u c e d with perm iss ion of th e copyright ow ner. F u r th e r reproduction prohibited without perm iss ion .

55Marketing— Responsibility for marketing policy and customer re
lations .
■ Employee relations— Responsibility for policies and practices
dealing with human resources.
Purchasing— Responsibility for the procurement of equipment,
materials, and contract services.
Administrative services— Responsibility for fuel supply, infor
mation systems, and general services.
Computer services— Responsibility for research, design, and
application for computer programming.
Auditing— Responsibility for making internal audits and inde
pendent appraisals of operations, finances, and accounting of the
company.
Accounts payable— Responsibility for the formation of budgets
and payment of accounts.
Plant accounting— Responsibility for the issuance of financial
statements and compliance of accounting requirements to state agen
cies .
Systems engineering— Responsibility for the operation and main
tenance of power plants.
Stores and transportation— Responsibility for warehousing, dis
tribution, and salvage of all material and equipment.
Security— Responsibility for protection of buildings, property,
and operations of the corporation.
Real estate and rights of way— Responsibility for the purchase
and lease of property needed for the corporation.
R e p ro d u c e d with perm iss ion of th e copyright ow ner. F u r th e r reproduction prohibited without perm iss ion .
56Electrical systems— Functional responsibility for the mainte
nance and operations of the electrical system and interconnection
operations.
Production— Responsibility for the operation and maintenance of
fossil-fuel and nuclear power plants.
Engineering and construction— Overall responsibility for the
engineering of electrical and generating facilites, and the con
struction of power plants and transmission lines.
Food services— Responsibility for preparation and planning of
personnel cafeterias.
Division organization— Responsibility for providing customer
services, implementing marketing plans, collecting activity, and the
meter reading activity.
Measures
Percentages of work force utilization were determined by using
a random work sampling plan. Work sampling (Brisley, 1971) con
sisted of random observations to determine the ratio of working and
non-working categories. Cornell and Bames (1950) stated that one
of the primary uses of work sampling was to determine the percentage
of the day that a person is working and the percentage that the per
son is not working.
Work sampling, which was introduced in England by L. H. Tippett
in 1934 (Bames, 1957), is based upon the laws of probability. It
works because a smaller number of chance occurrences tend to follow
the same distribution pattern that a larger number produces (Brisley,
R e p ro d u c e d with perm iss ion of th e copyright ow ner. F u r th e r reproduction prohibited without perm iss ion .
571971). In order for work sampling to be accurate, it is required
that there be no bias in the sampling. Each part of the population
must have es much chance of being drawn as any other (R. Davis,
1951)- Work sampling studies have an advantage over other perform
ance measures in that it can be used to measure almost any type of
job. Work sampling studies have been made successfully of super
visors, engineers, draftsmen, and other technical personnel.
Work sampling shows a clear picture of how time is being allo
cated among whatever kinds of activities one wishes to study
(Hinrichs, 1976).
Kulonda (1981) concluded that work sampling is an ideal method
for determining work force utilization and productivity levels in
situations whose products or services are not predictable. D. Allen
(1978) stated that work sampling is a method which is generally used
to estimate the portion of time an activity occurs, and is also
effective for determining employee and equipment utilization as well
as productivity. Gregerman (1981) mentioned that although several
techniques do exist for measuring construction-site labor utiliza
tion, work sampling is increasingly being applied and accepted.
Work sampling is not a perfect work measurement tool. It is
not advisable to use it in all cases. Bames (1957) offered the
following advantages and disadvantages of work sampling in compari
son to other work measurement techniques such as continuous time
studies.
R e p ro d u c e d with perm iss ion of th e copyright ow ner. F u r th e r reproduction prohibited without perm iss ion .
58Advantages
1. A simultaneous work sampling study of several operators or
machines may be made by a single observer.
2. With work sampling the analyst makes an instantaneous ob
servation of the operator at random intervals during the working
day, thus making prolonged time studies unnecessary.
3. It is not necessary to use trained time study analysts as
observers for work sampling studies unless performance sampling is
required. Then an experienced time study analyst must be used.
4. Many operations or activities which are impractical or
costly to measure by time study can readily be measured by work
sampling.
5. It usually requires fewer manhours and costs less to make
a work sampling study than it does to make a continuous time study.
The cost may be as little as 5% to 50% of the cost of a continuous
time study.
6. There is less chance of obtaining misleading results, as
the operators are not under close observation for long periods of
time. When a worker is observed continuously for an entire day, it
is unlikely that he will follow his usual routine exactly.
7. Observations may be taken over a period of days or weeks,
thus decreasing the chance of day-to-day or week-to-week variations
affecting the results.
8. A work sampling study may be interrupted at any time with
out affecting the results.
R e p ro d u c e d with perm iss ion of th e copyright ow ner. F u r th e r reproduction prohibited without perm iss ion .
599. Work sampling studies are less fatiguing and less tedious
to make on the part of the observer.
10. Work sampling studies are preferred to continuous time
studies by the operators being studied. Some people do not like to
be observed continuously for long periods of time.
11. Work sampling measurements may be made with a preassigned
degree of reliability. Thus, the results are more meaningful to
those not conversant with the methods used in collecting the infor
mation.
12. No stopwatch or other timing device is needed for work
sampling studies.
Disadvantages
1. There is a tendency on the part of some observers to mini
mize the importance of following the fundamental principles of work
sampling, such as, the proper sample size for a given degree of
accuracy, randomness in making the observations, an instantaneous
observation at the preassigned location, and carefully defining the
elements or subdivisions of work or delay before the study is
started.
2. Ordinarily work sampling is not economical for studying a
single machine operator or for studying operators or machines
located over wide areas. The observer spends too great a proportion
of his time walking to and from the work place or walking from one
work place to another.
R e p ro d u c e d with perm iss ion of th e copyright ow ner. F u r th e r reproduction prohibited without perm iss ion .

603. Time study permits a finer breakdown of activities and de
lays than is possible with work sampling.
4. The operator may change his work pattern upon seeing the
observer. If this occurs, the results of such a work sampling study
may be of little value.
5. A work sampling study made of a group obviously presents
average results, and there is no information as to individual dif
ferences .
6. Management and workers may not understand statistical work
sampling as readily as they do time study.
Work Sampling Procedures
The following technique was used to work sample the personnel
(W. Weiss, 1980):
1. Predetermine the areas to be studied.
2. Prepare a tally sheet listing the categories of work and
nonwork (see Appendix A).
3. Determine the random tour times (see Appendices B and C).
4. Determine the number of observations required for an
absolute accuracy of 5% or less at a 95% confidence level (see
Appendix D).
5. Record first impressions.
6. Calculate the percentages of work and nonwork.
7. Summarize the results.
R e p ro d u c e d with perm iss ion of th e copyright ow ner. F u r th e r reproduction prohibited without perm iss ion .

61The following categories were used to summarize the data:
1. Working. This category covers all elements of productive
work. The act of baking is a "working" category.
2. Waiting. This category covers the act of waiting in all
aspects (i.e., waiting on materials, equipment, etc.). It is used
when the "work" category cannot be completed, or engaged, due to a
lack of something else (materials, etc.), and is not counted idle.
3. Idle. Used when there is work to be done, but employee is
not accomplishing it and is not on an excused break.
4. Receiving instructions. Used when the employee is receiv
ing instructions which are necessary to accomplish the assigned
work.
5. Personal. When using the category "personal," the general
rule is that this category is intended to be used for those times
that are either set out by company rules or regulations (breaks,
lunch, etc.), or are for the personal comfort of the person being
observed, such as going to the restroom, getting water, or being
treated by a company nurse or doctor for sickness or injury.
6. Traveling. This category denotes the fact that the em
ployee was required to travel to some other point away from the
normal work station to obtain necessary material, instructions, or
any other item necessary to accomplish the assigned work.
7. Nonproductive working. Many times there will be occasions
when one or more of the people in the observation study will be re
quired to attend a company required safety meeting. During this
time, the observer will use the "nonproductive work" category to
R e p ro d u c e d with perm iss ion of th e copyright ow ner. F u r th e r reproduction prohibited without perm iss ion .

62designate the activity. Thus, the activity will not be counted as
"idle" or "personal" time, but in a special category of "work." In
analyzing the results of the study it may be of interest to deter
mine what percentage of the total time is spent in meetings of vari
ous types.
8. Unobserved. Another useful category is "unobserved." When
the people to be observed are in different locations, or separated
from the observation area, it must be an accepted fact that we may
not observe a particular person on a particular round of observa
tions . The person to be observed may be temporarily in another area
of the building at the time the observer makes the tour, or he may
be in a restroom, or he could be deliberately "hiding" from the ob
server after having seen the observer on the start of the tour in
another area.
Validity of Work Sampling
Gay (1981) defined validity as "the degree to which a test
measures what it is supposed to measure" (p. 110). Tuckman (1972)
agreed with this definition in stating that validity is concerned
with the degree to which the test measures the characteristic that
it is to measure.
The types of validity utilized in this research is content
validity. Kerlinger (1973) defined content validity as:
The representativeness or sampling adequacy of the content— the substance, the matter, the topics— of a measuring instrument. Content validation is guided by the question: Is the substance or content of this measure
R e p ro d u c e d with perm iss ion of th e copyright ow ner. F u r th e r reproduction prohibited without perm iss ion .
63representative of the content or the universe of content of the property being measured? (p. 458)
Gay (1981) stated that content validity requires item validity which
is concerned with whether or not the test represents measurement in
the intended content area. It also requires sampling validity which
deals with how well the test samples the total content area.
The work sampling program utilized in this research fulfills
the two criteria of content validity. The criteria of item validity
is met through the use of observational research. Gay (1981) de
fined data from an observational study as being determined by ob
serving but not by asking. Kerlinger (1973) agreed with this defi
nition, and Tuckman (1972) stated that an observation refers to what
is. In order to insure that the observer is truly determined what
is, the observers are made up of supervisors and other senior indi
viduals within the department who are familiar with the jobs being
studied. Trial observation tours are taken with department manage
ment to insure the accuracy of the observers. The criteria of sam
pling validity is met through two methods. One method is through
the taking of random samples which insure that the observers will
study all days of the week and hours of the day. The individuals
being studied cannot predict the time of the observation tours and
thereby alter their work patterns. The other insurance of sampling
validity is the procedure of taking enough observations to insure an
absolute accuracy of plus and minus 5% at the 95% confidence level.
R e p ro d u c e d with p erm iss ion of th e copyright ow ner. F u r the r reproduction prohibited without perm iss ion .

64Reliability of Work Sampling
Gay (1981) defined reliability as "the degree to which a test
consistently measures whatever it measures" (p. 116). Tuckman
(1972) defined reliability simply as a test being consistent.
Kerlinger (1973), in referring to the reliability of behavioral
observations, stated:
The reliability of behavioral observation measures is a simpler matter, though by no means an easy one. It is usually defined as the agreement among observers. . . . Practically speaking, then, the reliability of observations can be estimated by correlating the observations of two or more observers, (p. 540)
The work sampling program periodically utilizes different observers
for each department. If there are unexplainable differences in the
results obtained, the differences are resolved by department manage
ment in order to insure consistency of future tests. Another method
of insuring reliability is the method of "test-retest reliability."
Gay (1971) defined test-retest reliability as the degree to which
the data are consistent over time. All of the departments were
studied on a monthly basis. The scores for each month were compared
to one another, and significant differences in the data were ex
plained .
Data Collection
From the period of July 1981 through June 1982, over 200,000
work sampling observations were taken of these personnel, and the
working and non-working categories were determined. The data were
submitted to the industrial engineering department where it was
R e p ro d u c e d with perm iss ion of th e copyright ow ner. F u r th e r reproduction prohibited without perm iss ion .

65analyzed for possible improvements and summarized as a corporate
report. Data were utilized from the entire population.
Data Analysis Procedures
The statistical analysis package of the Statistical Analysis
System computer language developed by the SAS Institute was used to
analyze the data (Helwig & Council, 1979).
The data base utilized in this study was analyzed through two
statistical techniques. The first technique utilized the Pearson
Product-Moment Correlation Coefficient. This statistical technique
is used to determine a correlation coefficient between data in which
both the independent variable and the dependent variable contain
data on an interval or ratio scale. The following research hypothe
sis was tested through the use of the Pearson Product-Moment Corre
lation: There exists a relationship between organizational subunit
size and work force utilization.
The other statistical method used in this paper was the utili
zation of a t test to determine the difference between the independ
ent population means. The following hypotheses were tested utiliz
ing this technique.
1. There exists a difference between the work force utiliza
tion means of management employees versus nonmanagement employees.
2. There exists a difference between the work force utiliza
tion means of line employees versus staff employees.
3. There exists a difference between the work force utiliza
tion means of employees in a department with a large span of control
R e p ro d u c e d with p e rm iss ion of th e copyright owner. F u r th e r reproduction prohibited without perm iss ion .

66versus the employees in a department with a small span of control.
4. There exists a difference between the work force utiliza
tion means of employees in centralized departments versus employees
in decentralized departments.
5. There exists a difference between the work force utiliza
tion means of blue-collar employees versus white-collar employees.
The t_ test will be used at the .05 level of significance. This
is referred to as the alpha level of a Type I error. This test of
significance will be used to decide whether we can reject or accept
the null hypothesis. If the null hypothesis is rejected at the .05
level, it would infer that there are five chances out of 100 of
making a wrong decision.
Classifications of Departments
Line Versus Staff
The departments were categorized through the use of the corpo
rate organizational chart. Line (operational) units were those
which worked under the Vice-Presidents of Operations, Engineering,
Construction, and the Divisions. Staff units were those which
worked under the Vice-Presidents of Administration, Marketing,
Finance, Planning, and Employee Relations. An example of a line
organization which relates to the major objective of the organiza
tion would be the Production Department. An example of a staff
organization would be the Auditing Department, which is involved
with interpreting policy matters and is not related to the major
R e p ro d u c e d with perm iss ion of th e copyright ow ner. F u r th e r reproduction prohibited without perm iss ion .
67objective of the organization.
Centralized Versus Decentralized
Departments were characterized as centralized versus decentral
ized based on geographic location. The company is divided into six
geographic locations. Departments which had personnel with super
visors in two or more locations were classified as decentralized.
An example of a centralized department would be Accounts Payable,
which is located totally in one location. An example of a decentral
ized department would be the Division Organization, which has
offices in the six geographical areas.
Subunit Size
The number of personnel within a department was obtained from
corporate financial and personnel data.
Span of Control
A determination of the number of employees controlled by a
manager or supervisor was determined through department organiza
tional charts and interviews. Control of an employee was determined
as the supervisor or manager writing the performance review and
determining eligibility for pay raises. Departments classified as
having small spans of control had 10 or less employees per super
visor while those classified as having large spans of control had 11
or more employees.
R e p ro d u c e d with perm iss ion of th e copyright ow ner. F u r th e r reproduction prohibited without perm iss ion .

68Management Versus Nonmanagemeat
This determination was made through the use of department per
sonnel records. The corporation has four classes of personnel:
M— Management personnel
A— Management trainee
0— Hourly clerical
T— Hourly manual
Those individuals who were designated as M grades were considered as
management, and all other personnel were considered as nonmanagement.
White-Collar Versus Blue-Collar
This determination was made through the use of department per
sonnel records. Employees classified as M grades and A grades were
considered as white-collar employees, and employees classified as 0
grades and T grades were classified as blue-collar employees.
Summary
This study utilized data collected from 17 departments of a
major public utility. The Industrial Engineering technique of work
sampling was used to determine the work force utilization percentage
of each of the departments. From July 1981 through June 1982, over
200,000 work sampling observations were taken of these personnel.
The structural variables of size, span of control, employee level,
blue-collar versus white-collar, centralized versus decentralized,
and line versus staff were determined through the use of corporate
R e p ro d u c e d with perm iss ion of th e copyright ow ner. F u r th e r reproduction prohibited without perm iss ion .

69and department organization charts.
The Pearson Product-Moment Correlation Coefficient and the Stu
dent _t test were used to test the hypotheses.
In Chapter IV, which follows, the results of the testing of the
hypotheses are presented.
R e p ro d u c e d with perm iss ion of th e copyright ow ner. F u r th e r reproduction prohibited without perm iss ion .

CHAPTER IV
RESULTS
Introduction
As was stated in Chapter I, the purpose of this study was ro
determine the relationship between employee utilization and selected
variables of organizational structure— level within the organiza
tion, span of control, line or staff position, organizational size,
organizational shape, and blue-collar versus white-collar workers.
The data utilized in this study were collected over a 12-month
period, from July 1981 through June 1982. Table 1 contains the
monthly results of the work sampling data presented by department.
The means and standard deviations were calculated for each depart
ment .
In analyzing the data from the various departments, it was
determined that the means by department varied from a work force
utilization value of 51.3 to a utilization value of 72.8, which
implies there are meaningful differences in the work force utiliza
tion of the various departments.
Presentation and Analysis of Data
Organization Level
The _t test for independent means was used to determine whether
differences exist between the work force utilization means of the
70
R e p ro d u c e d with perm iss ion of th e copyright ow ner. F u r th e r reproduction prohibited without perm iss ion .

71Table 1
Summary Analysis of Means and Standard Deviations of Work Force Utilization Percentages^
Department MeanStandarddeviation
A 66.7 5.67
B 60.1 3.07
C 65.4 4.54
D 63.2 3.80
E 54.7 5.59
F 62.4 2.74
G 72.1 4.90
H 61.2 3.10
I 69.0 5.23
J 60.6 3.18
K 51.3 3.00
L 60.3 2.76
M 68.5 4.32
N 68.6 4.14
0 72.8 3.37
P 70.9 2.94
Q 63.4 3.00
^This table is scrambled to insure the confidentiality of thedepartments involved in this study.
R e p ro d u c e d with perm iss ion of th e copyright ow ner. F u r th e r reproduction prohibited without perm iss ion .

72managers versus nonmanagers. The probability of committing a Type I
error was .05.
The results presented in Table 2 indicated that differences in
means for the work force utilization between the management level
personnel and the nonmanagement personnel were not found.
Table 2
Results of the jt Test Between the Work Force Utilization of Management and
Nonmanagement Employees
Level n Mean 2 df 2*
Management level 6 67.42 4.701.76 15 .094
Nonmanagementlevel 11 62.43 5.99
*2 < .05.
Line Versus Staff
The 2 test was used to determine whether differences exist be
tween the work force utilization means of the line versus staff
employees. The test was based on a jt ratio at the .05 alpha level.
The results presented in Table 3 indicated differences between the
means for work force utilization for the staff personnel and the
line personnel were not found.
R e p ro d u c e d with perm iss ion of th e copyright ow ner. F u r th e r reproduction prohibited without perm iss ion .

73Table 3
Sunmary _t Analysis Data for the Difference Between Work Force Utilization of Line
and Staff Personnel
Level n Mean ^ _t ^ 2*
Staff 9 66.28 4.45
Line 8 61.80 6.801.61 15 .128
*2 < .05.
Blue-Collar Employees Versus White-Collar
The method used to determine whether significant differences
exist between the work force utilization means of the white-collar
and blue-collar workers was the _t test at the .05 alpha level. The
results presented in Table 4 indicated there were no differences
between the means for work force utilization for the white-collar
and blue-collar employees.
Table 4
Results of the 2 Test Between Work Force Utilization of White-Collar and
Blue-Collar Workers
Level n Mean ^ 2 ^ 2*
White-collar 11 65.41 4.44
Blue-collar 6 61.95 8.021.16 15 .256
*2 < .05.
R e p ro d u c e d with perm iss ion of th e copyright ow ner. F u r th e r reproduction prohibited without perm iss ion .
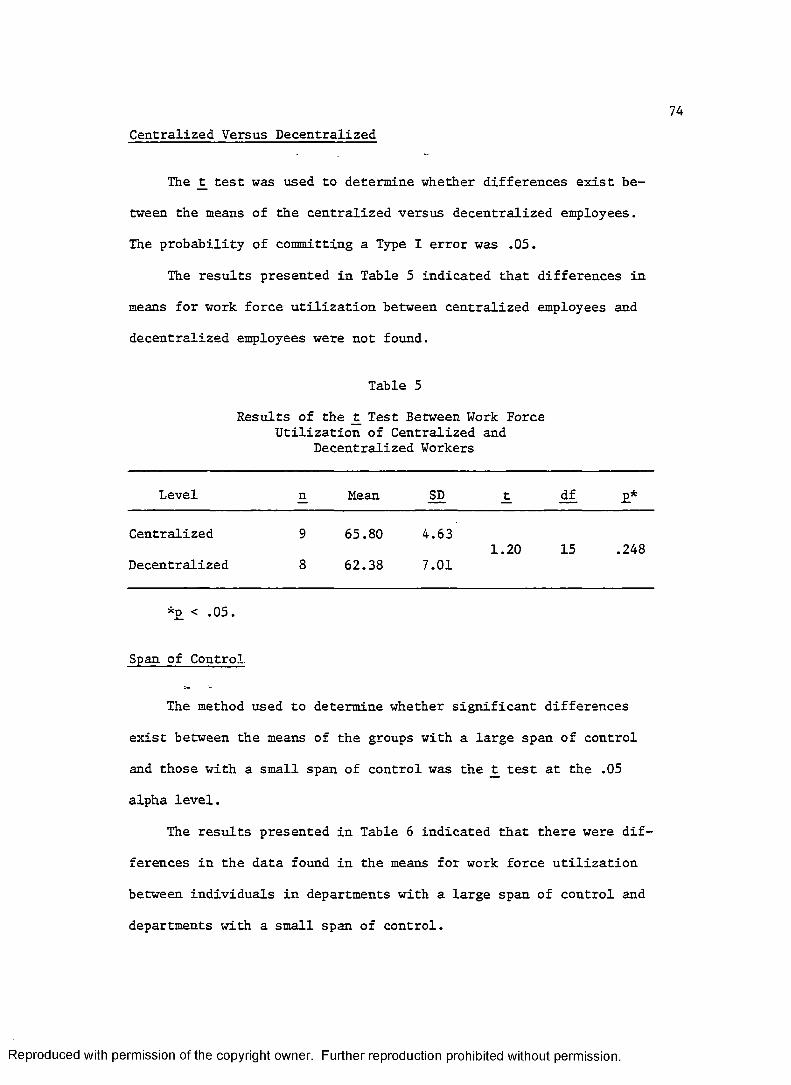
74Centralized Versus Decentralized
The _t test was used to determine whether differences exist be
tween the means of the centralized versus decentralized employees.
The probability of committing a Type I error was .05.
The results presented in Table 5 indicated that differences in
means for work force utilization between centralized employees and
decentralized employees were not found.
Table 5
Results of the _t Test Between Work Force Utilization of Centralized and
Decentralized Workers
Level n Mean _t M . 2*
Centralized 9 65.80 4.631.20 15 .248
Decentralized 8 62.38 7.01
*£ < .05.
Span of Control.
The method used to determine whether significant differences
exist between the means of the groups with a large span of control
and those with a small span of control was the _t test at the .05
alpha level.
The results presented in Table 6 indicated that there were dif
ferences in the data found in the means for work force utilization
between individuals in departments with a large span of control and
departments with a small span of control.
R e p ro d u c e d with perm iss ion of th e copyright ow ner. F u r th e r reproduction prohibited without perm iss ion .

75Table 6
Results of the _t Test Between the Work Force Utilization of Small Span of Control
Employees and Large Span of Control Employees
Level n Mean SB t if. 2 *
1-15 employees Smallspan 11 67.26 4.09
16-38 employees Largespan 6 58.56 4.55
4.04 15 .002
*2 < .05.
Subunit Size
The method used to determine whether there was a relationship
between subunit size and work force utilization was the Pearson
product-moment correlation coefficient "r." A correlation coeffici
ent was calculated between the independent variable of subunit size,
and the dependent variable of work force utilization (Table 7).
Findings indicated there is a linear relationship between the
two variables. The correlation coefficient "r" which indicates the
extent to which sets of data are related was -.80. The coefficient
of determination "r^" was .64. This indicated that 64% of the vari
ance in the work force utilization percentage was associated with
variance in subunit size.
A _t test was conducted to test the null hypothesis p = 0
against p > 0 (Hinkle, Wiersma, & Jurs, 1979). The probability for
committing a Type I error was .05. The critical values for 15
R e p ro d u c e d with perm iss ion of th e copyright ow ner. F u r th e r reproduction prohibited without perm iss ion .

76Table 7
Pearson Product-Momem: Correlation Coefficient Between Organizational Size and Work
Force Utilization
DepartmentWork force
utilization %Organization
size
A 66.7 78B 60.1 184C 65.4 133D 63.2 165E 60.3 264F 68.5 42G 68.6 43H 72.8 12I 70.9 52J 61.2 574K 69.0 101L 60.6 708M 51.3 2,701N 54.7 1,2600 72.1 80P 63.4 391Q 62.4 195
Number: 17 17
Minimum: 51.3 12
Maximum: 72.8 2,701
Mean: 64.19 410.76
Variance: 33.26 424,346
Standard deviation: 5.77 651.42
Correlation coefficient: -803
R e p ro d u c e d with perm iss ion of th e copyright ow ner. F u r th e r reproduction prohibited without perm iss ion .
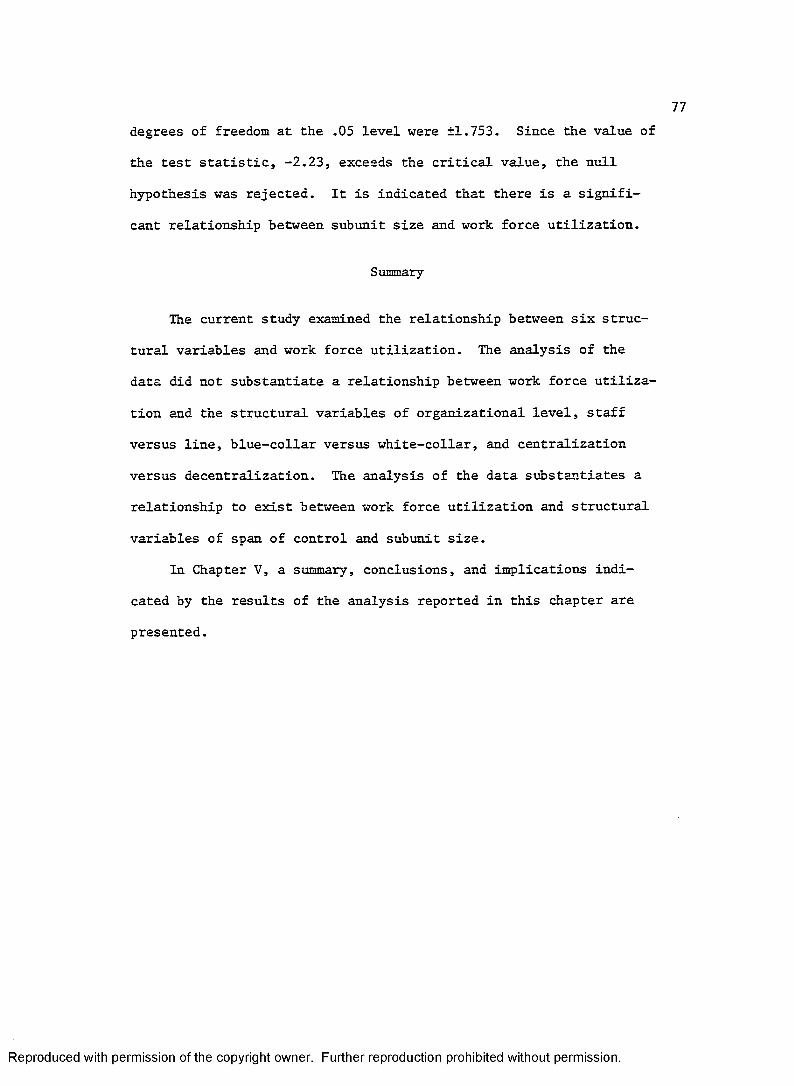
77degrees of freedom at the .05 level were ±1.753. Since the value of
the test statistic, -2.23, exceeds the critical value, the null
hypothesis was rejected. It is indicated that there is a signifi
cant relationship between subunit size and work force utilization.
Summary
The current study examined the relationship between six struc
tural variables and work force utilization. The analysis of the
data did not substantiate a relationship between work force utiliza
tion and the structural variables of organizational level, staff
versus line, blue-collar versus white-collar, and centralization
versus decentralization. The analysis of the data substantiates a
relationship to exist between work force utilization and structural
variables of span of control and subunit size.
In Chapter V, a summary, conclusions, and implications indi
cated by the results of the analysis reported in this chapter are
presented.
R e p ro d u c e d with perm iss ion of th e copyright ow ner. F u r th e r reproduction prohibited without perm iss ion .

CHAPTER V
CONCLUSIONS, RECOMMENDATIONS, AND SUMMARY
Chapter V presents conclusions, usages, and recommendations for
future research.
Conclusions
The major purpose of this study was to determine the relation
ship between work force utilization and the six organizational
structural variables: levels within a department, span of control,
line or staff position, subunit size, shape of the department, and
white-collar versus blue-collar employees. In the following sec
tions conclusions concerning each of these areas is presented.
Organizational Level
Hypothesis 1 stated there is a difference in the work force
utilization of management and nonmanagement employees. The analy
sis of data presented in Chapter IV did not support this hypothesis.
Therefore, no conclusion can be drawn about the relationship between
the type of position of an employee and work force utilization. The
results of this study point out the continuing need for research in
this area.
78
R e p ro d u c e d with perm iss ion of th e copyright ow ner. F u r th e r reproduction prohibited without perm iss ion .

79Line Versus Staff
Hypothesis 2 stated there is a difference in the work force
utilization means of line versus staff employees. The data pre
sented in Chapter IV did not support this hypothesis. The staff
personnel were not observed working more than the line personnel.
The results of this study were in agreement with Rosen and Weaver
(1960), who concluded there were no differences in line and staff
personnel. Belasco and Alutto (1969) agreed with Rosen and Weaver,
in concluding that there have been few empirical studies which have
proven there is a difference between the groups.
Span of Control
Hypothesis 3 stated there is a difference in the work force
utilization means of departments with a large span of control versus
those with a small span of control. The results of the analysis of
the data presented in Chapter IV support this hypothesis. The de
partments with a small span of control were observed as working more
than the departments with a large span of control. The results of
this study disagreed with Worthy (1950), who concluded that a large
span of control is the best method, and the results of the research
disagreed with Suojanen (1955), who concluded that the theory of
there being a "correct" span of control is meaningless. The results
of this study agreed with the classical theory of Fayol (1977) and
Urwick (1956), who stated that smaller spans of control are more
effective.
R e p ro d u c e d with perm iss ion of th e copyright ow ner. F u r th e r reproduction prohibited without perm iss ion .

80Centralized Versus Decentralized
Hypothesis 4 stated there is a difference in the work force
utilization means of centralized departments versus decentralized
departments. The results of the analysis presented in Chapter IV
did not support this hypothesis. The results of this research did
not support the conclusions drawn by theorists such as Fayol (1977),
who stated that centralization is the most efficient type of organi
zation, and this research disagrees with Sloan (1964), who commented
on the efficiency of decentralization. However, this research
corresponded to the studies conducted in this area in the late
1950's and early 1960's. The researchers of this period stated that
the effects of decentralization are situational. Litzinger (1963),
in his study of bank managers, found no differences in the effects
of decentralization versus centralization. Porter and Lawler (1965),
in summarizing various studies concerning decentralization, found no
clear cut advantages to one method over the other.
Blue-Collar Employees Versus White-Collar
Hypothesis 5 stated there is a difference in the work force
utilization means in blue-collar versus white-collar employees. The
results of the data analysis did not support this hypothesis. The
white-collar workers were not observed as working more than the
blue-collar workers. The results of this study did not provide sup
port for the majority of research conducted in this area.
R e p ro d u c e d with perm iss ion of th e copyright ow ner. F u r th e r reproduction prohibited without perm iss ion .
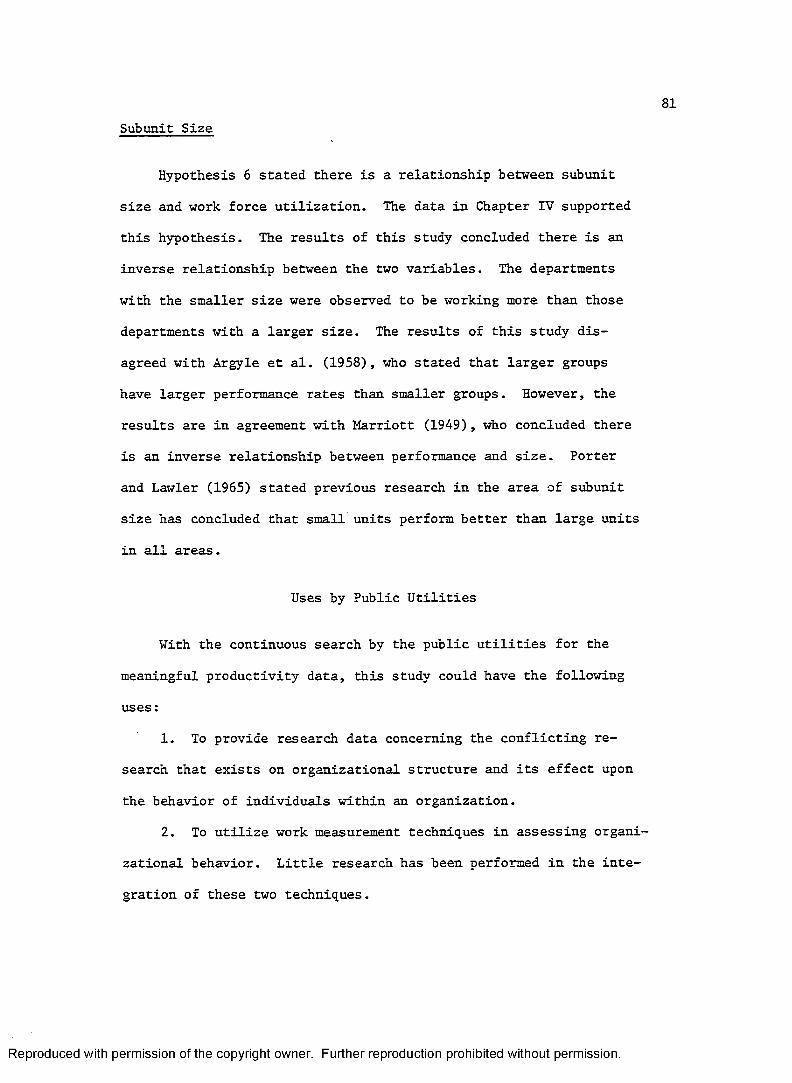
81Subunit Size
Hypothesis 6 stated there is a relationship between subunit
size and work force utilization. The data in Chapter IV supported
this hypothesis. The results of this study concluded there is an
inverse relationship between the two variables. The departments
with the smaller size were observed to be working more than those
departments with a larger size. The results of this study dis
agreed with Argyle et al. (1958), who stated that larger groups
have larger performance rates than smaller groups. However, the
results are in agreement with Marriott (1949), who concluded there
is an inverse relationship between performance and size. Porter
and Lawler (1965) stated previous research in the area of subunit
size has concluded that small units perform better than large units
in all areas.
Uses by Public Utilities
With the continuous search by the public utilities for the
meaningful productivity data, this study could have the following
uses :
1. To provide research data concerning the conflicting re
search that exists on organizational structure and its effect upon
the behavior of individuals within an organization.
2. To utilize work measurement techniques in assessing organi
zational behavior. Little research has been performed in the inte
gration of these two techniques.
R e p ro d u c e d with perm iss ion of th e copyright ow ner. F u r th e r reproduction prohibited without perm iss ion .

823. To provide information, to the managers of public utilities
and other large industrial organizations concerning the relationship
between structural variables and employee utilization.
4. To provide information to the managers of public utilities,
concerning the effective use of work sampling within the utility
industry.
5. To provide historical work force utilization data to the
electric industry which has suffered from the scarceness of work
measurement data.
Recommendations for Future Research
The results of this study were in some instances contradictory
to past writings. This may be a function of the work sampling
method, or a function of the study being limited to the utility
industry. The use of work sampling as it relates to structural
variables is a new technique, and additional studies should be con
ducted to ascertain its assets and its liabilities in this type of
research. The study being limited to the utility industry could
cause some of the contradictions to past writings. Most of the re
search conducted on structural variables has concluded that their
effects can be situational. The situations which apply to the
utility industry may not apply to other industries or situations.
However, as was mentioned in Chapter II, most of the research in
this area is inconclusive.
It is hoped that this research study will result in additional
analysis and study concerning organizational structure and its
R e p ro d u c e d with perm iss ion of th e copyright ow ner. F u r th e r reproduction prohibited without perm iss ion .
83relationship to work force utilization.
If future research is to be done, it is recommended, by this
researcher, that work sampling should be studied as it relates to
organizational structure in industries and organizations other than
the utility industry. This would allow for a determination of the
influence of situational factors on the variables.
It is also recommended that work sampling should be studied
as it relates to organizational structure in small size organiza
tions. The effect of total organizational size should be studied
for its effects on the two variables.
It is recommended that future research should be conducted con
cerning work force utilization applying multiple correlational tech
niques of the various structural variables used in this paper. This
would allow for studies on the effect of all these variables, work
ing together, have on work force utilization.
Summary
This researcher has attempted to study the relationship between
organizational structure and work force utilization. The sample
consisted of the employees of a major public utility. Seventeen
departments were studied. This offered a cross section of organiza
tional structures. Work force utilization levels were determined
through the use of a random work sampling plan. While work force
utilization is not a productivity measure, it is an excellent mea
surement tool for comparing various departments which differ in
their types of output.
R e p ro d u c e d with perm iss ion of th e copyright ow ner. F u r th e r reproduction prohibited without perm iss ion .

84The results of this research found relationships to exist be
tween work force utilization and the structural variables of span of
control and subunit size. This research did not find a relationship
to exist between the work force utilization and the structural vari
ables of organizational level, line versus staff, centralized versus
decentralized employees, and blue-collar versus white-collar
employees.
It is believed that this research can and will serve as a
catalyst to initiate additional research in the uses of work
sampling.
R e p ro d u c e d with p erm iss ion of th e copyright ow ner. F u r the r reproduction prohibited without perm iss ion .

APPENDICES
85
R e p ro d u c e d with perm iss ion of th e copyright ow ner. F u r th e r reproduction prohibited without perm iss ion .
Appendix A
Work Sampling Observation Tally Sheet
86
R e p ro d u c e d with perm iss ion of th e copyright ow ner. F u r th e r reproduction prohibited without perm iss ion .

87
Io i
o2<Uu<zo52
II
5
z< II
I
i
i
i
i
i
i>oz
i8
ZS
oz3
R e p ro d u c e d with perm iss ion of th e copyright ow ner. F u r th e r reproduction prohibited without perm iss ion .

Appendix B
Random Selection of Tour Times
88
R e p ro d u c e d with perm iss ion of th e copyright ow ner. F u r th e r reproduction prohibited without perm iss ion .

89
Bftndoa Selection of Tour Times
The times of Individuel tours ere randomly determined by Che coordinator end the observer using e random time table. They estimate how many tours will be made, obtain a starting point and select tour times within the time frame to be sampled from the Table of Random Times.The Table of Random Times (page 9 ) lists In random sequence each five minute Interval In a 24 hour day. It Is Important that the csthod used to select a starting point will yield different starting points. For this reason a method Is provided.Consider the Table of Random Times as consisting of 24 rows and 12 columns. From the Table of Random Numbers between 1 and 24 select a row number (between 1 and 24) and a column number (between 1 and 12). These numbers represent the coordinates of the starting point.Example:The day the sampling will occur Is the 11th day of the 9th month. Starting In the 11th row of the Table of Random Numbers proceed horizontally until the first 9 Is found. Then proceeding vertically down, select the first number between 1 and 12 as the column number and the next number as the row number. Having obtained the starting point (2, 1) proceed to the Table of Random Times and from the starting point proceeding horizontally select tour times. If 8 times are desired between 8:15 and 5:00, the times would be:
0945 11251115 16350845 10201625 1530
Other examples of selecting starting points.Look at your watch, notice how many seconds past the minute (If morethan 30 divide It in half) and proceed In the row corresponding to thenumber hour of the day. Then proceed horizontally selecting the first number as the row number and the next number between 1 and 12 as the column number thus selecting the coordinates of the starting point.Other methods of selecting starting points which assures that different starting points will be selected are acceptable.
R e p ro d u c e d with p e rm iss ion of th e copyright ow ner. F u r th e r reproduction prohibited without perm iss ion .

Appendix C
Table of Random Times
90
R e p ro d u c e d with perm iss ion of th e copyright ow ner. F u r th e r reproduction prohibited without perm iss ion .
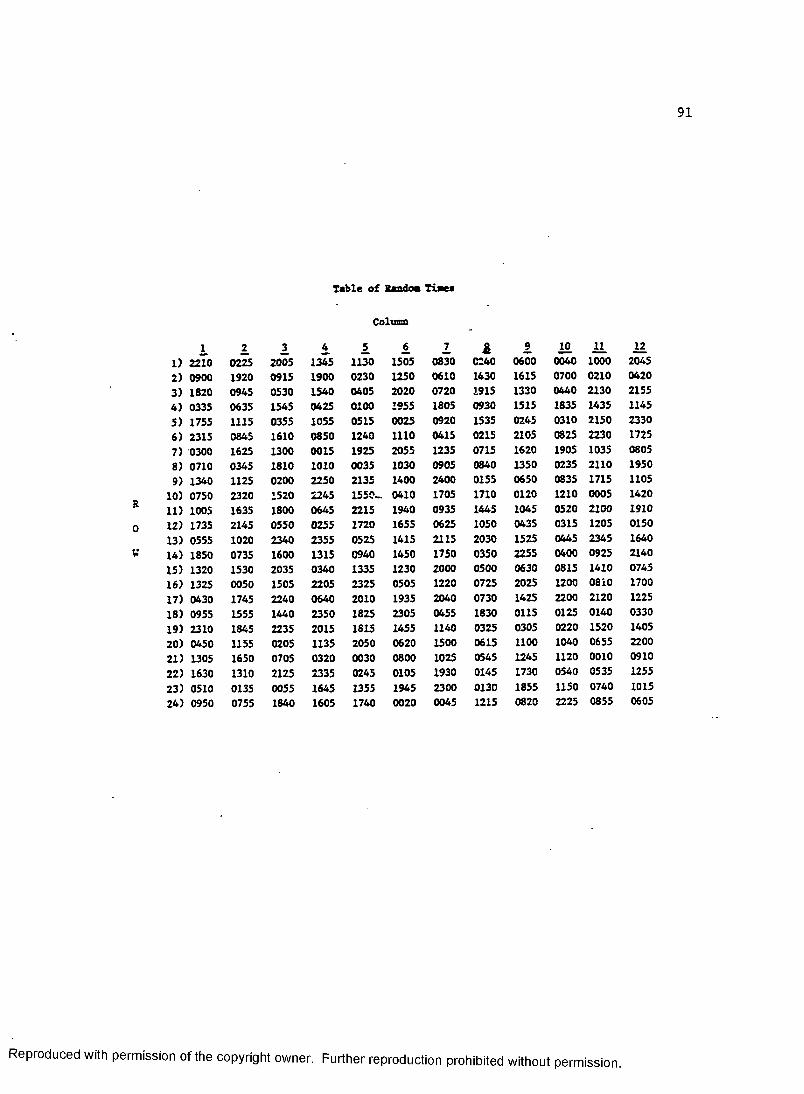
91
Table of Random Times
Column
1_ 2 2 4 2 6 2 i 2 121) 2210 0225 2005 1345 1130 1505 0830 C240 0600 0040 1000 20452) 0900 1920 0915 1900 0230 1250 0610 1430 1615 0700 0210 04203) 1820 0945 0530 1540 0405 2020 0720 1915 1330 0440 2130 21554) 0335 0635 1545 0425 0100 1955 1805 0930 1515 1835 1435 11455) 1755 1115 0355 1055 0515 0025 0920 1535 0245 0310 2150 23306) 2315 0845 1610 0850 1240 1110 0415 0215 2105 0825 2230 17257) 0300 1625 1300 0015 1925 2055 1235 0715 1620 1905 1035 08058) 0710 0345 1810 1010 0035 1030 0905 0840 1350 0235 2110 19509) 1340 1125 0200 2250 2135 1400 2400 0155 0650 0835 1715 1105
10) 0750 2320 1520 2245 1550- 0410 1705 1710 0120 1210 0005 142011) 1005 1635 1800 0645 2215 1940 0935 1445 1045 0520 2100 191012) 1735 2145 0550 0255 1720 1655 0625 1050 0435 0315 1205 015013) 0555 1020 2340 2355 0525 1415 2115 2030 1525 0445 2345 164014) 1850 0735 1600 1315 0940 1450 1750 0350 2255 0400 0925 214015) 1320 1530 2035 0340 1335 1230 2000 0500 0630 0815 1410 074516) 1325 0050 1505 2205 2325 0505 1220 0725 2025 1200 0810 170017) 0430 1745 2240 0640 2010 1935 2040 0730 1425 2200 2120 122518) 0955 1555 1440 2350 1825 2305 0455 1830 0115 0125 0140 033019) 2310 1845 2235 2015 1815 1455 1140 0325 0305 0220 1520 140520) 0450 1155 0205 1135 2050 0620 1500 0615 1100 1040 0655 220021) 1305 1650 0705 0320 0030 0800 1025 0545 1245 1120 0010 091022) 1630 1310 2125 2335 0245 0105 1930 0145 1730 0540 0535 125523) 0510 0135 0055 1645 1355 1945 2300 0130 1855 1150 0740 101524) 0950 0755 1840 1605 1740 0020 0045 1215 0820 2225 0855 0605
R e p ro d u c e d with perm iss ion of th e copyright ow ner. F u r th e r reproduction prohibited without perm iss ion .

Appendix D
Required Number of Observations for Desired Absolute Accuracy at 95% Confidence Level
92
R e p ro d u c e d with perm iss ion of th e copyright ow ner. F u r th e r reproduction prohibited without perm iss ion .
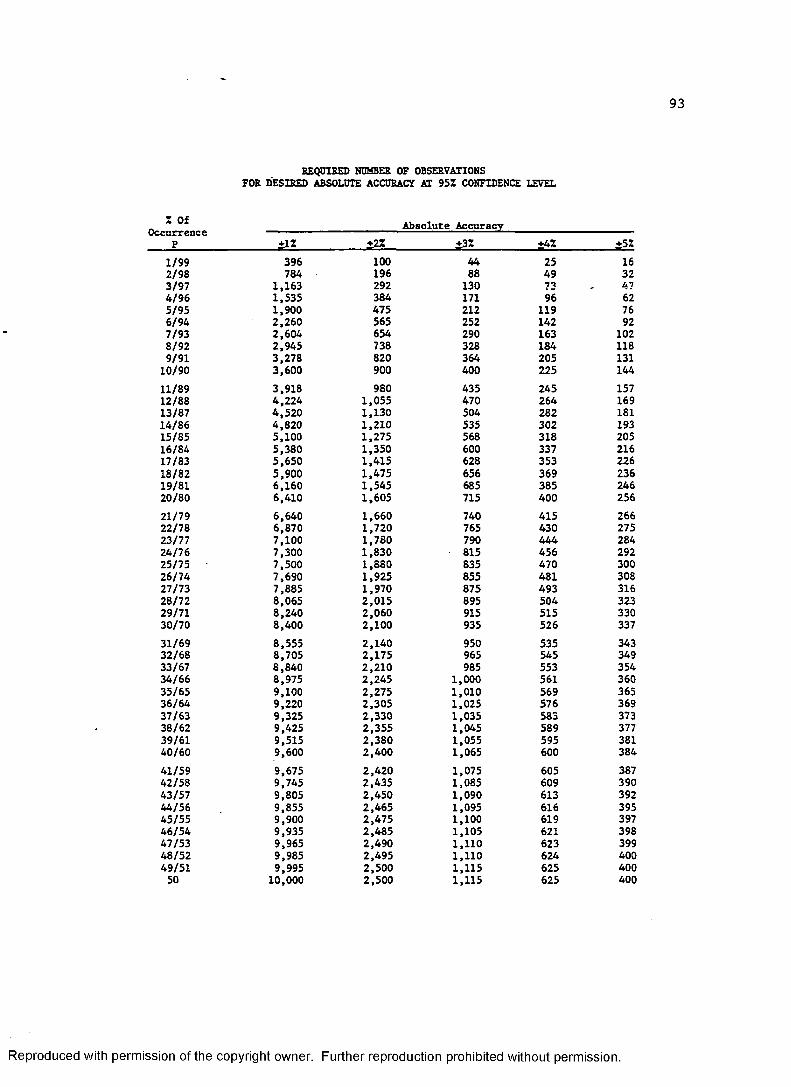
REQUIRED NUMBER OF OBSERVATIONS FOR DESIRED ABSOLUTE ACCURACY AT 95% CONFIDENCE LEVEL
93
Z Of Absolute AccuracyP ±12 ±2% ±32 ±4% +521/99 396 100 44 25 162/98 784 196 88 49 323/97 1,163 292 130 73 474/96 1,535 384 171 96 625/95 1,900 475 212 119 766/94 2,260 565 252 142 927/93 2,604 654 290 163 1028/92 2,945 738 328 184 1189/91 3,278 820 364 205 13110/90 3,600 900 400 225 14411/89 3,918 980 435 245 15712/88 4,224 1,055 470 264 16913/87 4,520 1,130 504 282 18114/86 4,820 1,210 535 302 19315/85 5,100 1,275 568 318 20516/84 5,380 1,350 600 337 21617/83 5,650 1,415 628 353 22618/82 5,900 1,475 656 369 23619/81 6,160 1,545 685 385 24620/80 6,410 1,605 715 400 25621/79 6,640 1,660 740 415 26622/78 6,870 1,720 765 430 27523/77 7,100 1,780 790 444 28424/76 7,300 1,830 815 456 29225/75 7,500 1,880 835 470 30026/74 7,690 1,925 855 481 30827/73 7,885 1,970 875 493 31628/72 8,065 2,015 895 504 32329/71 8,240 2,060 915 515 33030/70 8,400 2,100 935 526 33731/69 8,555 2,140 950 535 34332/68 8,705 2,175 965 545 34933/67 8,840 2,210 985 553 35434/66 8,975 2,245 1,000 561 36035/65 9,100 2,275 1,010 569 36536/64 9,220 2,305 1,025 576 36937/63 9,325 2,330 1,035 583 37338/62 9,425 2,355 1,045 589 37739/61 9,515 2,380 1,055 595 38140/60 9,600 2,400 1,065 600 38441/59 9,675 2,420 1,075 605 38742/58 9,745 2,435 1,085 609 39043/57 9,805 2,450 1,090 613 39244/56 9,855 2,465 1,095 616 39545/55 9,900 2,475 1,100 619 39746/54 9,935 2,485 1,105 621 39847/53 9,965 2,490 1,110 623 39948/52 9,985 2,495 1,110 624 40049/51 9,995 2,500 1,115 625 40050 10,000 2,500 1,115 625 400
R e p ro d u c e d with perm iss ion of th e copyright ow ner. F u r th e r reproduction prohibited without perm iss ion .
BIBLIOGRAPHY
Action Society Trust. Size and morale. London: AST, 1953.
Allen, D. Comparing productive activities at different times. Industrial Engineering, 1978, 10(3), 40-43.
Allen, L. Management and organization. New York: McGraw-Hill,1958.
Argyle, M., Gardner, G., & Cioffi, I. Supervisory methods related to productivity, absenteeism and labor turnover. Human Relations, 1958, n, 23-40.
Argyris, C. Personality and organization. New York: Harper,1957.
Armstrong, T. Job content and context factors related to satisfaction for different occupational levels. Journal of Applied Psychology, 1971, 57-65.
Ash, P. The SRA employee inventory: A statistical analysis.Personnel Psychology, 1954, 7̂, 319-336.
Baker, H., & France, R. Centralization and decentralization in industrial relations. Princeton: Industrial Relations Section,1954.
Balderston, C., Brecht, R., Karabasz, V., & Riddle, R. Management of an enterprise. New York: Prentice-Hall, 1949.
Bames, R. Work sampling. New York: John Wiley & Sons, 1957.
Bass, B. Organizational psychology. Boston: Allyn & Bacon, 1965.
Baumgartel, H., & Sobol, R. Background and organizational factors in absenteeism. Personnel Psychology, 1959, 1^, 431-443.
Belasco, J., & Alluto, J. Line-staff conflicts: Some empiricalinsights. Academy of Management Journal, 1969, 3̂ , 469-477.
Bell, G. Determinants of span control. American Journal of Sociology, 1967, 73, 100-109.
Benes, A. Stimulating greater employee commitment— Detroit Edison. In V. Buehler & Y. Shetty (Eds.), Productivity improvement : Casestudies in proven practice. New York: AMA, 1981.
94
R e p ro d u c e d with perm iss ion of th e copyright ow ner. F u r th e r reproduction prohibited without perm iss ion .

95Benge, E. How to learn what workers think of job and boss. Factory
Management and Maintenance, 1944, 102(5), 101-104.
Bennis, W. Leadership theory and administrative behavior: Theproblem of authority. Administrative Science Quarterly, 1959,4, 259-301.
Berger, C., & Cummings, L. Organizational structure, attitudes, andbehaviors. In B. Straw (Ed.), Research on organizational behavior. New York: JAI Press, 1978.
Best, M. Research in education. Englewood Cliffs, NJ: Prentice-Hall, 1970.
Blau, P. The hierarchy of authority in organizations. American Journal of Sociology, 1968, 73, 453-467.
Bossard, J. The law of family interaction. American Journal of Sociology, 1945, 50, 292-294.
Brayfield, A., & Crockett, W. Employee attitudes and employee performance. Psychological Bulletin, 1955, pp. 396-424.
Brisley, C. Work sampling. In H. Maynard (Ed.), Industrial engineering handbook. New York: McGraw-Hill, 1971.
Browne, C., & Neitzel, B. Communication supervision, and morale. Journal of Applied Psychology, 1952, 36, 86-91.
Browne, P., & Golembiewski, R. The line-staff concept revisited:An empirical study of organizational images. Academy of Management Journal, 1974, 17, 406.
Buehler, V., & Shetty, K. Productivity improvement: Case studies in proven practice. New York: AMA, 1981.
Burns, T. The directions of activity and communication in departmental executive group: A quantitative study in a Britishengineering factory with a self-recording technique. Human Relations, 1954, Jj» 73-97.
Campbell, H. Group incentive payment schemes : The effects of lack of understanding and of group size. Occupational Psychology, 1952, 26, 15-21.
Campbell, J. An attitude survey in a typical manufacturing firm. Personnel Psychology, 1948, 1̂, 31-39.
Centers, R. Motivational aspects of occupational stratification. Journal of Social Psychology, 1948, 187-217.
R e p ro d u c e d with perm iss ion of th e copyright ow ner. F u r th e r reproduction prohibited without perm iss ion .

96Centers, R., & Bugental, D. Intrinsic and extrinsic job motivations
among different segments of the working population. Journal of Applied Psychology, 1966, 50, 193-197.
Coombe, L., & Densmore, R. How Detroit Edison improves its productivity. Management Accounting, May 1982.
Correll, D., & Bames, R. Industrial application of the ratio-delay method. Advanced Management, 1950, 15(8), 10-12.
Cummings, L., & El Salmi, A. The impact of role diversity, job level and organizational size on managerial satisfaction. Administration Science Quarterly, 1970, 15, 1-10.
Dale, E. Planning and developing the company organization structure. New York: AMA, 1952.
Dalton, M. Conflicts between staff and line managerial officers. American Sociological Review, 1950, 15, 342-351.
Davis, K. Management communication and the grapevine. Harvard Business Review, 1953, 31(5), 43-49.
Davis, R. The fundamentals of top management. New York: Harper &Brothers, 1951.
Dodge, W. Productivity measures and performance evaluation. In H. Trebing (Ed.), Performance under regulation. East Lansing: Michigan State Graduate School, 1968.
Drucker, P. Concept of the corporation. New York: Day, 1946.
Drucker, P. Management: Tasks, responsibilities, practices -Hagerstown: Harper and Row, 1974.
Entwisle, D., & Walton, J. Observations on the span of control Administrative Science Quarterly, 1961, 2» 522-533.
Fayol, H. General principles of management. In D. S. Pugh (Ed.), Organization theory. New York: Penguin Books, 1977.
Filipetti, G. Operating results of manufacturing plants inMinnesota. Minneapolis: University of Minnesota Press, 1932.
Filley, A., House, R., & Kerr, S. Managerial process and organizational behavior. Glenview, IL: Scott Foresman, 1976.
Friedlander, F. Comparative work value systems. Personnel Psychology, 1965, 18, 1-20.
R e p ro d u c e d with perm iss ion of th e copyright ow ner. F u r th e r reproduction prohibited without perm iss ion .
97Galbraith, J., & Cummings, L. An empirical investigation of the
motivational determinants of task performance: Interactiveeffects between instrumentality-valence and motivation-ability. Organizational Behavior and Human Performance, 1967, 237-257.
Garfield, P., & Lovejoy, W. Public utility economics. Englewood Cliffs, NJ: Prentice-Hall, 1964.
Gay, L. Education research: Competencies for analysis and application. Columbus, OH: Merrill, 1981.
Georgopoulos, B., Mahoney, G., & Jones, N. A path-goal approach to productivity. Journal of Applied Psychology, 1957, 345-353.
Ghiselli, E., & Siegel, J. Leadership and managerial success in tall and flat organization structures. Personnel Psychology, 1972, 617.
Gibson, G., Ivancevich, J., & Donnelly, J. Organization, behavior, structure, processes. Dallas, TX: Business Publications, 1973.
Gillmore, R. A practical manual of organization. New York: Funk& Wagnalls, 1948.
Ginzberg, E., & Reilley, E. Effecting change in large organizations . New York: Columbia University Press, 1957.
Givens, W . Bottom-up management; People working together.New York: Hapen, 1949.
Glaeser, M. Public utilities in American capitalism. New York: Macmillan, 1957.
Gluskinos, U., & Kestelman, B. Management and labor leaders' perception of worker needs as compared with self-reported needs. Personnel Psychology, 1971, 24, 239-246.
Goldner, A. Cosmos and locals: Toward an analysis of latentsocial roles, I. Administrative Science Quarterly, 1957, 2» 244-280.
Goldner, A., & Ritti, R. Professionalization as career immobility. American Journal of Sociology, 1967, _72, 489-502.
Gregerman, I. The productivity measurement of construction labor using work sampling. In American association of cost estimators transactions, 1981.
Hage, J. An axiomatic theory of organization. Administrative Science Quarterly, 1965, 10, 289-320.
R e p ro d u c e d with perm iss ion of th e copyright ow ner. F u r th e r reproduction prohibited without perm iss ion .
98Haire, M. Psychology in management. New York: McGraw-Hill, 1956.
Haire, M., Ghiselli, E., & Porter, L. Cultural patterns in the role of the manager. Industrial Relations, 1963, 95-117.
Hamner, W., & Tosi, H. Relationships of role conflict and role ambiguity to job involvement measures. Journal of Applied Psychology, 1974, 497-499.
Handyside, J. Satisfactions and aspirations. Occupational Psychology, 1961, 35, 213-244.
Hansen, B. Work sampling for modem management. Englewood Cliffs,NJ: Prentice-Hall, 1960.
Helwig, J., & Council, K. SAS users guide. Raleigh, NC: The SASInstitute, 1979.
Herbst, P. Measurement of behavior structure by means of input- output data. Human Relations, 1957, 335-346.
Herman, J., & Hulin, C. Managerial satisfactions and organizational roles: An investigation of Porter's need deficiency scales.Journal of Applied Psychology, 1973, 57, 118-124.
Herzberg, F., Mausner, B., Peterson, R., & Capwell, D. Job attitudes: Review of research and opinion. Pittsburgh: Psychological Service of Pittsburgh, 1957.
Hewitt, D., & Parfitt, J. A note on working morale and size of group. Occupational Psychology, 1953, 27, 38-42.
Hicks, H., & Gullett, R. The management of organizations. New York: McGraw-Hill, 19 76.
Hinkle, D., Wiersma, W., & Jurs, S. Applied statistics for the behavioral sciences. Boston: Houghton Mifflin, 1979.
Hinrichs, J. Where has all the time gone? Personnel, 1976, 53(4),44-49.
Holland, T. Organizational structure and institutional care.Journal of Health and Social Behavior, September 1973, pp. 241- 247.
Hollander, E., & Hunt, R. Current perspectives in social psychology. New York: Oxford, 1967.
House, R., & Miner, J. Merging management and behavioral theory:The interaction between span of control and group size.Administrative Science Quarterly, 1969, 14, 451-464.
R e p ro d u c e d with perm iss ion of th e copyright ow ner. F u r th e r reproduction prohibited without perm iss ion .

99Hull, R., & Kolstad, A. Morale on the job. In G. B. Watson (Ed.),
Civilian morale. New York: Houghton Mifflin, 1942.
Indik, B. Organizational size and member participation: Someempirical tests of alternative explanations. Human Relations, 1965, 2 ^ , 339-350.
Indik, B., & Seashore, S. Effects of organizational size on members' attitudes and behavior. Ann Arbor: University ofMichigan Survey Research Center, 1961.
Ingham, G. Size of industrial organization and worker behavior. Cambridge: Cambridge University Press, 1970.
lulo, W. Problems in definition and measurement of superior performance under regulation. In H. Trebing (Ed.), Performance under regulation. East Lansing: Michigan State School ofBusiness Administration, 1968.
Johnson, P., & Marcrum, R. Perceived deficiencies in individual need fulfillment of career army officers. Journal of Applied Psychology, 1968, 457-461.
Karger, D., & Bayha, F. Engineered work measurement. New York: Industrial Press, Inc., 1977.
Katz, D. Morale and motivation in industry. In W. Dennis (Ed.), Current trends in industrial psychology. Pittsburgh : University of Pittsburgh Press, 1949. Pp. 145-171.
Katz, D., & Kahn, R. The social psychology of organization.New York: Wiley and Sons, 1966.
Katzell, R., Barrett, R., & Parker, T. Job satisfaction, job performance, and situational characteristics. Journal of Applied Psychology, 1961, 65-72.
Kelly, H., & Thibaut, J. Experimental studies of group problem solving and process. In G. Lindzey (Ed.), Handbook of social psychology (Vol. 2). Cambridge, MA: Addison-Wesley, 1954.Pp. 735-785.
Kerlinger, F. Foundations of behavioral research. New York:Holt, Rinehart & Winston, 1973.
Kerr, W., Koppelmeier^ G., & Sullivan, J. Absenteeism, turnover and morale in a metals fabrication factory. Occupational Psychology, 1951, 2̂ , 50-55.
Khandwalla, P. The design of organizations. New York: HarcourtBrace Jovanovich, 1977.
R e p ro d u c e d with perm iss ion of th e copyright ow ner. F u r th e r reproduction prohibited without perm iss ion .
100Kolstad, A. Attitudes of employees and their supervisors.
Personnel, 1944, 20, 241-250.
Koontz, H., & O'Donnell, C. Principles of management. New York: McGraw-Hill, 1968.
Koontz, H., & O'Donnell, C. Principles of management. New York: McGraw-Hill, 1972.
Kover, A. Reorganizing in an advertising agency: A case study ofa decrease in integration. Human Organization, 1963, 2 ^ , 252- 259.
Kulonda, D. Method measures productivity in non-traditional work situations. Industrial Engineering, 1981, 13(7), 34-37.
Lawler, E., & Porter, L. The effect of performance on job satisfaction. Industrial Relations, 1967, _7, 20-28.
Leavitt, H. Managerial psychology. Chicago: Chicago Press, 1958.
Lichtman, C. Some intrapersonal response correlates of organizational rank. Journal of Applied Psychology, 1970, 54(1), 77-80.
Likert, R. New patterns of management. New York: McGraw-Hill,1960.
Litzinger, W. Entrepreneurial prototype in bank management.Academy of Management Journal, 1963, ^(1), 36-45.
Locke, A., & Whiting, R. Sources of satisfaction and dissatisfaction among solid waste management employees. Journal of Applied Psychology, 1974, 59(2), 143-156.
March, J., & Simmon, H. Organizations. New York: Wiley, 1958.
Marriott, R. Size of working group and output. Occupational Psychology, 1949, 47-57.
Marschak, J. Efficient and viable organizational forms. InM. Haire (Ed.), Modem organizational theory. New York: Wiley,1959. Pp. 307-320.
Maslow, A. H. A theory of human motivation. Psychological Review, 1943, 370-396.
Maslow, A. H. Motivation and personality. New York: Harper andBrothers, 1954.
Mayo, E. The human problems of an industrial organization.New York: Viking Press, 1960.
R e p ro d u c e d with perm iss ion of th e copyright ow ner. F u r th e r reproduction prohibited without perm iss ion .

101Meltzer, H., & Mann, F. Employee attitudes and absences. Personnel
Psychology, 1953, 467-485.
Meltzer, L., & Salter, J. Organizational structure and the performance of job satisfaction of physiologists. American Sociological Review, 1962, 27, 351-362.
Meyers, M. Who are your motivated workers? Harvard Business Review, 1964, ^(1), 73-88.
Meyers, M. Expertness and the span of control. American Sociological Review, 1968, 33, 944-951.
Miller, E. Job satisfaction of national union officials. Personnel Psychology, 1966, ]̂ , 261-275.
Molnar, J., & Rogers, D. Organizational effectiveness: An empirical comparison of the goal and system resource approaches. The Sociological Quarterly, 1976, ]J, 401-413.
Morse, N. Satisfactions in the white-collar job. Ann Arbor: University of Michigan, 1953.
Mott, P. The characteristics of effective organizations. New York: Harper and Row, 1972.
Naisbitt, J., & Hallett, J. Changing times and productivity challenges. Electric Perspectives, Summer 1980, pp. 29-37.
Nance, H., & Nolan, R. Office work measurement. New York: McGraw-Hill, 1971.
Opinion Research Corporation. Motivating managers. Princeton:ORC, 1962.
Osbom, R., & Hunt, J. Relationship between leadership, size and subordinate satisfaction in a voluntary organization. Journal of Applied Psychology, 1975, 60_, 730-735.
Ouchi, W., & Dowling, J. Defining the span of control. Administrative Science Quarterly, 1974, 19, 357-365.
Parr, J. Relationship of organizational structure to worker satisfaction in agri-business organizations. Unpublished doctoral dissertation, Cornell University, 1973.
Parsons, T. The social system. Glencoe, IL: Free Press, 1951.
Pfiffner, J., & Sherwood, F. Administrative organization. New York: Prentice-Hall, 1960.
R e p ro d u c e d with perm iss ion of th e copyright ow ner. F u r th e r reproduction prohibited without perm iss ion .
102Phillips, C. The economics of regulation. Homewood, IL; Irwin,
1969.
Porter, L. A study of perceived job satisfactions in bottom and middle .management jobs. Journal of Applied Psychology, 1961,
1-10.Porter, L. Job attitudes in management: I. Perceived deficiencies
in need fulfillment as a function of job level. Journal of Applied Psychology, 1962, 46, 375-384.
Porter, L. Job attitudes in management: I. Perceived deficienciesin need fulfillment as a function of line vs. staff type of job. Journal of Applied Psychology, 1963, 47, 30-34.
Porter, L., & Henry, M. Job attitudes in management : Perceptionsof the importance of certain personality traits as a function of job level. Journal of Applied Psychology, 1964, 48, 31-36.
Porter, L., & Lawler, E. Properties of organization structure in relation to job attitudes and job behavior. Psychological Bulletin, 1965, ^(1), 23-51.
Porter, L., & Lawler, E. Managerial attitudes and performance. Homewood, IL: Irwin-Dorsey, 1968.
Porter, L., & Mitchell, V. Comparative study of need satisfactions in military and business hierarchies. Journal of Applied Psychology, 1967, 139-144.
Price, J. Organizational effectiveness: An inventory of proposition. Homewood, IL: Irwin, 1968.
Reissman, L. A study of role conceptions in bureaucracy. Social Forces, 1949, 27, 305-310.
Revans, R. Human relations, management and size. In E. M. Hugh- Jones (Ed.), Human relations and modern management. Amsterdam: North Holland Publishing, 1958. Pp. 177-220.
Rhinehart, J., Barrell, R., DeWolfe, A., Griffin, J., & Spaner, F. Comparative study of need satisfactions in governmental and business hierarchies. Journal of Applied Psychology, 1969, 53, 230-235.
Ritti, R. The engineer in the industrial corporation. New York: Columbia University Press, 1971.
Rizzo, J., House, R., & Lirtzman, S. Role conflict and ambiguity in complex organizations. Administrative Science Quarterly,1970, 15, 150-163.
R e p ro d u c e d with perm iss ion of th e copyright ow ner. F u r th e r reproduction prohibited without perm iss ion .

103Rosen, H. Managerial role interaction: A study of three manage
rial levels. Journal of Applied Psychology, 1961, 30-34.
Rosen, H., & Weaver, C. Motivation in management: A study of fourmanagerial levels. Journal of Applied Psychology, 1960, 44, 386-392.
Schneider, J., & Locke, E. A critique of Herzberg's incidentclassification system and a suggested revision. Organizational Behavior and Human Performance, 1971, 441-457.
Schonner, B., & Harrell, T. The questionable dual ladder.Personnel, 1965, 53-57.
Schriescheim, J., Von Glinow, M., & Kerr, S. The dual hierarchy:A review of the evidence and a theoretical alternative. In Proceedings of the twelfth annual conference. Eastern Academy of Management, 1975.
Selznick, P. T.V.A. and the grass-roots: A study in the sociologyof formal organization. Berkley: University of CaliforniaPress, 1949.
Shuler, R., & Shaller, P. Role conflict, role ambiguity and job satisfaction and employee performance: A reconciliation ofprevious research. Working paper. The Cleveland State University, 1974.
Simmel, G. The number of members as determining the sociological form of the group. American Journal of Sociology, 1902,1-46; 158-196.
Sloan, A. My years with General Motors, New York: Doubleday,1964.
Slocum, J. Motivation in managerial levels: Relationship of needsatisfaction to job performance. Journal of Applied Psychology, 1971, 55, 312-316.
Smith, G. Managing geographically decentralized companies. Boston: Harvard University, Graduate School of Business Administration, Division of Research, 1958.
South, E. Some psychological aspects of committee work. Journal of Applied Psychology, 1927, 348-68; 437-64.
Stieglitz, J. Optimizing span of control. Management Review, 1962, 25-29.
Strauss, G., & Sayles, L. Personnel: The human problems of management. Englewood Cliffs, NJ: Prentice-Hall, 1960.
R e p ro d u c e d with p erm iss ion of th e copyright ow ner. F u r the r reproduction prohibited without perm iss ion .

104Strawser, R., Ivancevich, J., & Lyon, H. A note on the job satis
faction of accountants in large and small CPA firms. Journal of Accounting Research, 1969, _7, 339-345.
Suojanen, W. The span of control: Fact or fable? AdvancedManagement, 1955, 4-13.
Szilagyi,A., Sims, H., & Keller, R. Role dynamics, locus of control, and employee attitudes and behavior. Academy of Management Journal, 1976, 19, 259-276.
Tallacchi, S. Organization size, individual attitudes and behavior: An empirical study. Administrative Science Quarterly, 1960, 2* 398-420.
Tannenbaum, A. A study of the League of Women Voters of the UnitedStates. Ann Arbor: Survey Research Center, University ofMichigan, 1957.
Tannenbaum, R., & Massarik, F. Participation by subordinates in the managerial decision-making process. The Canadian Journal of Economics and Political Science, August 1950, pp. 408-418.
Taylor, F. Scientific management. New York: Harper and Row, 1947.
Thomas, E., & Fink, C. Effects of group size. In L. L. Cummings& W. E. Scott (Eds.), Readings in organizational behavior and human performance. Homewood, IL: Irwin, 1969.
Tuckman, B. Conducting educational research. New York: HarcourtBrace Jovanovich, 1972.
Udell, J. An empirical test of hypotheses relating to span of control. Administrative Science Quarterly, 1967, 3̂ , 420-439.
Urwick, L. Scientific principles and organization. New York:AMA, 1938.
Urwick, L. The span of control: Some facts about the fable.Advanced Management, 1956, 21, 5-15.
Urwick, L. V. A. Graicunas and the span of control. Academy of Management Journal, 1974, 17, 349-354.
Viteles, M. Motivation and morale in industry. New York: Norton,1953.
Warwick, D., & Lininger, C. A sample survey: Theory and practice.New York: McGraw-Hill, 1975.
R e p ro d u c e d with perm iss ion of th e copyright ow ner. F u r th e r reproduction prohibited without perm iss ion .

105Weiss, E. Relation of personnel statistics to organization struc
ture. Personnel Psychology, 1957, 1£, 27-42.
Weiss, W. How to work sample your people. Administrative Management, July 1980, pp. 36-38.
Whetten, D. Coping with incompatible expectations: An integratedview of role conflict. Administrative Science Quarterly, 1978,
254-271.
Woodward, J. Management and technology. London: Her Majesty’sStationery Office, 1958.
Worthy, J. Organizational structure and employee morale. American Sociological Review, 1950, 15, 169-179.
Zojonc, R., & Wolfe, D. Cognitive consequences of a position in a formal organization. Human Relations, 1966, 139-150.
R e p ro d u c e d with perm iss ion of th e copyright ow ner. F u r th e r reproduction prohibited without perm iss ion .