Embed Size (px)
Citation preview

A Descriptive Analysis of a Nursing Home Clinical Information System with Decision Support 1
A Descriptive Analysis of a Nursing Home
Clinical Information System with
Decision Support
by Gregory L. Alexander, PhD, RN
Abstract
Clinical information systems are absent in most nursing homes. Therefore, the vast numbers of
elderly people who reside in the facilities are not reaping the benefits that these systems are thought to
have, including better management of chronic conditions, greater efficiencies, and improved access to
information. It is important for early adopters of nursing home information systems to share experiences
to foster implementation of other systems and improve design and evaluation of these systems. The
purpose of this study is to describe the activity of clinical decision support alerts and associated triggers
during an analysis of an information system implemented in three nursing homes. The proportion of
triggers used for each active alert in each alert category is described across resident diagnoses within the
nursing home decision support system during six months of data collection.
Key Words
Nursing home, technology, clinical decision support, quality of care
Introduction
Leading healthcare organizations have stressed the importance of integrating information technology
(IT) into healthcare systems to improve provider practices, increase the quality of patient care, and reduce
medical errors.1, 2
One missing link plaguing the deployment of technology into healthcare is how to
incorporate practical, usable clinical information systems into the work environment of providers.3 This
missing link is most evident in the organizational structure of nursing homes.4
Clinical IT systems are absent in most nursing homes; however, a few homes are implementing
highly sophisticated technology into their workflow to support resident management, enhance clinical
support services, and improve administrative oversight.5, 6
Describing the experiences of early adopters of
clinical IT provides detail about successes and failures for those who adopt these systems later. Sharing
this knowledge results in convergence of IT design and practice, better management and rollout of
information systems in these settings, more effective IT leadership, and better-defined strategies for
technology evaluation, system use, and outcome measurement.7

2 Perspectives in Health Information Management 5; 12; Summer 2008
Improvements in nursing home care quality cannot be expected until IT is implemented that provides
accurate measures of the actual care provided to residents.8 Clinical data stored in an information system
assists us to define the type of care documented and perhaps delivered to residents of the nursing home.
Analyses of alert and trigger frequencies in decision support systems have important implications. For
example, triggers or alerts with higher frequencies would be an important focus during implementation if
limited resources were available to address the alerts; additionally, alerts or triggers associated with more
positive resident outcomes would also be an important focus for quality and risk management oversight.
The purpose of this study was to describe the activity of clinical decision support alerts and associated
triggers using data gathered during an analysis of an information system called OneTouch Technology
(now Optimus EMR, Inc.) that was implemented in three nursing homes. The proportion of triggers for
each active alert in each alert category is described across resident diagnoses within the nursing home
decision support system during six months of data collection.
Within this study, an alert is defined as a clinical decision support mechanism that automatically
sends an automated message to an end user; the trigger is the mechanism, (including logic) that generates
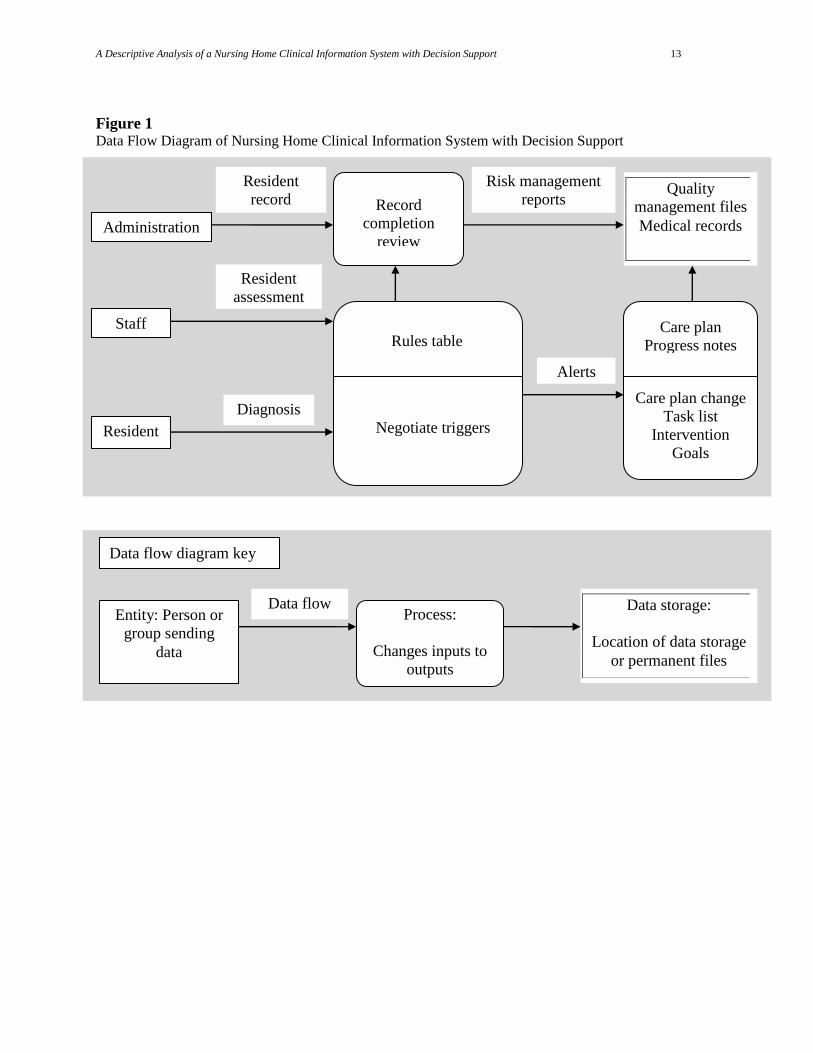
the alert sent to the end user as notification of a potential patient problem. Figure 1 illustrates the
relationships between the alerts (automated messages) and triggers (set of rules that negotiate clinical
assessments) that generate clinical alerts if a rule is satisfied. Alert categories included the following:
dehydration
constipation
skin integrity
weight loss
weight gain
decline in condition
improvement in condition
A trigger is a predetermined criterion within the resident assessment data that is used to make a
clinical alert active. Table 1 describes the clinical alerts and associated triggers within the resident
assessment data in the OneTouch system at the time of this evaluation. Triggers are used by clinicians to
identify new resident conditions or changes in existing conditions. In response, alert frequencies may rise
if triggers are repetitively used or fall if triggers are not selected by the staff. Rising alert frequencies can
lead to alert fatigue, resulting in decreased user responsiveness to the alerts.
In this study, alerts and triggers can indicate either positive (improvement in condition) or negative
(decline in condition) resident changes. For example, in this decision support system, a dehydration alert
is sent to a provider if an episode of bowel incontinence, fever, insufficient fluid intake, or emesis is
reported within a 24-hour period (Table 1). Additionally, a dehydration alert is issued if 25 percent or
more of food is left uneaten at meals. In contrast, some alerts in this system are based on significant
changes documented by providers on successive clinical assessments rather than episodic events. A
decline in condition alert is sent to an end user if the ability to make decisions declines over two
successive minimum data set (MDS) assessments (see Table 1). MDS assessments are specialized
assessments required to be performed at admission, quarterly, and in the event of a significant change in
condition for any nursing home resident.
Research Question
Clinical IT in nursing homes is expected to facilitate management of chronic conditions, support the
delivery of effective patient care, and improve efficiency by avoiding waste of equipment, supplies, and
energy.9 Potential uses of IT in nursing homes include the use of clinical decision support mechanisms at
the point of care to make the most appropriate treatment options available for providers, increase
accessibility of evidence-based protocols specific for nursing home residents, enhance data collection, and

A Descriptive Analysis of a Nursing Home Clinical Information System with Decision Support 3
allow more rigorous analysis of outcomes.10
In this study, investigators sought to determine the frequency
and types of triggers in active alerts in a clinical decision support system for residents with specified
diagnoses during six months of data collection. The research question was as follows:
What is the proportion of triggers for each active alert in each alert category within and across
resident diagnoses?
Background
A resident in a nursing home receives care from a multitude of providers including physicians, nurses,
nurse’s aides, medical technicians, physical therapists, dieticians, and others. All of these professionals
provide necessary treatments, education, and assessments that are recorded in medical records. The
motivation for developing clinical information systems in these settings is to allow multiple stakeholders
to have access to patient information from anywhere in order to make the best possible decisions about
resident care. The goal of the clinical information system with decision support is to facilitate multiple,
coordinated, asynchronous interactions between providers while enhancing decision making through
better artificial intelligence; to coordinate resident data from all the sources listed; and to organize the
data to facilitate explicit decision support for computer-mediated evidence-based care.11
The data flow diagram in Figure 1 shows the relationships between the entities (persons, places,
things, and events) in a nursing home clinical information system with decision support. A data flow
diagram groups data into entities, or objects that exist and are distinguishable from other objects, lists the
relationships between those entities, and illustrates how data is maintained and stored.
The rectangles in Figure 1 represent names of entities. The data flow, or the movement of data
collected by each entity, is illustrated by the solid line between two entities; the name of the data flow is
given above the line. In this study, the frequency of documentation of clinical assessment data, triggers,
and alerts is evaluated. The staff provides important clinical data about residents that populate the
electronic fields in the resident assessment. When the data is entered into the clinical information system,
the internal decision support system negotiates the rules table, comparing the clinical data to evidence-
based protocols that are part of the rules table. When the clinical data and evidence-based protocols don’t
match, an alert with a time and date stamp notifies the staff of the change in condition. In theory, these
alerts should then prompt the staff to take action, which should be documented in care plans, daily
progress notes, task lists generated by the staff to direct care delivery, interventions performed by staff
members, and progress made toward resident goals.
Method
Selection and description of participants
The three nursing homes in this study were participants in a more comprehensive study to investigate
the use of a point-of-care clinical information system (provided by the OneTouch Technology) to
demonstrate how IT can improve quality of care.12
All procedures were approved by the university’s
Institutional Review Board before the study began. Data obtained during this study included all patient
care data recorded by the nursing home staff in each of the three facilities, starting six months after
implementation and ending 12 months after implementation. Facility and resident characteristics are
shown in Table 2.
The evaluation study used a stratified purposive approach to recruit facilities. Facility size was taken
into account during the recruitment phase. Additionally, nursing home facilities representing profit, not-
for-profit, and governmental ownership structures were represented. Resident characteristics of the
facilities around the time of the study are described using Nursing Home Compare data downloaded from
the Centers for Medicare and Medicaid Services national database during the first quarters of 2004 and
2005, as shown in Table 2.

4 Perspectives in Health Information Management 5; 12; Summer 2008
Nursing home technology
The OneTouch system provided point-of-care technology that enabled healthcare providers to access
and enter resident information outside of confined nursing stations. Few nursing homes have incorporated
integrated clinical information systems into their clinical practices to support clinical practice, enhance
clinical support between different providers (laboratory, physical therapy, social services, etc.), and
provide better administrative oversight.13
The point-of-care modules in the OneTouch system integrated
specialized technology that facilitated electronic tracking of resident care, provided personal digital
assistants for data entry, and used wireless remote technology to enable wider access to patient data and
decision making. Benefits and limitations of this technology have been described previously, including
the ability to track resident care back to providers and the ability to view resident care from many places
in the facility.14
At the time of this study, integrated systems used by the nursing home staff included
clinical alerts, provider-to-provider messages, nurse assistant task lists, care plan items, treatments,
electronic medication administration, and more.
Clinical alerts and triggers
Automated clinical alerts in the OneTouch system assist in identifying when a resident might be
experiencing constipation, dehydration, a skin integrity change, weight loss, weight gain, or other changes
in condition. Each alert mechanism has a specific alert calculation. Alert calculations incorporate triggers
selected by the staff during a resident assessment that defines current clinical conditions (see Table 1).
Triggers are identified and alerts become active when data collected by the nursing home staff at the point
of care are combined with detailed data elements from resident assessment data into a relational database.
Immediate access to this database through electronic information displays and system reports can be used
to manage resident care activities more quickly and efficiently.
Data collection procedures
Resident data were collected during the six-month period noted in Table 2 at each of the nursing
homes. The data from each of the nursing homes were received on a preformatted hard disk and loaded
into an Access (v. 2003) database for analysis. Before data were provided for analysis, all resident and
facility identifying information was removed; fictitious unique facility and resident identifiers were
assigned in the dataset to replace nursing home and resident names.
Statistics
The OneTouch dataset was queried daily for six months to identify the types of alerts activated and
triggers selected for each facility. While controlling for specific categories of alerts and the primary
resident diagnosis, descriptive statistics were used to identify trends in trigger frequencies for active alerts
in each alert category during the six-month period. Each alert category and patient diagnosis was given a
unique dummy-coded variable to allow them to be manipulated in the dataset. The frequencies and types
of triggers associated with active alerts for each diagnosis type were determined and will be reported here.
All statistical analysis was performed using SPSS version 14.0 and Excel.
Results
Alert activity at the facility level
Initial daily queries of active alert data were evaluated to observe patterns at the facility level. The
investigator assumed that there would be significant variability among daily alert frequencies based on the
diversity of care delivered to residents, changes in chronic conditions, and complexity of care.15
However,
contrarily, little to no variation in alert frequencies was noted during the analysis period in all three
facilities.
In Facility A, during the first 10 days no active alerts or triggers were documented for dehydration,
decline in condition, weight loss, or weight gain; conversely, on a consistent daily basis there were 136

A Descriptive Analysis of a Nursing Home Clinical Information System with Decision Support 5
constipation alerts, three skin integrity alerts, and 40 improvement in condition alerts. Similarly from day
21 of the fourth month to the last day of the sixth month, all alert counts were the same. From day 11 of
the first month to day 20 of the fourth month, there was variable activity in all alert categories.
There was frequent variability in Facility B beginning day one of the first month and continuing to
day 25 of the second month, when suddenly all daily alert totals for each category became consistently the
same. In Facility C, total active daily alerts remained consistent during the entire six-month period of data
collection. In facility C no active alerts occurred for the entire period for skin integrity, dehydration, or
decline in condition. Consistently, daily active alert totals were 83 and 18 throughout the six months.
As a result, only active alerts and associated triggers from day 11 of the first month to day 20 of the
fourth month in Facility A and day 1 of the first month to day 24 of the second month in Facility B were
included in this analysis, for a total of 155 days of alert activity. Since no variability in the alerts was
noticed in Facility C, data from that facility were not used. For more results and discussion of alert
frequencies and potential reasons for these findings, see other studies by this investigator.16–18
The
remainder of this section discusses the trigger frequencies associated with these active alerts and the types
of resident diagnoses they were associated with.
Trigger frequencies by resident diagnosis
A total of 172 residents with eight primary diagnoses were included in this analysis (see tables 3–10).
The largest category (52 percent) included 89 residents who had ventilation pneumonitis as their primary
diagnosis. These residents had nearly 17,000 triggers selected by the staff during the 155 clinical days
considered in this evaluation (see Table 3). The most frequent trigger within this category was related to
the amount of food left uneaten, which resulted in an active dehydration alert. The proportion of food left
uneaten was vigilantly documented by the staff; this trigger, which was associated with the dehydration
alert, was in the top two of all triggers for every resident diagnosis. Its use ranged from 39.73 in residents
with ventilation pneumonitis (Table 3) to 21.92 percent in residents with osteoarthritis (Table 9).
A large number of residents in the sample had neurological issues. Residents with Alzheimer’s
disease (Table 4) represented 7.5 percent of cases. Dietary intake, continence, positioning, and emotional
level were some of the most frequent triggers selected for this group of residents. Other important
triggers, although selected less frequently in this class of residents, were the changing level of locomotion
on and off the unit and the ability to walk in corridors.
Eighteen residents in this study had experienced cerebral vascular accidents (CVAs) (Table 5).
Amount eaten at meals (28.79 percent), urinary continence (21.58 percent), and hydration status (5.87
percent) were the most frequently selected triggers for residents with CVAs. Twenty residents with a
dementia diagnosis (Table 6) had 9263 triggers selected during the study period; 29 percent were for
bladder incontinence, which related to the skin integrity alert. Bladder incontinence was also the most
frequently selected trigger (26.89 percent) in residents with osteoarthritis (Table 9). Bladder incontinence
is another assessment parameter that seems to be monitored closely. Bladder incontinence was the second
most frequent trigger selected in residents with Alzheimer’s disease, hypertension, cerebral vascular
accidents, pneumonia, and depressive disorders.
A smaller number of residents (seven) in this study were experiencing a depressive disorder (Table
7). Again, dietary intake at meals and bladder incontinence were observed most frequently by the staff for
residents with this diagnosis. The staff also documented other individualized assessments in this group of
residents, including the ability to make decisions, performance of personal hygiene measures, and
increased or decreased dressing, which all related to the clinical alert of improvement or decline in
condition.
A wider range of assessments were selected by the staff for the 11 residents who had a primary
diagnosis of hypertension (Table 8). Although the majority of the triggers indicated that residents left
their meals uneaten and were incontinent, other important information documented for these residents

6 Perspectives in Health Information Management 5; 12; Summer 2008
included locomotion, walking and transferring activities, changes in behavioral symptoms, amount of
toilet use, and ability to make decisions.
The most frequent triggers selected in the residents with osteoarthritis were related to bladder and
bowel incontinence, the maintenance of turning and repositioning programs, and mobility (Table 9).
Emotional levels, personal hygiene, and ability to make decisions were also part of these residents’
individualized assessments.
For the residents with pneumonia (Table 10), dietary intake, continence, mobility, and maintenance of
proper positioning accounted for the majority of computerized triggers selected. Less frequently,
assessments regarding changes in their overall condition and self-care abilities were documented.
The percentages of weight gain and weight loss were documented less frequently for residents under
each diagnosis. Weight loss and gain was documented in the system as a percentage of total weight.
Weight loss of 3.5 percent of the resident’s total body weight over 30 days or 7 percent over 180 days
resulted in an active alert. Weight gain of greater than 3.5 percent of the resident’s total body weight over
30 days or 7 percent over 180 days resulted in an active alert.
Discussion
Anecdotal evidence during the evaluation and implementation of the decision support system
indicated that the nursing home staff accepted the technology, although some staff members did not.19
Important factors shaping use of the system included staff perception of how the system functioned,
resources available to assist with trouble-shooting of system problems, equipment availability, and
preparation for the process change. In regard to system functioning, staff members indicated they were
not always aware of where alert messages existed in the system and how to address them once they found
them. For example, the staff members were not able to tell which triggers were responsible for activating
an alert; therefore, they did not know how to respond appropriately to an active alert. Resources and
equipment availability were important for maintaining integrity of the data. Staff members indicated if
there was not enough equipment, they didn’t document care given. Finally, the staff was frustrated and
confused by the lack of standardization of terminologies during the conversion process, which in some
facilities resulted in necessary care being omitted. In decision-support systems, accuracy of alerts is
dependent on data integrity, responsiveness to resident needs, and consistent documentation about
resident assessments and care delivered. Therefore, it is vital to conduct ongoing evaluation of these
systems to determine the effect of usage on resident care outcomes.
By far, the most frequently documented assessment parameters were related to dietary intake,
continence, hydration status, and maintenance of positioning programs. Given the percentages of
residents and their conditions reported in the Nursing Home Compare dataset for 2004 and 2005 (Table
2), finding greater documentation of these types of assessments is not really that surprising. During the
time this study was conducted, a significant number of incontinent residents were present, including low-
risk residents who lost control of their bowel or bladder (30–80 percent), while very few residents (1–10
percent) had a catheter inserted and/or left in their bladder. Another contributing factor was that large
numbers of residents experienced mobility problems and required more help performing their activities of
daily living (see Table 2). Residents with these types of needs require more help getting to and from
meals that provide adequate nourishment and prevention of dehydration.
The consistent maintenance of a positioning program to ensure that skin remained intact was also
frequently not documented by the staff, resulting in more frequent skin integrity alerts. One consistent
observation across the facilities is the decline of the percentage of high-risk residents with pressure ulcers
from year one to year two (Table 2). The purpose of this study was not to empirically test the effect of
clinical information systems on resident outcomes; however, it is certainly worth noting that increased
reminders to all staff members at the point of care regarding positioning draws attention to these
A Descriptive Analysis of a Nursing Home Clinical Information System with Decision Support 7
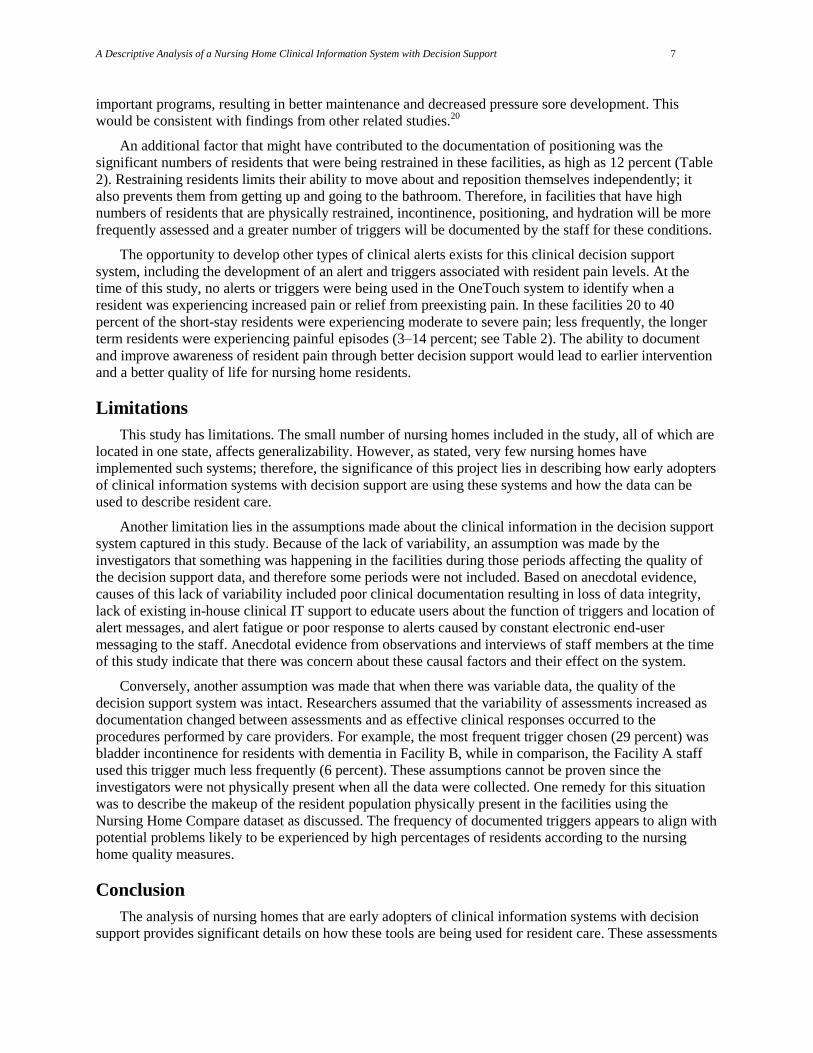
important programs, resulting in better maintenance and decreased pressure sore development. This
would be consistent with findings from other related studies.20
An additional factor that might have contributed to the documentation of positioning was the
significant numbers of residents that were being restrained in these facilities, as high as 12 percent (Table
2). Restraining residents limits their ability to move about and reposition themselves independently; it
also prevents them from getting up and going to the bathroom. Therefore, in facilities that have high
numbers of residents that are physically restrained, incontinence, positioning, and hydration will be more
frequently assessed and a greater number of triggers will be documented by the staff for these conditions.
The opportunity to develop other types of clinical alerts exists for this clinical decision support
system, including the development of an alert and triggers associated with resident pain levels. At the
time of this study, no alerts or triggers were being used in the OneTouch system to identify when a
resident was experiencing increased pain or relief from preexisting pain. In these facilities 20 to 40
percent of the short-stay residents were experiencing moderate to severe pain; less frequently, the longer
term residents were experiencing painful episodes (3–14 percent; see Table 2). The ability to document
and improve awareness of resident pain through better decision support would lead to earlier intervention
and a better quality of life for nursing home residents.
Limitations
This study has limitations. The small number of nursing homes included in the study, all of which are
located in one state, affects generalizability. However, as stated, very few nursing homes have
implemented such systems; therefore, the significance of this project lies in describing how early adopters
of clinical information systems with decision support are using these systems and how the data can be
used to describe resident care.
Another limitation lies in the assumptions made about the clinical information in the decision support
system captured in this study. Because of the lack of variability, an assumption was made by the
investigators that something was happening in the facilities during those periods affecting the quality of
the decision support data, and therefore some periods were not included. Based on anecdotal evidence,
causes of this lack of variability included poor clinical documentation resulting in loss of data integrity,
lack of existing in-house clinical IT support to educate users about the function of triggers and location of
alert messages, and alert fatigue or poor response to alerts caused by constant electronic end-user
messaging to the staff. Anecdotal evidence from observations and interviews of staff members at the time
of this study indicate that there was concern about these causal factors and their effect on the system.
Conversely, another assumption was made that when there was variable data, the quality of the
decision support system was intact. Researchers assumed that the variability of assessments increased as
documentation changed between assessments and as effective clinical responses occurred to the
procedures performed by care providers. For example, the most frequent trigger chosen (29 percent) was
bladder incontinence for residents with dementia in Facility B, while in comparison, the Facility A staff
used this trigger much less frequently (6 percent). These assumptions cannot be proven since the
investigators were not physically present when all the data were collected. One remedy for this situation
was to describe the makeup of the resident population physically present in the facilities using the
Nursing Home Compare dataset as discussed. The frequency of documented triggers appears to align with
potential problems likely to be experienced by high percentages of residents according to the nursing
home quality measures.
Conclusion
The analysis of nursing homes that are early adopters of clinical information systems with decision
support provides significant details on how these tools are being used for resident care. These assessments

8 Perspectives in Health Information Management 5; 12; Summer 2008
inform developers how providers use the current system and identify potential areas of future
development, which leads to greater convergence between system design and practice. Linking the
designers and the users of nursing home information systems is a critical step in creating information
structures that are practical and usable in these settings.
Gregory L. Alexander, PhD, RN, is an assistant professor at the Sinclair School of Nursing at the
University of Missouri in Columbia, MO.
Sources of Support
Evaluation activities were supported by the Centers for Medicare and Medicaid Services (CMS) for
work completed for the project funded in response to RFP-CMS-03-001/DB. Other support was provided
by the Biomedical Informatics Research Training Program supported by a grant (T15 LM007089) from
the National Library of Medicine (NLM) and by grant number K08HS016862 from the Agency for
Healthcare Research and Quality (AHRQ) (Alexander, PI). The content is solely the responsibility of the
authors and does not necessarily represent the official views of the CMS, NLM or AHRQ.

A Descriptive Analysis of a Nursing Home Clinical Information System with Decision Support 9
Notes
1. Institute of Medicine. Crossing the Quality Chasm: A New Health System for the 21st Century.
Washington, DC: National Academies Press, 2001.
2. Ozbolt, J. G., G. Bulechek, and J. R. Graves. Report of the Priority Expert Panel on Nursing
Informatics. Bethesda, MD: National Center for Nursing Research, National Institutes of Health,
1993.
3. Sensmeier, J., and C. Delaney. ―Nursing Informatics Collaboration Task Force Letter.‖ 2004. Available
at http://www.nitrd.gov/pitac/reports/20040401_amia_himss.pdf.
4. American Health Information Management Association (AHIMA). ―AHIMA Responses to LTC Health
Information Technology Summit.‖ 2005. Available at
http://www.ahima.org/infocenter/whitepapers/AHIMAResponse_LTCHITSummit-Final.pdf.
5. Alexander, G. L., D. Madsen, S. Herrick, and B. Russell. ―Measuring IT Sophistication in Nursing
Homes.‖ Advances in Patient Safety. Agency for Healthcare Research and Quality, 2008 (in press).
6. Alexander, G. L. ―IT Sophistication in Nursing Homes.‖ Long Term Care Interface (2008, in press).
7. Lorenzi, N. M., L. L. Novak, J. B. Weiss, C. S. Gadd, and K. M. Unertl. ―Crossing the Implementation
Chasm: A Proposal for Bold Action.‖ Journal of the American Medical Informatics Association 15,
no. 3 (2008): 290–296.
8. Schnelle, J. F., B. M. Bates-Jensen, L. Chu, and S. F. Simmons. ―Accuracy of Nursing Home Medical
Record Information about Care-Process Delivery: Implications for Staff Management and
Improvement.‖ Journal of the American Geriatrics Society 52 (2004): 1378–1383.
9. Institute of Medicine, Committee on Data Standards for Patient Safety. Key Capabilities of an
Electronic Health Record System. Washington, DC: National Academies Press, 2003.
10. McAlearney, A. S., and S. A. Hoshaw. ―The Potential for Handheld Computers in LTC Settings.‖
Long Term Care Interface (2005, April): 36–40.
11. Nebeker, J. R., J. F. Hurdle, and B. D. Bair. ―Medical Informatics in Geriatrics.‖ Journal of
Gerontology: Medical Sciences 58A, no. 9 (2003): 820–825.
12. Rantz, M. J., J. Scott-Cawiezell, G. L. Alexander, V. Conn, R. W. Madsen, G. F. Petroski, L. Hicks,
M. Zwygart-Stauffacher, and RTI International. ―Evaluation of the Use of Bedside Technology to
Improve Quality of Care in Nursing Facilities.‖ 2006. Available at
http://www.cms.hhs.gov/reports/downloads/Rantz.pdf.
13. 6. Alexander, G. L. ―IT Sophistication in Nursing Homes.‖ Long Term Care Interface (2008, in
press).
14. Alexander, G. L., M. J. Rantz, M. Flesner, M. Diekemper, and C. Siem. ―Clinical Information
Systems in Nursing Homes: An Evaluation of Initial Implementation Strategies.‖ Computers,
Informatics, Nursing 25, no. 4 (2007): 189–197.
15. Rantz, M. J., L. L. Hicks, G. F. Petroski, R. W. Madsen, D. R. Mehr, V. Conn, M. Zwygart-
Staffacher, and M. Maas. ―Stability and Sensitivity of Nursing Home Quality Indicators.‖ Journal of
Gerontology 59A, no. 1 (2004): 79–82.
16. Alexander, G. L. ―Issues of Trust and Ethics in Computerized Clinical Decision Support Systems.‖
Nursing Administration Quarterly 30, no. 1 (2005): 21–29.

10 Perspectives in Health Information Management 5; 12; Summer 2008
17. Alexander, G. L. ―An Analysis of an Integrated Clinical Decision Support System in Nursing Home
Clinical Information Systems.‖ Journal of Gerontological Nursing 34, no. 2 (2008): 15–20.
18. Alexander, G. L. ―An Analysis of Skin Integrity Alerts Used to Monitor Nursing Home Residents.‖
Proceedings of the American Medical Informatics Association. Madison, WI: Omnipress, 2007, pp.
11–15.
19. Alexander, G. L., M. J. Rantz, M. Flesner, M. Diekemper, and C. Siem. ―Clinical Information
Systems in Nursing Homes: An Evaluation of Initial Implementation Strategies.‖ CIN: Computers,
Informatics, Nursing 25, no. 4 (2007): 189-197.
20. Rantz, M. J., J. Scott-Cawiezell, G. L. Alexander, V. Conn, R. W. Madsen, G. F. Petroski, L. Hicks,
M. Zwygart-Stauffacher, and RTI International. ―Evaluation of the Use of Bedside Technology to
Improve Quality of Care in Nursing Facilities.‖ 2006. Available at
http://www.cms.hhs.gov/reports/downloads/Rantz.pdf.

A Descriptive Analysis of a Nursing Home Clinical Information System with Decision Support 11
Table 1 Alert Calculations
Alert Type Triggers
Dehydration Diarrhea reported within last 24 hours
Weight loss of 3 or more pounds reported over last 7 days
Dehydration reported within last 24 hours
Insufficient fluids reported within last 24 hours
Fever reported in last 24 hours
Vomiting reported in last 24 hours
25% or more of food left uneaten at most meals reported twice
within last 48 hours
Constipation Regular bowel movement not reported within last 48 hours
Constipation reported within last 24 hours
Fecal impaction reported within last 24 hours
Skin integrity Resident reported as comatose
Decisions of daily life reported as severely impaired
Bowel movements reported as incontinent twice in last 48 hours
Bladder voiding reported as incontinent twice in last 48 hours
Resident has a diagnosis of diabetes mellitus
Resident has a diagnosis of peripheral vascular disease
Resident has a diagnosis of dementia—other than Alzheimer’s
Resident has an antibiotic-resistant infection
Resident has edema
Resident has an infection of the foot
Turning and repositioning program is ordered but has not
occurred within last 6 hours
*Decline in condition Decision making on the last †MDS was answered as a 0 or 1
and has increased to a 2 or 3 based on today’s data
Sad or anxious on the last MDS was answered as a 0 or 1 and
has increased to a 2 based on today’s data
The sum of the answers for behavior symptoms, ‡E4Ab–E4Eb
on the last MDS, has increased based on today’s data
§ADL’s G1Aa – G1Ja on the last MDS have increased based on
today’s data
Bowel or bladder continence on the last MDS, ||H1a or H1b,
was answered as a 0, 1, or 2 and either has increased to a 3 or 4
based on today’s data, or an indwelling catheter was inserted
Stability of conditions, ¶J5a, was unchecked on the last MDS
but based on today’s data would be checked
Weight loss, #K3a on the last MDS, was answered as no but
would be answered with yes based on today’s data
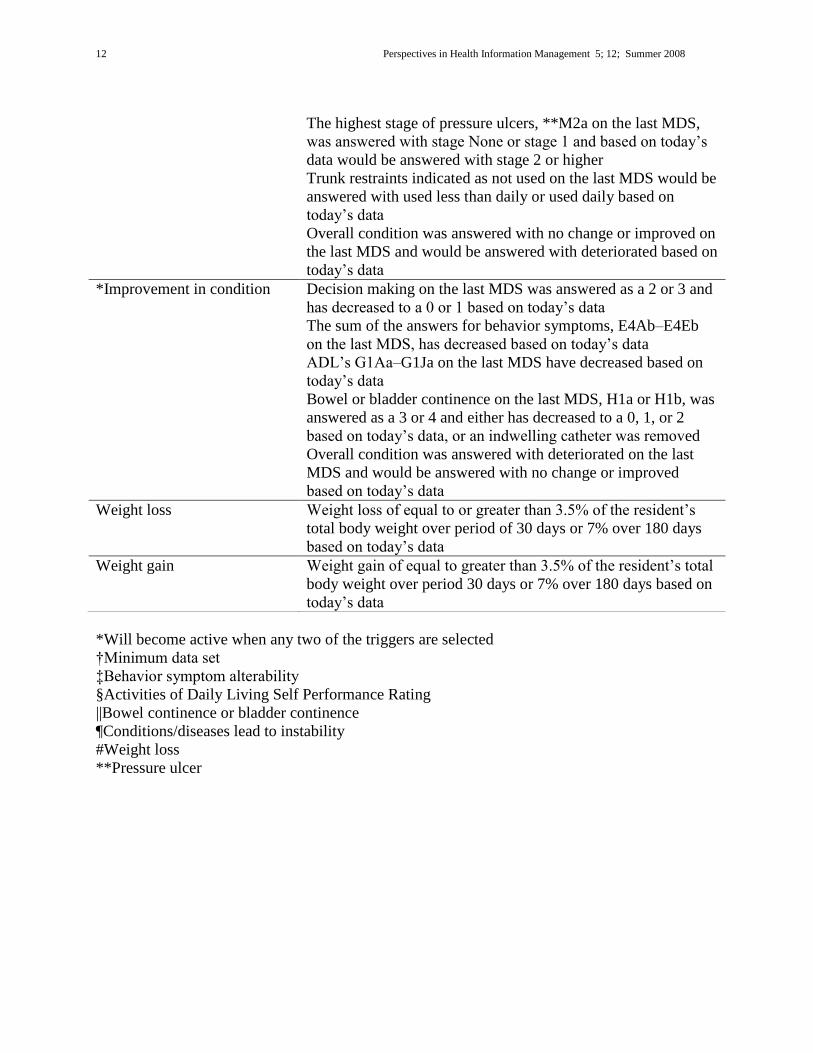
12 Perspectives in Health Information Management 5; 12; Summer 2008
The highest stage of pressure ulcers, **M2a on the last MDS,
was answered with stage None or stage 1 and based on today’s
data would be answered with stage 2 or higher
Trunk restraints indicated as not used on the last MDS would be
answered with used less than daily or used daily based on
today’s data
Overall condition was answered with no change or improved on
the last MDS and would be answered with deteriorated based on
today’s data
*Improvement in condition Decision making on the last MDS was answered as a 2 or 3 and
has decreased to a 0 or 1 based on today’s data
The sum of the answers for behavior symptoms, E4Ab–E4Eb
on the last MDS, has decreased based on today’s data
ADL’s G1Aa–G1Ja on the last MDS have decreased based on
today’s data
Bowel or bladder continence on the last MDS, H1a or H1b, was
answered as a 3 or 4 and either has decreased to a 0, 1, or 2
based on today’s data, or an indwelling catheter was removed
Overall condition was answered with deteriorated on the last
MDS and would be answered with no change or improved
based on today’s data
Weight loss Weight loss of equal to or greater than 3.5% of the resident’s
total body weight over period of 30 days or 7% over 180 days
based on today’s data
Weight gain Weight gain of equal to greater than 3.5% of the resident’s total
body weight over period 30 days or 7% over 180 days based on
today’s data
*Will become active when any two of the triggers are selected
†Minimum data set
‡Behavior symptom alterability
§Activities of Daily Living Self Performance Rating
||Bowel continence or bladder continence
¶Conditions/diseases lead to instability
#Weight loss
**Pressure ulcer
A Descriptive Analysis of a Nursing Home Clinical Information System with Decision Support 13
Figure 1 Data Flow Diagram of Nursing Home Clinical Information System with Decision Support
Administration
Resident
s
Staff
Resident
assessment
Diagnosis
Rules table
Negotiate triggers
Resident
record Record
completion
review
Risk management
reports
Alerts
Care plan
Progress notes
Care plan change
Task list
Intervention
Goals
Quality
management files
Medical records
Entity: Person or
group sending
data
Process:
Changes inputs to
outputs
Data flow Data storage:
Location of data storage
or permanent files
Data flow diagram key

14 Perspectives in Health Information Management 1;1, Winter 2004
Table 2 Nursing Home Quality Measures (QM)
Facility A* Facility B** Facility C***
% % %
Bed size (Occupancy rate) 240 (95) 180 (68) 98 (96)
Ownership Nonprofit Government For Profit
2004 2005 2004 2005 2004 2005
High-risk residents who have pressure sores 14 4 13 5 20 9
Low-risk residents who have pressure sores 0 0 4 6 0 0
Residents who spend most of their time in bed or in a chair 3 2 6 8 1 3
Residents with a urinary tract infection 15 21 10 9 5 4
Residents who are more depressed or anxious 8 21 40 22 14 20
Low-risk residents who lose control of their bowels or bladder 75 80 30 40 51 75
Residents whose need for help with daily activities has increased
19 21 27 17 15 19
Residents whose ability to move about in and around their room got worse
9 22 22 25 23 20
Residents who were physically restrained 12 8 12 12 1 0
Residents who have moderate to severe pain 4 4 7 3 14 6
Residents who have/had a catheter inserted and left in their bladder
1 5 10 7 5 6
Short-stay residents who had moderate to severe pain 28 38 20 25 41 24
Short-stay residents with delirium 5 0 4 2 1 3
Short-stay residents with pressure sores 19 13 31 24 25 11
Source: Centers for Medicare and Medicaid Services (February 2004 and February 2005)
Study collection dates: *March–September 2004; **January–July 2004; ***August 2004–
February 2005

Standards for the Content of the Electronic Health Record 15
Table 3 Residents with Ventilation Pneumonitis (89)
Alerts Triggers
Active Triggers (16,961)
Dehydration Left 25% or more of food uneaten. 6738 39.73% Insufficient fluids. 280 1.65% Dehydrated. Output exceeds input. 180 1.06% Constipation Regular bowel movement has not occurred (within last
72 hours). 1123 6.62% Skin integrity Bladder incontinent. 1018 6.00% Turning or repositioning program has not occurred
(within last 6 hours). 433 2.55% Bowel incontinent. 204 1.20% Improvement in condition Decision making decreased from 2 to 0 591 3.48% Bladder continence decreased from 4 to 2 484 2.85% Bladder continence decreased from 3 to 2 439 2.59% Personal hygiene decreased from 4 to 3 413 2.43% Walk in room decreased from 8 to 3 331 1.95% Decision making decreased from 3 to 0 313 1.85% Toilet use decreased from 4 to 3 294 1.73% Locomotion on unit decreased from 4 to 3 277 1.63% Dressing decreased from 4 to 3 249 1.47% Behavioral symptoms decreased from 1 to 0 207 1.22% Transfer decreased from 4 to 3 179 1.06% Locomotion off unit decreased from 4 to 3 178 1.05% Walk in corridor decreased from 8 to 3 175 1.03%

16 Perspectives in Health Information Management 1;1, Winter 2004
Table 4 Residents with Alzheimer's Disease (13)
Alerts Triggers
Active Triggers (5578)
Dehydration Left 25% or more of food uneaten. 1571 28.16% Dehydrated. Output exceeds input. 174 3.12% Skin integrity Bladder incontinent. 1181 21.17% Bowel incontinent. 215 3.85% Turning or repositioning program has not occurred
(within last 6 hours). 206 3.69% Improvement in condition Bladder continence decreased from 3 to 2 145 2.60% Sad or anxious increased from 1 to 2 83 1.49% Locomotion on unit decreased from 4 to 3 79 1.42% Decision making decreased from 2 to 1 79 1.42% Locomotion off unit decreased from 4 to 3 72 1.29% Walk in corridor decreased from 8 to 3 64 1.15% Decision making decreased from 2 to 0 55 0.99% Bladder continence decreased from 4 to 2 55 0.99% Locomotion off unit decreased from 8 to 3 41 0.74% Walk in room decreased from 8 to 3 35 0.63% Decline in condition Decisions of daily life severely impaired. 65 1.17% Locomotion off unit increased from 2 to 3 38 0.68% Eating increased from 0 to 3 31 0.56% Constipation Regular bowel movement has not occurred
(within last 72 hours). 57 1.02%

Standards for the Content of the Electronic Health Record 17
Table 5 Residents with Cerebral Vascular Accident (18)
Alerts Triggers
Active Triggers (4380)
Dehydrated Left 25% or more of food uneaten. 1261 28.79% Dehydrated. Output exceeds input. 257 5.87% Diarrhea. 18 0.41% Skin integrity Bladder incontinent. 945 21.58% Turning or repositioning program has not occurred
(within last 6 hours). 165 3.77% Bowel incontinent. 148 3.38% Incontinence Regular bowel movement has not occurred
(within last 72 hours). 158 3.61% Improvement in condition Bladder continence decreased from 3 to 2 121 2.76% Locomotion off unit decreased from 4 to 3 60 1.37% Eating decreased from 1 to 0 57 1.30% Locomotion on unit decreased from 4 to 3 54 1.23% Walk in corridor decreased from 8 to 3 52 1.19% Walk in room decreased from 8 to 3 48 1.10% Decision making decreased from 2 to 0 44 1.00% Bladder continence decreased from 4 to 2 41 0.94% Walk in corridor decreased from 1 to 0 25 0.57% Decline in condition Sad or anxious increased from 0 to 2 42 0.96% Decisions of daily life severely impaired. 33 0.75% Locomotion off unit increased from 1 to 3 26 0.59% Bowel continence increased from 2 to 3 23 0.53%

18 Perspectives in Health Information Management 1;1, Winter 2004
Table 6 Residents with Dementia (20)
Alerts Triggers
Active Triggers (9263)
Skin integrity Bladder incontinent. 2686 29.00% Bowel incontinent. 351 3.79% Turning or repositioning program has not occurred
(within last 6 hours). 344 3.71% Dehydration Left 25% or more of food uneaten. 2233 24.11% Dehydrated. Output exceeds input. 299 3.23% Diarrhea. 48 0.52% Improvement in condition Bladder continence decreased from 3 to 2 254 2.74% Locomotion off unit decreased from 4 to 3 176 1.90% Bladder continence decreased from 4 to 2 117 1.26% Decision making decreased from 2 to 1 112 1.21% Decision making decreased from 2 to 0 98 1.06% Decision making decreased from 3 to 0 96 1.04% Walk in corridor decreased from 8 to 3 92 0.99% Locomotion on unit decreased from 1 to 0 60 0.65% Eating decreased from 1 to 0 52 0.56% Walk in corridor decreased from 1 to 0 46 0.50% Toilet use decreased from 3 to 2 46 0.50% Decline in condition Decisions of daily life severely impaired. 66 0.71% Locomotion off unit increased from 1 to 3 58 0.63% Incontinence Regular bowel movement has not occurred
(within last 72 hours). 49 0.53%

Standards for the Content of the Electronic Health Record 19
Table 7 Residents with Depressive Disorder (7)
Alerts Triggers
Active Triggers (2379)
Dehydration Left 25% or more of food uneaten. 733 30.81% Dehydrated. Output exceeds input. 99 4.16% Skin integrity Bladder incontinent. 620 26.06% Turning or repositioning program has not occurred
(within last 6 hours). 86 3.61% Bowel incontinent. 69 2.90% Improvement in condition Decision making decreased from 2 to 0 53 2.23% Bladder continence decreased from 3 to 2 45 1.89% Walk in corridor decreased from 8 to 3 44 1.85% Bladder continence decreased from 4 to 2 29 1.22% Personal hygiene decreased from 3 to 2 25 1.05% Walk in room decreased from 8 to 3 21 0.88% Dressing decreased from 3 to 2 19 0.80% Locomotion off unit decreased from 4 to 3 16 0.67% Decision making decreased from 2 to 1 15 0.63% Locomotion on unit decreased from 1 to 0 14 0.59% Bowel continence decreased from 3 to 2 14 0.59% Locomotion off unit decreased from 4 to 2 13 0.55% Decision making decreased from 3 to 0 12 0.50% Incontinence Regular bowel movement has not occurred
(within last 72 hours). 50 2.10% Decline in condition Dressing increased from 2 to 3 16 0.67%

20 Perspectives in Health Information Management 1;1, Winter 2004
Table 8 Residents with Hypertension (11)
Alerts Triggers
Active Triggers (4644)
Dehydration Left 25% or more of food uneaten. 1298 27.95% Dehydrated. Output exceeds input. 183 3.94% Skin integrity Bladder incontinent. 834 17.96% Turning or repositioning program has not occurred
(within last 6 hours). 132 2.84% Bowel incontinent. 68 1.46% Improvement in condition Bladder continence decreased from 3 to 2 132 2.84% Decision making decreased from 2 to 0 103 2.22% Locomotion off unit decreased from 4 to 3 89 1.92% Walk in corridor decreased from 8 to 3 69 1.49% Eating decreased from 1 to 0 59 1.27% Bladder continence decreased from 4 to 2 56 1.21% Walk in room decreased from 8 to 3 56 1.21% Locomotion on unit decreased from 4 to 3 53 1.14% Transfer decreased from 4 to 3 52 1.12% Toilet use decreased from 1 to 0 35 0.75% Decision making decreased from 2 to 1 31 0.67% Behavioral symptoms decreased from 1 to 0 31 0.67% Personal hygiene decreased from 4 to 3 28 0.60% Dressing decreased from 4 to 3 28 0.60% Incontinence Regular bowel movement has not occurred
(within last 72 hours). 66 1.42%

Standards for the Content of the Electronic Health Record 21
Table 9 Residents with Osteoarthritis (7)
Alerts Triggers
Active Triggers (3399)
Skin integrity Bladder incontinent. 914 26.89% Turning or repositioning program has not
occurred (within last 6 hours). 110 3.24% Bowel incontinent. 56 1.65% Dehydration Left 25% or more of food uneaten. 745 21.92% Dehydrated. Output exceeds input. 126 3.71% Improvement in condition Bladder continence decreased from 3 to 2 104 3.06% Locomotion off unit decreased from 4 to 3 81 2.38% Walk in corridor decreased from 8 to 3 67 1.97% Walk in room decreased from 8 to 3 63 1.85% Bladder continence decreased from 4 to 2 55 1.62% Decision making decreased from 3 to 0 42 1.24% Locomotion on unit decreased from 4 to 3 29 0.85% Personal hygiene decreased from 4 to 3 28 0.82% Bed mobility decreased from 4 to 3 28 0.82% Toilet use decreased from 4 to 3 28 0.82% Eating decreased from 4 to 3 28 0.82% Decision making decreased from 2 to 1 25 0.74% Decline in condition Sad or anxious increased from 1 to 2 47 1.38% Bowel continence increased from 1 to 3 35 1.03% Overall condition changed from 2 to 2 30 0.88%

22 Perspectives in Health Information Management 1;1, Winter 2004
Table 10 Residents with Pneumonia (7)
Alerts Triggers
Active Triggers (2471)
Dehydration Left 25% or more of food uneaten. 743 30.07% Dehydrated. Output exceeds input. 96 3.89% Skin integrity Bladder incontinent. 385 15.58% Bowel incontinent. 73 2.95% Turning or repositioning program has not occurred
(within last 6 hours). 63 2.55% Improvement in condition Walk in room decreased from 8 to 3 77 3.12% Regular bowel movement has not occurred
(within last 72 hours). 57 2.31% Bladder continence decreased from 3 to 2 55 2.23% Walk in corridor decreased from 8 to 3 53 2.14% Locomotion on unit decreased from 4 to 3 50 2.02% Locomotion off unit decreased from 4 to 3 47 1.90% Behavioral symptoms decreased from 2 to 0 31 1.25% Bladder continence decreased from 4 to 2 28 1.13% Personal hygiene decreased from 4 to 3 28 1.13% Bed mobility decreased from 4 to 3 28 1.13% Decision making decreased from 2 to 0 27 1.09% Walk in corridor decreased from 4 to 3 27 1.09% Dressing decreased from 4 to 3 18 0.73% Decline in condition Eating increased from 2 to 3 29 1.17% Overall condition changed from 0 to 2 25 1.01%