Embed Size (px)
Citation preview
A Demographic estimate of the population of the Qing eight banners
CitationElliott, Mark C., Cameron Campbell, and James Lee. 2016. "A Demographic estimate of the population of the Qing eight banners." Études Chinoises: Bulletin de l'Association Française D'études Chinoises 35, no. 1: 9-39.
Permanent linkhttp://nrs.harvard.edu/urn-3:HUL.InstRepos:34391735
Terms of UseThis article was downloaded from Harvard University’s DASH repository, and is made available under the terms and conditions applicable to Open Access Policy Articles, as set forth at http://nrs.harvard.edu/urn-3:HUL.InstRepos:dash.current.terms-of-use#OAP
Share Your StoryThe Harvard community has made this article openly available.Please share how this access benefits you. Submit a story .
Accessibility

A Demographic Estimate of the Population of the Qing Eight Banners
Mark C. Elliott Department of East Asian Languages and Civilizations and Department of History,
Harvard University
Cameron Campbell Division of Social Science, Hong Kong University of Science and Technology
James Lee
School of Humanities and Social Science, Hong Kong University of Science and Technology
Introduction
The Eight Banners (Chinese baqi 八旗/Manchu jakūn gūsa) is well known as the
omnibus military, social, political, and economic institution that played a crucial role in enabling
the Manchu conquest of China in the middle seventeenth century and the establishment of the
Qing state (1644-1912), the last of China’s dynastic regimes. Along with their Mongol and Han
allies in the banners, the Manchus were vastly outnumbered by Han Chinese supporters of the
Ming state (1368-1644), not to mention various rebel armies, and formed a tiny group next to the
general Chinese population. Yet, despite being so greatly outnumbered, they nonetheless seized
and retained power for 267 years.
The sustained success of Manchu minority rule remains one of the great conundrums of
modern Chinese history. While many analyses have been offered to explain this puzzle, a basic
piece of information essential to scholarly consideration of this problem – the size of the Qing
armies – has long eluded precise substantiation. Not surprisingly, in the early decades of the
Qing period the sort of information that would allow one to know this figure was kept a military
secret. The first edition of the Da Qing Huidian 大清會典 (Collected institutes of the great
Qing), completed in 1690, contained information on the number of troops stationed around the

2
country, but pointedly refrained from revealing the exact number of soldiers in the capital.1 This
taboo was observed until the middle of the eighteenth century, so that until then, most people had
only a hazy idea of the total size of the Manchu armed forces.
Only much later in the dynasty did estimates of the total number of soldiers involved in
the conquest begin to surface, based on crude methods of extrapolation that depended upon
guesses of the number of households and their size. For instance, in Shengwu ji 聖武記, a
history of the military campaigns led by the Qing emperors first published in 1839, Wei Yuan 魏
源 (1794-1856), tried to figure out how many troops the Qing were able to put into the field in
1644. He wrote that just before the conquest there was a total of four hundred companies
(zuoling 佐領/niru), of which 308 were Manchu (Manzhou 滿洲/Manju), 76 Mongol (Menggu
蒙古/Monggo), and 16 Han bannermen (Hanjun 漢軍/ujen cooha). Multiplying the number of
companies that existed in 1644 by 150 (his guess as to how many soldiers there were per
company) yielded a total of 87,150 banner troops: 46,200 Manchus, 16,840 Mongols, and 24,050
Hanjun. At the same time, Wei stated that the number of soldiers right after the conquest was
“not less than 200,000 men” in size.2 Unfortunately, he skipped over the obvious discrepancy
between these two figures, leaving the reader wondering what the number really was.
Despite their clear limitations, methods like this have continued to be the most common
means of trying to estimate the size banner population. The aim of this essay is to present a
technique for estimating the banner population that combines instead totals of ding populations
found in the Qing archives with standard demographic models of population configuration and
growth. The discussion is divided into three sections. By way of background, the first section
summarizes previous estimates made of banner populations. The second section discusses
figures regarding the adult male banner population in the early Qing that have emerged from the

3
First Historical Archives in Beijing. The third section then introduces a way to use these figures
to calculate a range of possible population sizes and offers the results of these calculations for the
entire banner population. In this way, we hope to provide more satisfactory answers to three
basic questions: How many people were there in the Eight Banners? What were the respective
populations of the Manchu, Mongol, and Chinese banners? How did these populations change
over time?
Previous Estimates of Eight Banner Population
In general, up to now scholars have had only one way of estimating the total Eight
Banner population, and that has been to take what they believed to be the most reliable figure for
banner males and multiply it by an estimated ratio of dependents per bannerman to arrive at a
guess as to total household size. That is, for every banner male (m), assume n additional
household dependents, so that the total banner population (P) is derived according to the
following equation (Equation 1):
P = m + n(m) (1)
We refer to this as the “Household Dependent Method.”
There are two obvious problems with this method. The first has to do with which figure
to assume for m. Estimates of the number of banner males diverge widely, depending on
whether they calculate from the number of companies in the banners, from the number of
positions in the banner military establishment, or from other estimates that have appeared over
time as to the size of the banner forces. The former method, though widely employed, is suspect
because the actual number of soldiers per company varied greatly, both between companies and
even within the same company over time.3 Moreover, different sources disagree on the total

4
number of companies at any given time.4 In addition, differences between estimates often lead
to further confusion because many fail to distinguish clearly between able-bodied males (ding,
zhuangding 丁, 壯丁/haha) and those among them who were actually soldiers (bing, bingding
兵, 兵丁/uksin) or officers (guan 官/hafan) in paid positions.5 These sorts of complications
have resulted in great discrepancies between estimates, limiting our confidence in them.
A second problem with the Household Dependent Method is that there is no reliable way
of knowing the size of the average household in the Eight Banners, that is, no way of knowing
what number to use for n. Archival figures show that the ratio of dependents to bannerman
varied 300 percent, from as low as 3:1 to as high as 9:1.6 One could, of course, simply split the
difference and hope for the best, but it is hard to put much faith in the resulting calculations.
Things are made even more complicated by the inclusion of bondservants (bao-yi 包衣/booi,
booi aha) within household numbers, where they figure as part of dependents n, whereas in
regular counts of banner population bondservants appear as separate households. We have next
to no information on the size of bondservant households.7
A glance at the history of estimates of Eight Banner population shows how unlikely they
are to yield consistent, reliable figures. The earliest such estimates were those that began to
emerge in the reigns of the Yongzheng (1723-1735) and Qianlong (1736-1795) emperors, when
rapid population growth in the banners first attracted the attention of officials at court, who
expressed concern that the support of so many people imposed an unsustainable fiscal burden
upon the state. In separate essays, officials Šuhede (Shu-he-de 舒赫德) and Shen Qiyuan 沈起
元 wrote that at the time of the conquest there were 80,000 soldiers in the banners, and that this
number grew to 120,000 during the Kangxi reign (1661-1722), shrinking slightly by the
Qianlong reign to 100,000.8 But these numbers likely referred only to soldiers in Beijing, and

5
did not include the garrisons in the wider metropolitan area, the Chinese provinces, the Northeast,
and, later, the frontier areas, so they reflect a clear undercount. The source of these numbers is
unclear; they appear simply to be rough estimates, and not the result of actual population counts.
Better numbers come in the 1818 Huidian, which showed a total ding population of 422,161,
including Manchus, Mongols, Han bannermen, and bondservants. As the editors explain, this
number depended upon the most recent census of the banner population that was available to the
editors at the time, that of 1812.9 But even this estimate includes only the number of healthy
males, excluding males below age 15, above age 60, the physically or mentally disabled, and all
females. Thus the 1818 numbers work well enough perhaps for m, but still leave n open to
question.
As already noted, determining the total strength of banner forces on the basis of the
number and size of banner companies also leaves much to be desired, since it is unclear what the
real size of those companies was at the time. Drawing upon a version of the Huidian dating from
the 1760s, which gives a detailed list of all banner installations around the empire, Wei Yuan
calculated that by the 1830s there were probably about 233,000 banner soldiers in the entire
empire, divided between the capital (125,412) and the garrisons (107,768).10 A contemporary of
Wei’s, Wang Qingyun 王慶雲 (1798-1862), also touched on the question of banner population
in his well-known study, Shiqu yuji 石渠餘記, written in about 1850. Apart from citing the 1818
Huidian figures already mentioned in discussing the present number of bannermen, Wang also
made use of information in the appended Precedents (Shili 事例) section to figure the number of
companies in the conquest era. But he thought it prudent to guard this information rather closely
and refrained from publishing it in his book.11
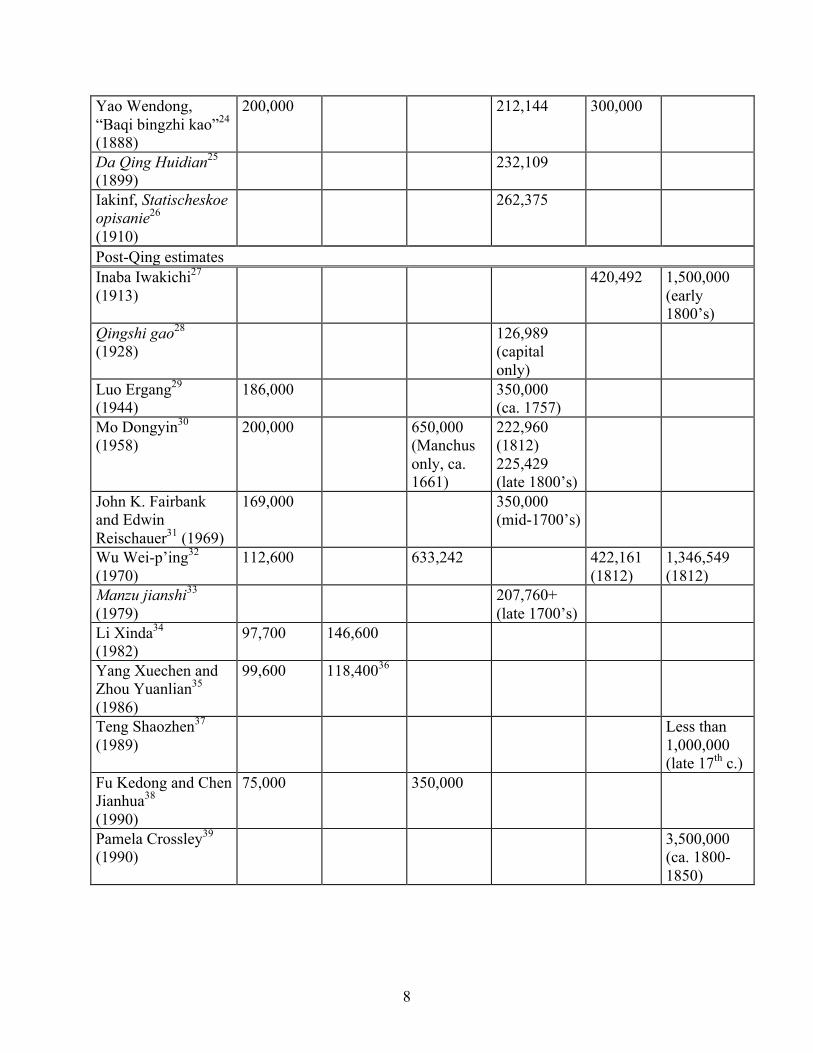
A number of twentieth-century scholars have also tackled the population problem. The

6
following table summarizes the various figures available for Eight Banner populations from
Qing-period and post-Qing sources (Table 1).
7
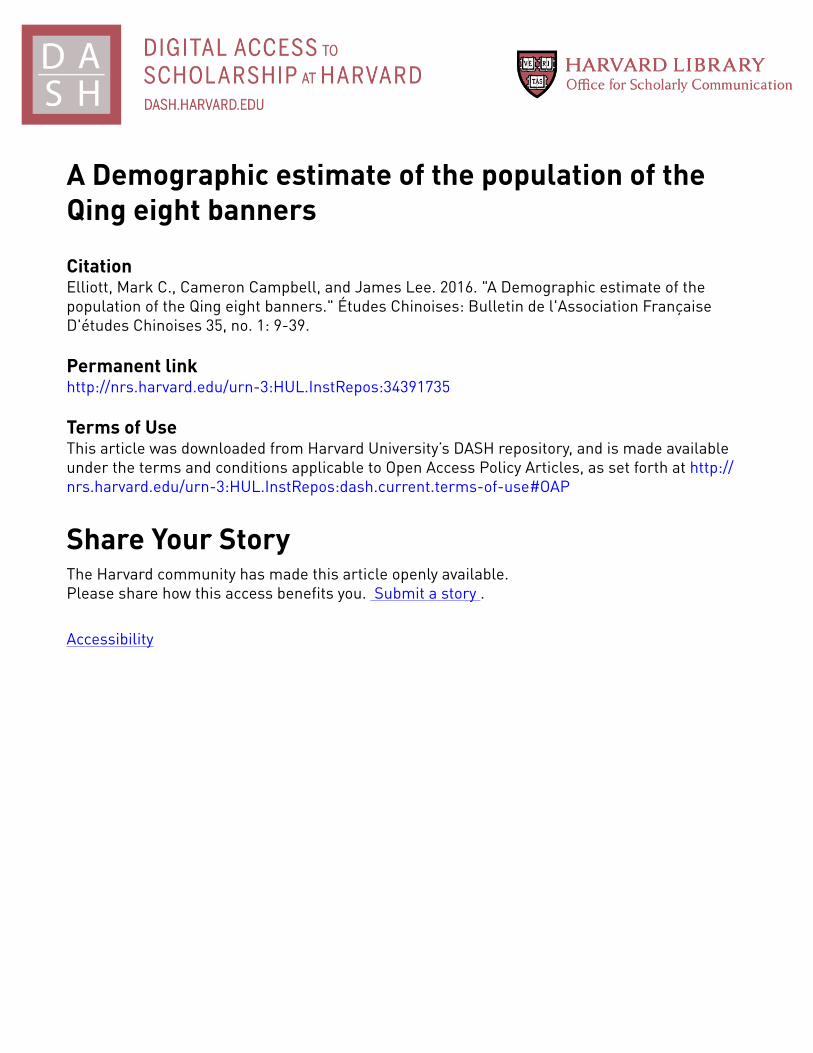
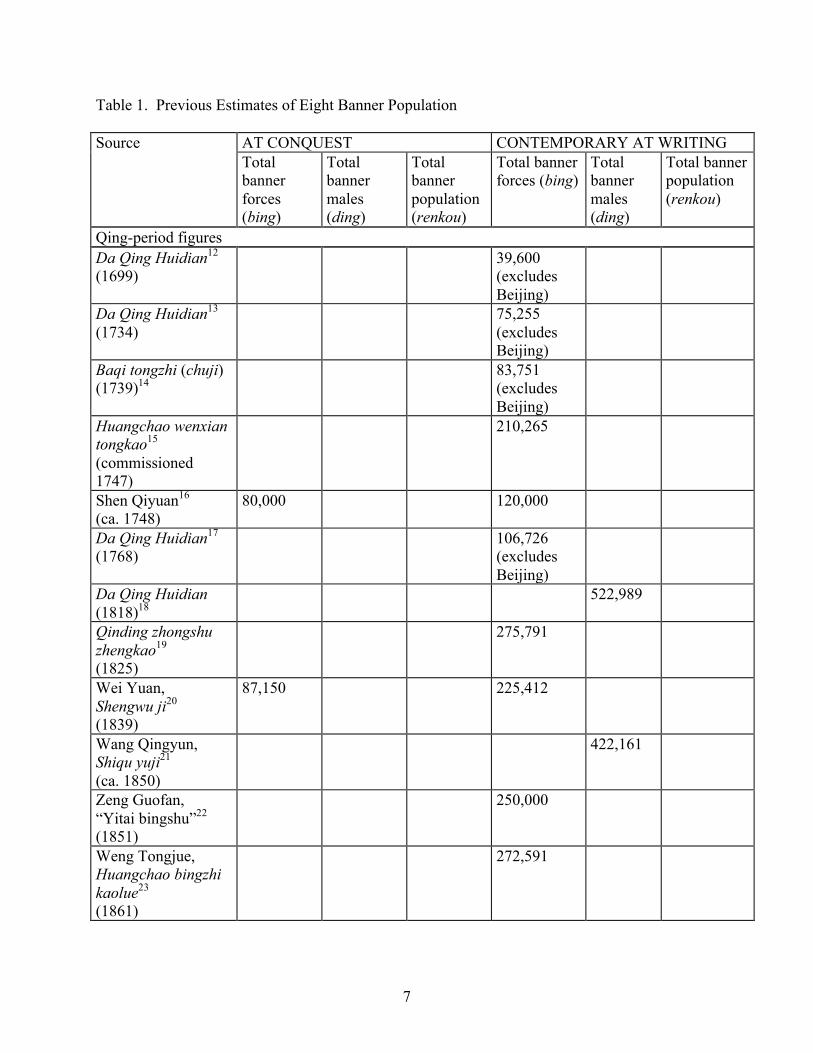
Table 1. Previous Estimates of Eight Banner Population Source AT CONQUEST CONTEMPORARY AT WRITING
Total banner forces (bing)
Total banner males (ding)
Total banner population (renkou)
Total banner forces (bing)
Total banner males (ding)
Total banner population (renkou)
Qing-period figures Da Qing Huidian12 (1699)
39,600 (excludes Beijing)
Da Qing Huidian13 (1734)
75,255 (excludes Beijing)
Baqi tongzhi (chuji) (1739)14
83,751 (excludes Beijing)
Huangchao wenxian tongkao15 (commissioned 1747)
210,265
Shen Qiyuan16 (ca. 1748)
80,000 120,000
Da Qing Huidian17 (1768)
106,726 (excludes Beijing)
Da Qing Huidian (1818)18
522,989
Qinding zhongshu zhengkao19 (1825)
275,791
Wei Yuan, Shengwu ji20 (1839)
87,150 225,412
Wang Qingyun, Shiqu yuji21 (ca. 1850)
422,161
Zeng Guofan, “Yitai bingshu”22 (1851)
250,000
Weng Tongjue, Huangchao bingzhi kaolue23 (1861)
272,591
8
Yao Wendong, “Baqi bingzhi kao”24 (1888)
200,000 212,144 300,000
Da Qing Huidian25 (1899)
232,109
Iakinf, Statischeskoe opisanie26 (1910)
262,375
Post-Qing estimates Inaba Iwakichi27 (1913)
420,492
1,500,000 (early 1800’s)
Qingshi gao28 (1928)
126,989 (capital only)
Luo Ergang29 (1944)
186,000 350,000 (ca. 1757)
Mo Dongyin30 (1958)
200,000 650,000 (Manchus only, ca. 1661)
222,960 (1812) 225,429 (late 1800’s)
John K. Fairbank and Edwin Reischauer31 (1969)
169,000 350,000 (mid-1700’s)
Wu Wei-p’ing32 (1970)
112,600 633,242 422,161 (1812)
1,346,549 (1812)
Manzu jianshi33 (1979)
207,760+ (late 1700’s)
Li Xinda34 (1982)
97,700 146,600
Yang Xuechen and Zhou Yuanlian35 (1986)
99,600 118,40036
Teng Shaozhen37 (1989)
Less than 1,000,000 (late 17th c.)
Fu Kedong and Chen Jianhua38 (1990)
75,000 350,000
Pamela Crossley39 (1990)
3,500,000 (ca. 1800-1850)

9
Li Yanguang and Guan Jie40 (1991)
123,000 615,000 172,350 (1735)
861,750 (1735) 5,260,686 (1909)
Chen Feng41 (1992)
100-150,000
250,000 (ca. 1800)
Han Guanghui42 (1996)
172,000 205,400 (1781 -- Beijing only)
Liu Xiaomeng43 (1996)
346,000
226,989 (ca. 1850)
10
In sum, estimates of banner forces at the time of the conquest vary from 60,000 to
350,000, with most clustered around 100,000-150,000. Thanks to more complete sources, we
have a much better idea of the size of the banner military population in the late eighteenth and
nineteenth centuries – about 250,000 – but the dimensions of the overall banner population
including women, children, the aged, the disabled, and the non-military adult male population at
this or at any point during the Qing remains a guess. In the remainder of this paper, we seek to
remedy the situation by providing independent estimates based on application of traditional
demographic techniques to archival sources.
Archival Figures for Eight Banner Populations
The last of the estimates in Table 1, from Liu 1996, deserves attention because it makes
use of new information on the size of banner population. Though the author does not indicate his
sources, his figure of 346,000 almost certainly is derived from a 1983 article by An Shuangcheng
安双成, “A Preliminary Analysis of the Number of ding in the Eight Banners in the Shunzhi,
Kangxi, and Yongzheng Reigns.”44 In this article, An, an archivist then working in the Manchu
Section of the First Historical Archives in Beijing, presented figures from documents dated 1723
and 1724 that listed ding totals for 1648, 1720, 1721, and 1723. These documents were
memorials from the Yi Prince, Yūnsiyang (Yin-xiang 胤祥), to his brother, the Yongzheng
emperor, who had demanded firm information on the size of the banner population.45 Most of
these memorials are in Manchu, though at least one is in Chinese. In his article, An provided in
tabular form only the data from 1720. The following table provides the essential data from all
four years (Table 2).

11
Table 2. Ding totals for the Eight Banners by Ethnic Banner for 1648, 1720, 1721, and 1723 EB Division __________ Year
Manchu % of total
Mongol, Chakhar
% of total
Chinese banner, booi, other Han
% of total
Total ding
Shunzhi 5 (1648) 55,330 15.95% 28,785 8.3% 262,816 75.75% 346,931 Kangxi 59 (1720) 154,117 22.19% 61,562 8.86% 478,804 68.95 694,483 Kangxi 60 (1721) 154,117 22.12% 61,560 8.4% 481,004 69.4% 696,681 Yongzheng 1 (1723) 154,329 23.40% 58,798 8.9% 444,416 67.7% 657,573

12
Apart from providing the first really reliable number for able-bodied males in the Eight Banners
at around the time of the conquest – 346,931 – these documents, which drew upon confidential
archives kept in the palace, also broke down the population according to membership in the main
divisions of the banners. We see that Manchus appear to represent only about 16 percent of the
banner population and Mongols about 8 percent, while Han bannermen, bondservants, and “other
Han” accounted for an astounding 76 percent of the total.46 An’s article also revealed that the
adult male population in the banners doubled between 1648 and 1720 and that the number of
adult males in the Manchu banners during these seventy-two years roughly tripled. (The drop in
the number of Han bannermen and others between 1721 and 1723 remains unexplained.)
One problem with the information presented in An’s article, however, is that the figures
for the Chinese banners are lumped together with those for bondservants and for various
miscellaneous groups in the banners. The impression given by the data that three-quarters of
bannermen were in fact Han is belied by the reality that most bondservants were ethnically
Manchu, not Han (a few were Mongol). An’s more specific information for 1720 shows that of a
total 478,804 ding in the “Hanjun, bondservant, other Han” category, only 204,870 – 43 percent
of the total – were actually enrolled in Chinese banner companies (or special companies reserved
for Han who surrendered to the Qing in particular circumstances, e.g., Fusi nikan and tai nikan),
while 239,494 were bondservants and 34,440 were eunuchs and “other Han.” If, conservatively,
even one-half of bondservants were ethnically Manchu, then the total number of Manchus in the
banners in 1720 was closer to 275,000, putting this group at around 57 percent of the total
population. Since only a very few bondservant companies – those called “flag and drum
companies” (qigu zuoling 旗鼓佐領/cigu niru) – were made up of Han Chinese, the adjusted
proportion of Manchus in the banners was almost certainly even higher than this.47

13
Unfortunately, in his 1983 article, An did not give any additional population breakdown
for 1648, so we can only speculate as to the adjusted proportion of Manchus for the conquest
period. However, in another article published in 1992, An came forward with more specific
information not just on the 1648 banner population, but on the banner population in 1654 and
1657 as well.48 The source for the 1648 population, as before, was the 1723 memorial of
Yūnsiyang, which An reproduced for the first time (in romanized form), along with two
memorials from the president of the Board of Revenue, Ceke (Che-ke 車克), dated 23 November
1657, which gave detailed figures for the banners from 1654 and 1657. That a period of three
years separates the data suggests strongly that they are the result of the triennial census of the
Eight Banners. Again, only a small portion of these data was tabulated by An. We present this
information, together with the data for 1720, 1721, and 1723, in Table 3.

14
Table 3. Eight Banner ding population, 1648-1723
1648 1654 1657 1720 1721 1723 Manchu EB 55,330 49,660 49,695 154,117 154,117 154,329 % of sub-total/% of total
42.5/16% 32.5/12.9% 32.2/12.7% 36.6/22.2% 33.9/22.1% 36.1/23.5
Mongol EB 28,785 25,927 26,053 61,562 61,560 58,798 % of sub-total/total 22.1/8.3% 17/6.7% 16.9/6.7% 14.6/8.9% 13.5/8.8% 13.8/8.9 Chinese EB (inc. Fusi/tai nikan, baitangga)
45,849
77,368
78,782
204,870
239,510
214,295
% of sub-total/total 35.2/13.2% 50.5/20.1% 51/20% 48.7/29.5% 52.6/34.4% 50.1/32.6% SUB-TOTAL (EB ding population exclusive of booi)
130,164
152,955
154,530
420,549
455,187
427,332
% of total 37.5% 39.7% 39.4% 60.6% 65.3% 65% booi & other Han 216,967 232,584 237,338 273,934 241,494 230,15149 % of total 62.5% 60.3% 60.6% 39.4% 34.7% 35% TOTAL (EB ding population including booi)
347,131
385,539
391,868
694,483
696,681
657,573
15
The above table gives a very different impression of the place of the Chinese banners in
the overall Eight Banner population structure. Four years after the conquest, Han bannermen
account for just 13.2 percent of all ding, increasing to almost one-third by the early 1720s. The
total number of ding is just over 130,000 (37.5 percent of the total banner population), while
bondservants and “other Han” (never a large number) is 217,000 (62.5 percent of the total). For
the first time, we can also see here that while those enrolled in Manchu companies made up only
16 percent of the total banner population, they accounted for 42.5 percent of the regular fighting
force, larger than both the Chinese banner and Mongol contingents (35.2 percent and 22.1
percent, respectively). If, as before, one takes half of the bondservant figure (108,500) and adds
it to the figure for regular Manchus, the total is 163,830, or 47 percent of all adult banner males
who should be counted as ethnically Manchu.
The data also show that all segments of the regular banner population saw an
approximate tripling of their numbers between the first set of figures from 1648, 1654, and 1657
and the second from 1720, 1721, 1723; Manchus slightly more, Mongols and Chinese banners
slightly less. The exception is in the bondservant population, which declined from 62.5 percent
of total population in 1648 to just 35 percent in 1723. This reversal of proportions, from two-
thirds to just one-third, is explained by the apparently unchanging number of people in this group
(consistently between 215,000 and 275,000 adult males), a stability that stands in obvious
contrast to the trend of population increase in the regular banners. The exact reasons for the
failure of the bondservant population to increase remain unclear; we know that in the Kangxi
reign some bondservants were able to convert to regular banner status, but many more no doubt
left the banners altogether.
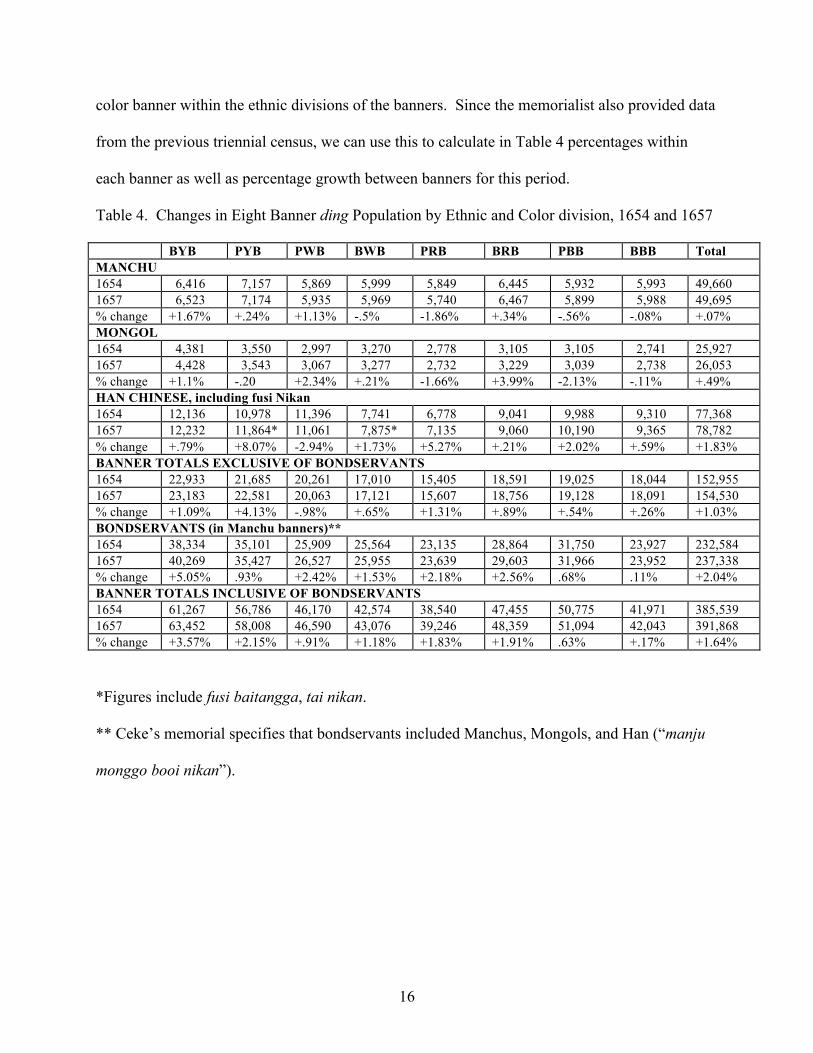
The documents An found also give very detailed information regarding the breakdown by
16
color banner within the ethnic divisions of the banners. Since the memorialist also provided data
from the previous triennial census, we can use this to calculate in Table 4 percentages within
each banner as well as percentage growth between banners for this period.
Table 4. Changes in Eight Banner ding Population by Ethnic and Color division, 1654 and 1657
BYB PYB PWB BWB PRB BRB PBB BBB Total MANCHU 1654 6,416 7,157 5,869 5,999 5,849 6,445 5,932 5,993 49,660 1657 6,523 7,174 5,935 5,969 5,740 6,467 5,899 5,988 49,695 % change +1.67% +.24% +1.13% -.5% -1.86% +.34% -.56% -.08% +.07% MONGOL 1654 4,381 3,550 2,997 3,270 2,778 3,105 3,105 2,741 25,927 1657 4,428 3,543 3,067 3,277 2,732 3,229 3,039 2,738 26,053 % change +1.1% -.20 +2.34% +.21% -1.66% +3.99% -2.13% -.11% +.49% HAN CHINESE, including fusi Nikan 1654 12,136 10,978 11,396 7,741 6,778 9,041 9,988 9,310 77,368 1657 12,232 11,864* 11,061 7,875* 7,135 9,060 10,190 9,365 78,782 % change +.79% +8.07% -2.94% +1.73% +5.27% +.21% +2.02% +.59% +1.83% BANNER TOTALS EXCLUSIVE OF BONDSERVANTS 1654 22,933 21,685 20,261 17,010 15,405 18,591 19,025 18,044 152,955 1657 23,183 22,581 20,063 17,121 15,607 18,756 19,128 18,091 154,530 % change +1.09% +4.13% -.98% +.65% +1.31% +.89% +.54% +.26% +1.03% BONDSERVANTS (in Manchu banners)** 1654 38,334 35,101 25,909 25,564 23,135 28,864 31,750 23,927 232,584 1657 40,269 35,427 26,527 25,955 23,639 29,603 31,966 23,952 237,338 % change +5.05% .93% +2.42% +1.53% +2.18% +2.56% .68% .11% +2.04% BANNER TOTALS INCLUSIVE OF BONDSERVANTS 1654 61,267 56,786 46,170 42,574 38,540 47,455 50,775 41,971 385,539 1657 63,452 58,008 46,590 43,076 39,246 48,359 51,094 42,043 391,868 % change +3.57% +2.15% +.91% +1.18% +1.83% +1.91% .63% +.17% +1.64%
*Figures include fusi baitangga, tai nikan.
** Ceke’s memorial specifies that bondservants included Manchus, Mongols, and Han (“manju
monggo booi nikan”).

17
The information in this table allows us to see how unevenly population was distributed between
the banners, and how uneven growth was between them.
The Technique
The archival data brought to light by An Shuangcheng represent a major opportunity to
improve our knowledge of the size and structure of the Eight Banner population. Using these
numbers, we can figure that regular Qing forces at the time of the conquest were probably not
greater than 86,000 men, assuming that not more than two-thirds of all able-bodied men were
engaged in fighting, of which 36,500 were Manchus, 19,000 were Mongols, and 30,500 were
Han bannermen. Adding to this number bondservants, auxiliaries, and non-banner Han allies,
total Qing forces in 1644 probably numbered between 110,000 and 150,000. This confirms the
majority of estimates found in Table 1. The Huidian figures for ding in the early nineteenth
century, approximately 422,000, cited by Wang Qingyun and Wu Wei-p’ing, however, appear
too small, in spite of the removal of a large number of Han bannermen and others of lesser status
from the banners in the middle of the Qianlong reign.
An’s data, unfortunately, do not provide counts of the total population of the Eight
Banners. One remedy to address this shortcoming would be to use the Household Dependent
Method to calculate P, treating his numbers as an estimate of m. This still leaves the problem of
selecting a value to use for n, the number of dependents per bannerman. In the absence of
precise and reliable data on the composition of banner households, practically any choice of n is
little better than an educated guess.
To estimate the population of the Eight Banners from An’s figures, therefore, we make
use of a demographic model of the relationship between population growth rates and age
18
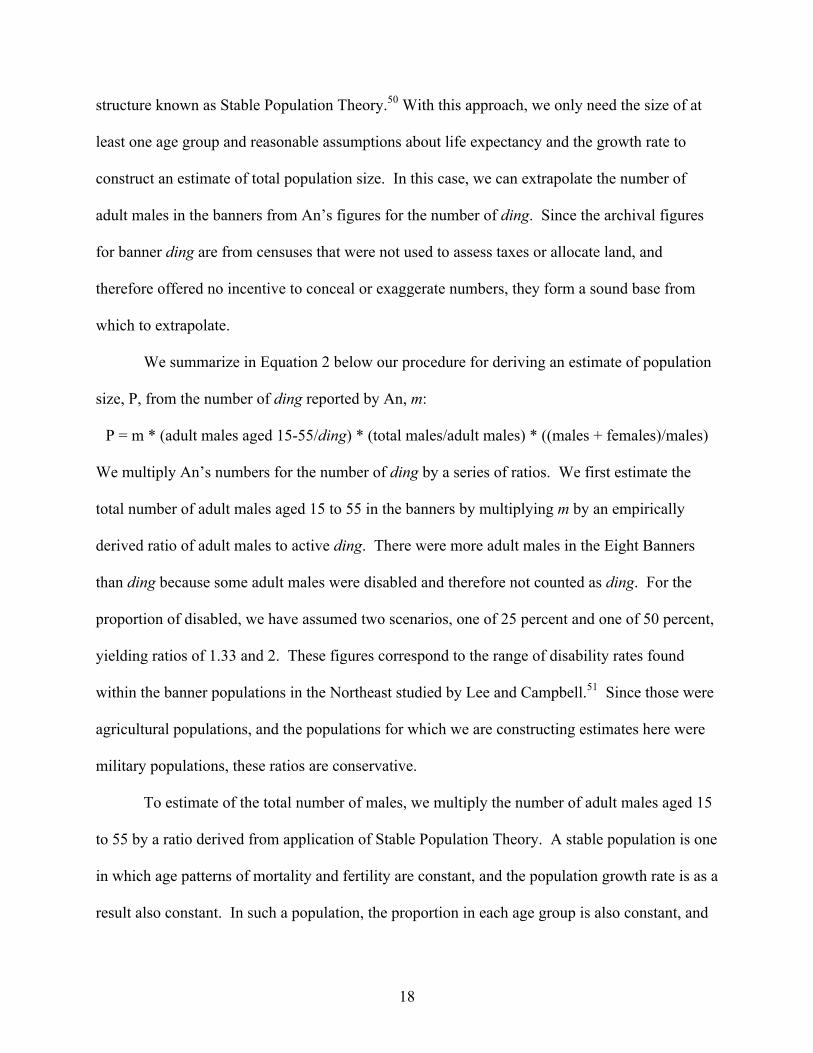
structure known as Stable Population Theory.50 With this approach, we only need the size of at
least one age group and reasonable assumptions about life expectancy and the growth rate to
construct an estimate of total population size. In this case, we can extrapolate the number of
adult males in the banners from An’s figures for the number of ding. Since the archival figures
for banner ding are from censuses that were not used to assess taxes or allocate land, and
therefore offered no incentive to conceal or exaggerate numbers, they form a sound base from
which to extrapolate.
We summarize in Equation 2 below our procedure for deriving an estimate of population
size, P, from the number of ding reported by An, m:
P = m * (adult males aged 15-55/ding) * (total males/adult males) * ((males + females)/males)
We multiply An’s numbers for the number of ding by a series of ratios. We first estimate the
total number of adult males aged 15 to 55 in the banners by multiplying m by an empirically
derived ratio of adult males to active ding. There were more adult males in the Eight Banners
than ding because some adult males were disabled and therefore not counted as ding. For the
proportion of disabled, we have assumed two scenarios, one of 25 percent and one of 50 percent,
yielding ratios of 1.33 and 2. These figures correspond to the range of disability rates found
within the banner populations in the Northeast studied by Lee and Campbell.51 Since those were
agricultural populations, and the populations for which we are constructing estimates here were
military populations, these ratios are conservative.
To estimate of the total number of males, we multiply the number of adult males aged 15
to 55 by a ratio derived from application of Stable Population Theory. A stable population is one
in which age patterns of mortality and fertility are constant, and the population growth rate is as a
result also constant. In such a population, the proportion in each age group is also constant, and

19
can be calculated from the age pattern of mortality rates and the population growth rate. Because
Stable Population Theory links age patterns of demographic rates, population growth rates, and
population age composition together in a mathematical model, it is routinely used for historical
populations as well as some contemporary populations where demographic data are sparse or
incomplete, and only a few parameters can be measured directly or assumed.52 Most relevant to
the situation at hand, application of mathematical models Stable Population Theory can produce
an estimate of the age distribution of the population from a specification of its growth rate and
age pattern of mortality.
While we don’t have direct measures of the age patterns of mortality in our population,
there are enough regularities in the age pattern of mortality in human populations for us to
assume one based on likely values for life expectancy. For decades, demographers have observed
that the age patterns of mortality associated with specific levels of life expectancy tend to fall
into clearly discernible clusters. One of the earliest efforts to identify families of age patterns of
mortality was by Coale and Demeny, who identified four families that they referred to as North,
South, East, and West because of their loose association with the geographic locations where
they were observed.53 For each of these four families, Coale and Demeny created sets of model
life tables, which, for a range of life expectancies, specified the age pattern of mortality
corresponding to each life expectancy. For our age patterns of mortality, we consider two
scenarios corresponding to West Levels 6 and 8 in the Coale and Demeny tables. The first
corresponds to a life expectancy of 30.6 years and the second to one in which the life expectancy
is 34.9 years. These life expectancies lie well within what could be expected of overall life
expectancy in China at this time, and the West family was identified by Lee and Campbell as the
one that corresponded best to the northeast Chinese populations for which they had data that
20
allowed direct estimates of mortality rates..
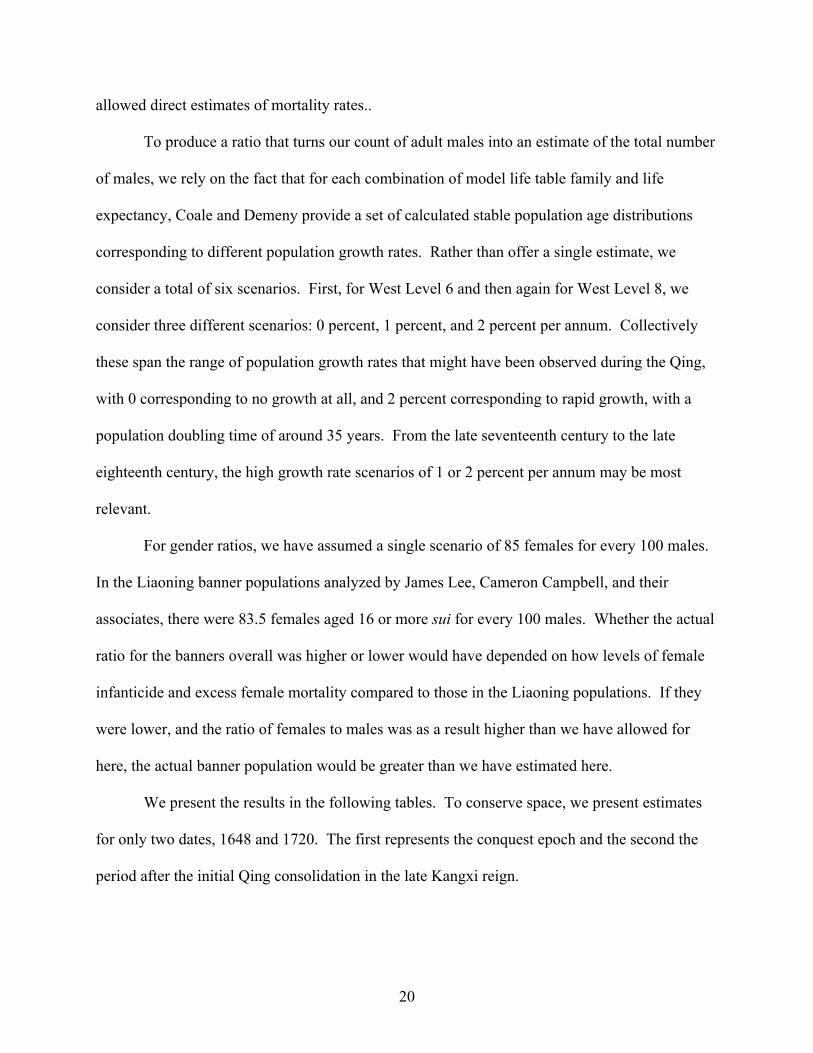
To produce a ratio that turns our count of adult males into an estimate of the total number
of males, we rely on the fact that for each combination of model life table family and life
expectancy, Coale and Demeny provide a set of calculated stable population age distributions
corresponding to different population growth rates. Rather than offer a single estimate, we
consider a total of six scenarios. First, for West Level 6 and then again for West Level 8, we
consider three different scenarios: 0 percent, 1 percent, and 2 percent per annum. Collectively
these span the range of population growth rates that might have been observed during the Qing,
with 0 corresponding to no growth at all, and 2 percent corresponding to rapid growth, with a
population doubling time of around 35 years. From the late seventeenth century to the late
eighteenth century, the high growth rate scenarios of 1 or 2 percent per annum may be most
relevant.
For gender ratios, we have assumed a single scenario of 85 females for every 100 males.
In the Liaoning banner populations analyzed by James Lee, Cameron Campbell, and their
associates, there were 83.5 females aged 16 or more sui for every 100 males. Whether the actual
ratio for the banners overall was higher or lower would have depended on how levels of female
infanticide and excess female mortality compared to those in the Liaoning populations. If they
were lower, and the ratio of females to males was as a result higher than we have allowed for
here, the actual banner population would be greater than we have estimated here.
We present the results in the following tables. To conserve space, we present estimates
for only two dates, 1648 and 1720. The first represents the conquest epoch and the second the
period after the initial Qing consolidation in the late Kangxi reign.

21
Tables 5a-b. Eight Banner population, assuming life expectancy 30.6 and population growth 0
percent
5a. Scenario 1. Disability rate 25 percent
Manchu Mongol Han Sub-total booi/other Total 1648 males 112,453 58,535 93,235 264,223 441,205 705,428 females 95,585 49,755 79,250 224,590 375,024 599,614 total 208,038 108,290 172,485 488813 816,229 1,305,042 1720 males 313,399 125,248 416,606 855,253 557,048 1,412,301 females 266,389 106,461 354,115 726,965 473,491 1,200,456 Total 579,788 231,709 770,721 1,582,218 1,030,539 2,612,757
5b. Scenario 2. Disability rate 50 percent
Manchu Mongol Han Sub-total booi/other Total 1648 males 179,925 93,655 149,175 422,755 705,298 1,128,053 females 152,936 79,607 126,799 359,342 599,503 958,845 total 332,861 173,262 275,974 782,097 1,304,801 2,086,898 1720 males 501,438 200,397 666,569 1,368,404 891,277 2,259,681 females 426,222 170,338 566,584 1,163,144 757,586 1,920,730 Total 927,660 370,735 1,233,153 2,531,548 1,648,863 4,180,411

22
Tables 5c-d. Eight Banner population, assuming life expectancy 30.6 and population growth 1
percent
5c. Scenario 3. Disability rate 25 percent
Manchu Mongol Han Sub-total booi/other Total 1648 males 120,448 62,696 99,863 283,007 472,571 755,578 females 102,381 53,292 84,884 240,557 401,685 642,242 total 222,829 115,988 184,747 523,564 874,256 1,397,820 1720 males 335,679 134,152 446,223 916,054 596,650 1,512,704 females 285,327 114,029 379,290 778,646 507,153 1,285,799 Total 621,006 248,181 825,513 1,694,700 1,103,803 2,798,503
5d. Scenario 4. Disability rate 50 percent
Manchu Mongol Han Sub-total booi/other Total 1648 males 192,717 100,314 159,780 452,811 756,114 1,208,925 females 163,810 85,267 135,813 384,890 642,697 1,027,587 total 356,527 185,581 295,593 839,182 1,398,811 2,236,512 1720 males 537,087 214,644 713,957 1,465,688 954,640 2,420,328 females 456,524 182,447 606,864 1,245,835 811,444 2,057,279 Total 993,611 397,091 1,320,821 2,711,523 1,766,084 4,477,607
23
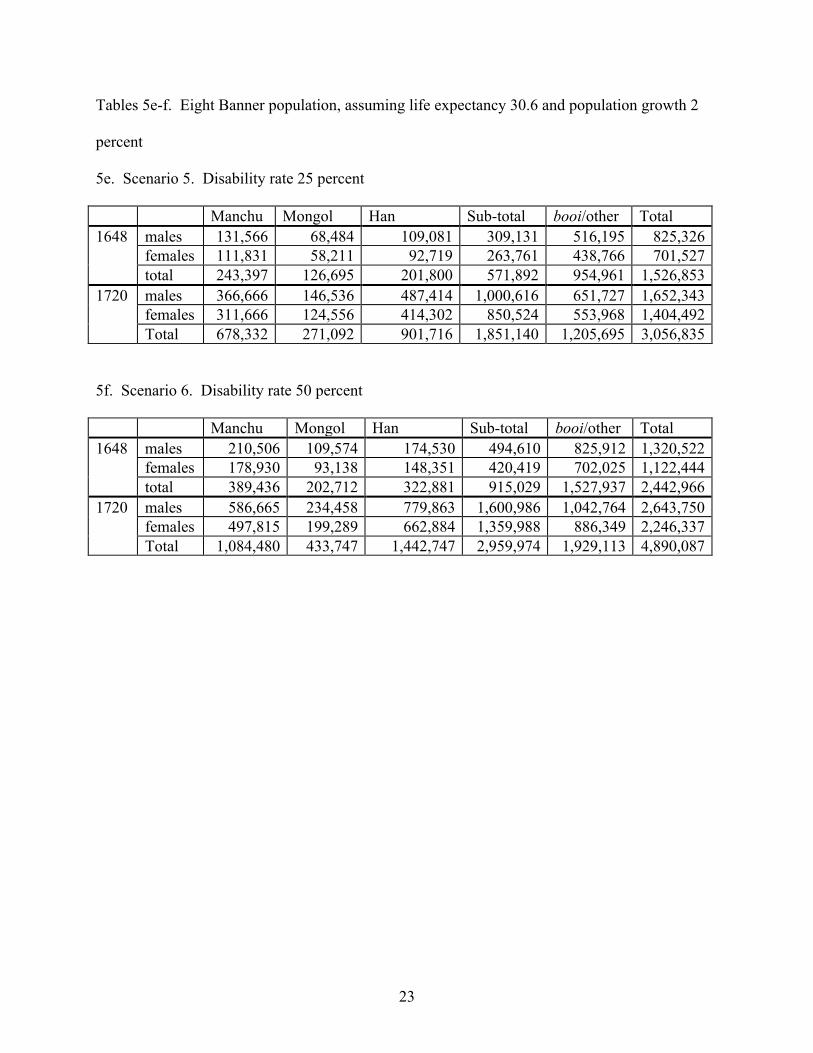
Tables 5e-f. Eight Banner population, assuming life expectancy 30.6 and population growth 2
percent
5e. Scenario 5. Disability rate 25 percent
Manchu Mongol Han Sub-total booi/other Total 1648 males 131,566 68,484 109,081 309,131 516,195 825,326 females 111,831 58,211 92,719 263,761 438,766 701,527 total 243,397 126,695 201,800 571,892 954,961 1,526,853 1720 males 366,666 146,536 487,414 1,000,616 651,727 1,652,343 females 311,666 124,556 414,302 850,524 553,968 1,404,492 Total 678,332 271,092 901,716 1,851,140 1,205,695 3,056,835
5f. Scenario 6. Disability rate 50 percent
Manchu Mongol Han Sub-total booi/other Total 1648 males 210,506 109,574 174,530 494,610 825,912 1,320,522 females 178,930 93,138 148,351 420,419 702,025 1,122,444 total 389,436 202,712 322,881 915,029 1,527,937 2,442,966 1720 males 586,665 234,458 779,863 1,600,986 1,042,764 2,643,750 females 497,815 199,289 662,884 1,359,988 886,349 2,246,337 Total 1,084,480 433,747 1,442,747 2,959,974 1,929,113 4,890,087
24
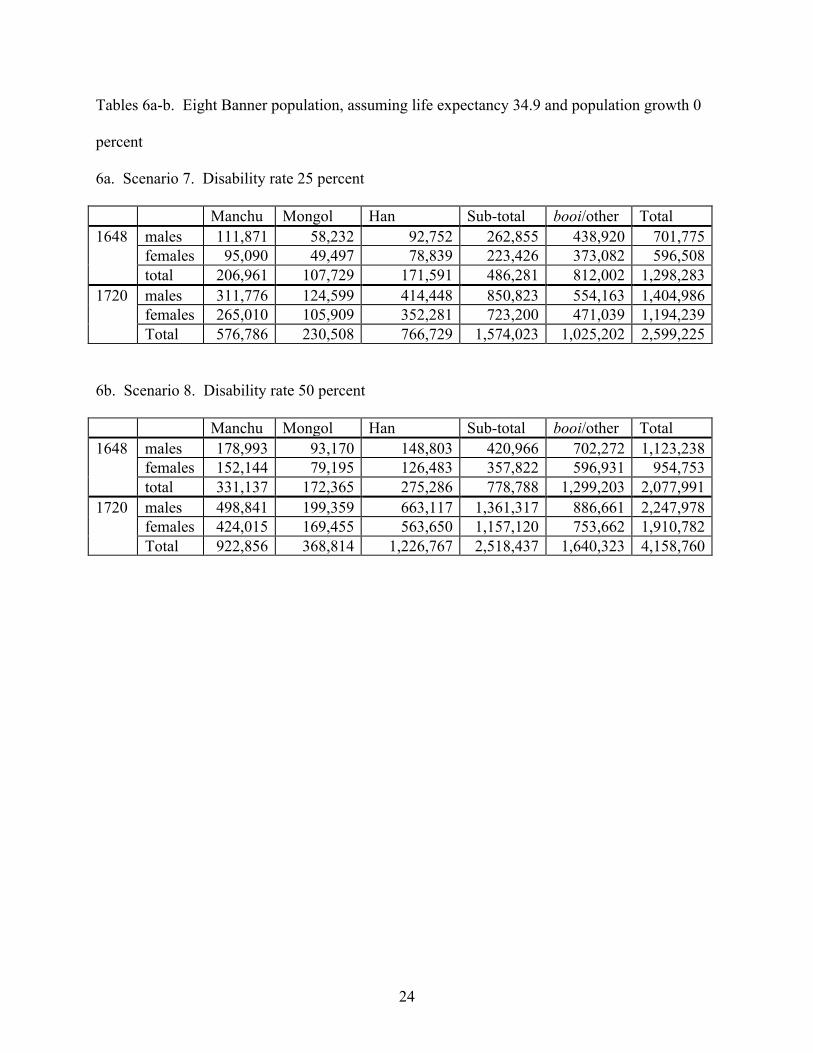
Tables 6a-b. Eight Banner population, assuming life expectancy 34.9 and population growth 0
percent
6a. Scenario 7. Disability rate 25 percent
Manchu Mongol Han Sub-total booi/other Total 1648 males 111,871 58,232 92,752 262,855 438,920 701,775 females 95,090 49,497 78,839 223,426 373,082 596,508 total 206,961 107,729 171,591 486,281 812,002 1,298,283 1720 males 311,776 124,599 414,448 850,823 554,163 1,404,986 females 265,010 105,909 352,281 723,200 471,039 1,194,239 Total 576,786 230,508 766,729 1,574,023 1,025,202 2,599,225
6b. Scenario 8. Disability rate 50 percent
Manchu Mongol Han Sub-total booi/other Total 1648 males 178,993 93,170 148,803 420,966 702,272 1,123,238 females 152,144 79,195 126,483 357,822 596,931 954,753 total 331,137 172,365 275,286 778,788 1,299,203 2,077,991 1720 males 498,841 199,359 663,117 1,361,317 886,661 2,247,978 females 424,015 169,455 563,650 1,157,120 753,662 1,910,782 Total 922,856 368,814 1,226,767 2,518,437 1,640,323 4,158,760

25
Tables 6c-d. Eight Banner population, assuming life expectancy 34.9 and population growth 1
percent
6c. Scenario 9. Disability rate 25 percent
Manchu Mongol Han Sub-total booi/other Total 1648 males 118,955 61,919 98,625 279,499 466,716 746,215 females 101,112 52,631 83,831 237,574 396,709 634,283 total 220,067 114,550 182,456 517,073 863,425 1,380,498 1720 males 331,520 132,490 440,694 904,704 589,257 1,493,961 females 281,792 112,617 374,590 768,999 500,869 1,269,868 Total 613,312 245,107 815,284 1,673,703 1,090,126 2,763,829
6d. Scenario 10. Disability rate 50 percent
Manchu Mongol Han Sub-total booi/other Total 1648 males 190,329 99,071 157,801 447,201 746,746 1,193,947 females 161,780 84,210 134,131 380,121 634,734 1,014,855 total 352,109 183,281 291,932 827,322 1,381,480 2,208,802 1720 males 530,432 211,984 705,111 1,447,527 942,812 2,390,339 females 450,867 180,186 599,344 1,230,397 801,390 2,031,787 Total 981,299 392,170 1,304,455 2,677,924 1,744,202 4,422,126

26
Tables 6e-f. Eight Banner population, assuming life expectancy 34.9 and population growth 2
percent
6e. Scenario 11. Disability rate 25 percent
Manchu Mongol Han Sub-total booi/other Total 1648 males 129,181 67,242 107,104 305,527 506,838 810,365 females 109,804 57,156 91,038 257,998 430,812 688,810 total 238,985 124,398 198,142 561,525 937,650 1,499,175 1720 males 360,019 143,380 478,579 981,978 639,913 1,621,891 females 306,016 121,873 406,792 834,681 543,926 1,378,607 Total 666,035 265,253 885,371 1,816,659 1,183,839 3,000,498
6f. Scenario 12. Disability rate 50 percent
Manchu Mongol Han Sub-total booi/other Total 1648 males 206,290 107,587 171,366 485,243 810,940 1,296,183 females 175,347 91,449 145,661 412,457 689,299 1,101,756 total 381,637 199,036 317,027 897,700 1,500,239 2,397,939 1720 males 576,031 230,207 765,726 1,571,964 1,023,861 2,595,825 females 489,626 195,676 650,867 1,336,169 870,282 2,206,451 Total 1,065,657 425,883 1,416,593 2,908,133 1,894,143 4,802,276

27
Summarizing these results, we find that at the time of the conquest, the Eight Banner
population at large was within the range of 1.3 and 2.44 million people, and that seventy years
later it had grown to between 2.6 and 4.8 million. The former number – our conservative
estimate of the size of the banner population – is twice to four times as large as any previous
estimates of banner population at the time of the conquest. Population in the Manchu banners in
the middle seventeenth century was somewhere between 206,000 and 390,000, growing by 1720
to between 577,000 and 1.08 million. (High- and low-end estimates for each population group
are tabulated in Table 7.) Everywhere, the most positive outcome is Scenario 6, while the most
negative is Scenario 7. The single variable with the greatest influence on the outcome turns out
to be the rate assumed for disability.

28
Table 7. Range of Estimated Population Sizes (<P>) for the Eight Banners, 1648 and 1720
Manchu Mongol Chinese Sub-total Bondser-vants/other
Total
1648 males 111,871- 210,506
58,232- 109,574
92,752- 174,530
263,319- 495,485
438,920- 825,912
702,239- 1,321,397
females 95,090- 178,930
49,497- 93,138
78,839- 148,351
223,821- 421,162
373,082- 702,025
596,903- 1,123,188
total 206,961- 389,436
107,729- 202,712
171,591- 322,881
487,140- 916,647
812,002- 1,527,937
1,299,142- 2,444,585
1720 males 311,876- 586,665
124,599- 234,458
414,448- 779,863
850,763- 1,600,872
554,163- 1,042,764
1,404,926- 2,643,635
females 265,010- 497,815
105,909- 199,289
352,281- 662,884
723,149- 1,360,741
471,039- 886,349
1,194,187- 2,247,090
Total 576,786- 1,083,480
230,508- 433,747
766,279- 1,442,747
1,573,912- 2,961,613
1,025,202- 1,929,113
2,599,113- 4,890,725

29
As before, in thinking about the overall size of the Manchu population, it should be kept in mind
that in addition to those enrolled in the regular Manchu banners, a significant proportion of the
“bondservant/other” population – certainly well over 50 percent – was registered as Manchu.
Only if one keeps this element of the Manchu population in mind does the estimate of Mo
Dongyin for Manchus at the time of the conquest (600,000) appear reasonable.
Conclusion
The size of the Eight Banner population generally, and the Manchu population especially,
has long been the subject of scholarly conjecture. That the Qing dynasty was established by a
people known to be dwarfed in numbers by the Han Chinese people whom they ruled has made
the question one of real significance, and not just idle curiosity. Since virtually all of the original
Qing people were enrolled in the banners, by counting the number of people in the banners we
can get a good idea of just how numerically strong the Qing cause was. As the first section of
this essay has shown, estimates of the size of this population have varied tremendously, making
it hard to know which to credit and which to dismiss. Moreover, even though reasonably
trustworthy estimates of the able-bodied male (ding) population appeared long ago, no equally
reliable numbers have ever emerged as to the overall size of any part of the banner population.
This paper has combined very good figures of ding population taken from archival
documents published in 1983 and 1992 with plausible demographic models that are far superior
to the crude type of calculations made using the Household Dependent Method. This method
does not permit us to come up with a “magic number” for each group at each date. Rather, using
variables such as life expectancy, disability, rate of population growth, and gender ratios, the
method we have used allows us to predict a range of scenarios which frame the possible

30
expectations for banner populations, given the archival figures at our disposal. These figures
show that in the 1640s, when the Qing first established control over China, the total number of
those enrolled in the banner system was between 1.3 and 2.44 million, that is, between 1 and 2
percent of the contemporary Chinese population, assuming a figure of 100 million for ca. 1650.
Seventy-two years later, when Qing control was already firmly consolidated, the total population
in the Eight Banners had grown considerably, to between 2.6 and 4.9 million, or 2 and 4 percent
of the Han population (then at around 120-130 million). This proportion, while still relatively
small, comes to twice the size of most previous estimates.54
With a doubling of the population in such a short time, it is not surprising, then, that in
the 1720s the court began to act to limit banner membership. Given the rapid increase of
numbers in the Chinese banners in particular, it is also not surprising that the court decided to
direct such efforts mainly at them. Unfortunately, because we know that large numbers of
people were in fact removed from the banner lists in the middle Qianlong reign, in effect
artificially distorting the population structure, it is not possible to accurately project population
size into the later eighteenth or nineteenth centuries. Nonetheless, we at last know with some
confidence the scale of the banner population in the first half of the Qing, the number of soldiers
in the conquest, and the proportion to the general population the conquering Manchus
represented.
NOTES
1 Da Qing Huidian (1690 edition), fanli, p. 4a: “[Because] the troops and horses of the Eight
Banners are [continually regrouping] like the clouds, it is difficult to count them. Details on
troops in the Zhili and provincial garrisons and on the Green Standard Army troops are all

31
provided in sequence [below], according to their location.” Identical language is used in the
Yongzheng Huidian of 1734; it does not appear in the 1768 Huidian. See the comments by
Wang Qingyun in Shiqu yuji (ca. 1850; Beijing: Beijing guji chubanshe, 1985), juan 2, pp. 75-76.
The first official publication to carry complete information on the size of banner forces deployed
around the country was the Huangchao wenxian tongkao, ordered in 1747. See Table 1 below.
2 Wei Yuan, Shengwu ji (1842; Beijing: Zhonghua shuju, 1984), juan 11, pp. 467.
3 Nominally, a company was made up of 300 men (zhuangding 壯丁/haha) along with wives,
children, and other dependents. But we know that this number was often not met. The actual
number varied between 150 and 300, stabilizing under the Kangxi emperor (r. 1661-1722) to
130-140 (Baqi tongzhi, juan 17, p. 297). In the later Qing this figure could sometimes dip below
100. See also note 8 below.
4 Most notably, the 1739 Baqi tongzhi and the 1764 edition of the Huidian differ on this point. It
was to resolve this disagreement – and not, it should be pointed out in fairness, to speculate on
the size of the banner population – that Fang Chaoying wrote his famous article, “A Technique
for Estimating the Numerical Strength of the Early Manchu Military Forces” (Harvard Journal
of Asiatic Studies 13.1-2 [June 1950]). Fang showed clearly that the figures in the Baqi tongzhi
were correct. One scholar has attributed to Fang an estimate of “slightly under 170,000” in the
Qing armies at the time of the conquest, a figure supposedly derived by multiplying the number
of companies by 300 men per company (Pamela Kyle Crossley, Orphan Warriors [Princeton:
Princeton University Press, 1990], p. 231 n.1). We find no such estimate in Fang’s article, and
assume that this figure must be the result of calculations by the author herself, extrapolated upon
numbers found in Fang’s work. Fang’s only comment on the overall size of the early Qing
armies was to the effect that “the total number of Banner Forces sent to the various fronts during
32
the seven years of this war [i.e., the Rebellion of the Three Feudatories]” was between 160,000
and 200,000.” This would, of course, correspond to bing, not ding (Fang, “A Technique,” p.
202).
5 In principle, every healthy male 15 years of age and over was enrolled in a company, together
with his entire household. Qing regulations further stipulated that one of every three must serve
as a soldier (in the Chinese banners this was one of every four or five), though in the conquest
period no doubt a higher proportion of males was pressed into active duty. But it is doubtful that
company size ever really reflected the actual number of zhuangding in the households attached to
companies. For this reason, it is misleading to rely on the number of companies to calculate the
number of males in the banners. This is illustrated by the following example: In 1647 the total
number of companies in the Eight Banners was 600 (Fang, “A Technique,” Table II), plus an
additional 74 bondservant companies. Assuming from 150 to 300 men per company, and
assuming that this figure equals the total number of ding per company, we arrive at a range of
between 101,100 and 202,200 ding. However, as the archival figures presented in Table 2 below
show, the total number of ding in 1648 was actually 346,931, 40% greater than the total
predicted number of males. Moreover, this discrepancy widened over time, as population grew
(while the number of companies grew, too, this expansion came to a halt in the mid-1700’s, with
around 2,000 companies in the capital and provinces). Hence it is vital to distinguish between
nominal company size (i.e., zhuangding available for potential military service) and the actual
number of males in a company (i.e., all ding).
6 Documents from the Eight Banner garrisons show household size varied from between three
dependents per active soldier at some garrisons to as much as nine or ten dependents per active
soldier at others. See Mark Elliott, The Manchu Way: Ethnic Identity and the Eight Banners in
33
Late Imperial China (Stanford: Stanford University Press, 2001). See also the estimates in Han
Guanghui, Beijing lishi renkou dili (Beijing: Beijing daxue chubanshe, 1996), pp. 122-123.
7 Various types of people of unfree status (“slaves”) also lived in banner households, but they are
never counted and do not figure in any of our calculations here.
8 Shu-he-de, “Baqi kaiken biandi shu” (1737), Shen Qiyuan, “Nishi wuce” (n.d.), in He
Changling, ed., Jingshi wenbian (1826), juan 35.
9 Da Qing Huidian (80 juan, 1818), juan 12, pp. 22a-b. See Table 1. Qing regulations called for
a complete count of the banner population every three years, household by household, company
by company; see, for instance, Baqi tongzhi (chuji) (1739, 250 juan), juan 17, pp. 296-197, Da
Qing Huidian shili (preface 1818, 920 juan), juan 839, p. 3a, and Qinding hubu zeli (1866, 100
juan), juan 1, p. 1a-2a. Existing documents relating to subsidiary banner populations (mostly
agricultural serfs) in the Northeast indicate that such counts were indeed carried out regularly
throughout the Qing. Unfortunately, population registers for regular banner populations in
Beijing and the garrisons of the type that the Huidian compilers probably consulted have not
survived in similar numbers. Searches by Elliott have turned up a few examples, but only a small
fraction of the number one would expect to find. Some of these materials are in the library of the
Chinese Academy of Social Sciences; most are in the holdings of the First Historical Archives of
China, Beijing. They are listed in two catalogues, No. 544/23-2 (Baqi dutong yamen quanzong)
and No. 497/13-2 (Hubu/duzhibu). Thanks to Ms. Zou Ailian of the First Historical Archives for
her assistance in locating these materials. Other registers are available from the Genealogical
Society of Utah; for a description of these sources, see Melvin Thatcher, “Selected Sources for
Late Imperial China at the Genealogical Society of Utah,” Late Imperial China 19.1 (June 1998),
pp. 111-129.

34
10 Wei, Shengwu ji, juan 11, pp. 467-469. For the capital, these totals break down as follows:
21,385 guardsmen, 34,627 cavalry, 21,158 infantry, 27,408 supernumeraries, 10,834 artisans and
others, and 10,000 gendarmerie. For the garrisons: 8,758 in the metropolitan zone; 35,360 in the
Northeast; 45,540 in the provinces; 15,140 in Xinjiang; and 2,970 posted to the imperial
mausolea, hunting grounds, and Willow Palisade gates.
11 Wang, Shiqu yuji, juan 2. See also Fang, “A Technique,” 194. Wang consulted the Da Qing
Huidian shili (1818, 920 juan), juan 837.
12 Da Qing Huidian (1690, 162 juan), juan 82. This figure excludes officers.
13 Da Qing Huidian (1732, 250 juan), juan 114, 217. Figure excludes officers.
14 Ortai et al., eds., Baqi tongzhi (chuji) (1739, 250 juan), juan 26-28. Figure includes officers.
The breakdown is as follows: 3,735 in the metropolitan zone, 28,536 in the Northeast, 51,480 in
the provinces. No complete total of the number of banner troops in the capital appears here, as
the editors chose to repeat the same evasive language as the earlier Huidian (juan 26, p. 490).
Moreover, though there is detailed information on the number of companies, information on
company size is varied and conflicting. There is, however, at least one reference to the total
number of Chinese banner soldiers in the capital ca. 1730 (17,528) and the additional number of
able, but idle, Manchu, Mongol, and Han bannermen (10,000; see juan 26, p. 506).
15 Huangchao wenxian tongkao (1747, 300 juan), juan 179, 181-189. This figure breaks down to
100,425 in the capital and 109,840 in the garrisons. For garrisons in Shengjing, Jilin,
Heilongjiang, and the metropolitan area, we have relied on the totals provided in Table 2.1 in
Chen Feng, Qingdai junfei yanjiu (Wuhan: Wuhan daxue chubanshe, 1992), p. 20. Note that the
total there, according to his own figures, should read 105,459.
16 Shen, “Nishi wuce.”

35
17 Da Qing Huidian (1764, 100 juan), juan 96. Includes officers. No figures are presented for
Beijing, although the number of companies (1,166) is given, together with the statement that in
principle there are 300 men per company. However, the editors disavowed any pretense at
providing an accurate total, noting that they wished only “to give a sense of the numbers
involved.”
18 Da Qing Huidian (1818, 80 juan), juan 12. The breakdown is as follows: In the capital and
provinces 222,968 Manchus, 55,639 Mongol (plus 20,729 Oirats, Chakhars, Bargas, and others),
143,554 Han bannermen and bondservants, 80,099 unattached servants. The total of Manchus,
Eight-Banner Mongols, and Han bannermen comes to 422,161, the figure cited by Wang
Qingyun.
19 Qinding zhongshu zhengkao (1825), juan 31. Figures are cited from Chen, Qingdai junfei
yanjiu, pp. 20-21. Note that the total there (275,851) is in error.
20 Wei, Shengwu ji, juan 11. Figures for conquest derived by multiplying number of companies
by 150 men per company.
21 Wang, Shiqu yuji, juan 4. Figures are attributed to 1818 Huidian.
22 Zeng Guofan, “Yitai bingshu,” in Zeng Wenzheng gong zougao, juan 1, cited in Chen Feng,
Qingdai junfei yanjiu, p. 21. Chen disagrees with Luo Ergang, who claimed that Zeng’s 250,000
was an error for 350,000, but Luo seems persuasive. See Luying bingzhi (1945; 2nd ed., Beijing:
Zhonghua shuju, 1984), p. 7 n. 7.
23 Weng Tongjue, Huangchao bingzhi kaolue (6 juan, 1875), juan 2, p. 4b-7a.
24 Yao Wendong, “Baqi bingzhi kao,” in Ge Shijun, ed., Jingshiwen xubian (1888, 120 juan),
juan 62. Regarding the conquest figure, Yao (following Wei Yuan) wrote that, “In the first year
of Shunzhi, [when] the Shizu emperor established the capital at Yanjing, all the Eight Banner

36
soldiers who took part in the conquest [lit., “who followed the dragon through the pass”]
numbered not less than 200,000” ( 順治元年世祖章皇帝定都燕京各八旗兵從龍入關者不下
二十萬). The later figures show 104,376 in capital and 107,768 outside the capital (8,758 in
metropolitan garrisons, 35,360 in the Northeast garrisons, 45,540 in the provincial garrisons,
15,140 in Xinjiang garrisons, 2,970 at the imperial mausolea, and 27,000 supernumeraries). The
figure of 300,000 refers to zhuangding.
25 Da Qing Huidian (120 juan, 1899 ed.), juan 86.
26 Iakinf (N. Ia. Bichurin), Statischeskoe opisanie Kitaiskoi imperii v dvukh chastiakh (Beijing:
Russian Ecclesiastical Mission, 1910), p. 129. This figure breaks down to 135,929 in Beijing,
100,038 in the garrisons, and 27,408 supernumeraries.
27 Inaba Iwakichi, Shinchō zenshi (Tokyo: 1913). Figures are for the early nineteenth century.
Divisions break down as follows: 220,960 Manchus, 55,639 Mongols, 143,893 Chinese banners,
Imperial Household Department, and bondservants. The figures are attributed to Wei Yuan, but
are clearly those of the 1818 Huidian.
28 Zhao Erxun, eds., Qingshi gao (Beijing: Zhonghua shuju, 1976), juan 130. Though there is a
description of the garrison system, tabulations of its size are absent, except for the Northeast
(35,300).
29 Luo, Luyingbing zhi, p. 7.
30 Mo Dongyin, Manzushi luncong (Beijing: Renmin chubanshe, 1958), pp. 130-135, where the
number of Manchus at the time of the conquest is given at 100,000. The figure for the total
Manchu population in 1661 is derived by calculating an average number of 9 dependents (p. 134)
per soldier. The total for the late 1800s is arrived at by using numbers from Qingshi gao and
1899 Huidian, but omits officers in capital. Mo also provides a summary of Ming and Korean
37
estimates of Qing forces.
31 John K. Fairbank and Edwin Reischauer, East Asia: The Great Tradition (Boston: Houghton
Mifflin, 1969), p. 222. No source given.
32 Wu Wei-p’ing, “The Development and Decline of the Qing Eight Banners” (Ph.D. thesis,
University of Pennsylvania, 1970), pp. 90-91, 100-103. Wu derives his figure for conquest bing
by multiplying the number of companies by 200 men per company. The figure for 1812 ding is
derived from 1818 Huidian (discrepancies with other figures owe to arithmetical error). Figure
for 1812 renkou is derived by multiplying ding figure by 3, then adding 80,000 “unattached
bondservants.” Figure for conquest renkou is derived by taking Wu’s estimate that the banner
population at most doubled from the time of the conquest, and halving 1812 figure. Wu does not
provide this figure himself.
33 Manzu jianshi (Beijing: Zhonghua shuju, 1979) pp. 100-101. Figures derived from 1764
Huidian. Authors say only that Beijing forces total “over 100,000”; total for garrisons specified
at 107,760.
34 Li Xinda, “Ruguan qian de baqi bingshu wenti,” Qingshi luncong 3 (Beijing: Zhonghua shuju,
1982), pp. 155-163. Figures derived by multiplying number of companies by 200 men per
company.
35 Yang Xuechen and Zhou Yuanlian, Qingdai baqi wanggong guizu xingshuai shi (Shenyang:
Liaoning renmin chubanshe, 1986), p. 137. Their figures are derived by multiplying the number
of companies by 200 men per company, then multiplying by .666 to get number of actual
soldiers. The total shown is the result of this operation, plus the total number of Han bannermen
(it should be 78,600 if same percentage of total Han bannermen (32,800) is assumed to be active
military).
38
36 To reflect the total of banner forces only, the number of non-banner soldiers associated with
Qing invasion (mainly armies led by Geng Zhongming, Shang Kexi, and Kong Youde), which
they say is 20,000 men, is subtracted from their total of 138,400.
37 Teng Shaozhen, Baqi zidi (Beijing: Zhongguo huaqiao chuban gongsi, 1989), p. 54, citing
Qing Shengzu (Kangxi) huangdi shilu, juan 96. We have been unable to confirm this figure in
the Shilu.
38 Fu Kedong and Chen Jiahua, “Baqi jianli qian Manzhou niulu he renkou chutan,” in Wang
Zhonghan, ed., Manzushi yanjiuji (Beijing: Zhongguo Shehui kexue chubanshe, 1990), pp. 276-
277. Figures given are for 1619. Figure for total population is derived by multiplying number of
companies by average 200 men per company and then multiplying again by 5 for estimated
number of dependents (4).
39 Pamela Kyle Crossley, Orphan Warriors (Princeton: Princeton University Press, 1990), pp. 23,
91, 252. On p. 23, Crossley says that the total garrison population for the later eighteenth
century “probably hovered near three million.” To this we have added her estimate of the
population of Beijing, which she elsewhere says to have been “as many as half a million
Manchus” in the mid-nineteenth century. She gives as the basis for this estimate the figure of
150,000 in the Beijing garrison cited by Thomas Taylor Meadows in The Chinese and Their
Rebellions (London, 1856), p. 31.
40 Li Yanguang and Guan Jie, Manzu tongshi (Shenyang: Liaoning minzu chubanshe, 1991), pp.
309-310. For ding totals, figures are derived by multiplying the number of companies by
average of 200 men per company (for conquest period) and by 150 men per company (for
Yongzheng and later). For total population, the number of ding is multiplied by 5 for estimated
number of dependents (4); since Li and Guan estimate that there were actually 5 dependents per

39
ding, figures for ding should in fact be multiplied by 6, yielding higher population estimates
(738,000 and 1,034,100, respectively). The final population estimate for 1909 is obtained by
first deriving a household:population ratio of 6.26 (derived using the number of known
households in the Northeast at this time – 369,055 – with a total population estimate for the
Northeast of 2.31 million), and then multiplying it by the number of households in the banners
according to a 1909 census – 368,548. The resulting figure (2,307,110), is then added to the 2.31
million living in the Northeast, for a total of 4.62 million. 5,260,686, which they claim to be the
“Manchu population” (Manzu renkou 滿族人口) at the turn of the century, is evidently an
arithmetical error.
41 Chen, Qingdai junfei yanjiu, pp. 19-23. Figure for conquest derived from base figures in Li
Xinda. Figure of 250,000 is based on bing totals drawn from Huangchao wenxian tongkao,
Huangchao bingzhi kaolue, and the 1899 Huidian.
42 Han Guanghui, Beijing lishi renkou dili, pp. 121-124. Figures derived by multiplying number
of companies by average of 150 soldiers (rending) per company.
43 Liu Xiaomeng, Baqi zidi (Fuzhou: Fujian renmin chubanshe, 1996), p. 9. No source is
provided for his conquest figure. The figure for ca. 1850 is derived from numbers in Qingshi
gao (garrison population is only estimated at “over 100,000”). Liu (pp. 13-14) also provides
figures for population of Beijing at this time (634,000), derived by multiplying Qingshi gao
figure for paid positions in Beijing (126,989) and multiplying by 5 for the number of dependents.
However, since Liu claims that number of dependents was 5 per bing, the correct estimate of
Beijing banner population should be the number of officers and soldiers, plus dependents, which
brings the total to 762,000.
44 An Shuangcheng, “Shun-Kang-Yong sanchao baqi ding’e qianxi,” Lishi dang’an 1983.2, pp.

40
100-103.
45 The edict is included on page 429 of An’s 1992 article (see below): “How many able-bodied
males (nanding) were there at the time [we] entered Beijing from Shengjing? How many are
there now? Investigate and report.”
46 An’s article is also the source for the statement by Susan Naquin and Evelyn Rawski that “by
1648, fewer than 16 percent of the bannermen were actually of Manchu blood.” Chinese Society
in the Eighteenth Century (New Haven: Yale University Press, 1987), p. 4. The note to this
article appears on p. 240 n3.
47 On the ethnic divisions among bondservants, see Elliott, The Manchu Way, Chapter 1. The
reader is advised that the classification of populations here and throughout this article as
“Manchu,” “Mongol,” and “Han” reflects the classification systems in force at the time, and not
any judgment on the part of the authors as to the basis upon which such categories were created,
or how individual identity, ethnic or otherwise, may have been constructed. On these matters,
scholarly opinions remain divided: relevant discussions may be found in Elliott 2001 and in the
work of Pamela Kyle Crossley, including Orphan Warriors (Princeton: Princeton University
Press, 1990) and A Translucent Mirror (Berkeley: University of California Press, 2000). See
also Elliott, “Ethnicity in the Qing Eight Banners,” in Pamela Crossley, Helen Siu, and Donald
Sutton, eds., Empire at the Margins (Berkeley: University of California Press, 2006), pp. 28-57.
48 An Shuangcheng, “Shunzhi chao baqi nanding Manwen dang’an xuanyi,” Manxue yanjiu 1
(1992), pp. 413-421.
49 Separate figures for Han bannermen and booi for 1723 are not given in An’s 1983 article. As
noted above, he cites only a total number of 444,416 ding in the Chinese banners, bondservant
companies, and miscellaneous other Han populations under the banners. But we can estimate the

41
breakdown of this population by subtracting the total Manchu and Mongol banner population
(213,127) from the total EB population (657,573), for a total of 444,446 (not 444,416). If, as in
1721, “booi and other Han” still constituted about 35% of the total EB population in 1723, that
should give roughly 230,151 for this group. Subtracted from 444,446, this leaves 214,295 in the
Chinese banners. Percentages are based on these hypothetical totals.
50 For an introduction to stable population theory, see Ansley Coale and Paul Demeny, Regional
Model Life Tables and Stable Populations (Princeton: Princeton University Press, 1966/1983).
51 James Lee and Cameron Campbell, Fate and Fortune (Cambridge: Cambridge University
Press, 1995), p. 45.
52 For an introduction to stable population theory and its applications, see Chapter 7 of Samuel H.
Preston, Patrick Heuveline and Michel Guillot, Demography: Modeling and Measuring
Population Processes (New York: Wiley Blackwell, 2000).
53 See the review of estimates of life expectancy in historical China in James Z. Lee and Wang
Feng, One Quarter of Humanity: Malthusian Mythologies and Chinese Realities (Cambridge,
Mass.: Harvard University Press, 1999), p. 54.
54 It may be argued that the figures represented above still span a wide range and are in fact no
more “precise” than those arrived at by guesses made about how many banner households there
were and how big they might have been. To this, we would respond that, until and unless large
numbers of additional archival records are found documenting the composition of banner
households in greater detail, we are unlikely ever to have very much more exact numbers of
these populations. However, because we have depended here upon tried-and-true methods of
demographic analysis based on real data, and not guesses based on nominal norms, the figures
we have arrived at can be approached with much greater confidence. Even if, as is true in a few

42
instances, there is broad agreement between the end results arrived at using the two different
types of calculation, this should not be understood as providing a confirmation of the general
validity of the Household Dependent Method, only of the principle that if one gathers together
enough different estimates, some are bound to fall within the ranges determined by social science
theory.