Embed Size (px)
Citation preview
R.L. Garcia October 2015
LI-COR BioSciences
A Deeper Look at Photosynthesis:
Fluorescence Theory and Practice
Using The LI-6400XT
Copyright © 2014 LI-COR Biosciences, Inc. All rights reserved.
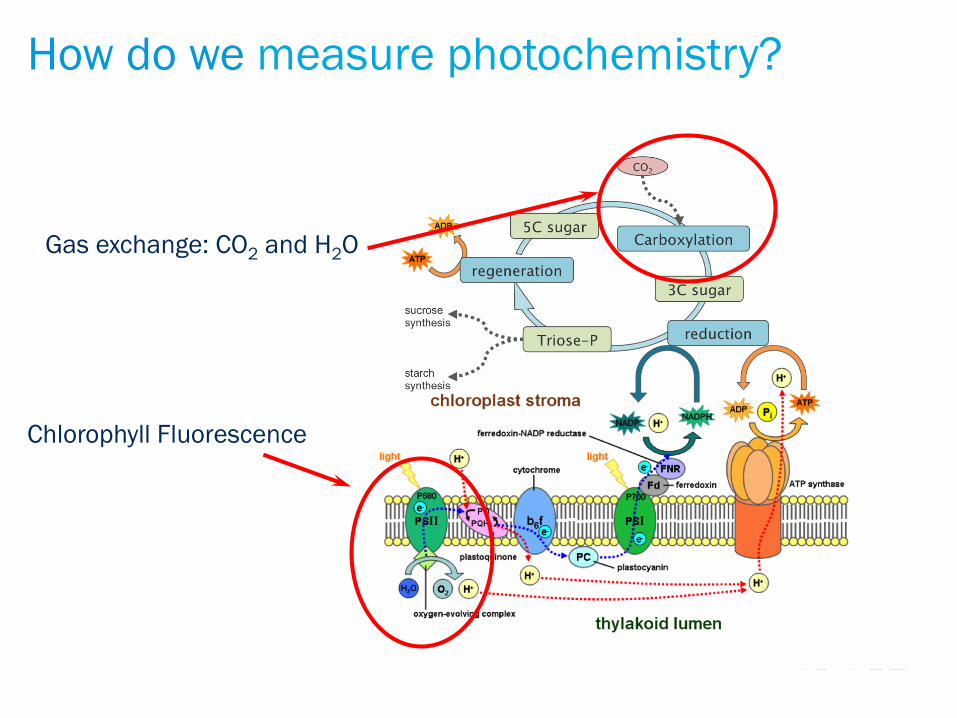
How do we measure photochemistry?
Gas exchange: CO2 and H2O
Chlorophyll Fluorescence
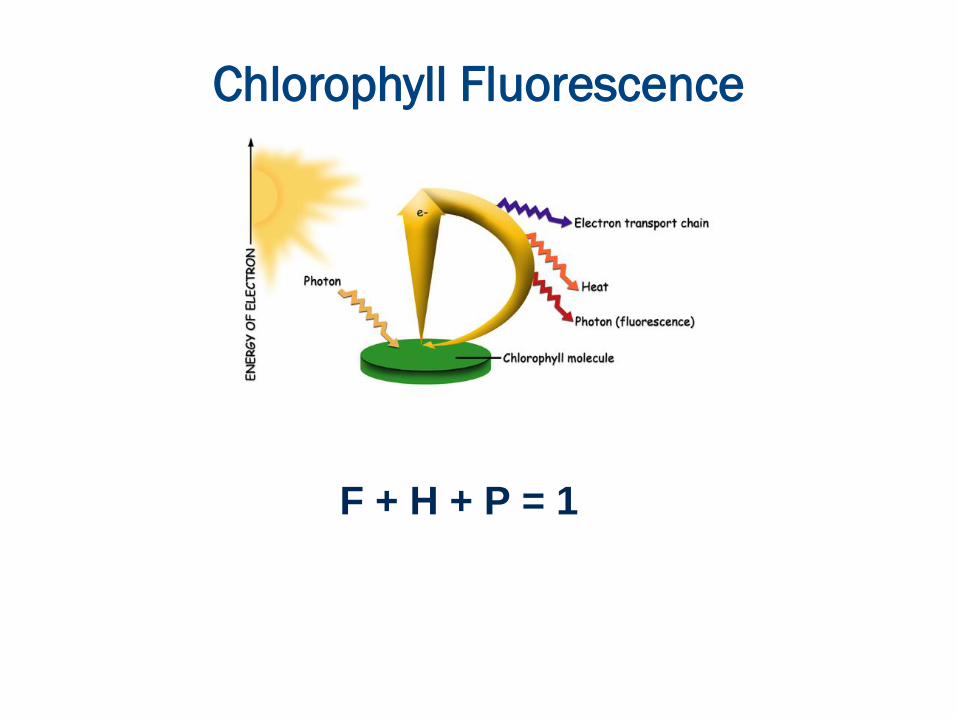
Chlorophyll Fluorescence
F + H + P = 1
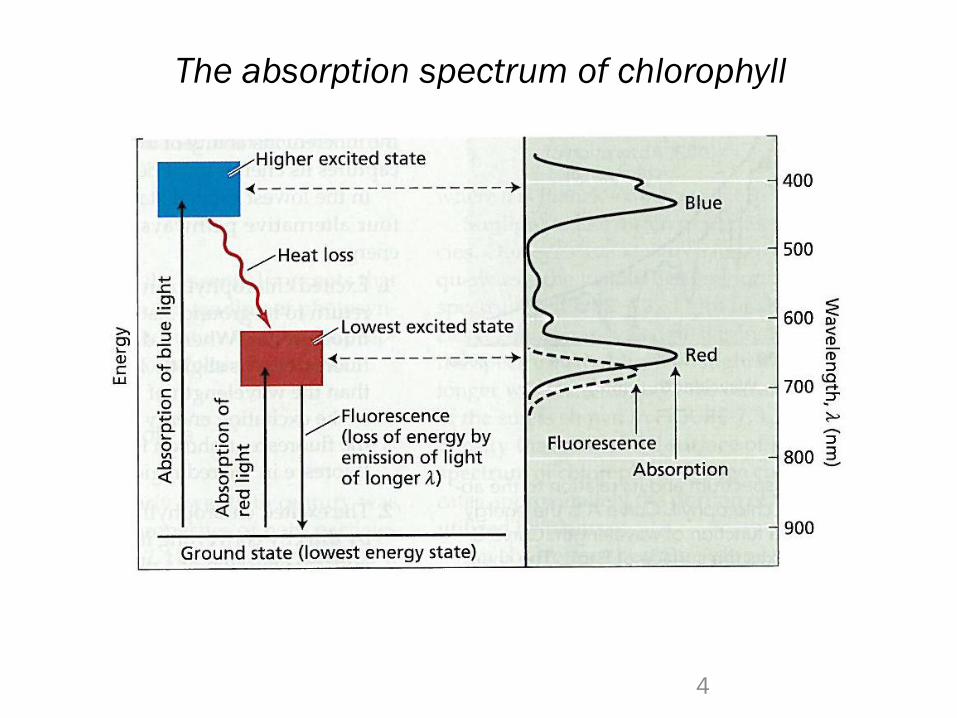
The absorption spectrum of chlorophyll
4
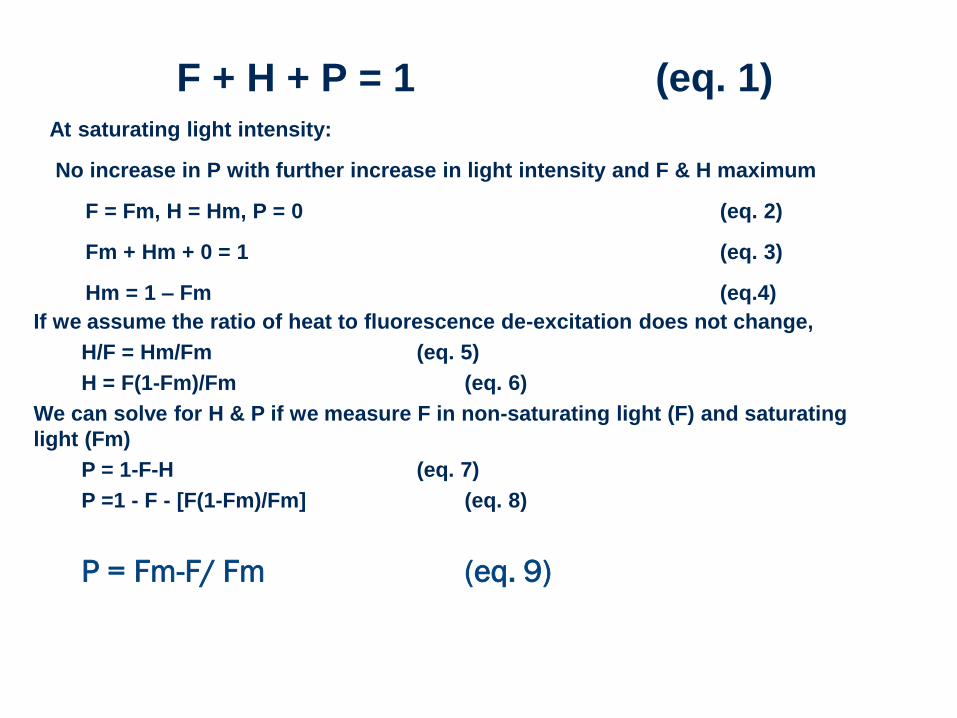
If we assume the ratio of heat to fluorescence de-excitation does not change,
H/F = Hm/Fm (eq. 5)
H = F(1-Fm)/Fm (eq. 6)
We can solve for H & P if we measure F in non-saturating light (F) and saturating
light (Fm)
P = 1-F-H (eq. 7)
P =1 - F - [F(1-Fm)/Fm] (eq. 8)
P = Fm-F/ Fm (eq. 9)
F + H + P = 1 (eq. 1) At saturating light intensity:
No increase in P with further increase in light intensity and F & H maximum
F = Fm, H = Hm, P = 0 (eq. 2)
Fm + Hm + 0 = 1 (eq. 3)
Hm = 1 – Fm (eq.4)

P = Fm-F/ Fm
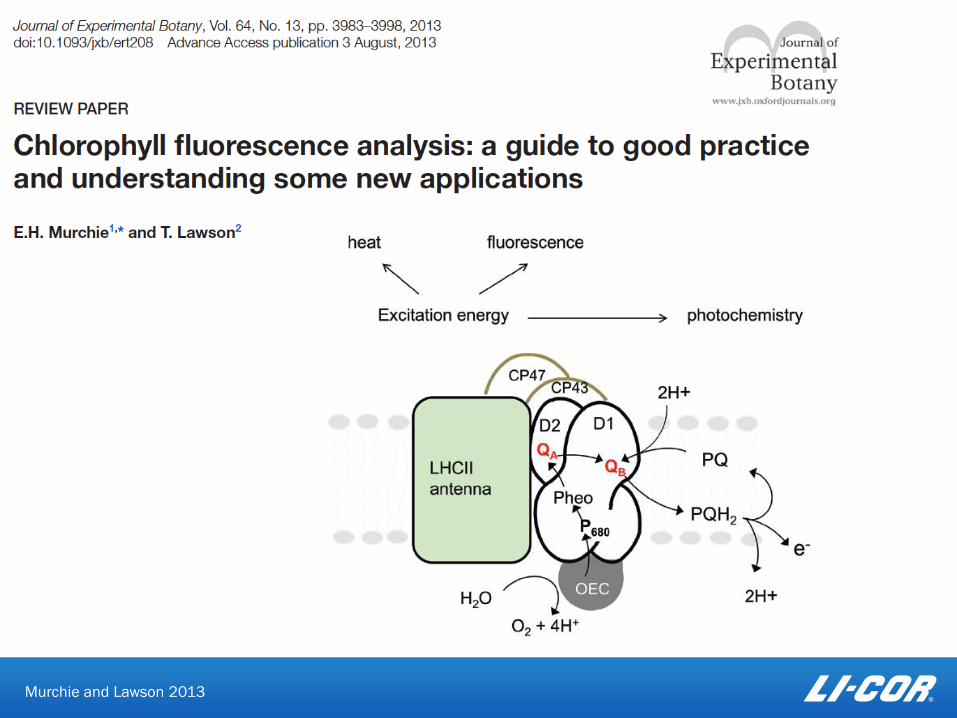
Murchie and Lawson 2013
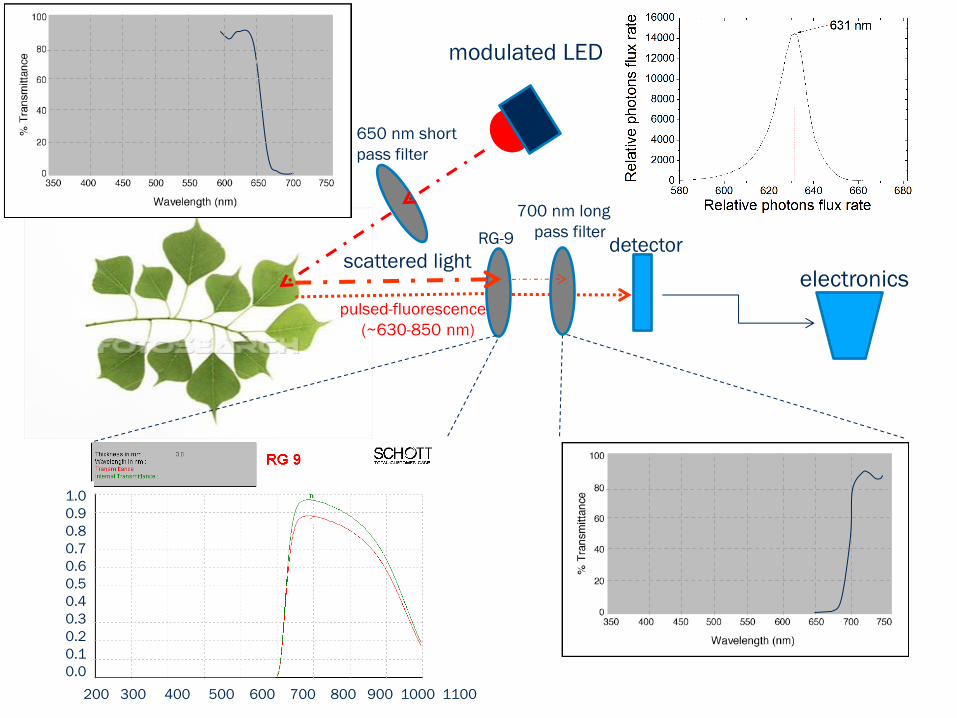
modulated LED
650 nm short
pass filter
pulsed-fluorescence
(~630-850 nm)
RG-9
700 nm long
pass filter
1.0
0.9
0.8
0.7
0.6
0.5
0.4
0.3
0.2
0.1
0.0
200 300 400 500 600 700 800 900 1000 1100
electronics
detector scattered light

Pulsed amplitude modulation fluorescence
low intensity
modulated
light
F modulated
fluorescence
F(minimum
fluorescence yield)
PSII
2 H2O O2+4e-+4H+
high intensity
light flash
Fm’
Fm ’ (maximum
fluorescence yield)
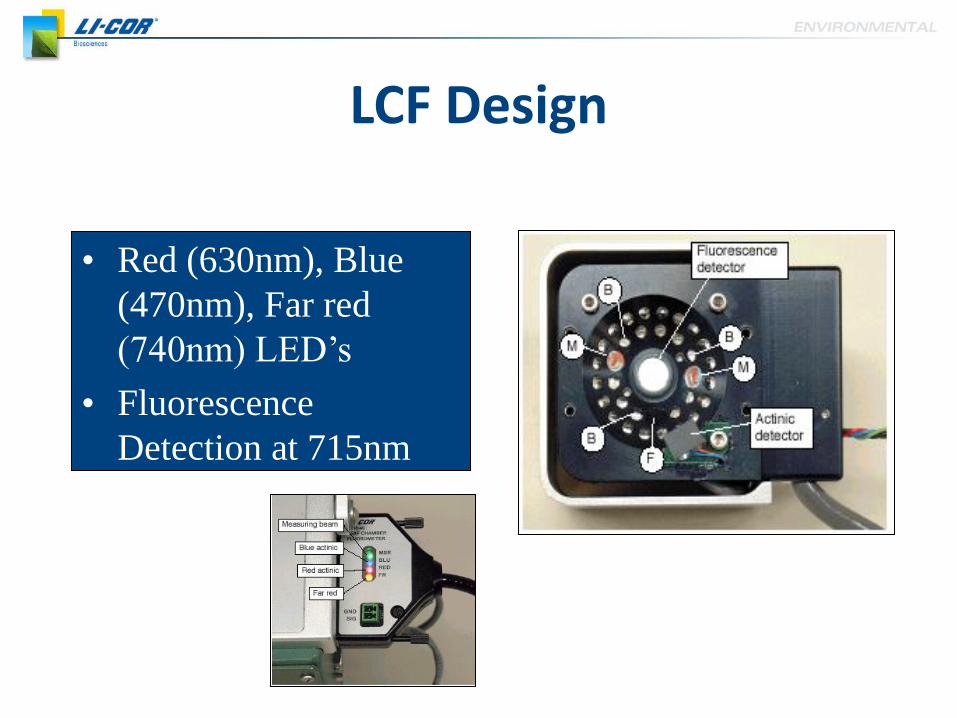
LCF Design
• Red (630nm), Blue
(470nm), Far red
(740nm) LED’s
• Fluorescence
Detection at 715nm


Fm’
NPQ
ETR qE
ETR vs. AG
gm
qE vs. ETR
PSII
=
(Fm’-F)
Fm’
= (PSII*i**fII)
A
Ci – Γ* [ETR + 8 (A + Rd)]
ETR – 4 (A + Rd)
=
(Fm-Fm’)
Fm’ =
(Fm”-Fm’) Fs
Fm’ Fm’ = *
Cc
AN Vcmax climate
modeling Cc

Fm’
NPQ
ETR qE
ETR vs. AG
gm
qE vs. ETR
PSII
=
(Fm’-F)
Fm’
= (PSII*i**fII)
A
Ci – Γ* [ETR + 8 (A + Rd)]
ETR – 4 (A + Rd)
=
(Fm-Fm’)
Fm’ =
(Fm”-Fm’) Fs
Fm’ Fm’ = *
Cc
AN Vcmax climate
modeling Cc
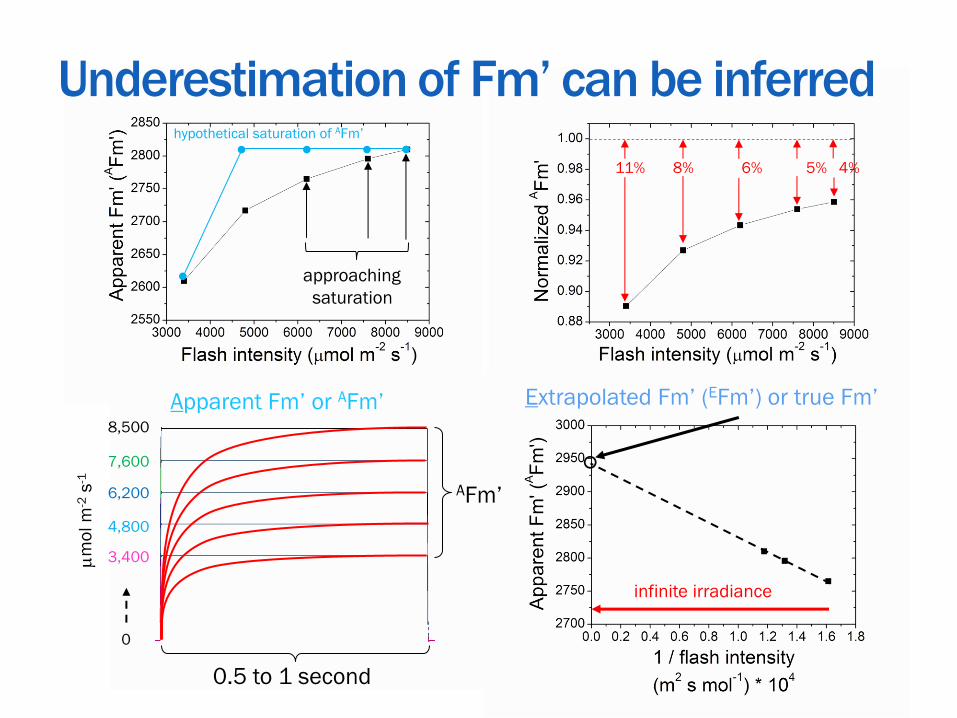
Underestimation of Fm’ can be inferred
0.5 to 1 second
m
ol m
-2 s
-1
6,200
7,600
4,800
3,400
8,500
hypothetical saturation of AFm’
approaching
saturation
Extrapolated Fm’ (EFm’) or true Fm’
0
11% 8% 6% 5% 4%
Apparent Fm’ or AFm’
AFm’
infinite irradiance

Multiphase FlashTM fluorescence
Used to measure Fm’ at infinite irradiance
AFm’
Flu
ore
sce
nce
yie
ld (
F)
Irra
dia
nce
(µ
E)
Phase 1 Phase 2 Phase 3
Irra
dia
nce
(µ
mo
l m
-2s
-1)
AFm’
F (
Ph
ase
2)
1/Phase 2irradiance (m2 s mol-1) *104
10%
Extrapolated Fm’ ~ true Fm’
infinite irradiance
60
% R
am
p
500 ms
Ramp rate = mol photons m-2 s-2
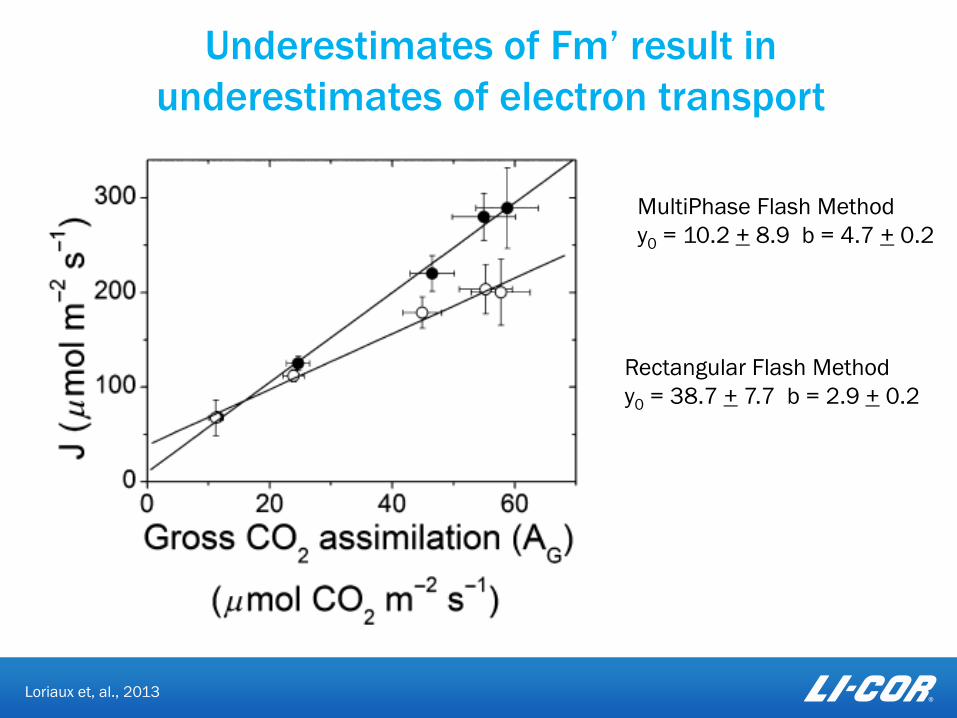
Loriaux et, al., 2013
Rectangular Flash Method
y0 = 38.7 + 7.7 b = 2.9 + 0.2
MultiPhase Flash Method
y0 = 10.2 + 8.9 b = 4.7 + 0.2
Underestimates of Fm’ result in
underestimates of electron transport
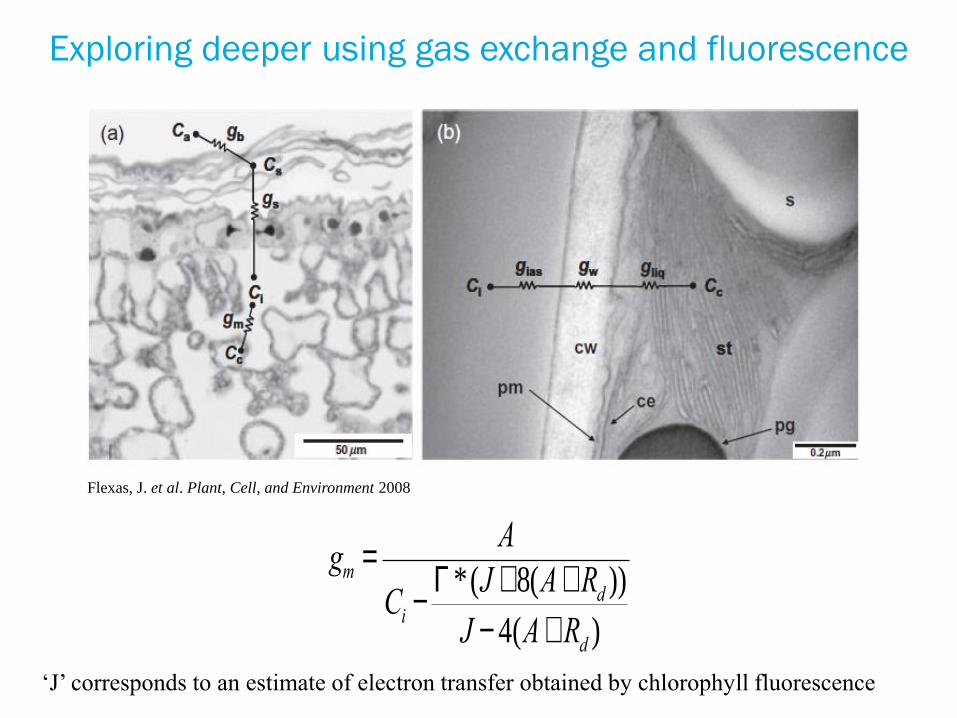
Flexas, J. et al. Plant, Cell, and Environment 2008
‘J’ corresponds to an estimate of electron transfer obtained by chlorophyll fluorescence
Exploring deeper using gas exchange and fluorescence
gm =A
Ci -G*(J +8(A+Rd ))
J - 4(A+Rd )

Fluorometer Display Changes

Fluorometer Function Key Changes
Fluorescence Instrument Basics
• Higher fluorescence emission, better signal: noise
• Higher excitation intensities, higher fluorescence emission
• Higher excitation frequencies, higher excitation intensity
• Calculated parameters like Fv/Fm are not highly influenced by fluorescence emission intensities (they are unitless)
• To compare across time, emission intensities do matter

Fluorometer Settings

Fluorometer Settings

Fluorometer Settings

Fv/Fm
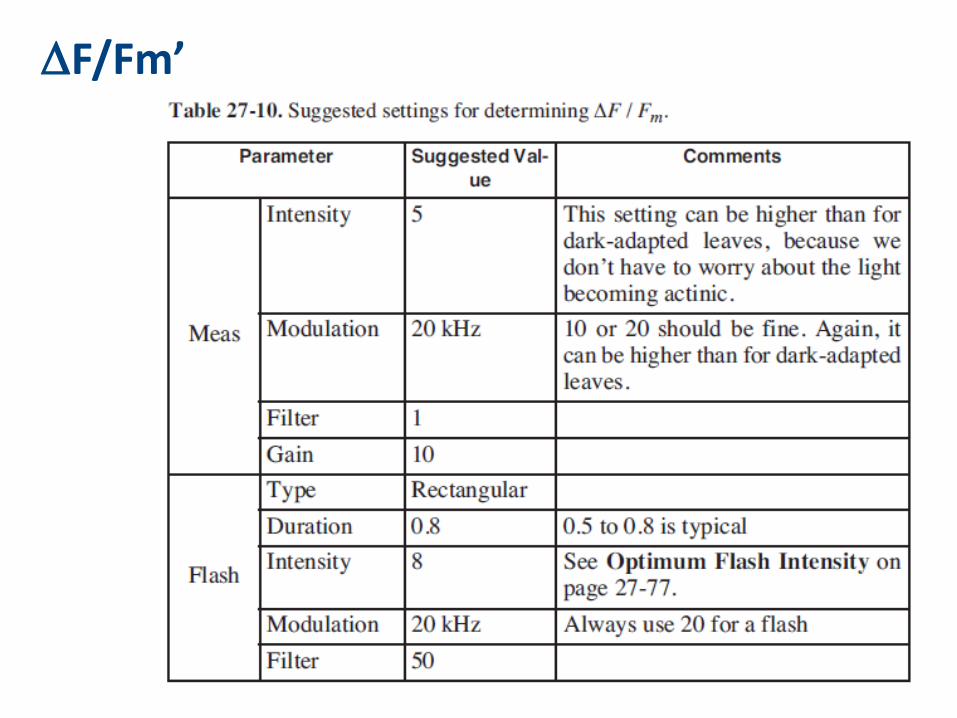
DF/Fm’

Driving thru Zambia
Photo by R.L. Garcia, 1984
Thank you