Embed Size (px)
Citation preview
Research ArticleA Deep Learning Approach of Vehicle Multitarget Detectionfrom Traffic Video
Xun Li ,1,2 Yao Liu,1 Zhengfan Zhao,3 Yue Zhang,1 and Li He4
1 School of Electronic Information, Xi'an Polytechnical University, Xi’an 710048, China2School of Automation, Northwestern Polytechnical University, Xi’an 710068, China3Beijing Special Electromechanical Technology Research Institute, Beijing 10012, China4Guangdong University of Technology, Guangzhou 510006, China
Correspondence should be addressed to Xun Li; [email protected]
Received 9 April 2018; Revised 15 August 2018; Accepted 2 October 2018; Published 4 November 2018
Academic Editor: Nandana Rajatheva
Copyright © 2018 Xun Li et al. This is an open access article distributed under the Creative Commons Attribution License, whichpermits unrestricted use, distribution, and reproduction in any medium, provided the original work is properly cited.
Vehicle detection is expected to be robust and efficient in various scenes. We propose a multivehicle detection method, whichconsists of YOLO under the Darknet framework. We also improve the YOLO-voc structure according to the change of the targetscene and traffic flow.The classification trainingmodel is obtained based on ImageNet and the parameters are fine-tuned accordingto the training results and the vehicle characteristics. Finally, we obtain an effective YOLO-vocRV network for road vehiclesdetection. In order to verify the performance of our method, the experiment is carried out on different vehicle flow states andcompared with the classical YOLO-voc, YOLO 9000, and YOLO v3. The experimental results show that our method achieves thedetection rate of 98.6% in free flow state, 97.8% in synchronous flow state, and 96.3% in blocking flow state, respectively. In addition,our proposed method has less false detection rate than previous works and shows good robustness.
1. Introduction
Intelligent Transportation Systems [1] (ITS) is an effectiveway to solve the problem of urban traffic congestion in thefuture. Vehicle detection is an important link for the dataacquisition of ITS system [2] and is able to provide validdata for various traffic intelligent control applications suchas traffic jam and traffic illegal evidence extraction. In thelast decade, multitarget detection [3] for traffic data based onmachine learning [4] has been a research hotspot.
Traditional machine learning methods first extract targetfeatures, such as histogram of oriented gradient (HOG) [5],scale invariant feature transform (SIFT) [6], or local binarypattern (LBP) [7].Then the extracted features are fed to a pre-trained classifier, such as support vector machine SVM [8] oriterator of Ada Boost (AB) [9]. For a particular identificationtask, in which the data size is always limited, the extractedfeatures may encounter trouble in generalization ability, sothe result is difficulty to achieve precise identification amongthe practical problems.
Machine learning [10] is the research of supervised orunsupervised methods to extract and convert features. As
a subarea of machine learning, deep learning [11] is analgorithm that models the complex relationships betweendata through multilevel representations. It transforms theoriginal data into higher-level and more abstract expressionsthrough simple and nonlinear models, showing good resultsin target detection. For example, themAP (mean average Pre-cision) reaches 30% in [12] on VOC2007 dataset. RCNN [13]combines traditional machine learning with deep learningand increases the mAP with the VOC2007 dataset to 48%.Despite its advantages on detection, RCNN requires trainingwith several SVM classifiers, resulting in high computationalcomplexity. By modifying the network structure, it increasedto 66% in 2014. Then by optimizing the network, SPP-Net[14], Fast RCNN [15], Faster RCNN [16], and YOLO [17]appeared.
YOLO is a new real-time target detection method whichuses deep convolutional neural network (CNN). It furtherincreases the mAP to 78.6% on the VOC2007 dataset. At thesame time, unlike traditional feature extraction algorithms,deep convolutional neural networks have a certain degreeof invariance to geometric transformation, deformation, andillumination and effectively overcome the difficulties caused
HindawiJournal of Advanced TransportationVolume 2018, Article ID 7075814, 11 pageshttps://doi.org/10.1155/2018/7075814
2 Journal of Advanced Transportation
Input600x448
convolutionallayer3x3x32
Feature map544x544
......
......
......
maxpoolinglayer2x2
Feature map272x272
Output17x17
......
......
Figure 1: CNN network structure in YOLO v2.
by the changing appearance of vehicles. In addition, thefeature description can be adaptively constructed under thetraining data, showing higher flexibility and generalizationability.
In summary, in this paper a deep learning method ispurposed in the multitarget detection of vehicles underseveral challenging conditions such as color changing andcomplex road scenes. Firstly, the vehicle dataset is built basedon VOC2007 dataset. Then, the parameters of an improvednetwork YOLO-vocRV are fine-tuned through our retrainingto obtain the multiobject detection. Finally, the detectionmethods in this paper are tested under different road trafficconditions by comparing with YOLO-voc, YOLO 9000, andYOLO v3 model.
2. YOLO v2 Algorithm
YOLO v2 can distinguish region between the target and thebackground. In YOLO v2, both the probability and the targetlocation of multitarget can be predicted in real time, which isa property essential for multiobjective vehicle detection.
2.1. Feature Acquisition Based on Convolutional Neural Net-work. The CNN in target detection avoids the complicatedpreprocessing of the image, which has the characteristicsof displacement invariance, scaling invariance, and otherforms of distortion invariance. At the same time, due to thesame neuron weights on the same feature mapping plane,the network learns in parallel and shares weights to reduceits complexity [18]. In this paper, the CNN in YOLO v2 iscomposed of convolution layers and pooling layers, as shownin Figure 1.
The 1x1 convolution kernel has a size of only 1x1, and itdoes not need to consider the relationship between pixels andsurrounding pixels. It is mainly used to adjust the numberof channels, combine pixels on different channels linearly,and then perform nonlinear operations. It can complete thefunctions of ascending and dimension reduction. The 3x3 isthe smallest size capable of capturing eight fields of pixels.Theconvolution kernels are arranged by 3x3 and 1x1 alternately,which can reduce the network parameters without reducingnetwork performance. It is more conducive to the extractionof vehicle features based on the arranged convolution kernels.The pooling layers are used to downsample the extracted
0
0.8
Avg
IOU
2 3 4 5 6 7 8 9 101K
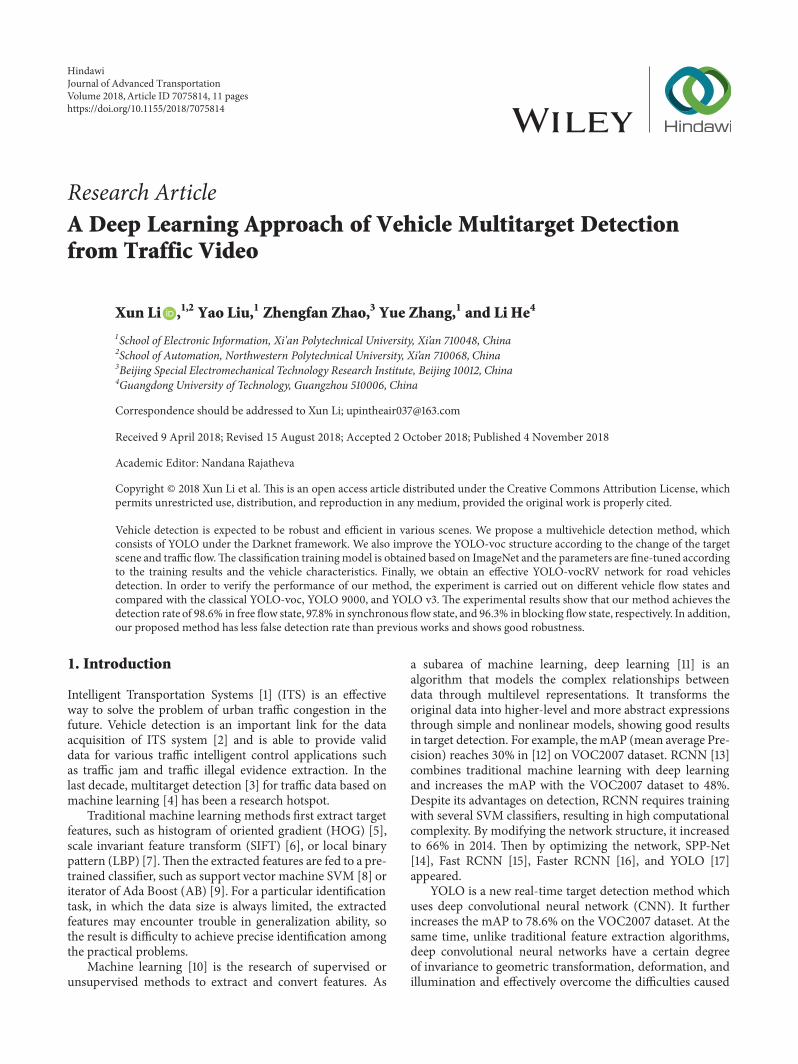
Figure 2: Cluster statistics.
features, remove the less important parts, and output the finalfeature map.
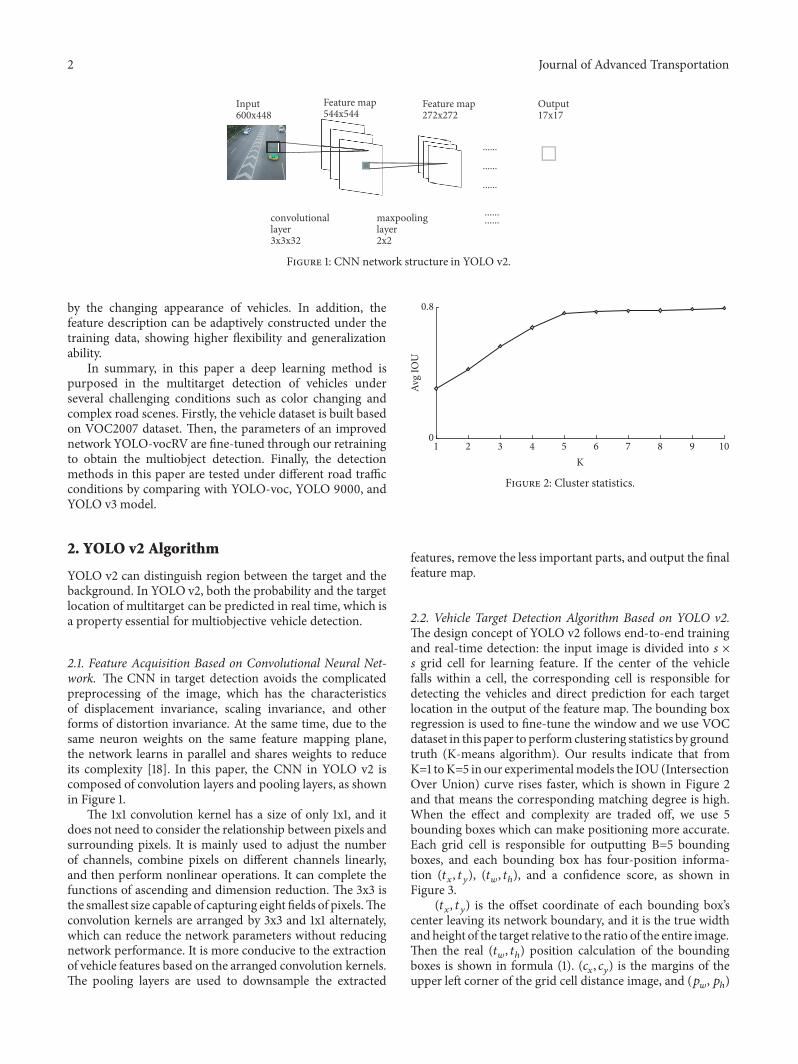
2.2. Vehicle Target Detection Algorithm Based on YOLO v2.The design concept of YOLO v2 follows end-to-end trainingand real-time detection: the input image is divided into 𝑠 ×𝑠 grid cell for learning feature. If the center of the vehiclefalls within a cell, the corresponding cell is responsible fordetecting the vehicles and direct prediction for each targetlocation in the output of the feature map. The bounding boxregression is used to fine-tune the window and we use VOCdataset in this paper to perform clustering statistics by groundtruth (K-means algorithm). Our results indicate that fromK=1 toK=5 in our experimentalmodels the IOU (IntersectionOver Union) curve rises faster, which is shown in Figure 2and that means the corresponding matching degree is high.When the effect and complexity are traded off, we use 5bounding boxes which can make positioning more accurate.Each grid cell is responsible for outputting B=5 boundingboxes, and each bounding box has four-position informa-tion (𝑡𝑥, 𝑡𝑦), (𝑡𝑤, 𝑡ℎ), and a confidence score, as shown inFigure 3.(𝑡𝑥, 𝑡𝑦) is the offset coordinate of each bounding box’scenter leaving its network boundary, and it is the true widthand height of the target relative to the ratio of the entire image.Then the real (𝑡𝑤, 𝑡ℎ) position calculation of the boundingboxes is shown in formula (1). (𝑐𝑥, 𝑐𝑦) is the margins of theupper left corner of the grid cell distance image, and (𝑝𝑤, 𝑝ℎ)
Journal of Advanced Transportation 3
=S
=R
<Q
<B(NS)
(NR)
JQ
JB
Figure 3: Bounding boxes with dimension priors and locationprediction.
is the length and width of the corresponding box dimension.
𝑏𝑥 = 𝜎 (𝑡𝑥) + 𝑐𝑥𝑏𝑦 = 𝜎 (𝑡𝑦) + 𝑐𝑦𝑏𝑤 = 𝑝𝑤𝑒𝑡𝑤𝑏ℎ = 𝑝ℎ𝑒𝑡ℎ
(1)
The confidence score reflects the possibility Pr(𝑂𝑏𝑗𝑒𝑐𝑡) ofthe existence target in the bounding box and IOU𝑡𝑟𝑢𝑡ℎ𝑝𝑟𝑒𝑑 thebounding box predicts the accuracy IOU𝑡𝑟𝑢𝑡ℎ𝑝𝑟𝑒𝑑 of the targetposition. If there is no target in the bounding box, thenPr(𝑂𝑏𝑗𝑒𝑐𝑡) = 0.
𝑐𝑜𝑛𝑓𝑖𝑑𝑒𝑛𝑐𝑒 = Pr (𝑂𝑏𝑗𝑒𝑐𝑡) × IOU𝑡𝑟𝑢𝑡ℎ𝑝𝑟𝑒𝑑 (2)
In addition, each cell in the YOLO v2 algorithm will alsoproduce only one probability with C conditional probabilitiesthat will be used to determine the best target location. Thespecific test procedures are summarized as follows (a singleclass vehicle as an example).
Step 1. The input image is divided into 13×13 grid cells (S=13).Step 2. For one class vehicle (C=1), five bounding boxes (B=5)are predicted for each grid cell, obtaining a vector of predictedlength S×S×(B×5+C)=13×13×26.Step 3. Obtain the optimal target detection position andsuppress nonmaximal values of vectors S×S×(B×5+C) anduse (3) to judge whether the target identification box isreserved or not.
Pr (𝐶𝑙𝑎𝑠𝑠𝑖 | 𝑂𝑏𝑗𝑒𝑐𝑡) × Pr (𝑂𝑏𝑗𝑒𝑐𝑡) × IOU𝑡𝑟𝑢𝑡ℎ𝑝𝑟𝑒𝑑
= Pr (𝐶𝑙𝑎𝑠𝑠𝑖) × IOU𝑡𝑟𝑢𝑡ℎ𝑝𝑟𝑒𝑑(3)
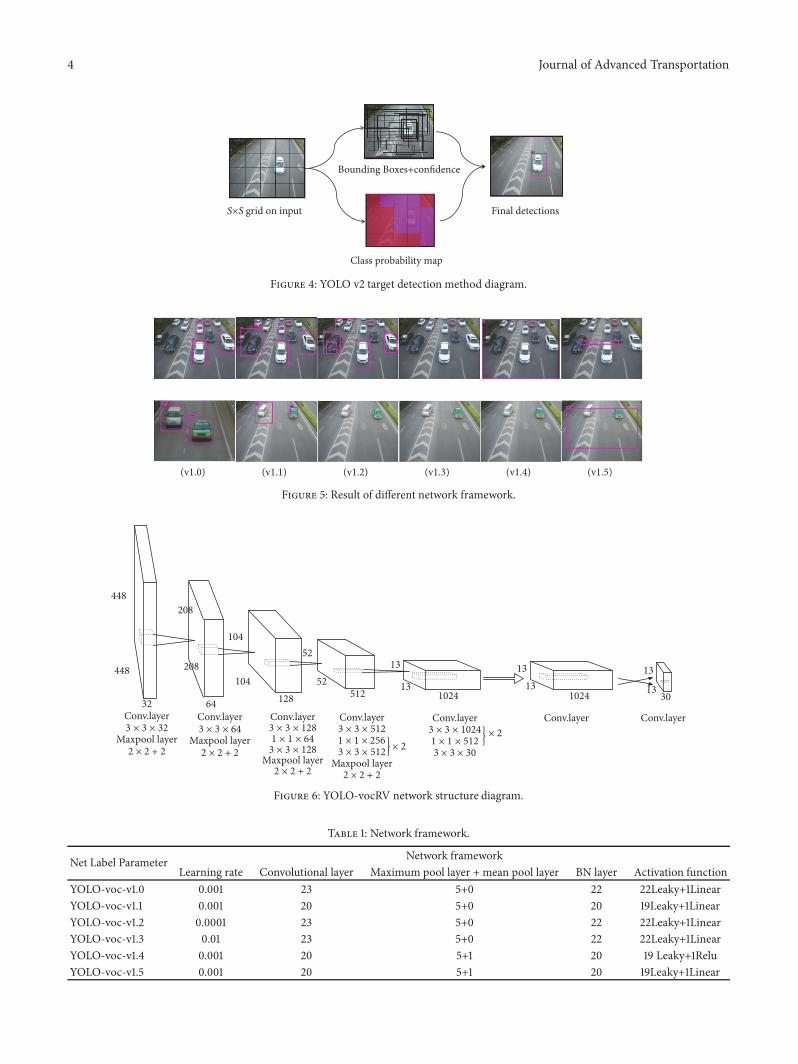
The whole process of the algorithm is shown in Figure 4:
3. Improved Network Based on YOLO v2
Different network structures may affect the effect of modeltraining. Different parameter sets will be selected by differentlearning rates, activation functions, and all kinds of different
layers. Therefore, we perform different parameters selectionand optimization experiments and analysis for vehicle featuretargets in order to obtain an improved network model forvehicle targets detection.
3.1. Improved Network for Vehicle Multitarget Detection.YOLO v2 removed the last full connection layer by usingGoogleNet ideology, where both the deviations and the con-fidence score of the target box were predicted by convolutionlayer (as shown in Section 2.1), for obtaining the probabilityand location of a single vehicle target. AndYOLO v2 can trainand learn the images with different resolutions.
To obtain more adaptable network framework for vehiclemultitargets detecting, we set different structural parametersbased on network structure of YOLO-voc, and a varietyof network frameworks are chosen. Results are reported inTable 1 and Figure 5, respectively.
In Table 1, YOLO-voc-v1.0 adopts 23 convolutional layersand 5 maximum pooling layers. The convolutional layersfrom 1 to 22 have BN layer and all use Leaky Activationfunction. The last convolutional layers use linear activationfunction. The initial learning rate is set to 0.001. YOLO-voc-v1.1 adopts 20 convolutional layers and 5 maximum poolinglayers and all the convolution layers have joined with theBN layer. The initial learning rate of YOLO-voc-v1.2 is setto 0.0001 based on v1.0, and the initial learning rate of v1.3was changed to 0.01. For YOLO-voc-v1.5; there is amaximumpooling layer more than v1.1. The last activation function ofYOLO-voc-v1.5 is changed as rule to get YOLO-voc-v1.4.
The test results in Figure 5 show that the change of con-volutional layers, activation function, the additional averagepool layers, andmore BN layers affect the detection effect. Wecan also find that if BN joins the last layer, the initial learningrate is too small to have a duplicate detection or too largeto cause no vehicle characteristics to be learned. Throughthe above experiments, we use the YOLO-voc-v1.1 networkstructure to further fine-tune the parameters to obtain animproved model; we called it YOLO-vocRV (YOLO-voc forRoad Vehicle). According to the network structure of YOLO-voc, the convolutional layer of the last 3-5 lines is removed toform a network structure as shown in Figure 6.
3.2. YOLO-vocRV Network
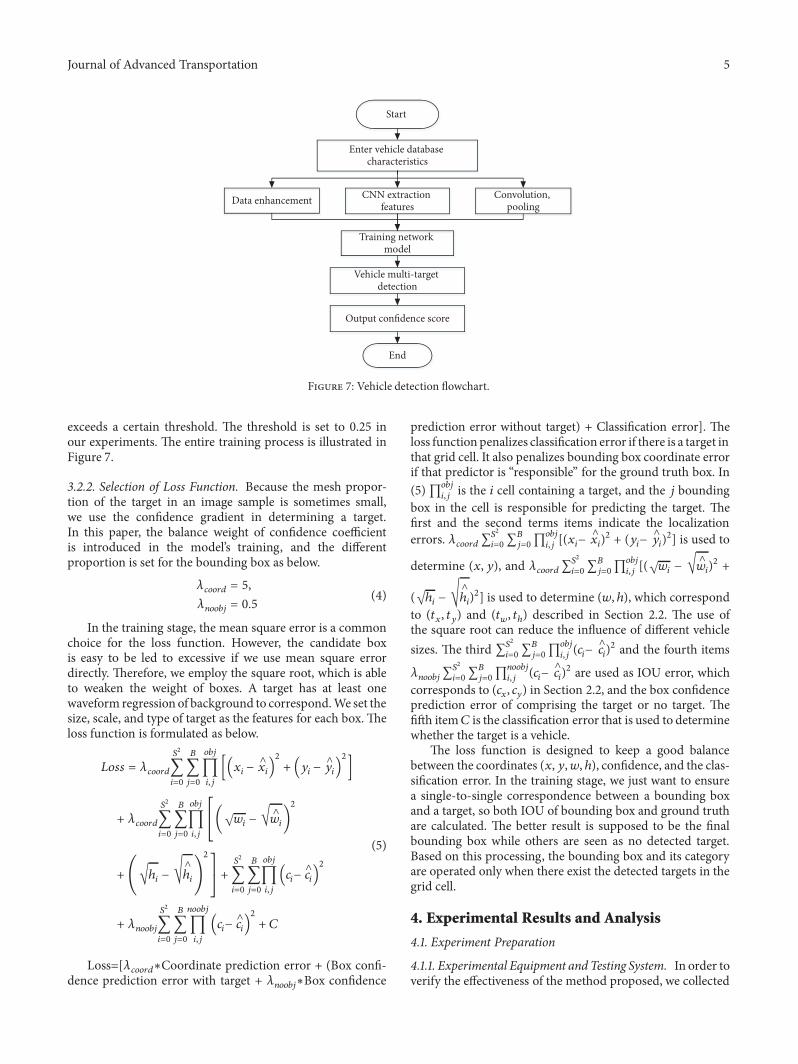
3.2.1. Training Stage. First, we use ImageNet dataset [19]to carry on high-resolution pretraining. On the basis ofthe classification, the fine-tuning technique is used to trainthe vehicle dataset of our definition with the pretrainingconvolution neural network.
To verify the validity and robustness of the proposedmethod, in the training phase, we enhance the data byrandomly scaling, saturation, and exposure.These operationsare used to improve the diversity of our samples. Then awhole picture is input into a neural network one-time. Theneural network divides the image into different regions, giveseach region the predictions on borders and probabilities,and assigns weights to all boxes based on probabilities.Finally we only obtain the test results whose confidence score
4 Journal of Advanced Transportation
S×S grid on input
Class probability map
Final detections
Bounding Boxes+confidence
Figure 4: YOLO v2 target detection method diagram.
(v1.0) (v1.1) (v1.2) (v1.3) (v1.4) (v1.5)
Figure 5: Result of different network framework.
448
448
208
208
104
104
52
52 13 13
1313
1313
Conv.layer3 × 3 × 32
2 × 2 + 2Maxpool layer
3 × 3 × 64
2 × 2 + 21 × 1 × 643 × 3 × 128
3 × 3 × 128
Conv.layer Conv.layer
Maxpool layer
Maxpool layer2 × 2 + 2
Conv.layer3 × 3 × 5121 × 1 × 256 × 23 × 3 × 512
Maxpool layer2 × 2 + 2
Conv.layer3 × 3 × 10241 × 1 × 512
× 2
3 × 3 × 30
32 64 128 512 1024 1024 30
Conv.layer Conv.layer
Figure 6: YOLO-vocRV network structure diagram.
Table 1: Network framework.
Net Label Parameter Network frameworkLearning rate Convolutional layer Maximum pool layer + mean pool layer BN layer Activation function
YOLO-voc-v1.0 0.001 23 5+0 22 22Leaky+1LinearYOLO-voc-v1.1 0.001 20 5+0 20 19Leaky+1LinearYOLO-voc-v1.2 0.0001 23 5+0 22 22Leaky+1LinearYOLO-voc-v1.3 0.01 23 5+0 22 22Leaky+1LinearYOLO-voc-v1.4 0.001 20 5+1 20 19 Leaky+1ReluYOLO-voc-v1.5 0.001 20 5+1 20 19Leaky+1Linear
Journal of Advanced Transportation 5
End
Data enhancement CNN extraction features
Convolution, pooling
Training network model
Output confidence score
Vehicle multi-target detection
Enter vehicle database characteristics
Start
Figure 7: Vehicle detection flowchart.
exceeds a certain threshold. The threshold is set to 0.25 inour experiments. The entire training process is illustrated inFigure 7.
3.2.2. Selection of Loss Function. Because the mesh propor-tion of the target in an image sample is sometimes small,we use the confidence gradient in determining a target.In this paper, the balance weight of confidence coefficientis introduced in the model’s training, and the differentproportion is set for the bounding box as below.
𝜆𝑐𝑜𝑜𝑟𝑑 = 5,𝜆𝑛𝑜𝑜𝑏𝑗 = 0.5 (4)
In the training stage, the mean square error is a commonchoice for the loss function. However, the candidate boxis easy to be led to excessive if we use mean square errordirectly. Therefore, we employ the square root, which is ableto weaken the weight of boxes. A target has at least onewaveform regression of background to correspond.We set thesize, scale, and type of target as the features for each box.Theloss function is formulated as below.
𝐿𝑜𝑠𝑠 = 𝜆𝑐𝑜𝑜𝑟𝑑 𝑆2∑𝑖=0
𝐵∑𝑗=0
𝑜𝑏𝑗∏𝑖,𝑗
[(𝑥𝑖 − ∧𝑥𝑖)2 + (𝑦𝑖 − ∧𝑦𝑖)2]
+ 𝜆𝑐𝑜𝑜𝑟𝑑 𝑆2∑𝑖=0
𝐵∑𝑗=0
𝑜𝑏𝑗∏𝑖,𝑗
[[(√𝑤𝑖 − √ ∧𝑤𝑖)2
+ (√ℎ𝑖 − √ ∧ℎ𝑖)2]] + 𝑆2∑𝑖=0
𝐵∑𝑗=0
𝑜𝑏𝑗∏𝑖,𝑗
(𝑐𝑖− ∧𝑐𝑖)2
+ 𝜆𝑛𝑜𝑜𝑏𝑗 𝑆2∑𝑖=0
𝐵∑𝑗=0
𝑛𝑜𝑜𝑏𝑗∏𝑖,𝑗
(𝑐𝑖− ∧𝑐𝑖)2 + 𝐶
(5)
Loss=[𝜆𝑐𝑜𝑜𝑟𝑑∗Coordinate prediction error + (Box confi-dence prediction error with target + 𝜆𝑛𝑜𝑜𝑏𝑗∗Box confidence
prediction error without target) + Classification error]. Theloss function penalizes classification error if there is a target inthat grid cell. It also penalizes bounding box coordinate errorif that predictor is “responsible” for the ground truth box. In(5) ∏𝑜𝑏𝑗𝑖,𝑗 is the 𝑖 cell containing a target, and the 𝑗 boundingbox in the cell is responsible for predicting the target. Thefirst and the second terms items indicate the localizationerrors. 𝜆𝑐𝑜𝑜𝑟𝑑∑𝑆2𝑖=0∑𝐵𝑗=0∏𝑜𝑏𝑗𝑖,𝑗 [(𝑥𝑖− ∧𝑥𝑖)2 + (𝑦𝑖− ∧𝑦𝑖)2] is used to
determine (𝑥, 𝑦), and 𝜆𝑐𝑜𝑜𝑟𝑑∑𝑆2𝑖=0∑𝐵𝑗=0∏𝑜𝑏𝑗𝑖,𝑗 [(√𝑤𝑖 − √ ∧𝑤𝑖)2 +(√ℎ𝑖 − √ ∧ℎ𝑖)2] is used to determine (𝑤, ℎ), which correspondto (𝑡𝑥, 𝑡𝑦) and (𝑡𝑤, 𝑡ℎ) described in Section 2.2. The use ofthe square root can reduce the influence of different vehiclesizes. The third ∑𝑆2𝑖=0 ∑𝐵𝑗=0∏𝑜𝑏𝑗𝑖,𝑗 (𝑐𝑖− ∧𝑐𝑖)2 and the fourth items
𝜆𝑛𝑜𝑜𝑏𝑗∑𝑆2𝑖=0∑𝐵𝑗=0∏𝑛𝑜𝑜𝑏𝑗𝑖,𝑗 (𝑐𝑖− ∧𝑐𝑖)2 are used as IOU error, whichcorresponds to (𝑐𝑥, 𝑐𝑦) in Section 2.2, and the box confidenceprediction error of comprising the target or no target. Thefifth item𝐶 is the classification error that is used to determinewhether the target is a vehicle.
The loss function is designed to keep a good balancebetween the coordinates (𝑥, 𝑦, 𝑤, ℎ), confidence, and the clas-sification error. In the training stage, we just want to ensurea single-to-single correspondence between a bounding boxand a target, so both IOU of bounding box and ground truthare calculated. The better result is supposed to be the finalbounding box while others are seen as no detected target.Based on this processing, the bounding box and its categoryare operated only when there exist the detected targets in thegrid cell.
4. Experimental Results and Analysis
4.1. Experiment Preparation
4.1.1. Experimental Equipment and Testing System. In order toverify the effectiveness of the method proposed, we collected
6 Journal of Advanced Transportation
000017000016000015000012000011000010000006000005000003000001
(a) Free flow
000025000023000022000021000020000018000017000016000014000012
(b) Synchronous flow
000016000011000014000012000008000007000005000004000003000002
(c) Blocking flow
Figure 8: Data samples of different traffic flow.
road traffic flows in an actual traffic system with the camerarecognition rates of 300 ∗ 225 and 550 ∗ 448. In the trainingstage, we use a workstation equipped with an Intel i7 5930CPU, four NVIDIA GeForce Titan X 12GB GPU and 8GBmemory. In the testing stage, we use an ordinary computer.
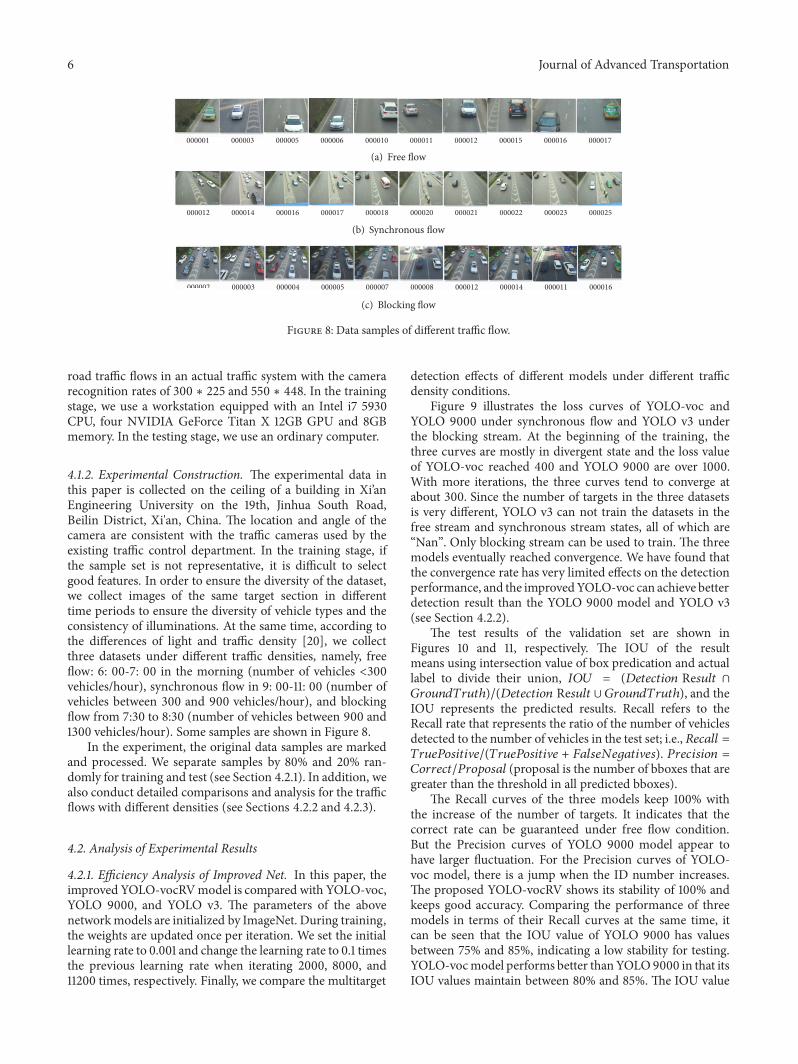
4.1.2. Experimental Construction. The experimental data inthis paper is collected on the ceiling of a building in Xi’anEngineering University on the 19th, Jinhua South Road,Beilin District, Xi'an, China. The location and angle of thecamera are consistent with the traffic cameras used by theexisting traffic control department. In the training stage, ifthe sample set is not representative, it is difficult to selectgood features. In order to ensure the diversity of the dataset,we collect images of the same target section in differenttime periods to ensure the diversity of vehicle types and theconsistency of illuminations. At the same time, according tothe differences of light and traffic density [20], we collectthree datasets under different traffic densities, namely, freeflow: 6: 00-7: 00 in the morning (number of vehicles <300vehicles/hour), synchronous flow in 9: 00-11: 00 (number ofvehicles between 300 and 900 vehicles/hour), and blockingflow from 7:30 to 8:30 (number of vehicles between 900 and1300 vehicles/hour). Some samples are shown in Figure 8.
In the experiment, the original data samples are markedand processed. We separate samples by 80% and 20% ran-domly for training and test (see Section 4.2.1). In addition, wealso conduct detailed comparisons and analysis for the trafficflows with different densities (see Sections 4.2.2 and 4.2.3).
4.2. Analysis of Experimental Results
4.2.1. Efficiency Analysis of Improved Net. In this paper, theimproved YOLO-vocRVmodel is compared with YOLO-voc,YOLO 9000, and YOLO v3. The parameters of the abovenetworkmodels are initialized by ImageNet. During training,the weights are updated once per iteration. We set the initiallearning rate to 0.001 and change the learning rate to 0.1 timesthe previous learning rate when iterating 2000, 8000, and11200 times, respectively. Finally, we compare the multitarget
detection effects of different models under different trafficdensity conditions.
Figure 9 illustrates the loss curves of YOLO-voc andYOLO 9000 under synchronous flow and YOLO v3 underthe blocking stream. At the beginning of the training, thethree curves are mostly in divergent state and the loss valueof YOLO-voc reached 400 and YOLO 9000 are over 1000.With more iterations, the three curves tend to converge atabout 300. Since the number of targets in the three datasetsis very different, YOLO v3 can not train the datasets in thefree stream and synchronous stream states, all of which are“Nan”. Only blocking stream can be used to train. The threemodels eventually reached convergence. We have found thatthe convergence rate has very limited effects on the detectionperformance, and the improvedYOLO-voc can achieve betterdetection result than the YOLO 9000 model and YOLO v3(see Section 4.2.2).
The test results of the validation set are shown inFigures 10 and 11, respectively. The IOU of the resultmeans using intersection value of box predication and actuallabel to divide their union, 𝐼𝑂𝑈 = (𝐷𝑒𝑡𝑒𝑐𝑡𝑖𝑜𝑛 Re𝑠𝑢𝑙𝑡 ∩𝐺𝑟𝑜𝑢𝑛𝑑𝑇𝑟𝑢𝑡ℎ)/(𝐷𝑒𝑡𝑒𝑐𝑡𝑖𝑜𝑛 Re𝑠𝑢𝑙𝑡 ∪ 𝐺𝑟𝑜𝑢𝑛𝑑𝑇𝑟𝑢𝑡ℎ), and theIOU represents the predicted results. Recall refers to theRecall rate that represents the ratio of the number of vehiclesdetected to the number of vehicles in the test set; i.e., 𝑅𝑒𝑐𝑎𝑙𝑙 =𝑇𝑟𝑢𝑒𝑃𝑜𝑠𝑖𝑡𝑖V𝑒/(𝑇𝑟𝑢𝑒𝑃𝑜𝑠𝑖𝑡𝑖V𝑒 + 𝐹𝑎𝑙𝑠𝑒𝑁𝑒𝑔𝑎𝑡𝑖V𝑒𝑠). 𝑃𝑟𝑒𝑐𝑖𝑠𝑖𝑜𝑛 =𝐶𝑜𝑟𝑟𝑒𝑐𝑡/𝑃𝑟𝑜𝑝𝑜𝑠𝑎𝑙 (proposal is the number of bboxes that aregreater than the threshold in all predicted bboxes).
The Recall curves of the three models keep 100% withthe increase of the number of targets. It indicates that thecorrect rate can be guaranteed under free flow condition.But the Precision curves of YOLO 9000 model appear tohave larger fluctuation. For the Precision curves of YOLO-voc model, there is a jump when the ID number increases.The proposed YOLO-vocRV shows its stability of 100% andkeeps good accuracy. Comparing the performance of threemodels in terms of their Recall curves at the same time, itcan be seen that the IOU value of YOLO 9000 has valuesbetween 75% and 85%, indicating a low stability for testing.YOLO-vocmodel performs better thanYOLO9000 in that itsIOU values maintain between 80% and 85%. The IOU value
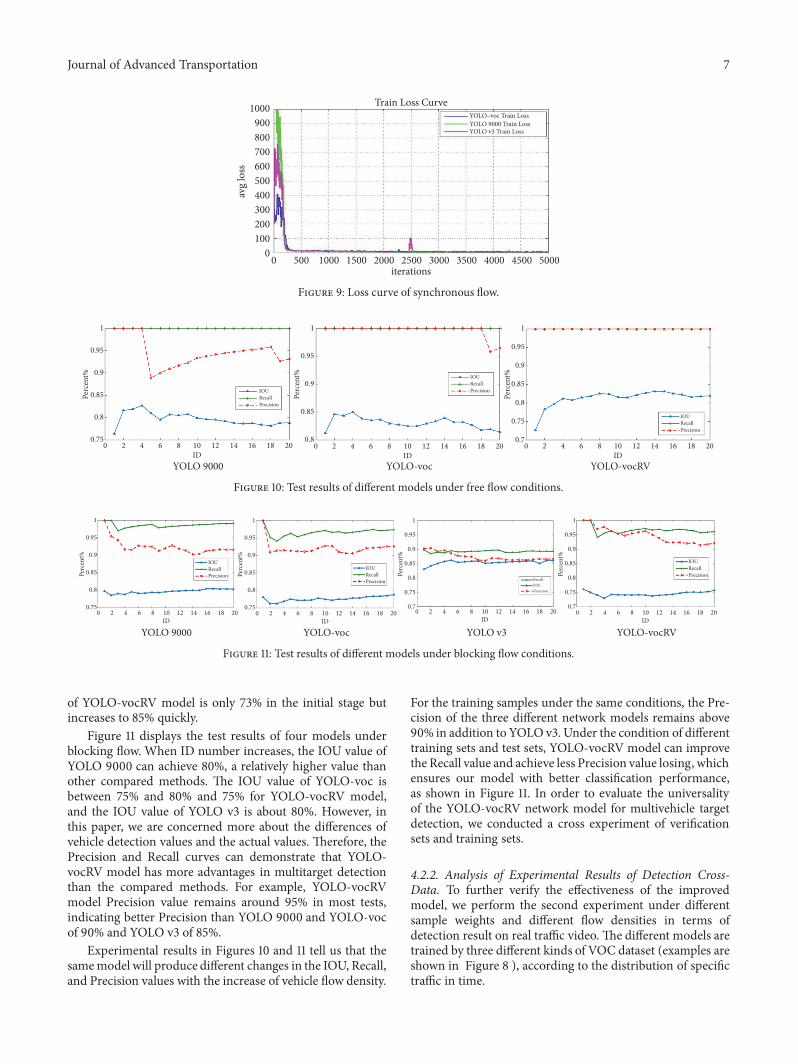
Journal of Advanced Transportation 7
YOLO–voc Train Loss
Train Loss Curve
iterations0 500 1000 1500 2000 2500 3000 3500 4000 4500 5000
YOLO 9000 Train LossYOLO v3 Train Loss
0100200300400500600700800900
1000
avg
loss
Figure 9: Loss curve of synchronous flow.
YOLO 9000 YOLO-vocRVYOLO-voc
Perc
ent%
ID
IOURecallPrecision
IOURecallPrecision
IOURecallPrecision
1
0.95
0.9
0.85
0.8
0.75
Perc
ent%
1
0.95
0.9
0.85
0.8
0.75
0.7
Perc
ent%
1
0.95
0.9
0.85
0.820181614121086420
ID20181614121086420
ID20181614121086420
Figure 10: Test results of different models under free flow conditions.
YOLO 9000 YOLO-voc YOLO v3 YOLO-vocRVID
IOURecallPrecision
Precision
Perc
ent%
1
0.95
0.9
0.85
0.8
0.75
0.7
Perc
ent%
1
0.95
0.9
0.85
0.8
0.75
0.7
Perc
ent%
1
0.95
0.9
0.85
0.8
0.75
Perc
ent%
1
0.95
0.9
0.85
0.8
0.7520181614121086420
ID20181614121086420
ID20181614121086420
ID20181614121086420
RecallIOU
Precision
IOURecallPrecision
IOURecall
Figure 11: Test results of different models under blocking flow conditions.
of YOLO-vocRV model is only 73% in the initial stage butincreases to 85% quickly.
Figure 11 displays the test results of four models underblocking flow. When ID number increases, the IOU value ofYOLO 9000 can achieve 80%, a relatively higher value thanother compared methods. The IOU value of YOLO-voc isbetween 75% and 80% and 75% for YOLO-vocRV model,and the IOU value of YOLO v3 is about 80%. However, inthis paper, we are concerned more about the differences ofvehicle detection values and the actual values. Therefore, thePrecision and Recall curves can demonstrate that YOLO-vocRV model has more advantages in multitarget detectionthan the compared methods. For example, YOLO-vocRVmodel Precision value remains around 95% in most tests,indicating better Precision than YOLO 9000 and YOLO-vocof 90% and YOLO v3 of 85%.
Experimental results in Figures 10 and 11 tell us that thesamemodel will produce different changes in the IOU, Recall,and Precision values with the increase of vehicle flow density.
For the training samples under the same conditions, the Pre-cision of the three different network models remains above90% in addition to YOLO v3. Under the condition of differenttraining sets and test sets, YOLO-vocRV model can improvethe Recall value and achieve less Precision value losing, whichensures our model with better classification performance,as shown in Figure 11. In order to evaluate the universalityof the YOLO-vocRV network model for multivehicle targetdetection, we conducted a cross experiment of verificationsets and training sets.
4.2.2. Analysis of Experimental Results of Detection Cross-Data. To further verify the effectiveness of the improvedmodel, we perform the second experiment under differentsample weights and different flow densities in terms ofdetection result on real traffic video. The different models aretrained by three different kinds of VOC dataset (examples areshown in Figure 8 ), according to the distribution of specifictraffic in time.
8 Journal of Advanced Transportation
Iteration 10,000 times Iteration 20,000 times
Iteration 10,000 times Iteration 20,000 times
Iteration 10,000 times Iteration 20,000 times
(a) YOLO 9000
(b) YOLO-voc
(c) YOLO-vocRV
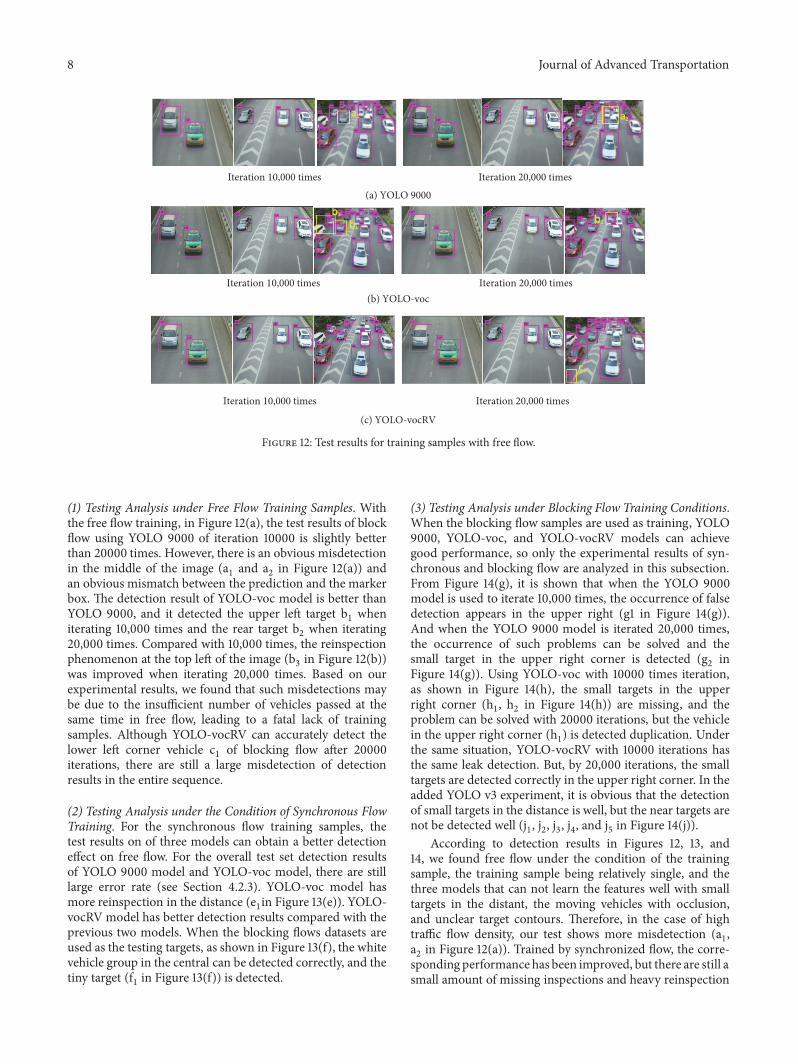
Figure 12: Test results for training samples with free flow.
(1) Testing Analysis under Free Flow Training Samples. Withthe free flow training, in Figure 12(a), the test results of blockflow using YOLO 9000 of iteration 10000 is slightly betterthan 20000 times. However, there is an obvious misdetectionin the middle of the image (a1 and a2 in Figure 12(a)) andan obvious mismatch between the prediction and the markerbox. The detection result of YOLO-voc model is better thanYOLO 9000, and it detected the upper left target b1 wheniterating 10,000 times and the rear target b2 when iterating20,000 times. Compared with 10,000 times, the reinspectionphenomenon at the top left of the image (b3 in Figure 12(b))was improved when iterating 20,000 times. Based on ourexperimental results, we found that such misdetections maybe due to the insufficient number of vehicles passed at thesame time in free flow, leading to a fatal lack of trainingsamples. Although YOLO-vocRV can accurately detect thelower left corner vehicle c1 of blocking flow after 20000iterations, there are still a large misdetection of detectionresults in the entire sequence.
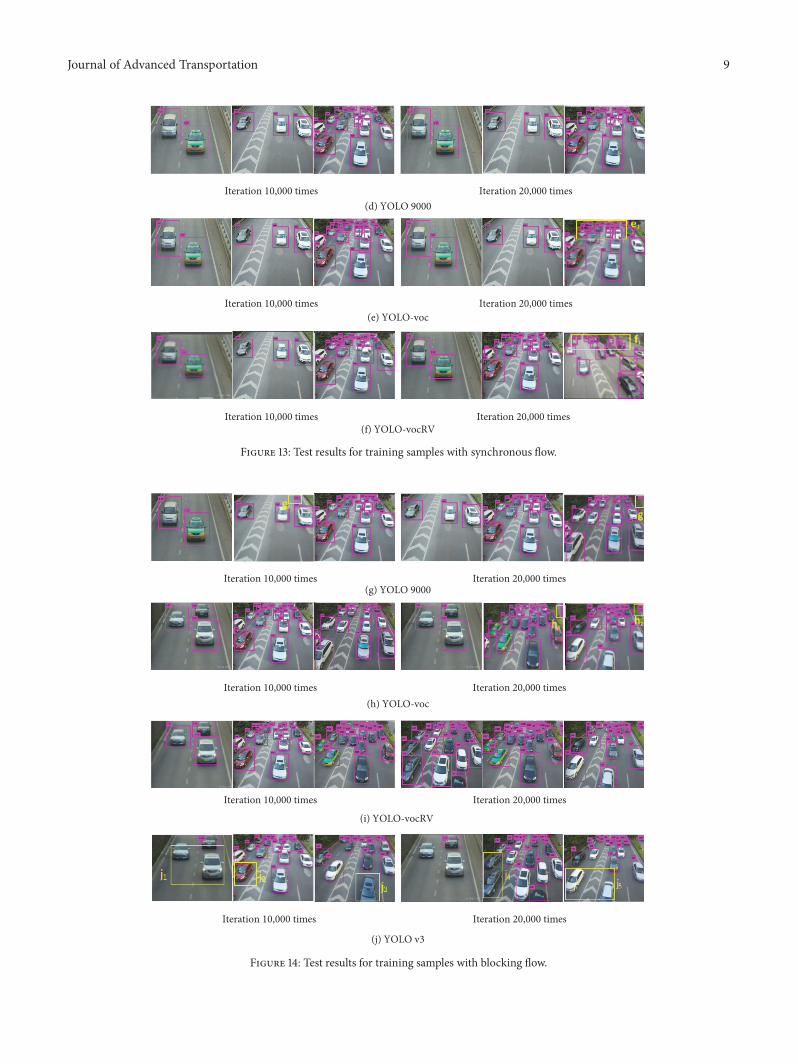
(2) Testing Analysis under the Condition of Synchronous FlowTraining. For the synchronous flow training samples, thetest results on of three models can obtain a better detectioneffect on free flow. For the overall test set detection resultsof YOLO 9000 model and YOLO-voc model, there are stilllarge error rate (see Section 4.2.3). YOLO-voc model hasmore reinspection in the distance (e1in Figure 13(e)). YOLO-vocRV model has better detection results compared with theprevious two models. When the blocking flows datasets areused as the testing targets, as shown in Figure 13(f), the whitevehicle group in the central can be detected correctly, and thetiny target (f1 in Figure 13(f)) is detected.
(3) Testing Analysis under Blocking Flow Training Conditions.When the blocking flow samples are used as training, YOLO9000, YOLO-voc, and YOLO-vocRV models can achievegood performance, so only the experimental results of syn-chronous and blocking flow are analyzed in this subsection.From Figure 14(g), it is shown that when the YOLO 9000model is used to iterate 10,000 times, the occurrence of falsedetection appears in the upper right (g1 in Figure 14(g)).And when the YOLO 9000 model is iterated 20,000 times,the occurrence of such problems can be solved and thesmall target in the upper right corner is detected (g2 inFigure 14(g)). Using YOLO-voc with 10000 times iteration,as shown in Figure 14(h), the small targets in the upperright corner (h1, h2 in Figure 14(h)) are missing, and theproblem can be solved with 20000 iterations, but the vehiclein the upper right corner (h1) is detected duplication. Underthe same situation, YOLO-vocRV with 10000 iterations hasthe same leak detection. But, by 20,000 iterations, the smalltargets are detected correctly in the upper right corner. In theadded YOLO v3 experiment, it is obvious that the detectionof small targets in the distance is well, but the near targets arenot be detected well (j1, j2, j3, j4, and j5 in Figure 14(j)).
According to detection results in Figures 12, 13, and14, we found free flow under the condition of the trainingsample, the training sample being relatively single, and thethree models that can not learn the features well with smalltargets in the distant, the moving vehicles with occlusion,and unclear target contours. Therefore, in the case of hightraffic flow density, our test shows more misdetection (a1,a2 in Figure 12(a)). Trained by synchronized flow, the corre-sponding performance has been improved, but there are still asmall amount of missing inspections and heavy reinspection
Journal of Advanced Transportation 9
Iteration 10,000 times Iteration 20,000 times
Iteration 10,000 times Iteration 20,000 times
Iteration 10,000 times Iteration 20,000 times
(d) YOLO 9000
(e) YOLO-voc
(f) YOLO-vocRV
Figure 13: Test results for training samples with synchronous flow.
Iteration 10,000 times Iteration 20,000 times
Iteration 10,000 times Iteration 20,000 times
Iteration 10,000 times Iteration 20,000 times
Iteration 10,000 times Iteration 20,000 times
(g) YOLO 9000
(h) YOLO-voc
(i) YOLO-vocRV
(j) YOLO v3
Figure 14: Test results for training samples with blocking flow.
10 Journal of Advanced Transportation
Table 2: Statistics of different model results for synchronous flow sample training.
frame sample YOLO 9000 YOLO-voc YOLO v3 YOLO-vocRV𝑅𝑑 𝑇𝑑 𝐹𝑝 𝑅𝑑 𝑇𝑑 𝐹𝑝 𝑅𝑑 𝑇𝑑 𝐹𝑝 𝑅𝑑 𝑇𝑑 𝐹𝑝free flow 225 221 0.9% 225 223 0.4% 225 - - 225 223 0.4%synchronous flow 547 500 5.2% 547 501 4.4% 547 - - 547 524 2.1%blocking flow 1050 940 5.5% 1050 925 6.3% 1050 - - 1050 921 6.5%
Table 3: Statistics of different model results for blocking flow sample training.
frame sample YOLO 9000 YOLO-voc YOLO v3 YOLO-vocRV𝑅𝑑 𝑇𝑑 𝐹𝑝 𝑅𝑑 𝑇𝑑 𝐹𝑝 𝑅𝑑 𝑇𝑑 𝐹𝑝 𝑅𝑑 𝑇𝑑 𝐹𝑝free flow 225 214 2.5% 225 222 0.7% 225 174 12.8% 225 219 1.4%synchronous flow 547 518 2.7% 547 479 6.6% 547 431 11.9% 547 523 2.2%blocking flow 1050 955 4.7% 1050 970 4.0% 1050 799 13.6% 1050 992 3.7%
phenomenon (e1 in Figure 13(e)) at the same time. Thereason is that the diversity of learning samples and trafficenvironment provided is not sufficient. Further increasing thecomplexity of the sample and using the blocking flow as atraining sample, the detection is obviously less missed (g2,h1, and h2 in Figure 14). The experimental results show thatthe detection effect of 20,000 iterations is improved comparedwith 10,000 times, and YOLO-vocRV has better detectionperformance compared with the other three models.
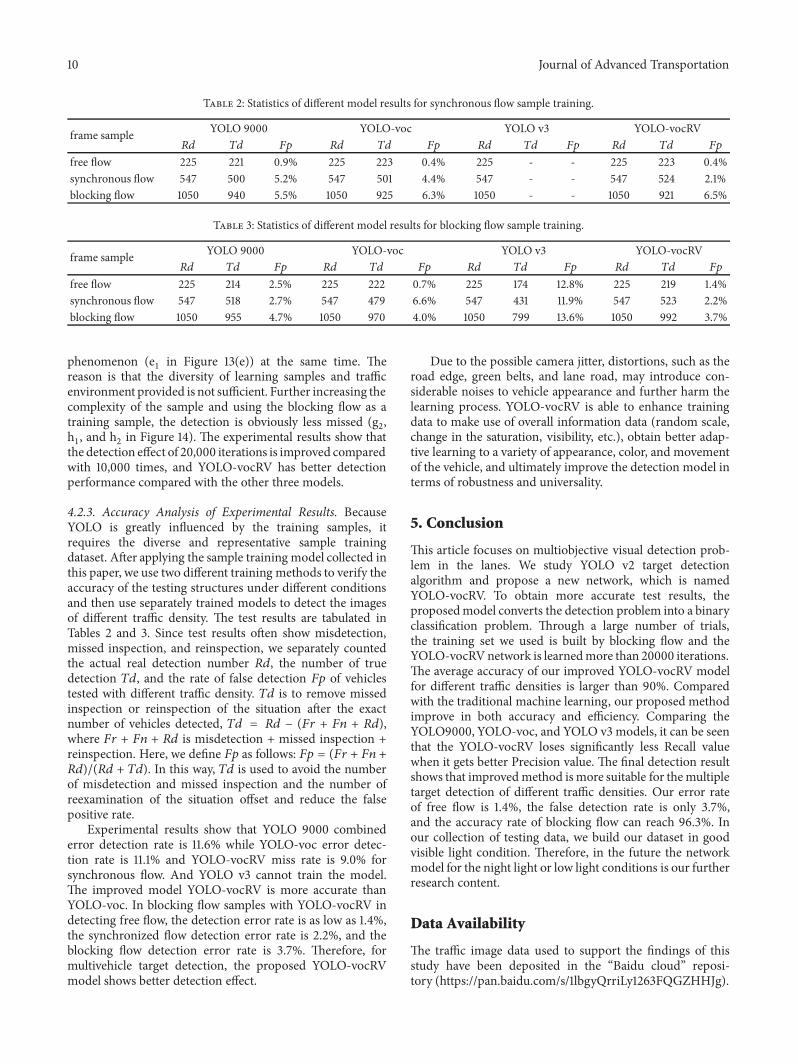
4.2.3. Accuracy Analysis of Experimental Results. BecauseYOLO is greatly influenced by the training samples, itrequires the diverse and representative sample trainingdataset. After applying the sample training model collected inthis paper, we use two different training methods to verify theaccuracy of the testing structures under different conditionsand then use separately trained models to detect the imagesof different traffic density. The test results are tabulated inTables 2 and 3. Since test results often show misdetection,missed inspection, and reinspection, we separately countedthe actual real detection number 𝑅𝑑, the number of truedetection 𝑇𝑑, and the rate of false detection 𝐹𝑝 of vehiclestested with different traffic density. 𝑇𝑑 is to remove missedinspection or reinspection of the situation after the exactnumber of vehicles detected, 𝑇𝑑 = 𝑅𝑑 − (𝐹𝑟 + 𝐹𝑛 + 𝑅𝑑),where 𝐹𝑟 + 𝐹𝑛 + 𝑅𝑑 is misdetection + missed inspection +reinspection. Here, we define 𝐹𝑝 as follows: 𝐹𝑝 = (𝐹𝑟 + 𝐹𝑛 +𝑅𝑑)/(𝑅𝑑 + 𝑇𝑑). In this way, 𝑇𝑑 is used to avoid the numberof misdetection and missed inspection and the number ofreexamination of the situation offset and reduce the falsepositive rate.
Experimental results show that YOLO 9000 combinederror detection rate is 11.6% while YOLO-voc error detec-tion rate is 11.1% and YOLO-vocRV miss rate is 9.0% forsynchronous flow. And YOLO v3 cannot train the model.The improved model YOLO-vocRV is more accurate thanYOLO-voc. In blocking flow samples with YOLO-vocRV indetecting free flow, the detection error rate is as low as 1.4%,the synchronized flow detection error rate is 2.2%, and theblocking flow detection error rate is 3.7%. Therefore, formultivehicle target detection, the proposed YOLO-vocRVmodel shows better detection effect.
Due to the possible camera jitter, distortions, such as theroad edge, green belts, and lane road, may introduce con-siderable noises to vehicle appearance and further harm thelearning process. YOLO-vocRV is able to enhance trainingdata to make use of overall information data (random scale,change in the saturation, visibility, etc.), obtain better adap-tive learning to a variety of appearance, color, and movementof the vehicle, and ultimately improve the detection model interms of robustness and universality.
5. Conclusion
This article focuses on multiobjective visual detection prob-lem in the lanes. We study YOLO v2 target detectionalgorithm and propose a new network, which is namedYOLO-vocRV. To obtain more accurate test results, theproposedmodel converts the detection problem into a binaryclassification problem. Through a large number of trials,the training set we used is built by blocking flow and theYOLO-vocRVnetwork is learnedmore than 20000 iterations.The average accuracy of our improved YOLO-vocRV modelfor different traffic densities is larger than 90%. Comparedwith the traditional machine learning, our proposed methodimprove in both accuracy and efficiency. Comparing theYOLO9000, YOLO-voc, and YOLO v3 models, it can be seenthat the YOLO-vocRV loses significantly less Recall valuewhen it gets better Precision value. The final detection resultshows that improvedmethod ismore suitable for themultipletarget detection of different traffic densities. Our error rateof free flow is 1.4%, the false detection rate is only 3.7%,and the accuracy rate of blocking flow can reach 96.3%. Inour collection of testing data, we build our dataset in goodvisible light condition. Therefore, in the future the networkmodel for the night light or low light conditions is our furtherresearch content.
Data Availability
The traffic image data used to support the findings of thisstudy have been deposited in the “Baidu cloud” reposi-tory (https://pan.baidu.com/s/1lbgyQrriLy1263FQGZHHJg).
Journal of Advanced Transportation 11
The Python Code used to support the findings of thisstudy has been deposited in the “Baidu cloud” reposi-tory (https://pan.baidu.com/s/1lbgyQrriLy1263FQGZHHJg).All the information of this paper is free; it can be found inhttps://fairsharing.org with “databases > biodbcore-001087”.If more detailed information was needed, everyone can sendemail to the corresponding author upon request.
Conflicts of Interest
The authors declare that they have no conflicts of interest.
Acknowledgments
This work was supported in part by Dr. Startup funds of Xi’anPolytechnic University (no. BS1507) and the Natural ScienceBasic Research Plan (Surface Project) in Shaanxi Province ofChina under Grant no. 2018JM6089.
References
[1] Z. Na, Y. Jia-bin, and X. Han, “Surver on inteligent transporta-tion system,” Computer Science, vol. 41, no. 11, pp. 7–11, 2014.
[2] Z. Wen-gui, Research on Vehicle Detection Method Based onDeep Learning, South Chain University of Technology, 2016.
[3] D. M. Gavrila and V. Philomin, “Real-time object detection for‘smart’ vehicles,” in Proceedings of the 7th IEEE InternationalConference on Computer Vision (ICCV ’99), pp. 87–93, Septem-ber 1999.
[4] Y. Taigman,M. Yang, M. Ranzato, and L.Wolf, “DeepFace: clos-ing the gap to human-level performance in face verification,” inProceedings of the 27th IEEEConference onComputer Vision andPattern Recognition (CVPR ’14), pp. 1701–1708, June 2014.
[5] W. Liu, C.-W. Duan, B. Yu, L.-Y. Chai, H. Yuan, and H. Zhao,“Multi-pose pedestrian detection based on posterior HOGfeature,”Acta Electronica Sinica, vol. 43, no. 2, pp. 217–224, 2015.
[6] M. Xiaoxu andW. E. L. Grimson, “Edge-based rich representa-tion for vehicle classification,” in Proceedings of the Tenth IEEEInternational Conference on Computer Vision (ICCV ’05), pp.1185–1192, IEEE Press, Beijing, China, October 2005.
[7] T. Ahonen, A. Hadid, and M. Pietikainen, “Face descriptionwith local binary patterns: application to face recognition,” IEEETransactions on Pattern Analysis and Machine Intelligence, vol.28, no. 12, pp. 2037–2041, 2006.
[8] X. Feng and Y. Fei, “Microbus identifying of surveillance videobased on HOG and SVM,” Microcomputer & Its Applications,vol. 32, no. 17, pp. 34–37, 2013.
[9] Y. Freund and R. E. Schapire, “A decision-theoretic general-ization of on-line learning and an application to boosting,” inProceedings of the Computational Learning Theory, pp. 23–27,IEEE Press, 2014.
[10] F. Ya-qin, W. Bing-hao, W. Wei et al., “Deep learning domesticresearch were reviewed,”Distance Education in China, 2015.
[11] Y. LeCun, Y. Bengio, and G. Hinton, “Deep learning,” Nature,vol. 521, no. 7553, pp. 436–444, 2015.
[12] C. Szegedy,A.Toshev, andD.Erhan, “DeepNeuralNetworks forobject detection,” in Proceedings of the 27th Annual Conferenceon Neural Information Processing Systems (NIPS ’13), pp. 1673–1675, NIPS Press, December 2013.
[13] R. Girshick, J. Donahue, T. Darrell, and J. Malik, “Rich featurehierarchies for accurate object detection and semantic seg-mentation,” in Proceedings of the Image Net Large-Scale VisualRecognition Challenge Workshop, pp. 10–15, ICCV Press, 2013.
[14] K. He, X. Zhang, S. Ren, and J. Sun, “Spatial pyramid poolingin deep convolutional networks for visual recognition,” in Pro-ceedings of the 14th European Conference on Computer Vision,pp. 865–973, ECCV Press, 2014.
[15] R. Girshick, “Fast R-CNN,” in Proceedings of the 15th IEEEInternational Conference on Computer Vision (ICCV ’15), pp.1440–1448, December 2015.
[16] S. Ren, K. He, R. Girshick et al., “Faster R-CNN: towardsreal-time object detection with region proposal networks,” inProceedings of the Conference on Neural Information ProcessingSystems, pp. 1–15, NIPS Press, 2015.
[17] J. Redmon, S. Divvala, R. Girshick, and A. Farhadi, “You onlylook once: Unified, real-time object detection,” in Proceedingsof the Conference on Computer Vision and Pattern Recognition,pp. 779–788, CVPR Press, July 2016.
[18] S. Huan-sheng, Z. Xiang-qing, Z. Bao-feng et al., “Vehicledetection based on deep learning in complex scene,”ApplicationResearch of Computers, 2018.
[19] P. Felzenszwalb F, R. Girshick B, D. Mc Allester et al., “Objectdetection with discriminatively trained part-based models,” inProceedings of the IEEE Transactions on Pattern Analysis andMachine Intelligence, pp. 201–205, TPAMI Press, 2010.
[20] X. Li, Z. Zhao, L. Liu, Y. Liu, and P. Li, “An optimizationmodel of multi-intersection signal control for trunk roadunder collaborative information,” Journal of Control Science andEngineering, vol. 2017, Article ID 2846987, 11 pages, 2017.

International Journal of
AerospaceEngineeringHindawiwww.hindawi.com Volume 2018
RoboticsJournal of
Hindawiwww.hindawi.com Volume 2018
Hindawiwww.hindawi.com Volume 2018
Active and Passive Electronic Components
VLSI Design
Hindawiwww.hindawi.com Volume 2018
Hindawiwww.hindawi.com Volume 2018
Shock and Vibration
Hindawiwww.hindawi.com Volume 2018
Civil EngineeringAdvances in
Acoustics and VibrationAdvances in
Hindawiwww.hindawi.com Volume 2018
Hindawiwww.hindawi.com Volume 2018
Electrical and Computer Engineering
Journal of
Advances inOptoElectronics
Hindawiwww.hindawi.com
Volume 2018
Hindawi Publishing Corporation http://www.hindawi.com Volume 2013Hindawiwww.hindawi.com
The Scientific World Journal
Volume 2018
Control Scienceand Engineering
Journal of
Hindawiwww.hindawi.com Volume 2018
Hindawiwww.hindawi.com
Journal ofEngineeringVolume 2018
SensorsJournal of
Hindawiwww.hindawi.com Volume 2018
International Journal of
RotatingMachinery
Hindawiwww.hindawi.com Volume 2018
Modelling &Simulationin EngineeringHindawiwww.hindawi.com Volume 2018
Hindawiwww.hindawi.com Volume 2018
Chemical EngineeringInternational Journal of Antennas and
Propagation
International Journal of
Hindawiwww.hindawi.com Volume 2018
Hindawiwww.hindawi.com Volume 2018
Navigation and Observation
International Journal of
Hindawi
www.hindawi.com Volume 2018
Advances in
Multimedia
Submit your manuscripts atwww.hindawi.com